Economic Instruments for Obesity Prevention: Results … · human welfare depends on multiple...
39
1 DEPARTMENT OF ECONOMICS ISSN 1441-5429 DISCUSSION PAPER 31/11 Economic Instruments for Obesity Prevention: Results of a Scoping Review and Modified Delphi Survey Guy E.J. Faulkner1 § , Paul Grootendorst 2 , Van Hai Nguyen 2 , Tatiana Andreyeva 3 , Kelly Arbour-Nicitopoulos 1 , Chris Auld 4 , Sean B. Cash 5 , John Cawley 6 , Peter Donnelly 1 , Adam Drewnowski 7 , Laurette Dubé 8 , Roberta Ferrence 9 , Ian Janssen 10 , Jeffrey LaFrance 11 , Darius Lakdawalla 12 , Rena Mendelsen 13 , Lisa Powell 14 , W. Bruce Traill 15 , and Frank Windmeijer 16 Abstract Background Comprehensive, multi-level approaches are required to address obesity. One important target for intervention is the economic domain. The purpose of this study was to synthesize existing evidence regarding the impact of economic policies targeting obesity and its causal behaviours (diet, physical activity), and to make specific recommendations for the Canadian context. Methods Arksey and O’Malley’s (2005) methodological framework for conducting scoping reviews was adopted for this study and this consisted of two phases: 1) a structured literature search and review, and 2) consultation with experts in the research field through a Delphi survey and an in-person expert panel meeting in April 2010. Results Two key findings from the scoping review included 1) consistent evidence that weight outcomes respond to food and beverage prices. The debate on the use of food taxes and subsidies to address obesity should now shift to how best to address practical issues in designing such policies; and 2) very few studies have examined the impact of economic instruments to promote physical activity and clear policy recommendations cannot be made at this time. Delphi survey findings emphasised the relatively modest impact any specific economic instrument would have on obesity independently. Based on empirical evidence and expert opinion, three recommendations were supported. First, to create and implementing an effective health filter to review new and current agricultural polices to reduce the possibility that such policies have a deleterious impact on population rates of obesity. Second, to implement a caloric sweetened beverage tax. Third, to examine how to implement fruit and vegetable subsidies targeted at children and low income households.
Transcript of Economic Instruments for Obesity Prevention: Results … · human welfare depends on multiple...
1
DEPARTMENT OF ECONOMICS
ISSN 1441-5429
DISCUSSION PAPER 31/11
Economic Instruments for Obesity Prevention: Results of a
Scoping Review and Modified Delphi Survey
Guy E.J. Faulkner1§, Paul Grootendorst
2, Van Hai Nguyen
2, Tatiana Andreyeva
3, Kelly
Arbour-Nicitopoulos1, Chris Auld
4, Sean B. Cash
5, John Cawley
6, Peter Donnelly
1, Adam
Drewnowski7, Laurette Dubé
8, Roberta Ferrence
9, Ian Janssen
10, Jeffrey LaFrance
11, Darius
Lakdawalla12
, Rena Mendelsen13
, Lisa Powell14
, W. Bruce Traill15
, and Frank Windmeijer16
Abstract Background
Comprehensive, multi-level approaches are required to address obesity. One
important target for intervention is the economic domain. The purpose of this study
was to synthesize existing evidence regarding the impact of economic policies
targeting obesity and its causal behaviours (diet, physical activity), and to make
specific recommendations for the Canadian context. Methods
Arksey and O’Malley’s (2005) methodological framework for conducting scoping
reviews was adopted for this study and this consisted of two phases: 1) a structured
literature search and review, and 2) consultation with experts in the research field
through a Delphi survey and an in-person expert panel meeting in April 2010. Results
Two key findings from the scoping review included 1) consistent evidence that weight
outcomes respond to food and beverage prices. The debate on the use of food taxes
and subsidies to address obesity should now shift to how best to address practical
issues in designing such policies; and 2) very few studies have examined the impact
of economic instruments to promote physical activity and clear policy
recommendations cannot be made at this time. Delphi survey findings emphasised the
relatively modest impact any specific economic instrument would have on obesity
independently. Based on empirical evidence and expert opinion, three
recommendations were supported. First, to create and implementing an effective
health filter to review new and current agricultural polices to reduce the possibility
that such policies have a deleterious impact on population rates of obesity. Second, to
implement a caloric sweetened beverage tax. Third, to examine how to implement
fruit and vegetable subsidies targeted at children and low income households.
2
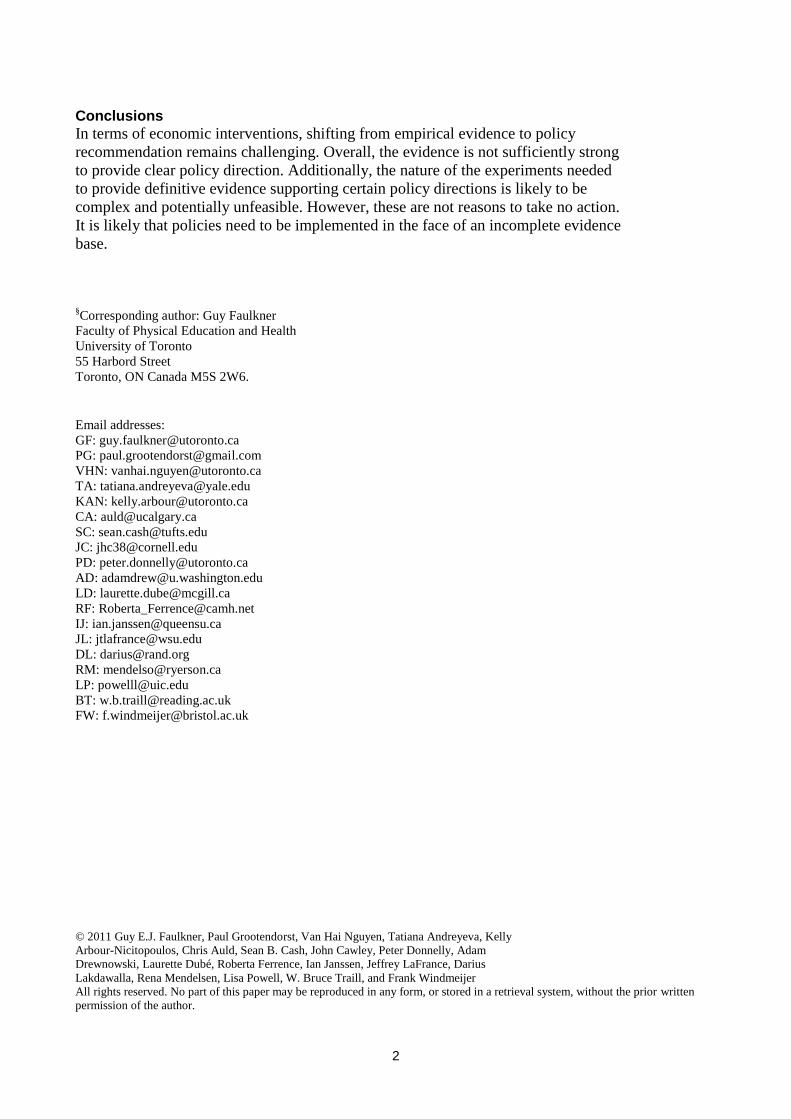
Conclusions
In terms of economic interventions, shifting from empirical evidence to policy
recommendation remains challenging. Overall, the evidence is not sufficiently strong
to provide clear policy direction. Additionally, the nature of the experiments needed
to provide definitive evidence supporting certain policy directions is likely to be
complex and potentially unfeasible. However, these are not reasons to take no action.
It is likely that policies need to be implemented in the face of an incomplete evidence
base.
§Corresponding author: Guy Faulkner
Faculty of Physical Education and Health
University of Toronto
55 Harbord Street
Toronto, ON Canada M5S 2W6.
Email addresses:
VHN: [email protected]
KAN: [email protected]
© 2011 Guy E.J. Faulkner, Paul Grootendorst, Van Hai Nguyen, Tatiana Andreyeva, Kelly
Arbour-Nicitopoulos, Chris Auld, Sean B. Cash, John Cawley, Peter Donnelly, Adam
Drewnowski, Laurette Dubé, Roberta Ferrence, Ian Janssen, Jeffrey LaFrance, Darius
Lakdawalla, Rena Mendelsen, Lisa Powell, W. Bruce Traill, and Frank Windmeijer
All rights reserved. No part of this paper may be reproduced in any form, or stored in a retrieval system, without the prior written
permission of the author.
- 4 -
Background
The causes of overweight and obesity, and the potential solutions to prevent
and reduce obesity prevalence are complex. We live in an obesogenic environment
that increasingly promotes a high energy intake and sedentary behaviour [1]. No
single strategy will solve this health problem. Social-ecological theory emphasizes
that physical activity and dietary behaviours are influenced by factors across multiple
domains including the individual, social, physical and policy spheres. Accordingly,
comprehensive, multi-level approaches are required to address obesity. One important
target for intervention is the economic domain.
Standard economic theory hypothesizes that individuals make decisions to
make themselves as well off as possible. In other words, individuals attempt to satisfy
objectives subject to constraints. Both objectives and constraints are germane to diet
and physical activity choices [2]. On the objectives side, economics emphasizes that
human welfare depends on multiple factors, and individuals make trade-offs between
them. If health were the only goal, then there likely would be little obesity and
individuals would spend all of their time and money on health-enhancing activities.
Clearly this is not the case. Obesity, then, could be the result of the trade-off that
individuals make between health and other desired goods, such as the consumption of
calorie-rich food and beverages, in order to maximize self-perceived welfare. While
preferences are certainly relevant, they alone cannot explain the dramatic increase in
obesity prevalence over the last several decades – it seems unlikely that preferences
for calorie-rich food or physical activity have changed so suddenly. What have
changed are time, budget constraints, and the available technology. Changes in diet
and activity might then be interpreted as optimizing responses to changes in these

- 5 -
constraints. In particular, the total (money plus time) price of consuming calorically
dense food and beverages has declined and this has at once reduced the price of
calories and increased purchasing power. At the same time, higher wage rates and
longer hours spent in sedentary employment have made physical activity more
expensive. Standard economic theory predicts that these price changes would
rationally lead individuals to increase caloric intake and reduce caloric expenditure.
An important implication is that, changing prices of calorie dense, unhealthy foods
relative to that of low-energy, healthy foods, or altering the cost of physical activity
relative to that of sedentary alternatives may lead to changes in diet and physical
activity.
While taxes and subsidies are obvious candidates for a government to use to
change relative prices, the basis for the government to intervene on obesity is less so.
Early rationale for government intervention in obesity focuses on the negative externality
of obesity, which argues that obesity results in large health care costs and these costs are
borne collectively, so that obesity imposes financial externalities on those who are not
obese. While this argument has some merit, there are limitations. While the obese likely
incur higher health care costs than the non-obese at any given age, they also have shorter
lifespans (Lawlor et al., 2006). Hence the obese might have lower total lifetime healthcare
costs than the non-obese.
Recent justification for government intervention rests upon insights from
behavioural economics. This literature suggests that the self-control problem could be
grounds for government intervention. These economists think of individuals as having
two ‘selves’: a relatively myopic ‘today’s’ self – which is the one that makes diet and
exercise decisions – and a relatively far-sighted ‘future’ self, which lives with the health
consequences. There is sometimes a conflict between the two selves: Today’s self may
not adequately take into account future self’s welfare and succumb to the temptations of

- 6 -
calorie rich foods and sedentary lifestyles. The theory suggests that individuals who
recognize this dilemma – ‘sophisticates’ – will use self-commitment devices (e.g., diets,
fitness club memberships) to make today’s self account for the consequences of their
decisions on their future selves. Excise taxation of unhealthy foods or physical activity
subsidies can be thought of as a commitment devise to improve the ‘future-selves’
welfare of non-sophisticates (Gruber & Kozegi, 2004; O'Donoghue& Rabin, 2006).
It is worth noting that taxes and subsidies are not free tools. The public finance
literature documents a number of costs associated with the use of these tools. First,
consumers in the absence of taxes are maximising their utility. Taxes might distort
their choice and break this optimality and thus reduce consumer welfare and create a
deadweight loss. How large is this deadweight loss depends on elasticity of supply
and demand for a good. Second, there are labor and administrative costs required to
implementing the tax or subsidy policies. Third, there may be also budgetary costs,
especially in the case of subsidies. For example, policies that reward desired
behaviours, such as subsidies to physical activity, will create windfall gains to those who
already engage in the desired behaviour. This may make the policy a costly way to
change relatively few individuals’ behaviour.
Economic theory also informs us on potential challenges in applying the taxes
and subsidies to change individuals’ behaviours. First, in response to price changes,
individuals may substitute lower priced goods for higher priced ones. This is the
substitution effect. To illustrate, suppose that government decides to apply a special tax
on cola. Individuals might then substitute root beer or other kinds of sodas for cola. If
governments tax all sodas, then individuals might switch to sugar added sports drinks. As
a result of these potential substitutions, the weight of individual can remain unchanged.
Second, taxes increase the prices, which in turn reduce the purchasing power of one’s
income. The reductions in purchasing power can affect diet and exercise choices in the

- 7 -
way that can mute the effectiveness of tax policies in controlling weight. For example, if
people spend a lot of their budget on unhealthy food and the government imposes an
excise tax on these foods, people respond by reducing, but not eliminating, their
consumption of these foods. This reduces their purchasing power. In response, individuals
reduce their consumption of relatively expensive fruits and vegetables and other healthy
foods, and consequently, lead to little change in his weight.
The successful public health strategy of using tobacco taxation to reduce
smoking presents a strong case for considering a similar approach in the context of
obesity. Tobacco taxation has been recognized internationally as one of the most
effective population-based strategies for decreasing smoking prevalence and
consumption and the adverse health consequences [3]. Historically, the effectiveness
of taxation as a tobacco control measure has been evaluated in the context of price
elasticity of demand, the extent to which the consumption of a product (cigarettes)
falls or rises after a change in its price. Recent research estimates that, in high income
countries, a 10% increase in cigarette prices results in a 3% to 5% decrease in demand
for cigarettes among adults [4]. While price elasticity estimates are comparable
among high income countries [5], the impact of taxation appears to be greater in low
and middle income countries, where smoking rates are generally higher and tobacco
control policies weaker [6].
Existing reviews examining the effects of economic incentives or
disincentives on food consumption, physical activity and/or obesity, including a
recent brief Canadian parliamentary report [7], conclude that little is known about the
impact of various economic instruments on healthy eating and physical activity or on
their effectiveness in preventing and controlling obesity in general, or that the impact
will be modest [8,9,10,11]. However, despite an incomplete evidence base, policy
makers still need to select and implement interventions that may have a significant
- 8 -
population health impact. Given that the current situation is described as ‘a cacophony
of policy in which different analyses and policy solutions have been developed and
proffered, each clamouring for support, funding and adoption’[12], there is clearly an
urgent need for clear and solid evidence to emerge and be synthesized to guide policy
decisions.
The purpose of this project was to synthesize existing evidence regarding the
impact of economic policies targeting obesity and its causal behaviours (diet, physical
activity), and to make specific recommendations for the Canadian context. To achieve
this, we adopted Arksey and O’Malley’s [13] methodological framework for
conducting scoping reviews. Scoping reviews are distinct from systematic reviews in
that a) they often address broad topics where a variety of study designs and secondary
topics may be relevant, b) they are less likely to formally assess the quality of
included studies or use study quality criteria to guide the synthesis of data, and c) they
are used to identify parameters around a body of literature, and to identify gaps in the
existing body of research. This study’s scoping review consisted of two main phases:
1) a structured literature search and review, and 2) consultation with experts in the
research field through a Delphi survey and workshop. The former phase focuses on
selecting and reviewing empirical studies that look at weight outcome and use
population level survey data. Given that our interest is in the application of
population-level intervention such as taxes and subsidies and given the concern about
the substitution effects (discussed earlier), we believe that the evidence from studies
of this type are the most relevant. Our study selection thus distinguishes our review
from recent reviews such as that of Thow and colleagues (2010) which covered both
empirical and simulation studies that estimated the effects of subsidies and taxes on
specific food products on consumption, body weight and chronic conditions. As a

- 9 -
point of comparison, Thow et al. (2010) included a total of 24 studies but only 6 of
these investigated body weight using population survey data, while our review
assesses 20 studies of this type. This latter expert consultation phase was a critical
component of the review. As the study of economic interventions for obesity is a
relatively nascent area of inquiry, much of the knowledge may not appear in the
published or grey literature. Soliciting input from experts regarding an incomplete
body of evidence was deemed a necessary step.
Structured Literature Search and Review
The search strategy was designed in consultation with an information coordinator
from the Ontario Tobacco Research Unit (OTRU). Detailed and extensive searches
were conducted on Medline, PsycInfo, PubMed, Econlit, Policyfile, Pais
International, OVID, Web of Science, Cochrane Reviews and Google Scholar from
September to December 2009. Searches were also performed on a range of grey
literature sources including NBER, U.S. Department of Agriculture (USDA)’s
Economic Research Service, AgEcon Search, and other governmental agency
websites. Search term combinations were used to identify relevant studies in the
nutrition domain: ‘overweight, fat, diet, nutrition, caloric, weight, obesity, BMI,
consumption, demand, intake’ with ‘taxes, subsidy, intervention, economic policy,
transfer program, income support, WIC, food stamp, cash transfer, agriculture
subsidies, farm policy’. Reviews were done of retrieved primary and review article
reference lists (including those from previously published systematic reviews); hand
searches of key nutrition and health economics journals (to December, 2009), and;
expert panel members were asked to review the final reference list for completeness.
In May 2010, an updated literature search was completed that focused from December
2009 to May 2010.
- 10 -
This comprehensive search resulted in 1198 potentially relevant studies. The
initial screening identified 379 studies that employed empirical analysis. Next, studies
were selected that focused on financial measures such as prices, subsidies, taxes or
income transfer programs as the central intervention. Given the availability of an
existing comprehensive review [14] and limited time, we excluded studies that
focused on the effects of food prices on food consumption and demand. Instead,
studies that explicitly focused on weight outcomes (such as obesity and body mass
index), physical activity or caloric intake were assessed. Finally, the review focused
solely on observational or randomized controlled trial (RCT) studies that estimated
behavioural responses and hence, excluded simulation studies. These requirements
further reduced the number of studies reviewed to 38 (see Figure 1) which included
20 studies assessing tax or food subsidies, 4 studies assessing agricultural policies and
subsidies, 4 studies assessing physical activity outcomes (tax credits, gas prices, road
congestion taxes), and 10 studies assessing targeted income transfer programs. In
addition to these empirical studies, we identified 7 relevant reviews. Data from each
empirical study was abstracted (e.g., authors, study location, year of publication)
including some analytical detail such as design and key findings. Next, the abstracted
information was collated and summarized in chart form.

- 11 -
Expert Panel
To supplement the literature review, an expert panel was convened to contribute input
to the literature search strategy, identification of grey literature, and then to assess the
strengths and limitations of different economic approaches with a view to proposing
specific recommendations for the Canadian context. Expert consultation is an
increasingly acceptable source for gathering evidence about a topic particularly when
the extant literature is weak [15]. Panel members were identified through an initial
literature search for researchers prominent in the field of economics and obesity. Each
panel member was also asked to nominate others who should be on the panel. We
sought to recruit a varied panel of experts who had published in the area of economic
instruments and obesity and were familiar with the literature concerning a broad range
of economic instruments. The primary inclusion criteria included publications on
economic interventions or consequences of obesity as indicative of specialist

- 12 -
knowledge. Turoff (2002) recommends panels between 1- and 50. Based on project
time lines and cost considerations, we recruited 12 experts from Europe (n=2),
Canada (n=3) and the United States (n = 7).
We adopted a Delphi survey approach in consulting with the experts. The
Delphi survey is a mixed-method research approach, designed for exploring the range
of opinions, and exploring (or achieving) consensus on a specific topic. The technique
is considered particularly useful in areas of limited research or in areas where there is
controversy, debate or lack of clarity [16]. The Delphi has been successfully applied
to a range of issues, including views on the most suitable monetary incentives on food
to stimulate healthy eating [17]. A four-round conference style format was applied in
the current project to examine economic instruments for addressing obesity. During
round one, telephone calls were conducted with all panel members to identify
potential economic instruments and to confirm the project’s literature search strategy.
Based on these discussions and the reviewed literature, a survey was created that
listed the most commonly reported economic instruments (see Table 1). In round two,
this survey was sent to all participants with the request to rate each instrument in
terms of its potential impact on obesity, consumption, its cost-effectiveness, potential
for unintended benefits or harm, equitability, and political feasibility (see Cawley,
2004). Experts were then asked to return their responses to a nominated facilitator
external to the Delphi process. Respondent names were removed, replaced with a
number and then forwarded to the first author. During the third round, questionnaires
were returned to each individual expert, containing a summary of their score for each
item, along with the score for the group as a whole. Panel members were invited to
review their individual ratings against these group means, and resubmit their
responses with changed or unchanged scores. Final responses were returned to the

- 13 -
facilitator and forwarded to the lead expert. Group means were calculated for each
item and then ranked according to their score within each of the major type of
economic instrument. This ranking represented the group’s consensus, and was
distributed via email to the expert panel with summary statistics purposely timed to
precede a 1.5 day long in-person panel meeting held in Toronto. At this meeting,
panel member opinions and views on their Delphi rankings and attendant
recommended policies were solicited.
Results
Delphi Survey Results
Table 1 presents the findings of the final Delphi survey completed before the panel
meeting. First, all economic instruments were rated as having a relatively modest
impact, if any, on obesity. Economic instruments targeting consumption were rated
higher than those targeting physical activity. Of the instruments, changing agricultural
subsidies was rated as having the highest potential impact on obesity but also the
lowest in terms of feasibility. Food taxes were rated second highest in terms of
obesity impact but also scored highest in terms of potential for unintended harm and
being inequitable. Fruit and vegetable subsidies and beverage taxes were rated
similarly in terms of potential impact on consumption and obesity but differed in
terms of potential for unintended benefit and cost-effectiveness.
The panel meeting discussions largely were in line with these survey findings
and concentrated on three broad considerations: 1) reviewing agricultural policy and
subsidies; 2) implementing a tax on caloric sweetened beverages; and 3) examining
how fruit and vegetable subsidies can be targeted. Attention now turns to discussing
each of these after a brief overview of the research evidence. The consideration of
food taxes, income transfers, and economic instruments for promoting physical

- 14 -
activity is briefly noted.
Reviewing Agricultural Policy and Subsidies
Evidence
Several authors and commentators [18,19,20,21] have taken the strong correlation
between increased farm subsidies and the rise in obesity rates in the US since the
1970s as evidence that they are causally related. They argue that these subsidies have
reduced the prices of soybeans, corn and other farm commodities. These subsidized
commodities – which are cheap sources of sugar and fat for processed foods – have
lowered the price of processed foods. The lower prices of these processed foods in
turn have contributed to their over-consumption, which has contributed to the increase
in obesity. Additionally, subsidies can provide incentives for technological
innovations which have increased the availability of ingredients such as corn-based
sweeteners.
Several empirical studies have challenged the claim that farm subsidies have
increased rates of obesity. Miller and Coble [22] investigated whether farm subsidies
make retail food products in the US more affordable using annual time series data
from Economic Research Service of USDA for the period 1961-2002. The
affordability of food, their outcome variable, is captured by the proportion of
disposable income spent on food while farm subsidies are measured by direct
payments to farmers. In addition to farm-to-retail price spread and consumer income,
their model also includes agriculture’s total factor productivity (TFP) to shed light on
the effect of changes in technology on food affordability. They estimated this
regression in the aggregate as well as across 6 specific food groups. The results
indicated that direct payment impact on food affordability was not statistically
significant. In contrast, the positive and statistically significant TFP implies that

- 15 -
advances in agriculture technology have increased the affordability of foods.
Furthermore, these results are consistent across food groups. These findings [22]
provide empirical evidence that cheap food prices are mainly caused by increases in
agricultural efficiency, perhaps enhanced by public R&D subsidies, over the last
several decades rather than by farm subsidies.
Beghin and Jensen [23] used historical data to examine whether US farm
policies for sweetener crops have affected the consumption and composition of
sweeteners in the US diet. The data showed that commodity programs have raised the
price of cane sugar and decreased the price of corn. At the same time, agricultural
R&D expenditure lowered the cost of corn more than that of sugar. Thus high fructose
corn syrup became an inexpensive substitute for sugar in food and beverages.
However, they emphasize that the effect of policy on ingredient prices has become
less important over time, with the current farm value share in sweetened food being
below 5%. They also noted that increased consumption of sweetened foods and
beverages are observed in other countries which have different or no commodity
programs.
Alston and colleagues [24] examined US and international data to shed light on
the impact of farm subsidies on commodity prices and of commodity prices on food
retail prices. They found that farm subsidies have had very modest (and mixed)
effects on the total availability and prices of farm commodities that are the most
important ingredients in more-fattening foods. Second, such small commodity price
impacts would imply very small effects on costs of food at retail, which, even if fully
passed on to consumers, would mean very small changes in prices faced by
consumers.
Additional evidence suggests that agricultural R&D subsidies contribute to high

- 16 -
productivity and thus reduce the prices of commodities. Alston et al. [25] studied the
contributions of US public agricultural research and extension investments over 1890-
2002 to state-specific agricultural productivity for the period 1949-2002. They found
that both state and federal agricultural R&D investment yielded high returns.
Specifically, a one dollar increment in investments in agricultural research and
extension by 48 U.S. states generated own-state benefits of between $2 and $58 and
averaged $21 across the states. They suggested that the returns would be even higher
if the spill-over effects across the states were taken into account (between $10 and
$70 per research dollar across the states, with an average of $32).
Panel Conclusions
Panelists agreed that agricultural support policies were influential in the rise in
rates of overweight and obesity. However, panelists conceded that there is no strong
empirical evidence linking agricultural support policies to the growth in obesity.
Nevertheless, panelists felt strongly that the lack of evidence was a result of the
complex causal pathway and considerable time lags between policy changes and
resulting changes in population levels of obesity. While panel members felt that
modifying agricultural policies would have the biggest impact on reducing obesity,
such modification also scored the lowest for feasibility. Limiting or eliminating farm
subsidies to commodity farmers is unlikely to rapidly change a complex agricultural
system that has evolved over decades. More attention could be directed toward the
impact of agricultural R&D supports which may have over time lowered cost of
added sugars and fats derived from corn, soy, potatoes and other farm commodities.
In turn, these added sugars and fats have found their way into much processed food. It
was also suggested that subsidies may have an impact on food formulation rather than
just price alone. Holding consumer food price equal, a subsidy that (for example)
- 17 -
increases the affordability of sweeteners could lead to undesirable dietary outcomes
without affecting product price.
Agricultural subsidy-specific recommendations included:
a) Create and implement an effective health filter to review new and current
agricultural polices to reduce the likelihood that such policies have a
deleterious impact on population rates of obesity. Specifically, an agricultural
support policy should become secondary to a food and health policy.
b) Restructure R&D investment and subsidies to promote increased development
of fruit and vegetable production and distribution. Measures to raise domestic
supply of fruits and vegetables can also be complemented by lowering tariffs
on imported fruits and vegetables.
c) Develop transportation and subsidized revenue insurance policies to assist
farmers who grow fruits and vegetables, widely considered a riskier crop than
other agricultural products. Farmers should be engaged as ‘anti-obesity’
partners.
d) Develop measures that promote easy access to fruit and vegetables for
Canadian households. For example, both the European Union and the United
States have recently implemented policies to actively promote farmers’
markets.
Caloric Sweetened Beverage Tax
Evidence
We identified 5 recent empirical studies that evaluated the effect of beverage taxes
currently adopted in a number of US states on body mass index (BMI) and obesity
[26, 27, 28, 29,30]. The focus of these studies on the effect of beverage taxes on
weight outcomes differs from that of the beverage price elasticity studies, such as
- 18 -
those reviewed in [14], which estimated the effects of beverage prices on beverage
consumption.
All of these 5 studies used cross-sectional data. Two studies examined the
effect of soda taxes on adult weight. Kim and Kawachi [26] investigated the effect of
these taxes on state-level obesity prevalence, using state-level taxes on soft drinks and
snacks and the 1991-1998 cross-sections of data from the U.S. Behavioral Risk Factor
Surveillance System (BRFSS). They found weak statistical evidence (p-value = 0.09)
that states that had repealed a soft-drink or snack-food tax were 13 times more likely
than states with a tax to experience a relative increase in obesity prevalence. In
addition, states without a soft drink or snack food tax were four times more likely
(albeit statistically insignificant p-value=0.25) than states with a tax to exhibit a high
relative increase in obesity prevalence.
Fletcher et al. [27] also used the BRFSS data, but for the period 1990-2006,
and focused on the effect of soft drink taxes on individual weight outcomes. Using
their preferred model, they found that soft drink taxes influence individuals’ BMI but
the impact was small in magnitude. The authors also reported that tax effects on
weight outcomes were larger among low income groups. This result suggests that
such taxes may not be regressive as is commonly assumed.
Powell and colleagues [28] examined the effect of soft drink taxes on
adolescent weight using Monitoring the Future data for the period 1997-2006. They
found no statistically significant relationship between soda taxes and adolescent
weight outcomes but did find a weak economic and statistically significant
relationship between the vending machine soda tax rate and BMI among adolescents
at risk for overweight.
Fletcher et al. [29] considered the effect of soda taxes on children and

- 19 -
adolescent weight using the U.S. National Health and Nutrition Examination Survey
(NHANES). In addition to examining weight, they assessed whether higher soda taxes
lead to increased consumption of milk and juice. Their econometric framework
controls for unobserved state-level characteristics (through the inclusion of state-
specific fixed effects) that could be correlated with soft drink taxes (failure to control
for unobserved characteristics could lead to misleading estimates). They found that
soft drink taxes lead to a modest reduction in soda consumption by children and
adolescents, but have no effect on children and adolescents’ net weight due to an
increase in consumption of whole milk (but not juice or juice-related drinks). They
concluded soda taxes, as currently practiced, do not reduce weight in children and
adolescents. However, as children and adolescents appear to substitute whole milk for
soft drinks in response to soda taxes, there may be unexplored broader nutrient
benefits of soda taxes for children and adolescents.
Finally, Sturm et al. [30] investigated the effect of state sales taxes for soft
drinks on children’s consumption of soft drinks and weight gain. They used the tax
rates that were in effect in January 2004 and matched them to the fifth-grade wave of
the Early Childhood Longitudinal Study individual-level data. Their results indicated
that existing taxes on soft drinks do not substantially affect overall levels of soda
consumption or obesity rates. However, they found that subgroups of at-risk children
(i.e. children who are already overweight, come from low-income families, or are
African American) may be more sensitive than others to soft drink taxes, especially
when soft drinks are available at schools. They suggested that a larger soft-drink tax is
required to generate meaningful changes in consumption and weight outcomes.
Panel Conclusions
Three-quarters of the panel recommended moving forward with a tax on caloric

- 20 -
sweetened beverages; these include soda, energy drinks, sports beverages and many
juices and iced teas that are sweetened with sugar, corn syrup, or other caloric
sweeteners. Sugar-free diet drinks, diet beverages, sugar free juice, and flavoured
milk would be tax exempt. There was agreement that while such a tax may in itself
have a modest impact on obesity, it could be quite powerful in its impact over time,
and have a synergistic effect with other tax, legislative, and educational initiatives to
address obesity – this may be largely in relation to changing norms about dietary
consumption.
In some respects, such a recommendation was described as a “leap of faith”
given the incomplete evidence base. Nevertheless, most panelists felt that a tax on
caloric sweetened beverages is justified, for several reasons. First, it was noted that
unlike fast foods, caloric sweetened beverages “served no nutritional value”. Second,
there was no indication from the empirical evidence that such a tax would be
regressive and unfairly penalize low income individuals and households. Finally, just
as the (rather successful) tobacco control policies were introduced with imperfect
information concerning their effectiveness, so too, many obesity control policies will
need to be introduced in the context of imperfect evidence. The actual impact of
public policies will only be clear once they take effect.
The uncertainty surrounding the impact of such taxes is likely due to the low
level of existing tax rates since the current caloric-sweetened beverage taxes were not
designed and implemented to address obesity. These taxes are too low to generate a
meaningful influence on caloric consumption and body weight, and lack sufficient
variability across jurisdictions and time to generate precise causal effect estimates.
Even so, there is evidence that low income individuals and children are the most
sensitive to changes in food prices generally. Additionally, there is strong empirical

- 21 -
evidence that the consumption of soft drinks is responsive to its prices (for every 10
% rise in prices, consumption declines 8 to 10%; see [14]). Therefore, it is reasonable
to expect that a sufficiently high tax imposed on soft drinks would be likely to reduce
consumption and thus curb obesity. However, experts acknowledged that such data
relies on many assumptions that may not hold during implementation. Unknown
effects regarding substitution, compensatory behaviour, and producer response all
serve to lower confidence in such claims.
In terms of magnitude, small taxes on soft drinks will likely do little to lessen
soft drink consumption or prevent childhood obesity. The panel experts noted that the
US tax rates up to 7.25% at the time did not have the desired effect on weight
outcomes. The level of the taxes will depend on where the soft drinks are sold
(vending machine, convenience stores, and supermarkets) but experts suggest a
minimum tax of around 20% of the price. For example, New York State was
considering an 18% tax in 2009. Further, taxes should be calculated and implemented
on a unit basis, rather than percent of price to avoid quantity discounts. Panellists also
suggested that the taxes be salient. That is, taxes are likely to have larger impacts if
they are made visible to consumers [31].
The proposed soft drink tax would also deliver several other benefits. First, the
revenue from this tax could be used to fund other initiatives to reduce obesity, such as
the introduction of free water fountains at public places. Tax revenue could also be
used to fund fruit and vegetable subsidy programmes. Second, a decline in soft drink
consumption will decrease sugar intake, which may provide health benefits beyond
the direct effects on obesity (see [32] for the list of cardiovascular diseases associated
with sugar consumption). Third, experts noted that fast foods and soft drinks are often
consumed together, so they may be complementary goods. Thus, higher soft drink

- 22 -
prices may reduce the consumption of fast foods.
Three panel members did not believe such a tax would have an impact on
obesity prevalence, claiming that consumers would substitute unhealthy foods not
subject to the tax if faced with higher prices for caloric sweetened beverages. They
favoured addressing the root economic forces at play, which they viewed as the
agricultural R&D and commodity subsidy policies that have lowered the prices and
increased the consumption of energy dense foods. An alternative strategy was taxing
sugar as an input to caloric sweetened drinks rather than consumer-facing taxes. This
might encourage health-promoting reformulations as well as put some upward
pressure on consumer prices on such beverages.
Specific recommendations for the Canadian context included:
a) Apply the tax on the amount of caloric sweetener in the beverage (e.g., 10
cents per ounce of sweetener);
b) Rationalize the tax in terms of broader health benefits as opposed to a single
focus on obesity. Decreasing sugar consumption has health benefits beyond
those associated with lowering obesity;
c) Combine the implementation of such a tax with targeted unsweetened
beverages and/or fruit and vegetable subsidies, or in other obesity prevention
interventions, and;
d) Monitor any unintended consequences of the tax implementation in terms of
producers’ formulation responses.
Food taxes
Another policy option is to tax certain foods linked to obesity. The panel viewed the
evidential base for policy in this area to be more compelling than the evidence to
support a beverage tax. In particular, they were swayed by the 4 longitudinal studies

- 23 -
that suggest that low fast-food prices increase weight outcomes [33,34,35,36] and 6
studies employing cross-sectional data [37,38,39,40,41,42] . However, panel members
did not recommend proposing such taxes at this time despite the empirical evidence.
There are a number of difficulties with the design and implementation of food taxes
that require further research before specific recommendations can be made.
The greatest challenge with food taxes is defining the scope of foods to be
taxed that fall under the category of energy dense, unhealthy foods. Complex decision
rules to capture all foods is likely to be unfeasible and involve large administrative
costs which might even exceed the revenue from taxing such foods. A more narrow
scope may not achieve the goal because consumers will be able to substitute from one
energy-dense food that is taxed to some other energy dense food that is not taxed.
This could be averted by defining a tax on food types as proportional to its content of
sugar for example. However, deciding on what is actually being taxed is not without
controversy.
Another important concern with food taxes is the issue of food insecurity. For
low income individuals, cheap, high energy foods may be the primary source of
energy. Accordingly, these individuals may use a higher share of their income to pay
food taxes than their wealthier counterparts. In other words, food taxes are more
likely to be regressive. An additional challenge is that some foods have a mixture of
good and bad nutrients, such as cereals with added sugar. Taxing these foods might
eliminate both good and bad sources of nutrients which in turn might have a
deleterious impact on health.
Fruit and Vegetable Subsidies
Evidence
We did not identify any study evaluating the impact of fruit and vegetable subsidies

- 24 -
on overweight and obesity directly. However, there is evidence on the effect of prices
of fruits and vegetables on weight outcomes, including 4 longitudinal studies
[33,34,35,43] and 3 cross-sectional studies [37,38,41]. Sturm and Datar [33] used
longitudinal data on children followed from kindergarten through third grade in the
U.S. Early Childhood Longitudinal Study. They found that changes in children’s
weight were positively related to the price of fruits and vegetables but not to changes
in meat, dairy, or fast-food prices. Specifically, an increase in the price of fruits and
vegetables by one standard deviation raised children’s BMI by 0.11 units by third
grade (equivalent to a BMI price elasticity of approximately 0.05) based on analyses
by Powell and Chaloupka [10]. Their subpopulation analysis suggest that children
living in poverty and those at risk for overweight were roughly 50 and 39 percent,
respectively, more price sensitive compared with their non-poor and not-at-risk
counterparts.
Sturm and Datar [43] followed up their 2005 study by expanding the panel
data to include the fifth grade students. They found that one standard deviation
increase in the price of fruits and vegetables increased children’s BMI by 0.09 units
by third grade and by 0.18 units by fifth grade. This result confirmed their previous
finding that children’s BMI responds to changes in fruit and vegetable prices. More
importantly, their results suggest a consistent long-term effect of fruit and vegetable
prices on children’s weight outcomes.
Sturm and Datar’s [33,43] findings are consistent with findings reported by
Powell and Bao [35]. The latter study used panel data from the 1979 cohort of the
National Longitudinal Survey of Youth and price data for fruit and vegetable and fast
food price from the ACCRA (American Chamber of Commerce Research
Association). They found that a 10% increase in the price of fruits and vegetables was

- 25 -
associated with a 0.7% increase in child BMI.
Another important piece of evidence concerning the effect of fruit and
vegetable prices on child weight is from Powell and Chaloupka [34]. Using panel data
from the Child Development Supplement of the Panel Study of Income Dynamics,
their fixed effects model showed that higher fruit and vegetable prices are
significantly related to a higher BMI percentile ranking among children, with greater
effects among low-income children: fruit and vegetable price elasticity for BMI was
estimated to be 0.25 for the full sample and 0.60 among low-income children.
For adolescents, there is weaker evidence that fruit and vegetable prices have
an impact on body weight [37]. However, one study has found adolescents’ weight to
be sensitive to the price of fruits and vegetables [38]. In particular, for both males and
females, the effects of the prices of fruits and vegetables (and fast-food meals) at the
90th or 95th quantiles were found to be relatively large, between three to five times
greater than across the distribution as a whole. Based on this result, the authors
suggest that subsidies for fruits and vegetables would have the greatest effect on
reducing the weight of adolescents most at risk for overweight. Finally, Beydoun,
Powell and Wang [41] report a positive correlation between fruit and vegetable prices
and adults’ BMI.
Panel Conclusions
In contrast to concerns about food taxes, panel members were uniformly in favour of
fruit and vegetable subsidies – primarily targeting children and low income
households. It was believed that the evidence clearly demonstrated a link between
lower obesity risk and greater fruit and vegetable consumption although the
mechanisms for this relationship are unclear. Subsidies can become largely an income
transfer when people already consume some amount of the goods that are targeted by

- 26 -
the subsidy. In such a case, there is a risk that the additional income is used for other
goods including energy dense foods which counters the goal of the subsidy. However,
this is unlikely for fruits and vegetables which are under-consumed by the population
on average and in particular, by those with lower income (see [44]). This explains the
recommendation proposed here that fruit and vegetable subsidies be targeted at low
income people and children only. For children, encouraging them to eat fruit and
vegetables will likely reduce the childhood obesity problem and may help them to
develop a healthy habit of consuming fruit and vegetables in later years.
In terms of the subsidy coverage, both fresh and frozen as well as canned fruit
and vegetables should be eligible for subsidy. For low-income adults, one way to
deliver these subsidies is through grocery cards or debit cards. These cards could be
potentially connected with the Canada Revenue Agency databases for monitoring and
reimbursement purposes. For children, free fruit and vegetables could be offered at
schools. One example is the School Fruit Scheme implemented in the European
Union (http://ec.europa.eu/agriculture/markets/fruitveg/sfs/index_en.htm).
It was also noted that the total costs of a diet include both the monetary cost of
buying the ingredients and the time cost of preparing the ingredients for consumption.
Unlike soft drink or junk foods, fruit and vegetable preparation takes greater time.
Consequently, manipulating only the prices of fruit and vegetables may not be enough
to generate behaviour changes because the time cost of preparation may still result in
people failing to consume them (even if they buy them). Therefore, subsidy measures
should be accompanied by measures to promote convenient cooking of these
increased fruits and vegetables. In this regard, ready-to-eat fruit and vegetables
provided at school meals are more attractive than fruit and vegetable subsidies
targeted at low income people.

- 27 -
Finally, targeted fruit and vegetable subsidies will generate higher demand and
may increase fruit and vegetable prices for non-subsidized groups. This might be
more relevant in Canada where fruit and vegetable supply is not perfectly price
elastic. For example, the cost of fruit and vegetables in Canada increases in the winter
time. The extent of the price increase depends on the incremental costs to farmers and
distributors of increasing production. The higher prices will likely put pressure on the
government budget. This issue highlights the need to see the synergistic effects of
economic interventions. Fruit and vegetable subsidies may need to be supported by
any revenue generated by beverage taxes, while agricultural subsidies will need to be
shifted to support fruit and vegetable production.
Specific recommendations for the Canadian context included
a) Implement subsidy coverage and ensure that eligible products include both
fresh and frozen as well as canned fruit and vegetables. For low-income
adults, such subsidies may be delivered through grocery or debit cards.
These cards can be connected with the Canada Revenue Agency for
monitoring and reimbursement purposes;
b) Offer children and youth free fruit and vegetables at school;
c) Dedicate portions of beverage tax revenue to fund fruits and vegetable
subsidies, and;
d) Shift agricultural policy and subsidies to enhance the production and
distribution of fruits and vegetables.
Physical Activity
Panel Conclusions
There was less confidence among the panel members that economic instruments as
defined within the scope of their discussions (i.e., taxes and/or subsidies) was an

- 28 -
effective means to increase physical activity at the population level. In terms of
economic instruments, it was proposed that such instruments might be more effective
targeting consumption as opposed to energy expenditure. Additionally, while panel
members recognized the two-sided nature of issues related to physical activity – i.e.,
economic measures to increase physical activity and economic measures to decrease
sedentary behaviour, suggestions for economic measures that penalized inactivity
were considered to be unrealistic. However, such broad conclusions need to be
considered in the light of very little evidence concerning the impact of economic
measures to increase physical activity participation.
Tax credits were seen as rather ineffective at encouraging physical activity
amongst the sedentary; indeed they were deemed to provide windfall gains to those
who already participate in physical activity programs and hence were inequitable.
Panellists suggested that money would be better spent on subsidizing physical activity
programs, particularly those designed for children and low income groups. However,
there was a concern that this might be directed at ‘organized sports’ which does not
necessarily equate to increased physical activity. In general, there was greater support
for examining how subsidies might be targeted at specific populations to increase
physical activity participation – e.g., immigrant populations, single mothers, etc.
There was some speculation that gas taxes are one way to shift modes of
transportation but revenue would need to be directed to developing physical activity
facilities.
In summary, the panel suggested that there was insufficient evidence to clearly
recommend specific tax credits or subsidies to promote physical activity. This is not
to discount any policy changes in this area. At the least, public funds should be
transferred from potentially inefficient economic measures to encourage increases in

- 29 -
physical activity (e.g., the Children’s Fitness Tax Credit; see [45]) to economic
measures that show more promise (e.g., subsidized participation for targeted
populations). The promise of such economic measures should be tested in a matching
program of research to determine the actual effects of such measures on increasing
physical activity participation and reducing obesity.
Income Transfers
Panel Conclusions
In addition to using taxes and subsidies to alter the relative prices of healthy foods
versus unhealthy foods, another potential tool to address obesity is to use income
transfer programs. This project’s review of empirical research distinguished two types
of transfer programs. The first type generally involves income support whose main
goal is to address poverty and is referred to as ‘unrestricted’ income transfers. There
are many such programs in the US, including for instance, Temporary Assistance for
Needy Families (TANF) for single mothers, Disability Insurance, and Supplemental
Social Security Income for older adults.
Another type of transfer programs – ‘restricted’ income transfers – can be
redeemed for food and beverages only. One example is the Supplemental Nutrition
Assistance Program (SNAP) (formerly called the Food Stamp Program). Participants
in the SNAP program are distributed debit cards (historically, paper denominational
stamps or coupons worth $1, $5, and $10) that can be used to purchase any food or
food product intended for human consumption, except alcoholic beverages, tobacco,
and hot meals and hot food products prepared for immediate consumption. We did not
identify a transfer program that is targeted directly at promoting physical activity.
Income transfer approaches did not receive any support from the panel
members in terms of addressing obesity. This was primarily due to the perception that

- 30 -
existing evidence did not clearly support a simple inverse relationship between
income and obesity. That is, obesity impacted all socioeconomic strata. The panel felt
that there are many good reasons to consider income transfers but obesity prevention
was not one of them. Overall, the panel felt it was a safer course of action to focus on
targeted subsidies although it was appreciated that there exists a nuanced distinction
between income transfers and subsidies.
Discussion
A comprehensive combination of educational, regulatory, direct provision, and
economic policies will be essential for effectively tackling the public health burden of
obesity. Economic interventions by themselves are not the answer but should be one
component of such a comprehensive approach. In terms of economic interventions,
shifting from empirical evidence to policy recommendations remains challenging.
Current evidence is not sufficiently strong to provide clear policy direction.
Additionally, the nature of the experiments needed to provide definitive evidence
supporting certain policy directions is likely to be complex and potentially infeasible.
However, these are not reasons to take no action. Engaging research experts for their
informed opinion is an important source of evidence particularly when the evidence
base is incomplete [15]. The process reported here was informative for focusing
attention on broad strategies for policy consideration and greater research attention. It
should be acknowledged, however, that generalizations are limited in using the Delphi
method – another panel may reach different conclusions for example (Iqbal & Pipon-
Young, 2009). As research increases in this area, broadening the size and scope of
expertise contributing to such panels will be informative in the future.
Panellists agreed that the most important priority was to modify agricultural
support policies and food subsidies so as to both lower the prices, and increase the
- 31 -
availability, of fruit and vegetables. US-based experts were most adamant about the
potential deleterious impact of agricultural policy on obesity prevalence in North
America. In Canada, there has been little empirical research on the effect of
agricultural policies on food choices and obesity outcomes. It seems plausible,
however, that Canadian agricultural support policies have, at best, only a modest
effect on obesity. Canada has little influence on prices of obesity-linked commodities
such as soybeans and corns (Canada is a large agricultural exporter, but it is a small
player in most commodity markets, except for wheat and canola oil). Also, the size of
agricultural subsidies in Canada is relatively small compared to those in the United
States and Europe. Despite this lack of research evidence there are still other
agricultural policies that are likely to have had an impact on food choices and
contributed to rising obesity in Canada. These policies are reviewed and assessed
qualitatively by Cash, Goddard, and Lerohl [46]. The authors note that Canada’s dairy
supply management program has encouraged consumption away from fluid milks and
towards dairy products that have higher fat and sugar content. For example, milk
processors will pay suppliers less for milk used in the manufacture of ice cream than
for milk that is processed into fluid milk.
The majority of the panel members recommended the implementation of a tax
on caloric sweetened beverages while at the same time subsidising fruits and
vegetables for children and low-income households. There is evidence that adult
weight is modestly responsive to soft drink taxes. For children and adolescents, soft
drink taxes lead to only small weight reductions, but they may induce a substitution
from soft drinks to whole milk. Adolescents at risk of being overweight may also
experience weight reduction. Additionally, there is consistent evidence that lower
prices of fruits and vegetables are associated with lower child weight. For adolescents

- 32 -
and adults, the evidence also suggests that weight is sensitive to fruit and vegetable
prices.
Given that the evidence supports an effect of food prices on weight outcome,
the key question is the magnitude of this effect. According to studies that were
selected and reviewed, price effects are small. However, it might be inaccurate to
conclude that prices have small effects on weight outcomes. The estimated price
effects should only be considered as the lower bound of price effect, as there are a
number of factors that might cause the effect to be underestimated. First, the current
state-level soda and snack taxes in the US may be too small and lack the variation
necessary to help identify meaningful effects on people’s weight. To date, none of the
implemented food taxes were designed with the primary purpose of addressing
obesity. For example, average state taxes imposed on soda and soft drinks are very
low, at $0.0425 on a $1.00 bottle of soda when sold through grocery stores [28]. This
is in contrast with cigarette excise taxes of as much as $2.75 on a pack of cigarettes
(in New York) and the combined state and federal taxes that more than double the
retail price of cigarettes in many states [48].
Second, prices of fast foods are determined in part by demand conditions,
therefore they may not be exogenous. Goldman et al. [49] point out that if food prices
are determined by both supply (i.e. manufacturers) and demand conditions, the effect
of prices on weight outcomes will be underestimated in the empirical studies. Third,
measurement errors in weight and price data might bias price effects downward. The
information on weight and height used to calculate BMI are mostly self-reported. At
the same time, there are limitations to the price data from ACCRA . These data were
collected in larger cities and metropolitan statistical areas and as a result are skewed
towards higher income households and will produce considerable measurement error

- 33 -
when matched to low-income or rural populations. Further, only a small number of
food items are surveyed, so the data are not fully representative across food groups.
Also, ACCRA does not always continuously sample the same cities, and hence the
data are not fully comparable over time.
Fourth, there is an inherent difficulty in estimating the effect of economic
factors on weight outcomes. Because these effects follow a nonlinear accumulation
pattern (i.e., as Katan & Ludwig [50] explain, in response to continuous increases in
caloric intake, weight does not increase continuously, but rather can adjust in discrete
jumps), one needs to distinguish between short term impacts (which can be modest in
magnitude) and long term impacts (which as Goldman et al. [49] demonstrated, can
be substantial). Specifically, a small, short-term (i.e., week-to-week, month-to-
month., or even year-to-year) economic impact may add up to a quite large long-term
outcome (e.g., 10 calories per day is 3,600 calories per year, which over 30 years,
ceteris paribus, can add up to >30 pounds of body weight).
In considering the existing evidence, it is most likely that policies will need to
be implemented in the face of an incomplete evidence base – and parallels can be
drawn with tobacco control - initial tobacco control interventions were not evidence-
based but represented sound judgment at the time [51]. Where the empirical evidence
is still not sufficiently strong, perhaps the most important criteria for considering a
policy is the potential for harm such a policy might cause, rather than the extent of its
impact on obesity. Additionally, even a good policy intervention involves some trade-
offs. That is, a good policy may hurt some population segment, but on the whole may
benefit society. The concern about the regressive nature of tax measures (that is, taxes
may impose a larger burden on the poor than the rich) normally fails to take into
account the potentially large health improvements resulting from imposing these

- 34 -
taxes. It remains to be seen whether the political will exists in Canada to introduce
and evaluate such tax and subsidy measures.
Competing interests
The authors declare that they have no competing interests.
Authors' contributions
GF and PG conceived of the project, and contributed to the design and execution of
the scoping review and Delphi survey with KA, PD, RF and RM. VHN assisted with
literature searching, review and analysis. As members of the expert panel, TA, CA,
SC, JC, AD, LD, IJ, JL, DL, LP, BT and FW all contributed significant intellectual
content that is presented in this report. All authors read and approved the final
manuscript.
Acknowledgements
Financial support for this project was provided by the Heart and Stroke Foundation of
Canada.
References
[1] Swinburn B, Egger G, Raza F: Dissecting obesogenic environments: The
development and application of a framework for identifying and prioritizing
environmental interventions for obesity. Prev Med 1999, 29: 563-570.
[2] Cawley J: An economic framework for understanding physical activity and eating
behaviors. Am J Prev Med 2004, 27: 117-125.
[3] World Health Organization: WHO Report on the Global Tobacco Epidemic, 2008:
The MPOWER Package. Geneva, World Health Organization; 2008.
[4] Gallet C, List J: Cigarette demand: a meta-analysis of elasticities. Health Econ
2003, 12: 821-35.
- 35 -
[5] Hopkins DP, Briss PA, Ricard CJ, Husten CG, Carande-Kulis VG, Fielding JE,
Alao MO, McKenna JW, Sharp DJ, Harris JR, Woollery TA, Harris KW; Task Force
on Community Preventive Services: Reviews of evidence regarding interventions to
reduce tobacco use and exposure to environmental tobacco smoke. Am J Prev Med
2001, 20(2 Suppl): 16–66.
[6] Ross H, Chaloupka FJ: Economic policies for tobacco control in developing
countries. Salud Pública Méx 2006, 48:s113-s120.
[7] Madore O: The Impact of Economic Instruments That Promote Healthy Eating,
Encourage Physical Activity and Combat Obesity: Literature Review. Ottawa,
Canada: Library of Parliament Publications; 2007.
[8] Goodman C, Anise A: What is known about the effectiveness of economic
instruments to reduce consumption of foods high in saturated fats and other energy-
dense foods for preventing and treating obesity? Geneva, World Health Organization;
2006.
[9] Cash SB, Lacanilao R: Taxing food to improve health: Economic evidence and
arguments. Agr Resource Econ Rev 2007, 36: 174-182.
[10] Powell L, Chaloupka FJ: Food prices and obesity: Evidence and policy
implications for taxes and subsidies. Milbank Q 2009, 87: 229-257.
[11] von Tigerstrom B: Tax and Subsidy Measures for Obesity Prevention:
Background Paper. Report submitted to the Public Health Agency of Canada; 2009.
[12] Lang T, Rayner G: Overcoming policy cacophony on obesity: an ecological
public health framework for policymakers. Obes Rev 2007, 8: 165–181.
[13] Arksey H, O’Malley L: Scoping studies: Towards a methodological framework.
Int J Soc Res Meth 2005, 8: 19-32.
[14] Andreyeva T, Long M, Brownell K: The impact of food prices on consumption:

- 36 -
A systematic review of research on price elasticity of demand for food. Am J Public
Health 2010, 100: 216-222.
[15] Faulkner G, Taylor A, Ferrence R, Urban S, Selby P: Exercise Science and the
Development of Evidence-Based Practice: A ‘Better Practices’ Framework. Eur J
Sport Sci 2006, 6: 117 - 126.
[16] Iqbal S, Pipon-Young L: The Delphi method. Psychologist 2009, 22: 598-601.
[17] Waterlander WE, Steenhuis IH, de Vet E, Schuit AJ, Seidell JC: Expert views on
most suitable monetary incentives on food to stimulate healthy eating. Eur J Public
Health 2010, 20: 325-31.
[18] Tillotson J: Pandemic obesity: agriculture’s cheap food policy is a bad bargain.
Nutrition Today 2003, 38: 186.
[19] Schoonover H, Muller M: Food without Thought: How U.S. Farm Policy
Contributes to Obesity. Report for the Institute for Agriculture and Trade Policy;
2006.
[20] Grunwald M: Why Our Farm Policy Is Failing, Time Nov. 02; 2007
(http://www.time.com/time/magazine/article/0,9171,1680139,00.html)
[21] Pollan M: The (Agri)cultural Contradictions of Obesity. New York Times.
October 12; 2003.
[22] Miller J, Coble K: Cheap food policy: Fact or rhetoric? Food Policy 2007, 32:
98-111.
[23] Beghin J, Jensen H: Farm Policies and Added Sugars in US Diets. Food Policy
2008, 33: 480-488.
[24] Alston J, Sumner D, Vosti S: Farm subsidies and obesity in the United States:
National evidence and international comparisons. Food Policy 2008, 33: 470-479.

- 37 -
[25] Alston J, Andersen M, James J, Pardey P: Persistence Pays: U.S. Agricultural
Productivity Growth and the Benefits from Public R&D Spending. New York:
Springer Publishers; 2010.
[26] Kim D, Kawachi I: Food taxation and pricing strategies to "thin out" the obesity
epidemic. Am J Prev Med 2006, 30: 430-437.
[27] Fletcher JM, Frisvold D, Tefft N: Can soft drink taxes reduce population weight?
Contemp Econ Policy 2010, 28: 23-35.
[28] Powell L, Chriqui J, Chaloupka F: Associations between state-level soda taxes
and adolescent body mass index. J Adolescent Health 2009, 45 (3 Suppl): S57-63.
[29] Fletcher J, Frisvold D, Tefft N: The effects of soft drink taxes on child and
adolescent consumption and weight outcomes. Working paper; 2009.
[30] Sturm R, Powell L, Chriqui J, Chaloupka F: Soda taxes, soft drink consumption,
and children’s body mass index. Health Affair 2010, 29: 1052-1058.
[31] Chetty R, Looney A, Kroft K: Salience and taxation: Theory and evidence. Am
Econ Rev 2009, 99: 1145-77.
[32] Howard B, Wylie-Rosett J: Sugar and cardiovascular disease. Circulation 2002,
106: 523-7.
[33] Sturm R & Datar A: Body mass index in elementary school children,
metropolitan area food prices and food outlet density. Public Health 2005, 119: 1059–
68.
[34] Powell L, Chaloupka FJ: Economic contextual factors and child body mass
index. NBER Working Paper #15046; 2009
[35] Powell L, Bao Y: Food prices, access to food outlets and child weight. Econ Hum
Biol 2009, 7: 64-72
[36] Powell L: Fast food costs and adolescent body mass index: Evidence from panel

- 38 -
data. J Health Econ 2009, 28: 963-970.
[37] Powell L, Auld C, Chaloupka F, O'Malley PM, Johnston LD: Access to fast food
and food prices: Relationship with fruit and vegetable consumption and overweight
among adolescents. Adv Health 2007, 17: 23-48.
[38] Auld C, Powell L: Economics of food energy density and adolescent body
weight. Economica 2009, 76: 719-40.
[39] Chou S, Grossman M, Saffer H: An economic analysis of adult obesity: Results
from the behavioral risk factor surveillance system. J Health Econ 2004, 23: 565-587.
[40] Rashad I: Structural estimation of caloric intake, exercise, smoking, and obesity.
Q Rev Econ Financ 2006, 46: 268-283.
[41] Beydoun M, Powell L, Wang Y: The association of fast food, fruit and vegetable
prices with dietary intakes among US adults: Is there modification by family income?
Soc Sci Med 2008, 66: 2218-2229.
[42] Meltzer D, Chen Z: The impact of minimum wage rates on body weight in the
United States. NBER Working Paper #15485; 2009.
[43] Sturm R, Datar A: Food prices and weight gain during elementary school: 5-year
update. Public Health 2008, 122: 1140–43.
[44] Blisard N, Stewart H, Jolliffe D: Low-Income Households' Expenditures on
Fruits and Vegetables. Economic Research Service, USDA; 2004.
[45] Spence J, Holt N, Dutove J, Carson V: Uptake and effectiveness of the
Children’s Fitness Tax Credit in Canada: the rich get richer. BMC Public Health
2010, 10: 356.
[46] Cash SB, Goddard EW, Lerohl ML: Canadian health and food: The links
between policy, consumers, and industry. Can J Agr Econ 2006, 54: 605–629.
[48] Orzechowski W, Walker R: The Tax Burden of Tobacco. Arlington, VA; 2008.

- 39 -
[49] Goldman D, Lakdawalla D, Zheng Y: Food prices and the dynamics of body
weight. NBER Working Paper # 15096; 2009.
[50] Katan MB, Ludwig DS: Extra calories cause weight gain but how much? JAMA
2010, 303: 65-66.
[51] Yach, D., McKee, M., Lopez, A.D., & Novotny, T. for Oxford Vision 2020
(2005). Improving diet and physical activity: 12 lessons from controlling tobacco
smoking. BMJ, 330: 898 - 900.
[52] Lawlor, D.A., Hart, C.L., Hole, D.J., & Davey Smith, G. (2006). Reverse causality
and confounding and the associations of overweight and obesity with mortality.
Obesity,14, 2294-304.
[53] Thow, A.M., Jan S., Leeder, S., & Swinburn, B. (2010). The effect of fiscal policy
on diet, obesity and chronic disease: a systematic review. Bulletin of the World Health
Organization [doi: 10.2471/BLT.09.070987].
[54] Gruber, J. & Koszegi, B. (2004). Tax incidence when individuals are time-
inconsistent: the case of cigarette excise taxes. Journal of Public Economics, 88 (9–10),
1959–1987.
[55] O’Donoghue T., & Rabin, M. (2006). Optimal Sin Taxes. Journal of Public
Economics, 90(10-11), 1825-1849.
[56] Turoff, M. (2002). The policy Delphi. In H. Linstone & M. Turoff (eds.) The Delphi
Method (pp. 80-96). Retrieved 25 July 2011 from http://is.njit.edu/pubs/delphibook.

- 40 -
Table 1. Delphi Survey Results (N=12)
Impact on
consumption
Impact on physical activity
Impact on obesity Cost-effective
Unintended
benefit
Unintended harm
Equitable Politically feasible
Intervention Mean IQD Mean IQD Mean IQD Mean IQD Mean IQD Mean IQD Mean IQD Mean IQD
Beverage tax 2.9 0 2.1 0 2.9 0.5 2.5 1 2.4 1 2.3 1 2.5 1
Food tax 2.7 1 2.2 0.5 2.8 0.5 2.4 1 2.8 1 1.9 0 2.1 0
Fruit & Veg subsidies 2.9 0 2.1 0 2.3 1 2.9 0 2.1 1.5 2.5 1 2.5 1
Child fitness tax credit 2.3 1 2.1 0.5 2.1 0.5 2.8 0.5 2.0 0 2.1 1 3.2 1
Adult fitness tax credit 2.3 1 1.8 0 2.0 0 2.5 1 2.0 0 2.0 0.5 2.9 0.5
Public transit tax credit 2.1 0 2.0 0 2.2 0 3.1 0.5 1.9 0.5 2.7 1 3.2 1 Sporting equipment tax credit 1.9 0 1.7 1 1.7 1 2.3 0.5 1.9 0 2.1 0 2.6 1
Subsidised PA programs 2.5 1 2.0 0 2.1 0 2.6 1 2.1 0 2.3 0 2.5 1
Road congestion tax 2.1 0 1.7 1 2.5 1 3.4 1 1.9 0 2.4 1 2.3 1 Income transfer unrestricted 2.0 1.5 1.7 1 1.9 1 1.8 1.5 2.9 0.5 2.7 1 2.0 1.5 2.5 1 Income transfer healthy food 2.9 0.5 2.1 0 2.6 1 2.8 0.5 2.3 0.5 2.4 1 2.8 0.5
Income transfer PA 2.3 1 1.9 0 1.9 0 2.5 1 2.0 0 2.3 1 2.2 1
Agricultural subsidies 2.4 1 2.3 0.5 2.9 0.5 2.9 1.5 2.6 1 2.1 1 1.7 1 Agricultural R&D rebalance 2.4 1 2.2 0.5 2.5 1 2.9 0.5 2.3 1 2.8 0.5 2.7 1
Notes: Not at all/None = 1; Low = 2; Moderate = 3; High/A Lot = 4.
IQD = Inter Quartile Deviation; indicates the distance between the 25th and the 75th percentiles. A smaller IQD represents greater consensus.