
Economic Indicators Report Third Quarter 2018: Central ...
20
Economic Indicators Report Third Quarter 2018: Central Wisconsin University of Wisconsin-Stevens Point Central Wisconsin Economic Research Bureau Randy Cray, Ph.D., Interim Chief Economist Scott Wallace, Ph.D., Research Associate Special Report: “Economic Growth Patterns in Wisconsin: The View from Outer Space” by Assistant Professor Sujana Kabiraj, UW-Stevens Point School of Business and Economics
Transcript of Economic Indicators Report Third Quarter 2018: Central ...

Economic Indicators ReportThird Quarter 2018: Central Wisconsin
Unive
rsity
of W
iscon
sin-S
teve
ns Po
int
Cent
ral W
iscon
sin Ec
onom
ic Re
sear
ch Bu
reau
Randy Cray, Ph.D., Interim Chief EconomistScott Wallace, Ph.D., Research Associate
Special Report: “Economic Growth Patterns in Wisconsin: The View from Outer Space” by Assistant Professor Sujana Kabiraj, UW-Stevens Point School of Business and Economics

The Central Wisconsin Economic Indicators Report is made possible thanks to support of:
Association for University
Business and Economic Research
CWERB - School of Business & EconomicsUniversity of Wisconsin-Stevens Point
Stevens Point, WI 54481715-346-3774 or 715-346-2537www.uwsp.edu/business/cwerb
CWERB Economic Indicators Report - Central Wisconsin 1
TABLE OF CONTENTS
Outlook................................................................................................................................................................................... 2 Table 1: National Economic Statistics .............................................................................................................................. 2State Economy ....................................................................................................................................................................... 3 Table 2: Unemployment Rate in Central Wisconsin ........................................................................................................ 3 Table 3: Employment in Central Wisconsin ..................................................................................................................... 4 Table 4: Wisconsin Employment Change by Sector ........................................................................................................ 4 Figures 1-7 .....................................................................................................................................................................4-5County Economy ................................................................................................................................................................... 5 Table 5: County Sales Tax Distribution ............................................................................................................................ 5 Table 6: Portage County Unemployment Claims ............................................................................................................. 5Local Economy ...................................................................................................................................................................... 5 Table7:BusinessConfidenceinStevensPoint-PloverArea ........................................................................................... 6 Table8:RetailerConfidenceinStevensPoint-PloverArea ............................................................................................. 6 Table9:HelpWantedAdvertisinginCentralWisconsin ................................................................................................. 6 Table10:ResidentialConstructioninStevensPoint-PloverArea ................................................................................. 6 Table11:NonresidentialConstructioninStevensPoint-PloverArea ............................................................................ 7 Figures 12-15 .................................................................................................................................................................... 7Housing Market Information............................................................................................................................................... 7 Table 12: National Median Home Prices.......................................................................................................................... 8 Table 13: National Existing Home Sales .......................................................................................................................... 8 Table 14: National Inventory ............................................................................................................................................ 8 Table15-1;15-2:NationalAffordabilityIndex ................................................................................................................ 8 Table16:LocalAreaMedianPrice .................................................................................................................................. 8 Table 17: Local Units Sold ............................................................................................................................................... 9 Table 18: Local Median Price........................................................................................................................................... 9 Table 19: Local Number of Home Sales .......................................................................................................................... 9Small Business Profile (SBDC) ............................................................................................................................................ 9Special Report: Economic Growth Patterns in Wisconsin: The View from Outer Space .......................................10-16
Special Recognition: ScottWallace,ResearchAssociate,CWERBCalebNysse,SeniorResearchAssistant,CWERBDrosianosLouvaris,ResearchAssistant,CWERBEva Donohoo, Publication Designer, College of Professional Studies

2 CWERB Economic Indicators Report - Central Wisconsin
OutlookMajorAreasofDiscussion
• The overall health of the economy: potential dangers to the expansion.
• Fiscalstimulus:taxcutsanddeficitspendingandwhenwill they will playout.
• FederalReservepolicy:inflation,laborshortages,overheating, interest rates.
• International trade disputes: China, Europe, Mexico and Canada and the problems it creates for the economy.
• The Bull Stock Market: how it may react to any number of economic events, e.g. higher long-term interest rates.
• Excessive leverage: the danger it brings to the world’s economy.
• The political scene: the economic impact of international tensions.
Atthetimethereportwaswrittenthenational,stateandlocal economies were doing well. For example, the Gross Domestic Product has been growing at a very respectable clip over the past few quarters; 4.2 percent in June’s quarter and 2.7 percent in September’s quarter. The GDP measures thetotalamountoffinalgoodsandservicescreatedintheeconomy and is generally regarded as the most fundamental indicator of performance. It is not a perfect measure by any means, as it does not consider a host of important things like medium household income level, household income distribution, poverty levels, access to healthcare, and the ability to live comfortably in retirement. Clearly these are very important issues that need to be taken into consideration when assessing the overall well-being of a nation.Asamatteroffact,thesevariableswouldsuggestthat we have long way to go before everyone in this country benefitsfromourgrowingeconomy.Forexample,theU.S. has one of the worst income distributions and infant mortality rates in the industrialized world.
AsIhavestatedinpreviousreports,themacro-economyis doing quite well. However, some of the factors behind this expansion will ultimately pose a serious threat to its continuation. In addition, these factors may also play a major role in bringing on the next recession. So, let’s discuss what these things might be.
Massive tax cuts have helped to refuel an already expanding economy. The data clearly shows that the economywasgrowingbeforethecuts.Amajorteneteconomic theory is that tax cuts are expansionary in nature. From the demand side it works by putting more money into the pockets of consumers. However, the bulk of the tax cuts have gone to the wealthy. There are numerous studies that support this assertion. Further, from the supply side of the economy, tax cuts are said to work by creating greater incentiveforbusinessfirmstoinvestintheirproductivecapacity, hire more workers and create more goods and services. This is also known as trickledown economics. The vast majority of economists say that the stimulus effects provided by the tax cuts will fade by 2020. However, the legacy of the tax cuts will haunt the economy for a long time to come. While, lowering tax rates may be politically expedient, it is precisely the wrong thing to do during an expansion. It’slikepouringgasolineonafire.Thefirehastheveryreal potential to get out of hand and start a major run-away blaze. This is especially true when unemployment rates are at historically low levels. The massive projected level of deficitspendingmayalsocauseinflationaryexpectationstobuild and place additional upward pressure on prices. The recent tax legislation passed by Congress and signed off on bythePresidentisforecastedtoexplodethefederaldeficitto over trillion dollars per year!
The Federal Reserve, the central bank of the United States, also played a key role in fueling the expansion by floodingtheeconomyoverthepastdecadewithcheapmoney and low interest rates. However, the FED seems to be committed to reversing its Quantitative Easing policy which commenced during the Great Recession. This means the FED is following a path of raising interest rates and tightening credit conditions. Ironically this will occur at a time when the simulative effects of the lower tax rates have fadedfromtheeconomy.Also,theinflationarypressurecausedbythedeficitspendingmaycausetheFEDtobeeven more resolute in pursuing their objective of reversing Q.E.
The gist of this is that the economy is going to experience higher interest rates and less liquidity at a time when the simulative effects of the taxes cuts have already been baked into the economic behavior of businesses and consumers. Obviously, this will slow the economy. In anticipation of thissituationinvestorsseemtobeanticipatinglowerprofitsand are rotating money out of the equity markets and into short term debt.
However, this is not the only factor that can dampen future economic activity. The international trade disputes will

CWERB Economic Indicators Report - Central Wisconsin 3
also be a drag on the economy. Tariffs are taxes imposed by a government on internationally produced goods and services. These taxes are ultimately paid for by its’ own citizens in the form of higher prices. Tariffs also disrupt business supply chains, which will also result in higher prices.Politicians,whocrowaboutthebenefitstariffsconvey to some industries, fail to mention the detrimental effects they have on other industries. For example, the domesticsteelindustrybenefitsifforeignsteelpricesare forced upwards by tariffs. However, there are more industries that use steel than actually produce it. These industries will be harmed by the tariffs as their cost of productionincreases.Further,thesefirmsemploymorepeople than the steel industry and if demand falls for their products their workers will be laid off.
Clearly trade disputes with China, Europe, Mexico and Canada have a great potential to do harm to the nation and Wisconsin.AsImentionedintheMayreport,andIbelieveit’s worth repeating, Wisconsin’s international trade is estimated to directly support over 800,000 jobs. In dollar terms, over $30 billion worth of goods and services are exportedbyWisconsinfirmseachyear.Keepinmindthat95 percent of the world’s population and 80 percent of the world’s purchasing power exist outside of the U.S. This means that future job growth in Wisconsin and the U.S. will be highly dependent on having access to foreign markets.
International trade has another important dimension that most people do not consider: about 60 percent of the $1.3 trillion that the U.S. imports annually are used by U.S. firmsasinputstotheirproducts.ThishelpsU.S.firmskeep costs down and to stay competitive in the global economy.ABusinessRoundTablestudyfoundthatrelaxedtrade barriers reduce prices on imported and domestic madeproducts.Inotherwords,theyhelptokeepinflationin check. For example, the study estimated that over a ten-year period (2004-2014) the price on comparable televisions has declined by over 80 percent, and 69 percent for computers. Further, the average Wisconsin family of four saves about $10,000 a year because of relaxed trade barriers.
While most would like to see the U.S. win better trade terms with other countries, people should remember that alienating other nations and starting a trade wars will cause higherdomesticinflationandthelossofjobshere!Clearlythis is a very delicate situation and the public needs to be aware of the potential costs. Raising tariffs and other trade barriers with the hope of increasing domestic jobs will come with a very steep cost.
Aproblemareathathasthepotentialtotriggerthenextrecession is the excessive amounts of borrowing that
has taken place both domestically and globally. During the period of historically low interest rates, businesses, consumers and governments alike all over the world have borrowed vast amounts money. U.S. corporations now have approximately $9 trillion of debt on their books. This sumisgreaterthanwhattheyhadbeforethe2008financialcollapse took place. If interest rates continue to rise, and the world economy slows, the burden of this debt will be increasinglydifficulttoservice.Debtdefaultswillstartacontagiousfinancialmeltdownthatcouldignitethenextrecession. While it is true that higher capital requirements imposedbygovernmentsontheirfinancialinstitutionsafterthe Great Recession will lessen the severity of the next financialcrises,theyhavenoteliminatedthistypeofthreatfromtheworld’sfinancialsystem.
Finally, we live in an increasingly dangerous world, and given our current fractious political scene at home, our ability to deal with economic crises is in serious question. Conflictswithothernationscouldeasilyspiraloutofcontrol in this chaotic environment. For example tensions are running high with a number of other nations: Russia, China,Iran,Korea,andevenSaudiArabia.Aconflictwithanyofthesenationscouldeasilydisrupttheworld’sflowofgoods and services and thus lead us into the next recession.
State EconomyThe unemployment rate in each reporting areas is reported inTable2.AscanbeseeninTable2Marathon,Portageand Wood County all experienced major declines in their respective unemployment rates’ from a year ago. The respective rates for Portage, Marathon and Wood are now down to 2.4, 2.2 and 2.7 percent in September 2018. The labor force weighted unemployment rate for Central Wisconsin also contracted, and is now at 2.4 percent. Meanwhile, Wisconsin’s unemployment rate fell from 3.0 to 2.6 percent. Thus, unemployment rates were much improved throughout the region and state. The United States unemployment rate also fell from 4.1 percent to 3.6 percent over the past 12 months.
4 CWERB Economic Indicators Report - Central Wisconsin
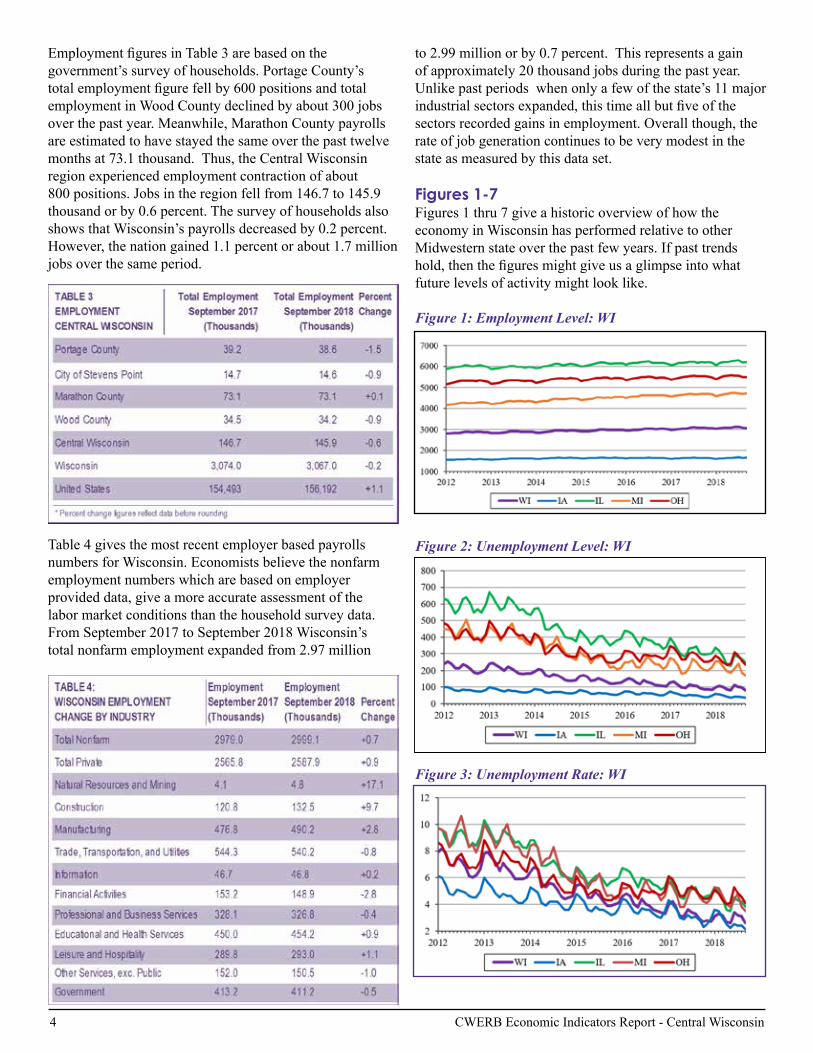
EmploymentfiguresinTable3arebasedonthegovernment’s survey of households. Portage County’s totalemploymentfigurefellby600positionsandtotalemployment in Wood County declined by about 300 jobs over the past year. Meanwhile, Marathon County payrolls are estimated to have stayed the same over the past twelve months at 73.1 thousand. Thus, the Central Wisconsin region experienced employment contraction of about 800 positions. Jobs in the region fell from 146.7 to 145.9 thousand or by 0.6 percent. The survey of households also shows that Wisconsin’s payrolls decreased by 0.2 percent. However, the nation gained 1.1 percent or about 1.7 million jobs over the same period.
Table 4 gives the most recent employer based payrolls numbers for Wisconsin. Economists believe the nonfarm employment numbers which are based on employer provided data, give a more accurate assessment of the labor market conditions than the household survey data. From September 2017 to September 2018 Wisconsin’s total nonfarm employment expanded from 2.97 million
to 2.99 million or by 0.7 percent. This represents a gain of approximately 20 thousand jobs during the past year. Unlike past periods when only a few of the state’s 11 major industrialsectorsexpanded,thistimeallbutfiveofthesectors recorded gains in employment. Overall though, the rate of job generation continues to be very modest in the state as measured by this data set. Figures 1-7Figures 1 thru 7 give a historic overview of how the economy in Wisconsin has performed relative to other Midwestern state over the past few years. If past trends hold,thenthefiguresmightgiveusaglimpseintowhatfuture levels of activity might look like.
Figure 1: Employment Level: WI
Figure 2: Unemployment Level: WI
Figure 3: Unemployment Rate: WI
CWERB Economic Indicators Report - Central Wisconsin 5
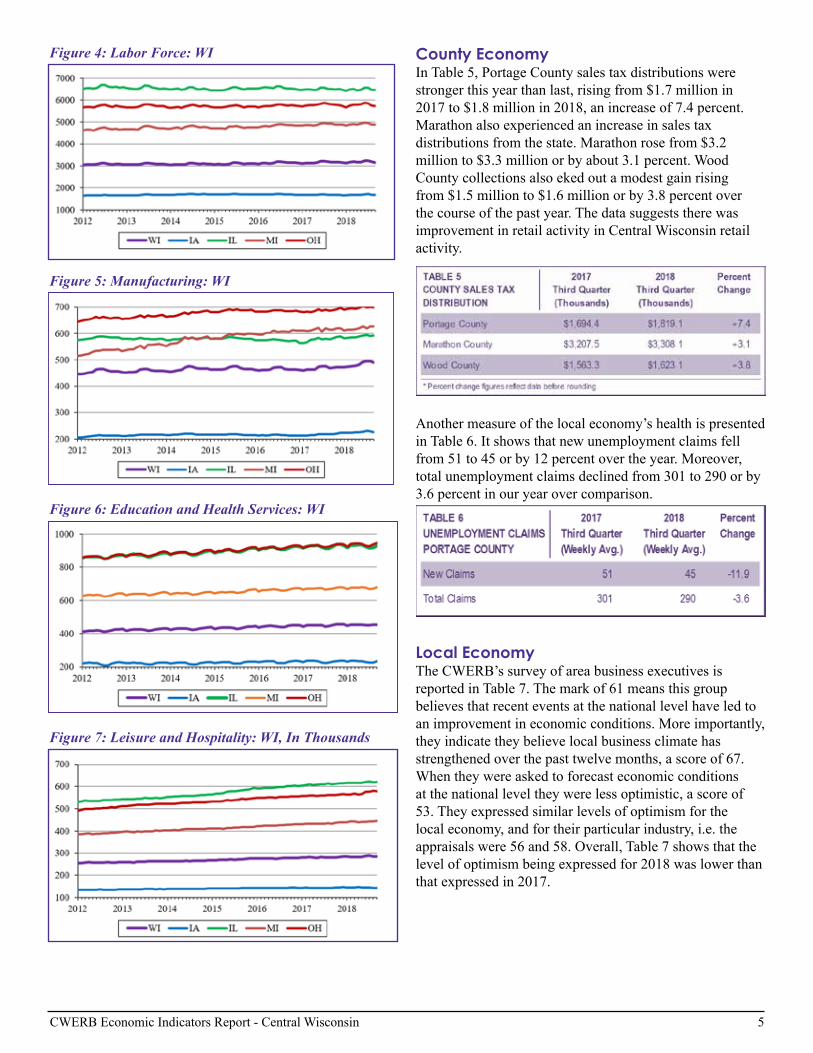
Figure 4: Labor Force: WI
Figure 5: Manufacturing: WI
Figure 6: Education and Health Services: WI
Figure 7: Leisure and Hospitality: WI, In Thousands
County EconomyIn Table 5, Portage County sales tax distributions were stronger this year than last, rising from $1.7 million in 2017 to $1.8 million in 2018, an increase of 7.4 percent. Marathon also experienced an increase in sales tax distributions from the state. Marathon rose from $3.2 million to $3.3 million or by about 3.1 percent. Wood County collections also eked out a modest gain rising from $1.5 million to $1.6 million or by 3.8 percent over the course of the past year. The data suggests there was improvement in retail activity in Central Wisconsin retail activity.
Anothermeasureofthelocaleconomy’shealthispresentedin Table 6. It shows that new unemployment claims fell from 51 to 45 or by 12 percent over the year. Moreover, total unemployment claims declined from 301 to 290 or by 3.6 percent in our year over comparison.
Local EconomyThe CWERB’s survey of area business executives is reported in Table 7. The mark of 61 means this group believes that recent events at the national level have led to an improvement in economic conditions. More importantly, they indicate they believe local business climate has strengthened over the past twelve months, a score of 67. When they were asked to forecast economic conditions at the national level they were less optimistic, a score of 53. They expressed similar levels of optimism for the local economy, and for their particular industry, i.e. the appraisals were 56 and 58. Overall, Table 7 shows that the level of optimism being expressed for 2018 was lower than that expressed in 2017.

6 CWERB Economic Indicators Report - Central Wisconsin
InTable8theCWERB’sretailerconfidencesurveymarkof 58 means that merchants feel that store sales were higher than a year ago. This is good news for the local economy. When it comes to expectations about the future it appears that the September 2018 assessment of retail activity was marginally lower than what it was in September 2017, amarkof50comparedto56.Alsothisgroupfeelsthatretail activity in winter 2018 will be about the same as in 2017.Theoverallsignificanceofthesurveyisthatlocalmerchants believe that the local retail sector did not change much over the past year.
HelpWantedAdvertisinginTable9isabarometeroflocal labor market conditions and the indexes for Stevens Point,Wausau,MarshfieldandWisconsinRapidsarenowbased on job advertising on the internet. The index for StevensPoint,MarshfieldandWisconsinRapidsfellby14.8 percent 15.3 percent and by 10.8 percent respectively when compared to a year ago. Further, Wausau experienced a small increase in the amount advertising taking place, 6.8percent.AdamsCountywasdowninadvertising,9.0 percent. While advertising in Lincoln County was higher, 6.4 percent. The data taken together suggests that advertising growth has been very uneven in the area.
Table 10 presents the residential construction numbers for the Stevens Point-Plover area. In our yearly comparison the number of permits issued in Third Quarter was 24, the number of permits last year was 26. The 2018 estimated value of the construction was $7.1 million and represents 24 housing units. When comparing Third Quarter 2017 to that of 2018 residential alteration activity fell slightly from 336 to 332 permits. However, the estimated value of this type of activity went up from $2.9 million to $3.0 million over the year. Overall, the 2018 construction data are slightly off the pace of a year ago.
ThenonresidentialconstructionfiguresinTable11wereas follows for Third Quarter 2018. The number of permits issued was just 6 and the estimated value was $1.8 million. The number of business alteration permits was 106 in 2018 compared to 125 in 2017. However, the estimated value of alteration activity was $6.8 million 2018 compared to the 2017figureof$5.1million.Insum,thepacenonresidentialconstruction activity remained brisk in the area.

CWERB Economic Indicators Report - Central Wisconsin 7
Figures 12 thru 15 give an economic history lesson as to how the employment level, the unemployment level, the unemployment rate, and the labor force have trended and likely will trend in the future. The City of Stevens Point, the City of Wausau, as well as the Combined Statistical Area(CSA)ofWausau,StevensPoint,WisconsinRapidsandMarshfieldarepresentedinthefigures.
Figure 12: Employment Level: Portage
Figure 13: Unemployment Level: Portage
Figure 14: Unemployment Rate: Portage
Figure 15: Civilian Labor Force: Portage
Housing Market InformationThe following seven tables contain information on the national, regional, and local housing market. Housing activity is an incredibly important aspect of the economy. We believe the reader will gain valuable insight into housing markets conditions and greater insight into the local economy in this section of the report.
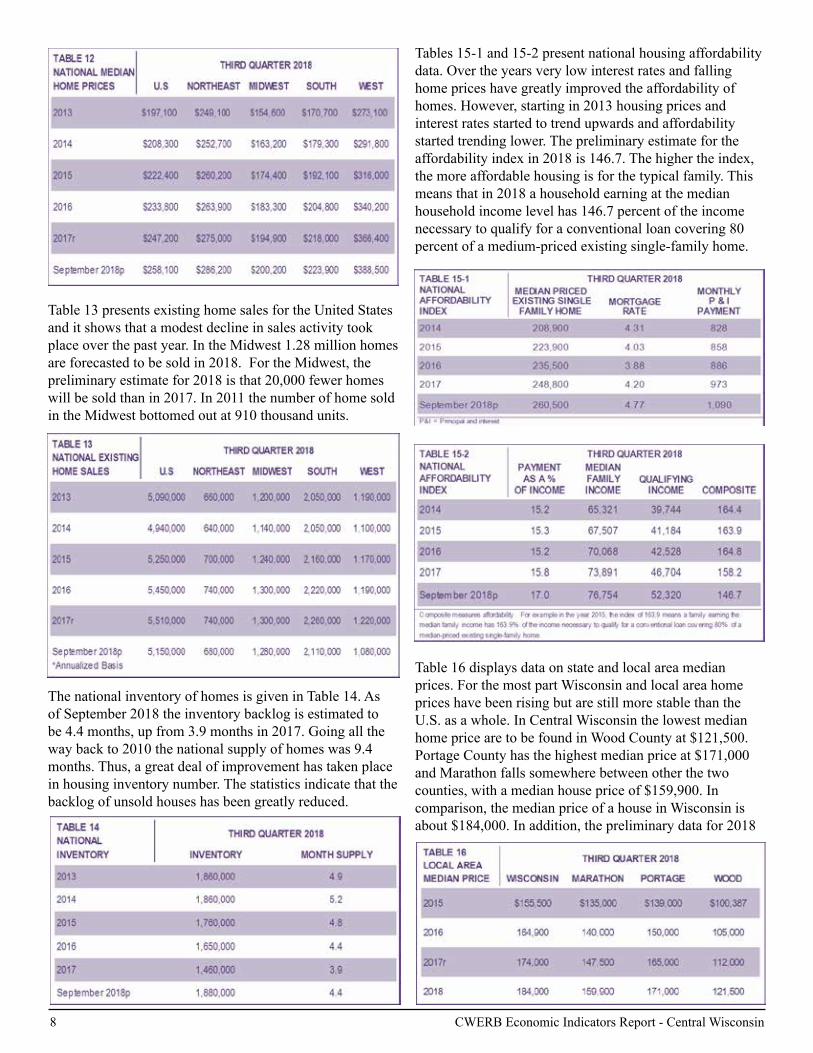
Table 12 gives national median home price for the U.S. and major regions in the U.S. The median home price in the U.S. rose to $258,000 in September 2018. Housing prices in the Midwest, as always, remain the lowest in the nation. The median home price in our part of the country rose to $200,200 in 2018. In general, housing prices are slowly increasing in the U.S. and are rising in all of its major geographic regions. The West has the highest medium housing prices at $388,500.
8 CWERB Economic Indicators Report - Central Wisconsin
Table 13 presents existing home sales for the United States and it shows that a modest decline in sales activity took place over the past year. In the Midwest 1.28 million homes are forecasted to be sold in 2018. For the Midwest, the preliminary estimate for 2018 is that 20,000 fewer homes will be sold than in 2017. In 2011 the number of home sold in the Midwest bottomed out at 910 thousand units.
ThenationalinventoryofhomesisgiveninTable14.Asof September 2018 the inventory backlog is estimated to be 4.4 months, up from 3.9 months in 2017. Going all the way back to 2010 the national supply of homes was 9.4 months. Thus, a great deal of improvement has taken place in housing inventory number. The statistics indicate that the backlog of unsold houses has been greatly reduced.
Tables 15-1 and 15-2 present national housing affordability data. Over the years very low interest rates and falling home prices have greatly improved the affordability of homes. However, starting in 2013 housing prices and interest rates started to trend upwards and affordability started trending lower. The preliminary estimate for the affordability index in 2018 is 146.7. The higher the index, the more affordable housing is for the typical family. This means that in 2018 a household earning at the median household income level has 146.7 percent of the income necessary to qualify for a conventional loan covering 80 percent of a medium-priced existing single-family home.
Table 16 displays data on state and local area median prices. For the most part Wisconsin and local area home prices have been rising but are still more stable than the U.S. as a whole. In Central Wisconsin the lowest median home price are to be found in Wood County at $121,500. Portage County has the highest median price at $171,000 and Marathon falls somewhere between other the two counties, with a median house price of $159,900. In comparison, the median price of a house in Wisconsin is about $184,000. In addition, the preliminary data for 2018
CWERB Economic Indicators Report - Central Wisconsin 9
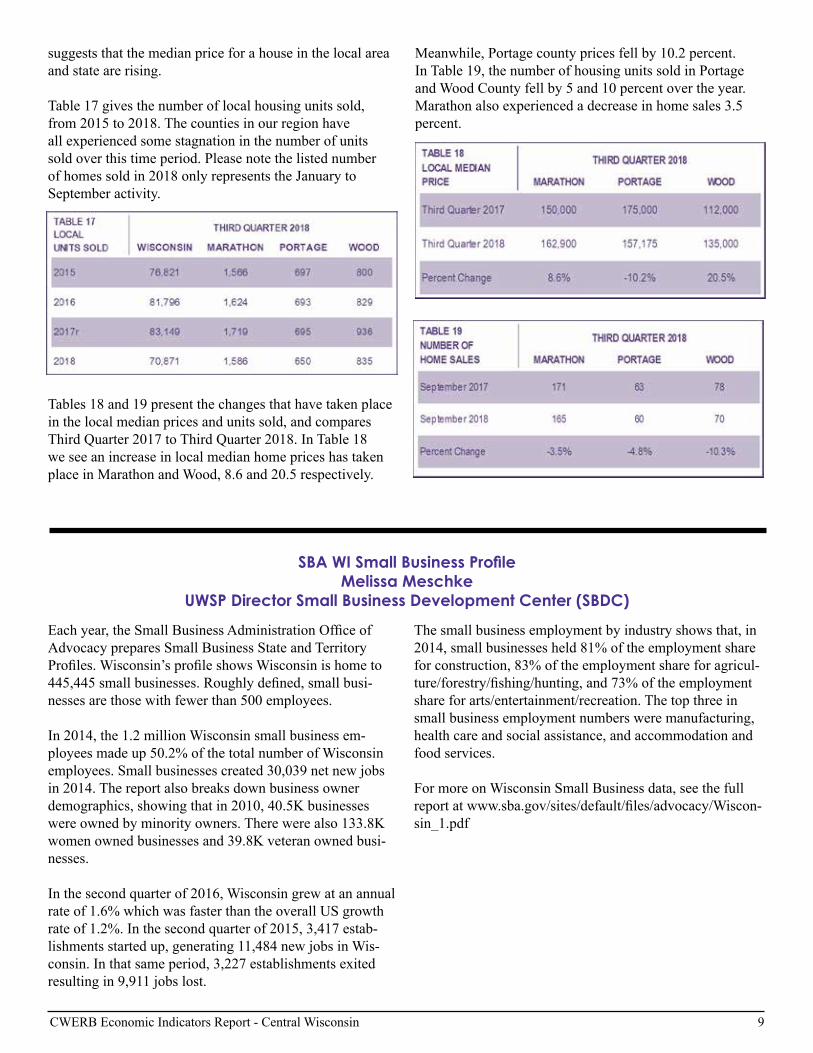
suggests that the median price for a house in the local area and state are rising.
Table 17 gives the number of local housing units sold, from 2015 to 2018. The counties in our region have all experienced some stagnation in the number of units sold over this time period. Please note the listed number of homes sold in 2018 only represents the January to September activity.
Tables 18 and 19 present the changes that have taken place in the local median prices and units sold, and compares Third Quarter 2017 to Third Quarter 2018. In Table 18 we see an increase in local median home prices has taken place in Marathon and Wood, 8.6 and 20.5 respectively.
Meanwhile, Portage county prices fell by 10.2 percent. In Table 19, the number of housing units sold in Portage and Wood County fell by 5 and 10 percent over the year. Marathon also experienced a decrease in home sales 3.5 percent.
Eachyear,theSmallBusinessAdministrationOfficeofAdvocacypreparesSmallBusinessStateandTerritoryProfiles.Wisconsin’sprofileshowsWisconsinishometo445,445smallbusinesses.Roughlydefined,smallbusi-nesses are those with fewer than 500 employees.
In 2014, the 1.2 million Wisconsin small business em-ployees made up 50.2% of the total number of Wisconsin employees. Small businesses created 30,039 net new jobs in 2014. The report also breaks down business owner demographics,showingthatin2010,40.5Kbusinesseswereownedbyminorityowners.Therewerealso133.8Kwomenownedbusinessesand39.8Kveteranownedbusi-nesses.
In the second quarter of 2016, Wisconsin grew at an annual rate of 1.6% which was faster than the overall US growth rate of 1.2%. In the second quarter of 2015, 3,417 estab-lishments started up, generating 11,484 new jobs in Wis-consin. In that same period, 3,227 establishments exited resulting in 9,911 jobs lost.
The small business employment by industry shows that, in 2014, small businesses held 81% of the employment share for construction, 83% of the employment share for agricul-ture/forestry/fishing/hunting,and73%oftheemploymentshare for arts/entertainment/recreation. The top three in small business employment numbers were manufacturing, health care and social assistance, and accommodation and food services.
For more on Wisconsin Small Business data, see the full reportatwww.sba.gov/sites/default/files/advocacy/Wiscon-sin_1.pdf
SBA WI Small Business ProfileMelissa Meschke
UWSP Director Small Business Development Center (SBDC)

10 CWERB Economic Indicators Report - Central Wisconsin
Economic Growth Patterns in Wisconsin: The View from Outer Space
by Assistant Professor Sujana Kabiraj
IntroductionAlongstandingissueinthefieldofempiricalgrowtheconomicsisthemeasurementofgrowth.Grossdomesticproduct(GDP), the value of all goods and services produced in an area within a year, is the most used variable for measuring economicgrowth.ThedefinitionofGDPatthesub-nationallevelissomewhatfuzzy;hence,itisusuallyhardtomeasureitaccurately.Moreover,GDPdataisnotreadilyavailableatthecountylevelinUSA.Indevelopingcountries,theproblemisevenmorecritical,primarilybecausethestatisticalinfrastructuretendstobemuchworse.Accuratemeasurement is at the heart of policy making, as echoed by the words of the Nobel laureate economist Joseph Stiglitz: “Whatwemeasureinformswhatwedo.Andifwe’remeasuringthewrongthing,we’regoingtodothewrongthing.”In light of that, Henderson, Storeygard, and Weil proposed an unorthodox proxy for such ill-measured GDP in 2009. Theyusedman-madenighttimelights,observedfromouterspacethathasbeencollectedbyNASAaspartoftheUSgovernment’sDefenseMeteorologicalSatelliteProgram.Theyarguedthatthegrowthinsuchnighttimelightsreflectsthegrowth in economic activities. Moreover, the light data, being collected at a minutely detailed level (approximately one-kilometer squares), alleviates the sub-national growth measurement problem.
Since its introduction, nighttime light has effectively served as a proxy of economic activity in the contemporary development literature. Not only is there a large volume of such literature measuring economic growth in the developing countries,thetechniquehasprovedtobequiteeffectivewithinUSA.Kulkarniet.al.(2011)estimatedthesub-regionalleveleconomicactivityusingnighttimelightsinUSAandChina,whereasseveralotherstudiesusedthesameformonitoringtheextentofurbandynamicsindifferentpartsofUSA.
Despite a steady average growth rate of around 2.4 % over last two decades, there have been concerns about the stark sub-nationalinequalityinUSA.In1990,themedianhouseholdincomeofthestateslikeNewJersey,Connecticut,orMarylandwasmorethandoublethatofMississippi,Arkansas,andLouisiana.Oneofthereasonsbehindtheinequalityin income among states can be attributed to the increase in the skill premium as well as the clustering of skilled workers in areas with better opportunity. In other words, workers with higher skill levels get higher returns for their skills if they migratetotheareaswithbettereconomicconditions.Suchinequalityseemstobeevenmorepronouncedatafinergeographicallevel.Morespecifically,apoorcountyofapoorstatesuffersfromamuchlowermedianincomecomparedto a rich county of a rich state. But as Ganong and Shoag (2017) notes, one of the most interesting patterns in sub-national growthinUSAhasbeenasteadyrateofconvergenceintheper-capitaincomeoverthelastcentury,implyingthatthepoorerareasinthecountryseemstobegrowingfasterthantheirrichercounterparts.Althoughthispatternofregionalconvergence seems to have slowed down over last 30 years across states, Higgins, Levy and Young (2006) shows that there has been evidence of convergence at the county level.
In this report, using nighttime lights data, we investigate whether such a convergence exists at the county level growth pattern in the country, among the Midwestern states, and in Wisconsin, during the 21 years between 1992 and 2013.
Data discussionThe nighttime light data that we use here measures the average stable light for a geographical location, scanned by the U.S. government’s Defense Meteorological Satellite Program (DMSP) satellites in an instant between 8:30 and 10:00 pm local time on all cloud free nights within a year. Over a year, each satellite reports the intensity of light as a 6-bit Digital Number (DN) for each 30 arc second grid which approximately forms a square kilometer radius. DN is an integer that measures the stable light taking value from 0 to around 63, where 0 means absolute darkness and 63 is the highest light observed. We then aggregate upon all such grid values in a certain region to build the minutely detailed nighttime lights data-set. The nighttime light data such collected are available consistently from 1992 to 2013.

CWERB Economic Indicators Report - Central Wisconsin 11
Figure 1 shows the average nighttime lights intensity in the counties of Midwestern states such as Illinois, Indiana, Iowa, Kansas,Michigan,Minnesota,Missouri,Nebraska,NorthDakota,Ohio,SouthDakota,andWisconsin.Thedarkerareashave lower light that the brighter areas.
Figure 1: Average Lights in the Midwest 1992 & 2013
AmongtheMidwesternstates,mostcountiesofMichigan,Wisconsin, Minnesota, Illinois and Iowa have more average lights compared to the other states in both the years. Such difference in light can be attributed to low population and low economic activity in states like North Dakota,SouthDakota,Nebraska,andKansas.TheMidwestern region has experienced growth in lights over 1992to2013,reflectedinthelowerpaneloffigure1.Figure 2 shows the magnitude of such light growth for the same region. The darker hue shows higher intensity of lights growth. It is evident that the growth is more pronounced in the counties that were initially darker, supporting our notion of county-level convergence.
Next, we concentrate on the county-level growth in Wisconsin. Figure 3 shows the change in the nighttime lights in Wisconsin during our study period. Theleftpaneloffigure3showstheinitialleveloflights(for1992)forthedifferentcountiesofWisconsin,whereastherightpanelshowsthesameforthefinalyearofourstudy(for2013).Weseethatoverthe21yearsofourstudyperiod,Polk,Douglas,andGrantinthewest;Wood,Clark,Chippewa,Marathon,Adams,Wausharainthemiddle;andBrown,Dodge, and Waukesha in the east are brightening up. The pattern of convergence, although less pronounced, still exists for thestate(seefigure4wherethedarkerhuerepresentshighergrowth).
Figure 3: Average Lights in Wisconsin 1992 & 2013
Figure 2: Average Light Growth in Midwest over 1992 to 2013
12 CWERB Economic Indicators Report - Central Wisconsin
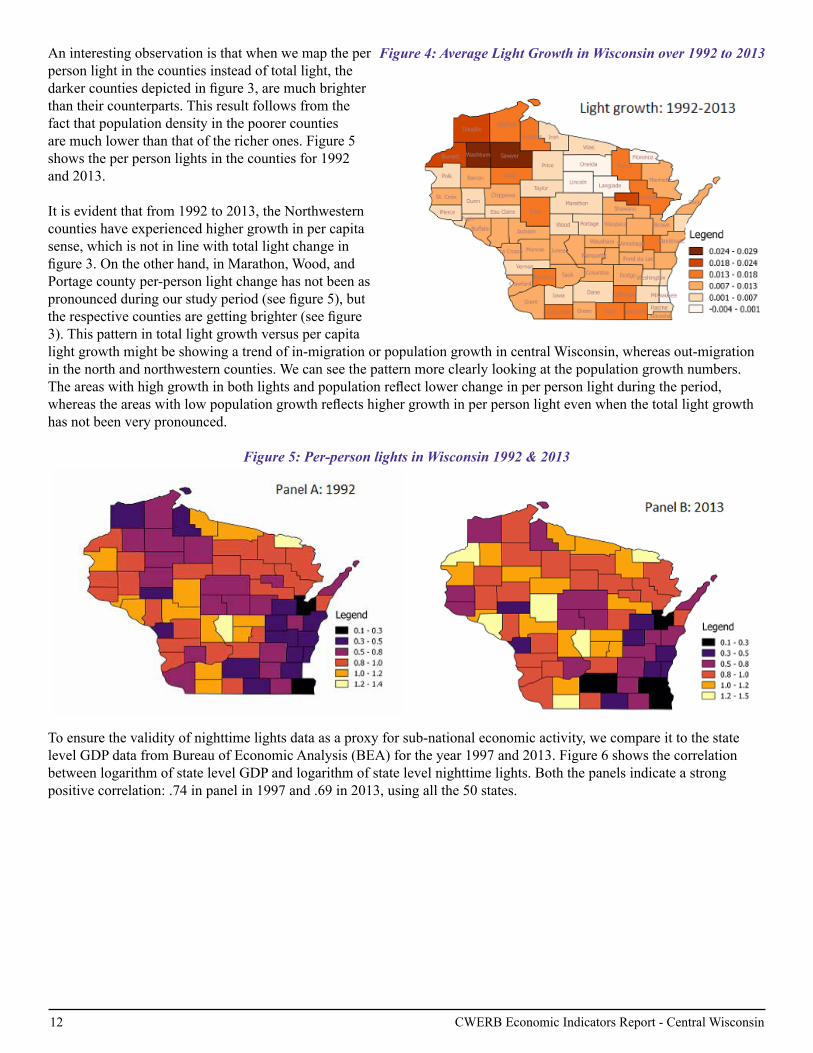
Aninterestingobservationisthatwhenwemaptheperperson light in the counties instead of total light, the darkercountiesdepictedinfigure3,aremuchbrighterthan their counterparts. This result follows from the fact that population density in the poorer counties are much lower than that of the richer ones. Figure 5 shows the per person lights in the counties for 1992 and 2013.
It is evident that from 1992 to 2013, the Northwestern counties have experienced higher growth in per capita sense, which is not in line with total light change in figure3.Ontheotherhand,inMarathon,Wood,andPortage county per-person light change has not been as pronouncedduringourstudyperiod(seefigure5),buttherespectivecountiesaregettingbrighter(seefigure3). This pattern in total light growth versus per capita light growth might be showing a trend of in-migration or population growth in central Wisconsin, whereas out-migration in the north and northwestern counties. We can see the pattern more clearly looking at the population growth numbers. Theareaswithhighgrowthinbothlightsandpopulationreflectlowerchangeinperpersonlightduringtheperiod,whereastheareaswithlowpopulationgrowthreflectshighergrowthinperpersonlightevenwhenthetotallightgrowthhas not been very pronounced.
Figure 5: Per-person lights in Wisconsin 1992 & 2013
To ensure the validity of nighttime lights data as a proxy for sub-national economic activity, we compare it to the state levelGDPdatafromBureauofEconomicAnalysis(BEA)fortheyear1997and2013.Figure6showsthecorrelationbetween logarithm of state level GDP and logarithm of state level nighttime lights. Both the panels indicate a strong positive correlation: .74 in panel in 1997 and .69 in 2013, using all the 50 states.
Figure 4: Average Light Growth in Wisconsin over 1992 to 2013

CWERB Economic Indicators Report - Central Wisconsin 13
Figure 6: Relationship between log lights & log GDP 1997 & 2013w
ConvergenceNext, we investigate the convergence in the growth in light formally at the county level for the whole country, the Midwestern states, and solely Wisconsin. Over the years, a body of literature has emerged on convergence that uses asimplegrowthregressionmodel,firstusedbyRobertBarroinhisseminalwork`Convergence’(1992).Thecentralfocus has been to study the relationship between the initial condition of an area and the respective growth rate, where a significantnegativerelationshipsuggestsconvergence.Toinvestigatethepresenceofabsoluteconvergence,weestimateusing the following equation:
Here, gi,t,t–k is the average growth rate of night lights per capita of the ith county between years t (2013) and t-k (1992); yi,t–k is the initial lights per person in the ith county. ϵisthecountyspecificshock.β in equation (1) represents the rate of absoluteconvergence.Anegativeβ suggests an inverse relationship between initial condition and the growth rate implying that the counties that were darker in the initial years have experienced faster growth in lights than their counterparts. This captures the very essence of sub-regional convergence, where the magnitude of βreflectstherateofconvergence.
We use the same regression framework mentioned above to investigate the county level convergence in per capita lights growthduring1992to2013.First,welookatthewholecountryandthemidwesternstatesseparately.Thefirstcolumnof table 1 shows evidence of absolute convergence at a rate of .4 % over 1992 to 2013 for 3130 counties in all 50 states. In other words, the poorer counties in United States are catching up to their richer counterparts approximately at a rate of .4%.

14 CWERB Economic Indicators Report - Central Wisconsin
Althoughcountylevelconvergenceisestablishedintheliterature,thereisevidenceofstateleveldivergence.Inotherwords, the richer states are growing faster than their counterparts implying divergence at state level, whereas the poorer counties in those states are converging to the richer counties. Moreover, the economic, geographical, and political prospects differ vastly among the states, which often plays a role in state level policy making. Hence, it seems necessary to understand the growth in the counties considering the geographical, historical, political, economic, and demographic conditionsofthestatestheyarelocatedin.Toexplorethegrowthpatternofthecountieswithinspecificstates,weincludethestatefixedeffects(i.e.,dummyvariableforeachstatetakingonebaselinestate)inourabsoluteconvergenceregression. The second column of table 1 shows that the rate of convergence is even higher (.8%) between the poorer and richercountieswhensuchstatefixedeffectsareenforced.Inotherwords,countieswithsimilarstatecharacteristicsarecatching up even faster to the richer counties.
We repeat the same exercise for the midwestern states to investigate if the region shows the same pattern in growth as the whole country. The third and fourth columns of table 1 show that the rate of convergence in the counties located in midwestern states are higher compared to the whole country both considering and not considering the state characteristics.
Theconvergencepatternshownatthecountylevelisinsyncwiththerelatedliteratureinthefield.Thenotionoffastergrowth in the counties with worse initial conditions can be attributed to the commonsense intuition that the poorer counties have more room for improvement than their richer counterparts. The lower initial endowment makes the growth in these counties more responsive to any positive change in economic activity, whereas counties with already higher economic activity have fewer opportunities to grow.
Next, we concentrate on the county level convergence of Wisconsin. First column of table 2 shows that there is no evidenceofcountylevelabsoluteconvergenceinper-capitagrowthinlightsforthestate.Sincefigure3and4suggestthathighper-capitalightmayreflectlowerpopulationgrowthratherthanhighereconomicactivity,weuseinitialpopulationdensity (population per-square mile) and population growth separately in the regression. The second column of table 2 shows that when controlled for such population effects, there has been a convergence in light implying that counties with lower initial light are growing faster over the period, whereas the positive relation between population growth and light growth shows that the counties with higher population growth experience a higher growth in light. This result can be explained intuitively that higher growth attracts more population and higher population contributes to higher growth. Moreover,anegativecoefficientofinitialpopulationdensityreflectsthatthegrowthisfasterinareaswherepopulationdensity were lower to begin with.

CWERB Economic Indicators Report - Central Wisconsin 15
Absoluteconvergenceentailsthattheeconomicdisparitiesbetweencountieswillreduceovertimewithouttheinfluenceof any other factor. In essence, the poorer counties will catch up to the richer ones irrespective of their initial endowment, whichseemstoostrongaconditiontobemet.Hence,absoluteconvergenceisrare.Amorestandardapproachistoexamine if the growth rate of a region converges to a certain long run growth rate conditioned on variables that explain the long run values, such as education, employment, and other demographic structures. In other words, conditional convergence implies that, among counties with similar initial levels of human capital, employment and other demographic factors, the poorer counties will grow faster than their richer counterparts. To examine such conditional convergence in per capita lights among counties, we use percentage of employed population, and percentage population graduated from high school in the initial year (1992) in our regression model.
Acriticismofusingnightlightsdataasanindicatorofeconomicactivityisthatthesensorsmeasuringlightsaremoresensitive towards any change in the lights in the low light areas but may not distinguish a small change when measuring a very brightly lit area. To avoid such a problem of top-coding of lights, we use an indicator if the county includes a metropolitan area or urban agglomeration with population more than 100000. Column 3 of table 2 shows that controlling for long term growth factors, the rate of convergence between counties are even higher. It is also interesting to note that counties with higher human capital (high school graduation percentage) in the initial years are growing faster, whereas the counties with high working population percentage to start with are growing slower than theircounterparts.Thisresultmaybeattributedtothefactthathighemploymentintheinitialyearsreflectshigheconomicactivity to start with and has lower opportunity for improvement. On the contrary, initial high human capital accumulation leads to higher employment opportunities and growth over our study period. Growth and human capitalIn the light of our result that initial human capital accumulation leads to higher growth rates in per capita lights, we investigate the relationship between growth in different levels of human capital with growth in lights in Wisconsin. Human capital, being one of the important determinants of long run growth, are expected to be positively correlated with growth in economic activity.
Theleftpaneloffigure6showsapositivecorrelationofpercapitalighsgrowthwithhighschoolgraduationratesschool,whichisinsyncwithourexpectation.Therightpanelontheotherhandreflectsaslightnegativecorrelationbetweengrowth college graduation rates and the growth in per-capita lights. Such a negative relationship may be attributed to the migrationofcollegegraduatesoutofthestate,asarguedintheliterature.Anotherreasonofsuchnegativerelationshipcanbe derived from the very essence of county level convergence. The counties with higher rate of college graduates may also be the more developed ones. So, due to the intuition of convergence, the growth in light is less pronounced in the areas with higher rate of college graduates.
Figure 6: Relationship between lights growth per capita and a) High school graduation growth, b) college graduation growth in Wisconsin
16 CWERB Economic Indicators Report - Central Wisconsin
ConclusionIn conclusion, this report provides an alternative approach towards measurement of growth in economic activity. The use of nighttime light can supplement other data sources in analyzing local and regional economic conditions. Such detailed measurementcanleadtobetterpolicydecisionsatthefinergeographicallevel.Moreover,theconvergencepatternofgrowth at the county level, evident from the nighttime light data, is in sync with the literature and provides insight towards future policy making. Furthermore, there are several useful extensions that can be derived from the nighttime light’s measurement. For example, we can monitor the effect of an infrastructure building project undertaken at a sub-national level with the use of the same.
ReferencesBarro,R.J.,&Sala-I-Martin,X.(1992).“Convergence”.JournalofPoliticalEconomy,100(2),223251.
Barro,R.J.,&Sala-I-Martin,X.(1995).“EconomicGrowth”.Boston,MA:McGrawHill.
Ganong,Peter,andDanielShoag.“WhyhasregionalincomeconvergenceintheUSdeclined?”JournalofUrbanEconomics 102 (2017): 76-90.
Gennaioli,Nicola,etal.“Growthinregions.”JournalofEconomicgrowth19.3(2014):259-309.
Giannone, Elisa. Skilled-biased technical change and regional convergence. Technical report, University of Chicago Working Paper, 2017.
Henderson,V.,Storeygard,A.,&Weil,D.(2012).“Measuringeconomicgrowthfromouterspace.”AmericanEconomicReview, 102(2), 9941028
Higgins,MatthewJ.,DanielLevy,andAndrewT.Young.“GrowthandconvergenceacrosstheUnitedStates:Evidencefromcounty-leveldata.”TheReviewofEconomicsandStatistics88.4(2006):671-681.
Kulkarni,Rajendra,etal.“Lightbasedgrowthindicator(LBGI):exploratoryanalysisofdevelopingaproxyforlocaleconomicgrowthbasedonnightlights.”RegionalSciencePolicy&Practice3.2(2011):101-113.

MISSION AND VISION
The mission of the UWSP Central Wisconsin Economic Research Bureau is to foster economic development by bringing timely economic analysis to our region, focusing on Marathon, Portage and Wood counties.
The mission has been accomplished through the publication of Economic Indicators Reports. These reports are compiled and released for Central Wisconsin.
The CWERB aspires to be Wisconsin’s premier research center focused on regional economic development.
HISTORY
The CWERB is a nonprofit organization founded in October 1983. Its operating budget comes from the private sector and the UWSP School of Business and Economics. The CWERB also represents an important part of the outreach efforts of the UWSP School of Business and Economics.
PAST SOURCES OF FUNDING • UWSP School of Business and Economics• BMO Harris Bank of Stevens Point• BMO Harris Bank of Marshfield• BMO Harris Bank of Wausau • Centergy Inc. of Wausau• Community Foundation of Greater South Wood County - Wisconsin Rapids
SCHOOL OF BUSINESS & ECONOMICS • Enrollment of 1,000 students; More than 30% of our students come from Marathon, Portage and Wood counties; approximately 50% of our graduates stay in the three-county area • The SBE is in the pre-accreditation phase by the Association to Advance Collegiate Schools of Business (AACSB), once completed, SBE will be among the top 18% of all business schools in the world.
CWERB CLIENTELE • Central Wisconsin business firms are the most crucial component in the economic development of our region. Business firms are keenly aware of the important role that informed decision making plays in any developmental strategy.
• Private sector organizations devoted to economic development in Central Wisconsin, such as area chambers of commerce and their affiliated economic development agencies.
• Public sector organizations devoted to economic development in Central Wisconsin.
• The general public, in order to make informed decisions, take advantage of the unbiased information and analysis about the economy.
• The CWERB employs student research assistants which provides an excellent educational setting while also providing the opportunity for students to earn funds toward education. Faculty, staff and students at UWSP utilize the reports and resources of the CWERB.
CWERB ACTIVITIES Research conducted during the last 25 years by CWERB is disseminated through more than 230 publications, media reports and presentations for the Portage, Marathon and Wood counties. Each report provides an analysis of the economy at the national, state and regional levels, and also contains a special section devoted to a topic of economic significance to the Central Wisconsin region. These special topic reports are often written by UW-Stevens Point faculty members and include current topics such as Medicare, debt and deficits and the Central Wisconsin housing market.
The Economic Indicators Reports are presented on a periodic basis by Professor Emeritus Randy Cray and the author of the special topic report. These reports have received substantial media coverage on a variety of economic matters.
ABOUT THE CENTRAL WISCONSIN ECONOMIC RESEARCH BUREAU

18 CWERB Economic Indicators Report - Central Wisconsin
uwsp.edu/busecon/cwerbfacebook.com/uwspsbe