Economic Indicators NSW (July 2013) - Parliament of NSW€¦ · Economic Indicators NSW (July 2013)...
47
Economic Indicators NSW (July 2013) Statistical Indicators 8/13 By Talina Drabsch
Transcript of Economic Indicators NSW (July 2013) - Parliament of NSW€¦ · Economic Indicators NSW (July 2013)...

Economic Indicators NSW
(July 2013)
Statistical Indicators 8/13
By Talina Drabsch

RELATED PUBLICATIONS
Trends in NSW State Finances: 2003-04 to 2013-14, NSW Parliamentary Research Service Statistical Indicators 7/13 by Lenny Roth
Economic Indicators NSW (April 2013), NSW Parliamentary Research Service Statistical Indicators 5/13 by Talina Drabsch
NSW Regional Labour Force Trends, NSW Parliamentary Research Service Statistical Indicators 3/13 by Daniel Montoya
ISSN 1838-0190
July 2013
© 2013
Except to the extent of the uses permitted under the Copyright Act 1968, no part of this document may be reproduced or transmitted in any form or by any means including information storage and retrieval systems, without the prior consent from the Manager, NSW Parliamentary Research Service, other than by Members of the New South Wales Parliament in the course of
their official duties.

Economic Indicators NSW
(July 2013)
by
Talina Drabsch

NSW PARLIAMENTARY RESEARCH SERVICE
Gareth Griffith (BSc (Econ) (Hons), LLB (Hons), PhD), Manager, Politics & Government/Law .......................................... (02) 9230 2356 Lenny Roth (BCom, LLB), Senior Research Officer, Law ....................................................... (02) 9230 2768 Lynsey Blayden (BA, LLB (Hons)), Research Officer, Law ................................................................. (02) 9230 3085 Talina Drabsch (BA, LLB (Hons)), Research Officer, Social Issues/Law ........................................... (02) 9230 2484 Jack Finegan (BA (Hons), MSc), Research Officer, Environment/Planning..................................... (02) 9230 2906 Daniel Montoya (BEnvSc (Hons), PhD), Research Officer, Environment/Planning ..................................... (02) 9230 2003 John Wilkinson (MA, PhD), Research Officer, Economics ...................................................... (02) 9230 2006
Should Members or their staff require further information about this publication please contact the author.
Information about Research Publications can be found on the Internet at:
http://www.parliament.nsw.gov.au/prod/parlment/publications.nsf/V3LIstRPSubject
Advice on legislation or legal policy issues contained in this paper is provided for use in parliamentary debate and for related parliamentary purposes. This paper is not professional legal opinion.
CONTENTS
SUMMARY .......................................................................................................... i
Interest rates ...................................................................................................... 1
Gross state product ............................................................................................ 2
International trade .............................................................................................. 4
Consumer price index......................................................................................... 8
Employment ..................................................................................................... 10
Unemployment ................................................................................................. 11
Labour force participation ................................................................................. 14
Job vacancies ................................................................................................... 16
Wages .............................................................................................................. 18
Agricultural production and income .................................................................. 19
Business investment......................................................................................... 22
Turnover of retail trade ..................................................................................... 24
Vehicle sales .................................................................................................... 26
Dwelling approvals ........................................................................................... 28
Housing finance ................................................................................................ 30
Bankruptcies ..................................................................................................... 32
Rent .................................................................................................................. 34
Glossary ........................................................................................................... 36

i
SUMMARY
It has been an eventful quarter, with the Federal Budget delivered on 14 May 2013, followed by the NSW Budget on 18 June 2013. There has been a change of Federal Treasurer and interest rates dropped once more, reaching a 50 year low.
The Australian economy appears to be performing well compared to many other industrialised nations. Then Federal Treasurer, Wayne Swan, commented in June 2013 that the Australian economy ‘grew faster than almost every other advanced economy over the year, and three times faster than the OECD average’.1 However, Glenn Stevens, Governor of the Reserve Bank of Australia, has acknowledged that whilst Australia’s growth since the financial crisis has been relatively good at 2.5%, average growth in the decade prior was higher at 3.5%.2
The Australian economy is witnessing some significant transitions at present. The Reserve Bank noted in May 2013 that a peak in the level of resources sector investment is likely to occur this year and that ‘there has been a strengthening in consumption and a modest firming in dwelling investment, and prospects are for some increase in business investment outside the resources sector over the next year’.3
The July 2013 State of the States Report by CommSec assessed the strengths and weaknesses of the individual States and Territories as follows, with NSW’s strength deemed to be its job market whilst economic growth remains its weakness: Strength Weakness
NSW Job market Economic growth Victoria Housing finance Construction work Queensland Retail spending Population growth South Australia Construction work Retail spending Western Australia Retail spending Unemployment Tasmania Housing pickup Various Northern Territory Economic growth Unemployment ACT Population growth Retail spending
When compared to decade averages, Western Australia remains the top performing economy. The ACT is now in second place ahead of the Northern Territory in third. NSW is in fourth position followed by Victoria and Queensland. South Australia and Tasmania bring up the rear, with their economies continuing to under-perform. NSW is considered to be in the strongest position
1 The Hon Wayne Swan MP, Treasurer’s Economic Note, 9/6/13.
2 Glenn Stevens, ‘Economic conditions and prospects’, Address to the Economic Society
of Australia (Queensland) 2013 Business Luncheon, 3/7/13.
3 Reserve Bank of Australia, Media Release, 7/5/13.

regarding unemployment and third strongest in relation to population growth. CommSec concluded that ‘while new investment in mining and engineering construction is easing, the housing sector is providing a source of new growth, especially in regions where population growth is strongest’.
The NSW State Budget was delivered on 18 June 2013. The NSW Treasurer, Mike Baird, noted that economic growth in NSW in 2012/13 was 2.5% and employment growth at 1.5%, with the Budget expected to reach a surplus in 2014/15.4 The decline in the value of the Australian dollar in the last couple of months is predicted to ease pressure on the manufacturing, tourism and international education sectors in NSW.5
This July 2013 edition of Economics Indicators: NSW updates statistical information on key economic indicators, thereby presenting an updated snapshot of the NSW economy and providing relevant points of comparison with other Australian States and Territories. Statistics are updated to the end of the most recent quarter available. Most indicators have thus been updated to include the March or June 2013 quarters. There are no updates to the sections on Gross State Product, wages, agricultural production and income, and business investment.
For New South Wales, the direction in which the quarterly averages for each indicator moved since the April 2013 edition is summarised on the following page.
4 NSW Treasurer, Budget Speech 2013-14, p 3.
5 Deloitte Access Economics, Business Outlook, June 2013, p 95.

iii
Employment
Unemployment Labour force participation rate
Retail turnover
Vehicle sales
Bankruptcies
Rent
Interest rates
Imports and exports
Change in the Consumer Price Index
Job vacancies
Dwelling approvals
Average loan size for first home buyers
Sources used
The major source for much of the information in this paper is data collected by the Australian Bureau of Statistics. The figures used are the original numbers, unless otherwise indicated. Sources other than the Australian Bureau of Statistics have been used where relevant and are identified in the paper itself.


Economic Indicators: NSW
1
INTEREST RATES
Following the deliberations of the Board of the Reserve Bank of Australia in early May 2013, the cash rate dropped to 2.75% as of 8 May 2013. This is the lowest cash rate in 50 years. Glenn Stevens, Governor of the Reserve Bank of Australia, noted in the reasons for the Board’s monetary policy decision that there was room in the inflation outlook to ease the cash rate in order to support demand:
.. a further decline in the cash rate was appropriate to encourage sustainable growth in the economy, consistent with achieving the inflation target.
6
It was also identified that:
Over recent meetings, the Board has noted that interest rates have already been reduced substantially, with borrowing rates approaching previous lows, and that the effects of this on the economy are continuing to emerge. Savers have been changing their portfolios towards assets with higher expected returns, asset values have risen and some interest-sensitive areas of spending have increased.
The exchange rate, on the other hand, has been little changed at a historically high level over the past 18 months, which is unusual given the decline in export prices and interest rates during that time. Moreover, the demand for credit remains, at this point, relatively subdued.
Low interest rates are deemed to have a particularly positive impact on the NSW economy as a result of the number of large mortgages in NSW and the size of the financial sector in Sydney.7
0
1
2
3
4
5
6
7
8
%
Cash rate
Source: Reserve Bank of Australia, ‘Cash rate target’, www.rba.gov.au
6 Reserve Bank of Australia, Media Release, 7/5/13.
7 Deloitte Access Economics, Business Outlook, June 2013, p 95.

NSW Parliamentary Library Research Service
2
GROSS STATE PRODUCT
Gross State Product (GSP) grew by 2.4% between June 2011 and 2012, a little down on the 2.6% increase in the 12 months prior to that. However, this was the third highest growth of the States behind Western Australia (6.7%) and Queensland (4%).
GSP per capita is currently $60,807 in NSW, compared to an Australian average of $63,754. Western Australia has the highest GSP per capita of the States and Territories at $99,065.
Gross State Product, chain volume measures, $m NSW VIC QLD SA WA TAS NT ACT AUS
(GDP)
Jun-2005 384326 271947 222819 77531 169362 21801 13806 25025 1190111
Jun-2006 392503 277691 235394 78657 177637 22327 14264 25528 1226323
Jun-2007 400747 288274 248820 80199 188705 22937 15079 26645 1272776
Jun-2008 412244 298320 260796 84855 195973 23592 16135 27483 1320746
Jun-2009 416293 301548 263465 86450 204354 24154 16917 28618 1342514
Jun-2010 424547 307193 267221 87346 213151 24168 17118 29509 1370540
Jun-2011 435547 315571 269880 89322 221574 24218 17322 30455 1403888
Jun-2012 446169 322833 280622 91217 236338 24345 18086 31511 1451120
Source: ABS, Australian National Accounts, State Accounts 2011-12, 5220.0, November 2012
350000360000370000380000390000400000410000420000430000440000450000460000
2005 2006 2007 2008 2009 2010 2011 2012
$M
Gross state product, NSW, Chain volume measures

Economic Indicators: NSW
3
0
50000
100000
150000
200000
250000
300000
350000
400000
450000
500000
NSW VIC QLD SA WA TAS NT ACT
$m
Gross state product, year ending June 2012
0
20000
40000
60000
80000
100000
120000
NSW VIC QLD SA WA TAS NT ACT AUS (GDP)
$
GSP per capita, chain volume measure, year ending June 2012
0.0
1.0
2.0
3.0
4.0
5.0
6.0
7.0
8.0
NSW VIC QLD SA WA TAS NT ACT AUS (GDP)
GSP, % change , June 2011 to June 2012

NSW Parliamentary Library Research Service
4
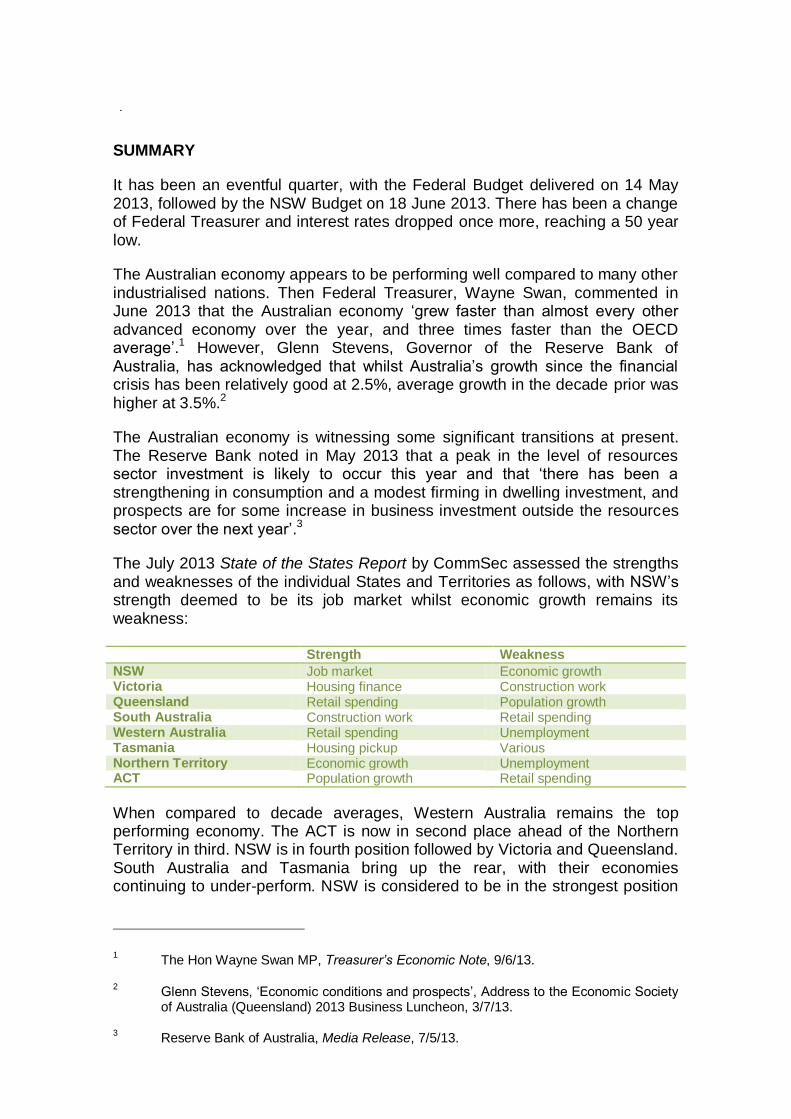
INTERNATIONAL TRADE
Exports
The average monthly free on board (FOB) value of merchandise exports
from NSW fell by 10% in the March 2013 quarter to $2.835 billion. Western Australia continued to dominate the States and Territories in terms of the amount exported (an average of $9.5 billion per month), followed by Queensland at $3.172 billion (down 19% from the previous quarter). NSW exported the third highest amount.
The top five destinations for merchandise exports from NSW for the month
of May 2013 only were: Japan ($867M – up from $762M); China ($530M – up from $429M); Korea ($259M – up from $249M); New Zealand ($182M – up from $150M); and Taiwan ($166M – up from $159M). 62% of exports were to the top five destinations, with 27% of all exports to Japan alone.
Imports
The average monthly customs value of merchandise imports for NSW fell
by 13% in the March 2013 quarter to $6.549 billion. NSW continues to import the greatest amount of the States and Territories, followed by Victoria at $4.6 billion (down 11%).
The top five import sources for NSW in the month of May 2013 only were: China ($1809M – up from $1579M); the United States of America ($780M – up from $709M); Japan ($555M – up from $415M); Germany ($355M – up from $274M); and Korea ($307M – up from $227M). Singapore and Thailand shifted out of the top five into sixth and seventh position respectively, being replaced by Germany and Korea. 52% of all imports were from the top five sources, with 25% from China alone.

Economic Indicators: NSW
5
Average monthly merchandise exports per quarter, FOB Value, $m
NSW VIC QLD SA WA TAS NT ACT
Mar-08 2372 1598 2413 780 5794 264 363 0
Jun-08 2774 1775 3797 961 6650 338 470 0
Sep-08 3123 1805 5229 916 7600 296 558 2
Dec-08 3930 1984 6003 832 7756 315 611 1
Mar-09 3175 1527 3945 721 7699 269 523 1
Jun-09 2697 1475 3674 706 5905 290 406 0
Sep-09 2635 1462 3494 677 5841 227 375 0
Dec-09 2491 1561 3306 668 6213 237 437 1
Mar-10 2356 1480 3023 590 6694 233 407 0
Jun-10 2920 1639 4599 776 9022 305 441 0
Sep-10 3004 1592 4832 836 9101 263 453 0
Dec-10 3000 1651 4250 880 9220 281 506 0
Mar-11 2866 1575 3024 979 9049 245 412 0
Jun-11 3253 1732 4345 1036 10020 273 395 0
Sep-11 3546 1805 4981 977 10667 276 473 1
Dec-11 3512 1839 4892 987 10439 258 456 0
Mar-12 2996 1639 3726 869 8805 272 401 0
Jun-12 3459 1916 4023 970 10267 251 428 3
Sep-12 3210 1792 3832 884 9380 240 546 0
Dec-12 3165 1773 3937 828 9416 253 476 1
Mar-13 2835 1710 3172 891 9541 281 451 2 Source: ABS, International trade in goods and services, Australia, May 2013, 5368.0, July 2013
Average monthly merchandise imports per quarter, customs value, $m
NSW VIC QLD SA WA TAS NT ACT
Mar-08 6175 4612 2701 607 2353 50 232 2
Jun-08 6493 4898 2966 669 2615 67 259 2
Sep-08 6830 5322 3353 655 2861 101 380 0
Dec-08 7517 5382 3316 651 3110 97 362 1
Mar-09 6083 4215 2293 527 2919 54 434 1
Jun-09 5901 3900 2362 456 2151 66 272 0
Sep-09 6268 4359 2551 516 2202 61 269 1
Dec-09 6527 4559 2591 587 2571 81 257 0
Mar-10 5975 4301 2511 515 2174 47 240 0
Jun-10 6564 4487 2692 531 2366 49 250 0
Sep-10 7093 4943 2720 523 2010 50 344 0
Dec-10 6991 4862 2781 530 2216 63 324 1
Mar-11 6330 4473 2671 544 2153 47 291 0
Jun-11 6747 4658 2857 579 2273 52 270 1
Sep-11 7213 4995 3258 612 3042 52 368 2
Dec-11 7652 5217 3287 616 2710 153 389 1
Mar-12 6761 4721 3277 568 3145 55 349 0
Jun-12 7159 4942 3448 625 2797 51 278 4
Sep-12 7246 5009 3602 615 3081 49 371 1
Dec-12 7536 5148 3894 621 2914 65 598 0
Mar-13 6549 4577 3400 541 2572 62 360 2 Source: ABS, International trade in goods and services, Australia, May 2013, 5368.0, July 2013

NSW Parliamentary Library Research Service
6
0
1000
2000
3000
4000
5000
6000
7000
8000
9000
$M
Merchandise exports and imports, NSW
Exports Imports
-50%
-40%
-30%
-20%
-10%
0%
10%
20%
NSW VIC QLD SA WA TAS NT
% change in exports and imports, December 2012 to March 2013 quarters
Exports Imports
Economic Indicators: NSW
7
0
2000
4000
6000
8000
10000
12000
NSW VIC QLD SA WA TAS NT ACT
$m
Merchandise exports per month, March 2013 quarter
0
1000
2000
3000
4000
5000
6000
7000
NSW VIC QLD SA WA TAS NT ACT
$m
Merchandise imports per month, customs value,
March 2013 quarter

NSW Parliamentary Library Research Service
8
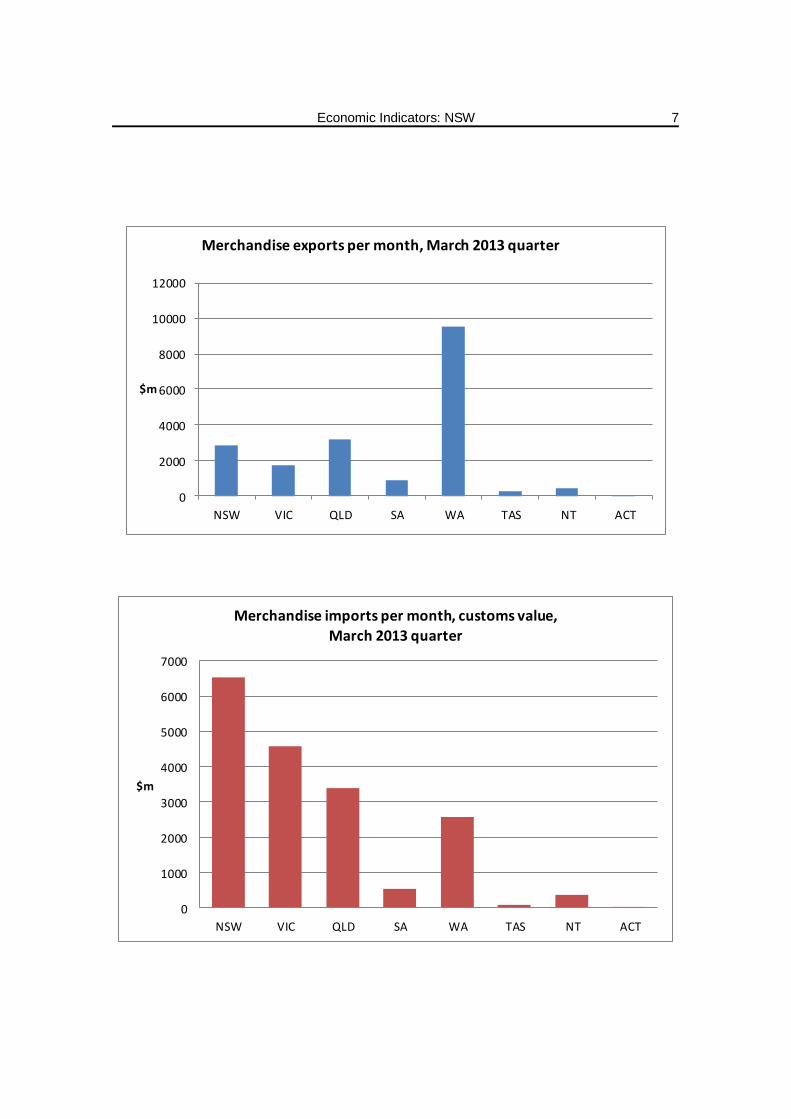
CONSUMER PRICE INDEX
The change in the Consumer Price Index (CPI) for all groups in Sydney between June 2012 and June 2013 was an increase of 2.6% (higher than the Australian average of 2.4%). However, this was less than the change in the CPI between March 2012 and March 2013, when it rose by 2.8%.
The largest price increases across the year in Sydney occurred in the following groups: health (up by 6.69%); education (up by 5.95%); and housing (up by 5.54%). Within the sub-groups, utilities were once again 14.4% more than a year previously in Sydney, with the price of electricity increasing by 19.3% and gas and other household fuels up by 14.8%. There was also a big increase in the price of insurance (up by 11.5%) and tobacco (up by 9.3%).
CPI – All groups – Capital cities
SYD MELB BRIS ADEL PERTH HOB DAR CAN AUS
Mar-2008 90.3 90.7 89.6 90.1 90.5 90.5 89.6 90.5 90.3
Jun-2008 91.7 91.8 91.1 91.3 92.0 91.5 90.9 91.6 91.6
Sep-2008 92.7 92.9 92.4 92.5 92.9 92.5 92.5 93.0 92.7
Dec-2008 92.4 92.3 92.2 92.2 92.6 92.3 92.1 92.6 92.4
Mar-2009 92.5 92.6 92.4 92.2 92.5 92.5 92.2 92.9 92.5
Jun-2009 92.9 92.9 92.9 92.7 93.3 93.0 93.2 93.5 92.9
Sep-2009 93.9 93.4 94.2 93.7 94.0 94.1 95.0 94.3 93.8
Dec-2009 94.4 94.0 94.5 94.1 94.5 94.7 94.9 94.7 94.3
Mar-2010 95.2 95.2 95.2 94.6 95.6 95.4 95.4 95.3 95.2
Jun-2010 95.6 95.8 95.9 95.3 96.5 95.8 96.2 95.6 95.8
Sep-2010 96.3 96.3 96.9 96.2 96.9 96.8 97.2 96.3 96.5
Dec-2010 96.7 96.9 97.4 96.5 97.0 96.9 97.1 96.7 96.9
Mar-2011 98.2 98.5 98.6 98.1 98.1 98.2 98.2 98.1 98.3
Jun-2011 99.2 99.2 99.6 99.0 99.4 99.1 99.2 99.2 99.2
Sep-2011 99.9 99.8 99.9 100.0 99.6 99.9 99.9 99.8 99.8
Dec-2011 99.8 99.9 99.7 100.0 99.8 100.0 99.5 100.1 99.8
Mar-2012 99.9 99.9 99.9 99.9 100.0 100.3 99.9 99.7 99.9
Jun-2012 100.5 100.4 100.5 100.2 100.5 99.9 100.7 100.3 100.4
Sep-2012 102.2 101.6 101.6 101.7 101.6 100.6 102.0 101.4 101.8
Dec-2012 102.3 102.0 101.9 102.1 101.9 101.0 102.0 101.8 102.0
Mar-2013 102.7 102.4 102.0 102.1 102.4 101.3 103.7 101.9 102.4
Jun-2013 103.1 102.6 102.5 102.3 103.0 101.7 104.6 102.5 102.8
Source: ABS, Consumer Price Index, Australia, June 2013, 6401.0, July 2013.
Economic Indicators: NSW
9
0.0
1.0
2.0
3.0
4.0
5.0
6.0
CPI - % change from corresponding quarter of previous year
Sydney Australia
0.00
0.50
1.00
1.50
2.00
2.50
3.00
3.50
4.00
4.50
SYD MELB BRIS ADEL PERTH HOB DAR CAN AUS
CPI, all groups, % change from June 2012 to June 2013
-4.00%
-2.00%
0.00%
2.00%
4.00%
6.00%
8.00%
CPI, Sydney, groups, % change between June 2012 and 2013
NSW Parliamentary Library Research Service
10
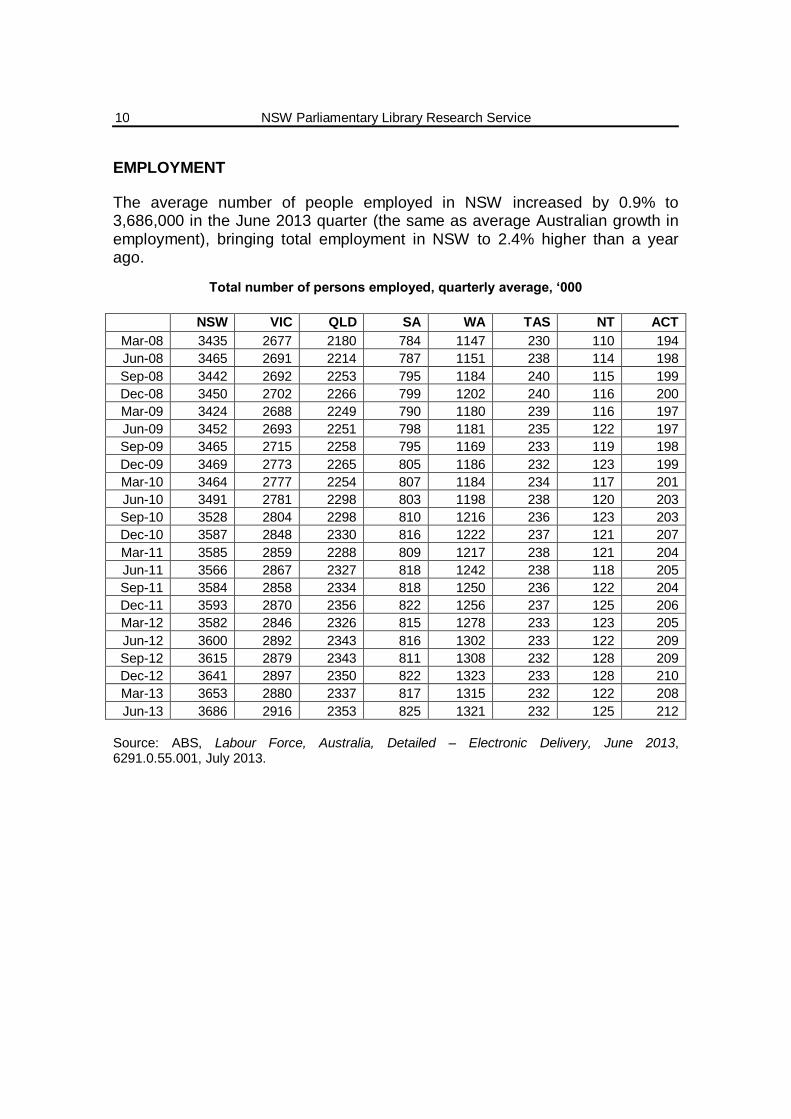
EMPLOYMENT
The average number of people employed in NSW increased by 0.9% to 3,686,000 in the June 2013 quarter (the same as average Australian growth in employment), bringing total employment in NSW to 2.4% higher than a year ago.
Total number of persons employed, quarterly average, ‘000
NSW VIC QLD SA WA TAS NT ACT
Mar-08 3435 2677 2180 784 1147 230 110 194
Jun-08 3465 2691 2214 787 1151 238 114 198
Sep-08 3442 2692 2253 795 1184 240 115 199
Dec-08 3450 2702 2266 799 1202 240 116 200
Mar-09 3424 2688 2249 790 1180 239 116 197
Jun-09 3452 2693 2251 798 1181 235 122 197
Sep-09 3465 2715 2258 795 1169 233 119 198
Dec-09 3469 2773 2265 805 1186 232 123 199
Mar-10 3464 2777 2254 807 1184 234 117 201
Jun-10 3491 2781 2298 803 1198 238 120 203
Sep-10 3528 2804 2298 810 1216 236 123 203
Dec-10 3587 2848 2330 816 1222 237 121 207
Mar-11 3585 2859 2288 809 1217 238 121 204
Jun-11 3566 2867 2327 818 1242 238 118 205
Sep-11 3584 2858 2334 818 1250 236 122 204
Dec-11 3593 2870 2356 822 1256 237 125 206
Mar-12 3582 2846 2326 815 1278 233 123 205
Jun-12 3600 2892 2343 816 1302 233 122 209
Sep-12 3615 2879 2343 811 1308 232 128 209
Dec-12 3641 2897 2350 822 1323 233 128 210
Mar-13 3653 2880 2337 817 1315 232 122 208
Jun-13 3686 2916 2353 825 1321 232 125 212
Source: ABS, Labour Force, Australia, Detailed – Electronic Delivery, June 2013, 6291.0.55.001, July 2013.

Economic Indicators: NSW
11
320032503300335034003450350035503600365037003750
'000
Employment, NSW
-0.5%
0.0%
0.5%
1.0%
1.5%
2.0%
2.5%
NSW VIC QLD SA WA TAS NT ACT
Number of employed, % change in quarterly average
March to June 2013
NSW Parliamentary Library Research Service
12
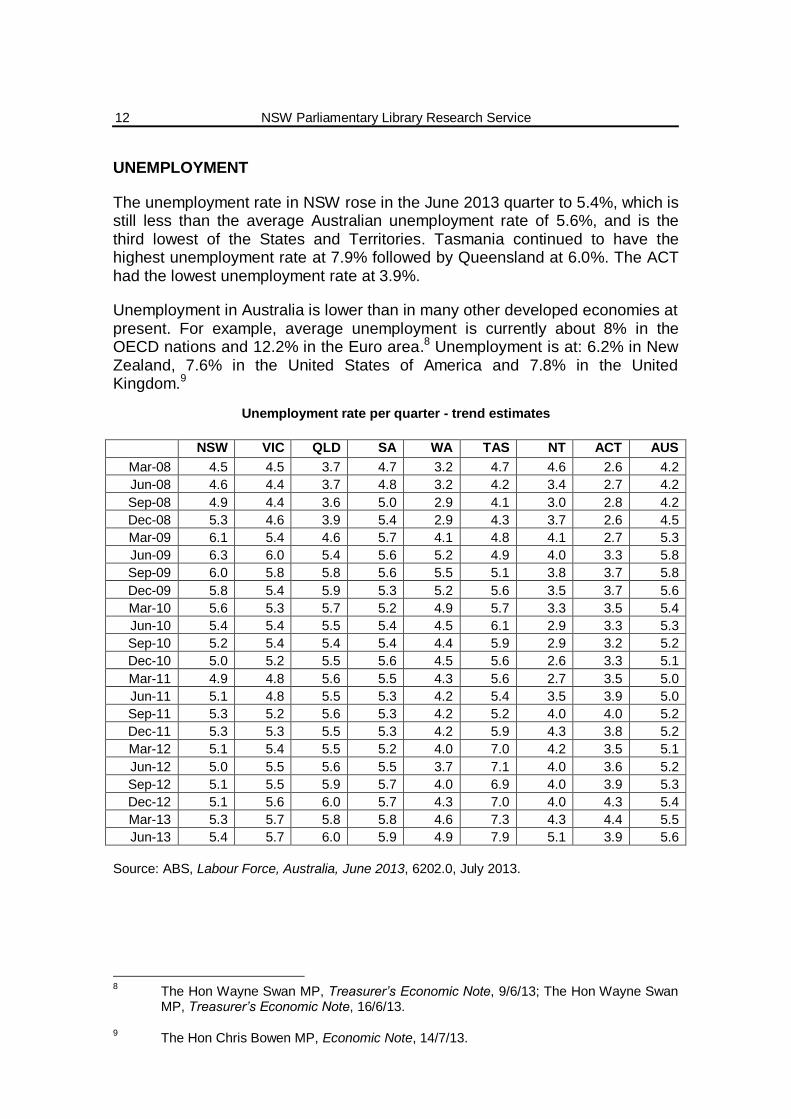
UNEMPLOYMENT
The unemployment rate in NSW rose in the June 2013 quarter to 5.4%, which is still less than the average Australian unemployment rate of 5.6%, and is the third lowest of the States and Territories. Tasmania continued to have the highest unemployment rate at 7.9% followed by Queensland at 6.0%. The ACT had the lowest unemployment rate at 3.9%.
Unemployment in Australia is lower than in many other developed economies at present. For example, average unemployment is currently about 8% in the OECD nations and 12.2% in the Euro area.8 Unemployment is at: 6.2% in New Zealand, 7.6% in the United States of America and 7.8% in the United Kingdom.9
Unemployment rate per quarter - trend estimates
NSW VIC QLD SA WA TAS NT ACT AUS
Mar-08 4.5 4.5 3.7 4.7 3.2 4.7 4.6 2.6 4.2
Jun-08 4.6 4.4 3.7 4.8 3.2 4.2 3.4 2.7 4.2
Sep-08 4.9 4.4 3.6 5.0 2.9 4.1 3.0 2.8 4.2
Dec-08 5.3 4.6 3.9 5.4 2.9 4.3 3.7 2.6 4.5
Mar-09 6.1 5.4 4.6 5.7 4.1 4.8 4.1 2.7 5.3
Jun-09 6.3 6.0 5.4 5.6 5.2 4.9 4.0 3.3 5.8
Sep-09 6.0 5.8 5.8 5.6 5.5 5.1 3.8 3.7 5.8
Dec-09 5.8 5.4 5.9 5.3 5.2 5.6 3.5 3.7 5.6
Mar-10 5.6 5.3 5.7 5.2 4.9 5.7 3.3 3.5 5.4
Jun-10 5.4 5.4 5.5 5.4 4.5 6.1 2.9 3.3 5.3
Sep-10 5.2 5.4 5.4 5.4 4.4 5.9 2.9 3.2 5.2
Dec-10 5.0 5.2 5.5 5.6 4.5 5.6 2.6 3.3 5.1
Mar-11 4.9 4.8 5.6 5.5 4.3 5.6 2.7 3.5 5.0
Jun-11 5.1 4.8 5.5 5.3 4.2 5.4 3.5 3.9 5.0
Sep-11 5.3 5.2 5.6 5.3 4.2 5.2 4.0 4.0 5.2
Dec-11 5.3 5.3 5.5 5.3 4.2 5.9 4.3 3.8 5.2
Mar-12 5.1 5.4 5.5 5.2 4.0 7.0 4.2 3.5 5.1
Jun-12 5.0 5.5 5.6 5.5 3.7 7.1 4.0 3.6 5.2
Sep-12 5.1 5.5 5.9 5.7 4.0 6.9 4.0 3.9 5.3
Dec-12 5.1 5.6 6.0 5.7 4.3 7.0 4.0 4.3 5.4
Mar-13 5.3 5.7 5.8 5.8 4.6 7.3 4.3 4.4 5.5
Jun-13 5.4 5.7 6.0 5.9 4.9 7.9 5.1 3.9 5.6
Source: ABS, Labour Force, Australia, June 2013, 6202.0, July 2013.
8 The Hon Wayne Swan MP, Treasurer’s Economic Note, 9/6/13; The Hon Wayne Swan
MP, Treasurer’s Economic Note, 16/6/13.
9 The Hon Chris Bowen MP, Economic Note, 14/7/13.

Economic Indicators: NSW
13
0.0
1.0
2.0
3.0
4.0
5.0
6.0
7.0
%
Unemployment rate, NSW
0.0
1.0
2.0
3.0
4.0
5.0
6.0
7.0
8.0
9.0
NSW VIC QLD SA WA TAS NT ACT AUS
%
Average unemployment rateJune 2013 quarter

NSW Parliamentary Library Research Service
14
LABOUR FORCE PARTICIPATION
The labour force participation rate in NSW increased in the June 2013 quarter to 64.1% (the Australian average was 65.3%). Only South Australia and Tasmania have lower participation rates than NSW. The highest labour force participation rate is in the Northern Territory (74.1%).
Average labour force participation rate per quarter
NSW VIC QLD SA WA TAS NT ACT AUS
Mar-08 64.1 65.4 66.9 63.2 68.8 60.8 72.1 72.6 65.5
Jun-08 64.3 65.3 67.3 63.1 68.4 61.7 73.3 73.4 65.6
Sep-08 63.6 64.7 67.7 63.4 69.3 62.3 72.0 73.6 65.5
Dec-08 63.7 64.6 67.7 63.9 69.6 62.4 73.1 73.3 65.5
Mar-09 64.0 64.9 68.0 63.7 69.2 62.1 73.5 72.2 65.7
Jun-09 64.0 64.7 67.6 63.5 69.2 61.0 76.3 72.3 65.6
Sep-09 63.5 64.7 67.6 63.0 68.4 60.5 73.6 72.2 65.2
Dec-09 63.5 65.4 67.4 63.4 68.3 60.4 75.2 72.5 65.4
Mar-10 63.2 65.6 67.3 63.5 68.5 61.1 72.1 73.3 65.4
Jun-10 63.1 65.2 67.8 63.0 68.0 61.7 72.6 73.1 65.3
Sep-10 63.3 65.4 67.2 63.2 68.7 61.2 74.3 72.6 65.4
Dec-10 64.1 65.9 68.0 63.8 68.4 61.1 72.7 73.6 65.9
Mar-11 64.1 66.1 67.2 63.5 68.0 61.5 72.9 72.9 65.8
Jun-11 63.5 65.7 67.2 63.5 68.5 60.7 71.4 73.2 65.5
Sep-11 63.7 65.5 67.3 63.2 68.4 60.0 73.0 72.2 65.5
Dec-11 63.7 65.4 67.4 63.5 68.0 61.0 75.4 72.2 65.5
Mar-12 63.3 65.2 67.0 63.1 69.0 60.8 74.1 72.2 65.3
Jun-12 63.3 65.7 66.5 62.9 69.2 60.3 73.0 72.7 65.3
Sep-12 63.2 65.1 66.4 62.3 69.0 60.1 74.9 72.4 65.1
Dec-12 63.5 65.1 66.3 63.1 69.3 60.5 75.3 72.5 65.2
Mar-13 63.9 65.1 66.1 63.1 68.9 60.5 72.3 72.4 65.3
Jun-13 64.1 65.2 65.8 63.1 68.7 60.3 74.1 72.6 65.3
Source: ABS, Labour Force, Australia, Detailed – Electronic Delivery, June 2013, 6291.0.55.001, July 2013.

Economic Indicators: NSW
15
60.0
60.5
61.0
61.5
62.0
62.5
63.0
63.5
64.0
64.5
65.0
Jan
-08
Ap
r-0
8
Jul-
08
Oct
-08
Jan
-09
Ap
r-0
9
Jul-
09
Oct
-09
Jan
-10
Ap
r-1
0
Jul-
10
Oct
-10
Jan
-11
Ap
r-1
1
Jul-
11
Oct
-11
Jan
-12
Ap
r-1
2
Jul-
12
Oct
-12
Jan
-13
Ap
r-1
3
%
Participation rate, NSW
0.0
10.0
20.0
30.0
40.0
50.0
60.0
70.0
80.0
NSW VIC QLD SA WA TAS NT ACT AUS
%
Labour force participation rate June 2013 quarter
-1.0%
-0.5%
0.0%
0.5%
1.0%
1.5%
2.0%
2.5%
3.0%
NSW VIC QLD SA WA TAS NT ACT AUS
% change in labour force participation rate March to June 2013 quarters

NSW Parliamentary Library Research Service
16
JOB VACANCIES
The number of job vacancies in NSW fell by 17% in the May 2013 quarter to 37,100. There was an average decrease of 7.3% in the number of job vacancies across Australia. Victoria, Queensland and the Northern Territory were the only jurisdictions where the number of job vacancies increased.
Number of job vacancies, '000, Original figures
NSW VIC QLD SA WA TAS NT ACT AUS
Nov 2009 46.3 32.6 27.9 11.0 21.8 2.0 2.9 6.2 150.8 Feb 2010 50.3 33.3 31.6 13.3 27.6 2.8 4.4 5.8 169.0
May 2010 47.5 36.8 28.5 14.3 27.0 1.7 4.1 4.7 164.7
Aug 2010 52.9 40.2 33.4 13.3 28.4 2.6 4.3 6.2 181.4 Nov 2010 50.1 46.0 37.4 16.6 30.3 2.6 3.9 6.8 193.7 Feb 2011 49.2 47.7 38.3 10.7 31.5 2.3 3.8 6.2 189.9 May 2011 47.3 40.8 41.6 10.4 28.0 2.3 4.2 6.4 181.0
Aug 2011 47.1 41.9 44.6 8.9 32.8 2.3 3.1 6.0 186.7
Nov 2011 49.0 38.1 43.4 8.6 32.5 2.6 2.6 4.9 181.6 Feb 2012 52.6 40.1 36.1 10.8 31.6 1.9 3.2 5.8 182.2 May 2012 45.2 32.9 43.1 10.4 31.3 2.0 2.3 4.7 172.1 Aug 2012 48.2 36.6 34.8 11.1 37.6 2.5 3.2 4.7 178.7
Nov 2012 45.9 38.7 30.7 10.8 32.4 2.1 2.6 3.9 167.1 Feb 2013 44.7 31.9 26.0 8.5 31.1 2.2 2.7 2.8 149.8 May 2013 37.1 33.7 27.2 6.0 27.1 1.7 3.2 2.8 138.9
Source: ABS, Job Vacancies, Australia, May 2013, 6354.0, June 2013.

Economic Indicators: NSW
17
0.0
5.0
10.0
15.0
20.0
25.0
30.0
35.0
40.0
NSW VIC QLD SA WA TAS NT ACT
Number of job vacancies, May 2013, '000
-40.0%
-30.0%
-20.0%
-10.0%
0.0%
10.0%
20.0%
30.0%
NSW VIC QLD SA WA TAS NT ACT AUS
% change in job vacancies, February to May 2013
NSW Parliamentary Library Research Service
18
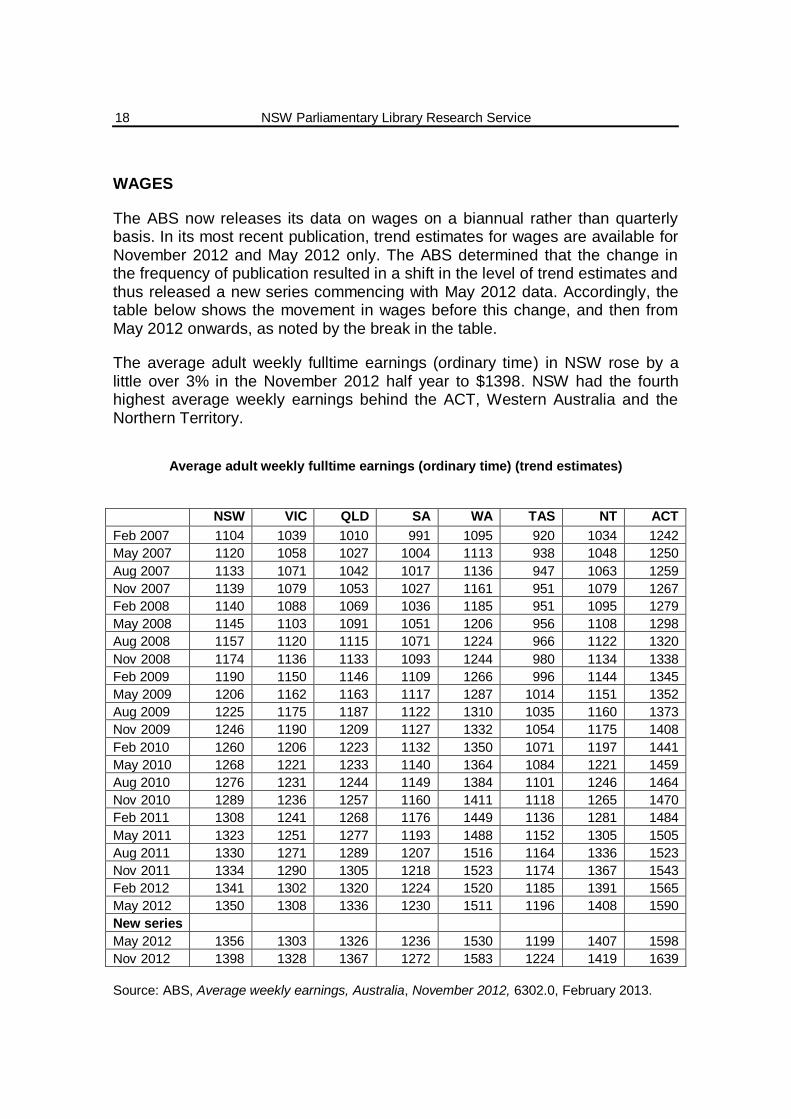
WAGES
The ABS now releases its data on wages on a biannual rather than quarterly basis. In its most recent publication, trend estimates for wages are available for November 2012 and May 2012 only. The ABS determined that the change in the frequency of publication resulted in a shift in the level of trend estimates and thus released a new series commencing with May 2012 data. Accordingly, the table below shows the movement in wages before this change, and then from May 2012 onwards, as noted by the break in the table.
The average adult weekly fulltime earnings (ordinary time) in NSW rose by a little over 3% in the November 2012 half year to $1398. NSW had the fourth highest average weekly earnings behind the ACT, Western Australia and the Northern Territory.
Average adult weekly fulltime earnings (ordinary time) (trend estimates)
NSW VIC QLD SA WA TAS NT ACT
Feb 2007 1104 1039 1010 991 1095 920 1034 1242
May 2007 1120 1058 1027 1004 1113 938 1048 1250
Aug 2007 1133 1071 1042 1017 1136 947 1063 1259
Nov 2007 1139 1079 1053 1027 1161 951 1079 1267
Feb 2008 1140 1088 1069 1036 1185 951 1095 1279
May 2008 1145 1103 1091 1051 1206 956 1108 1298
Aug 2008 1157 1120 1115 1071 1224 966 1122 1320
Nov 2008 1174 1136 1133 1093 1244 980 1134 1338
Feb 2009 1190 1150 1146 1109 1266 996 1144 1345
May 2009 1206 1162 1163 1117 1287 1014 1151 1352
Aug 2009 1225 1175 1187 1122 1310 1035 1160 1373
Nov 2009 1246 1190 1209 1127 1332 1054 1175 1408
Feb 2010 1260 1206 1223 1132 1350 1071 1197 1441
May 2010 1268 1221 1233 1140 1364 1084 1221 1459
Aug 2010 1276 1231 1244 1149 1384 1101 1246 1464
Nov 2010 1289 1236 1257 1160 1411 1118 1265 1470
Feb 2011 1308 1241 1268 1176 1449 1136 1281 1484
May 2011 1323 1251 1277 1193 1488 1152 1305 1505
Aug 2011 1330 1271 1289 1207 1516 1164 1336 1523
Nov 2011 1334 1290 1305 1218 1523 1174 1367 1543
Feb 2012 1341 1302 1320 1224 1520 1185 1391 1565
May 2012 1350 1308 1336 1230 1511 1196 1408 1590
New series
May 2012 1356 1303 1326 1236 1530 1199 1407 1598
Nov 2012 1398 1328 1367 1272 1583 1224 1419 1639
Source: ABS, Average weekly earnings, Australia, November 2012, 6302.0, February 2013.

Economic Indicators: NSW
19
0
200
400
600
800
1000
1200
1400
1600
1800
NSW VIC QLD SA WA TAS NT ACT
Average adult weekly fulltime earningsOrdinarytime - November 2012 - trend estimates
0.0%
0.5%
1.0%
1.5%
2.0%
2.5%
3.0%
3.5%
4.0%
NSW VIC QLD SA WA TAS NT ACT
% change in average adult weekly fulltime earnings
May to November 2012 quarters

NSW Parliamentary Library Research Service
20
AGRICULTURAL PRODUCTION AND INCOME
The gross value of agricultural production in NSW fell slightly in the year ending June 2012 to $15.3 billion. NSW recorded the second highest gross value in agricultural production in Australia, after Victoria.
Agricultural income in NSW was $2.005 billion in the year ending June 2012.
Gross value of agricultural production, $m
NSW VIC QLD SA WA TAS NT ACT
Jun-2005 12312 11088 11935 5554 6911 1247 461 32
Jun-2006 12563 11780 12581 6109 7937 1332 426 34
Jun-2007 10734 10999 13064 5273 6546 1337 478 30
Jun-2008 12137 14590 12159 7076 9242 1563 583 32
Jun-2009 12978 13319 13481 6670 9553 1628 556 30
Jun-2010 11211 13985 13095 6451 7446 1405 562 23
Jun-2011 15367 16250 13728 8452 7054 1599 591 25
Jun-2012 15349 16569 14101 8775 7934 1616 609 24
Source: ABS, Australian National Accounts, State Accounts 2011-12, 5220.0, November 2012

Economic Indicators: NSW
21
0
2000
4000
6000
8000
10000
12000
14000
16000
18000
NSW VIC QLD SA WA TAS NT ACT
$m
Gross value of agricultural production, year ending June 2012
NB: The gross value of agricultural production in the ACT was $24 million, but due to its relatively small size it is not apparent on the above chart.
0
500
1000
1500
2000
2500
3000
2005 2006 2007 2008 2009 2010 2011 2012
$m
Agricultural income, NSW

NSW Parliamentary Library Research Service
22
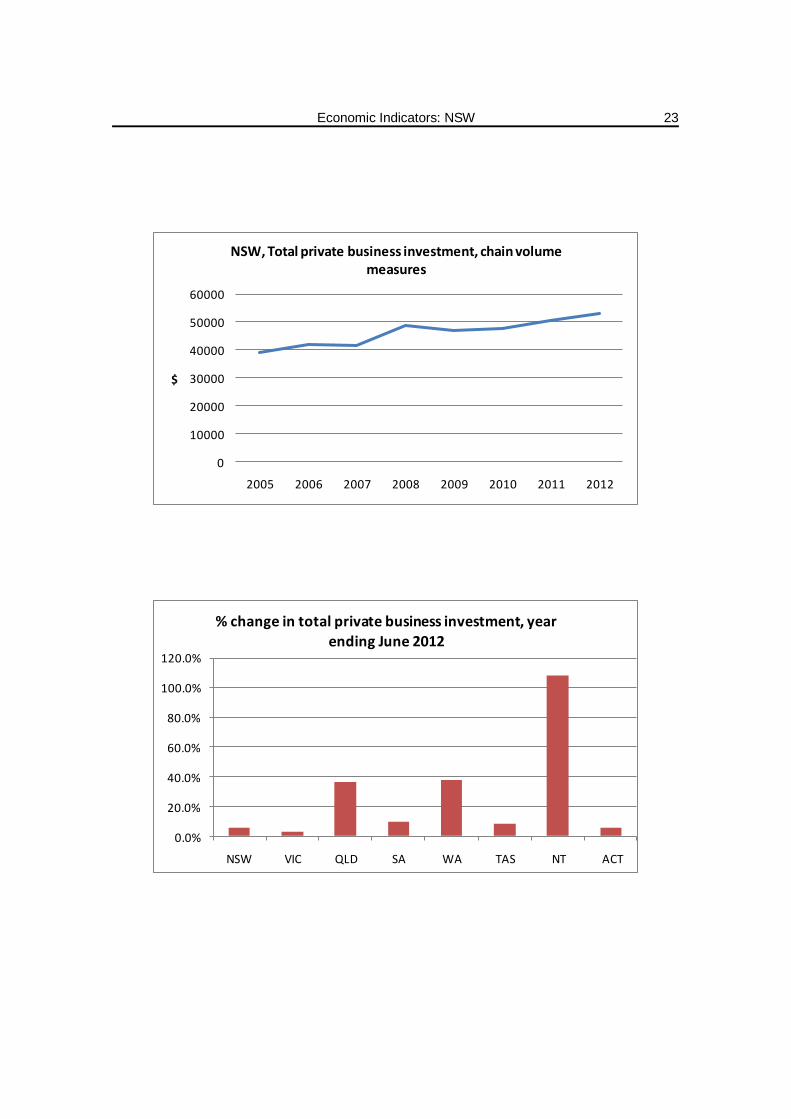
BUSINESS INVESTMENT
Total private business investment in the year ending June 2012 was $52.9 billion (gross fixed capital formation, chain volume measures), 5% more than in the previous year. This was the third greatest amount of private business investment in Australia, behind Western Australia and Queensland.
Total private business investment
Gross fixed capital formation, chain volume measures, $m
NSW VIC QLD SA WA TAS NT ACT
Jun-2005 39140 33542 25796 9813 20164 2408 3175 1774
Jun-2006 41968 37792 31118 9855 28150 2696 3693 2145
Jun-2007 41760 38931 35735 10357 34358 2213 3622 2572
Jun-2008 48762 42814 41593 10098 40695 2968 3844 2425
Jun-2009 46783 41765 43483 10165 46098 3216 4983 2440
Jun-2010 47644 41286 36940 10098 45091 2445 3209 2458
Jun-2011 50343 42521 44544 11141 49449 2641 2495 2383
Jun-2012 52875 43534 60555 12195 68072 2847 5187 2515
Source: ABS, Australian National Accounts, State Accounts 2011-12, 5220.0, November 2012
Economic Indicators: NSW
23
0
10000
20000
30000
40000
50000
60000
2005 2006 2007 2008 2009 2010 2011 2012
$
NSW, Total private business investment, chain volume measures
0.0%
20.0%
40.0%
60.0%
80.0%
100.0%
120.0%
NSW VIC QLD SA WA TAS NT ACT
% change in total private business investment, year
ending June 2012

NSW Parliamentary Library Research Service
24
TURNOVER OF RETAIL TRADE
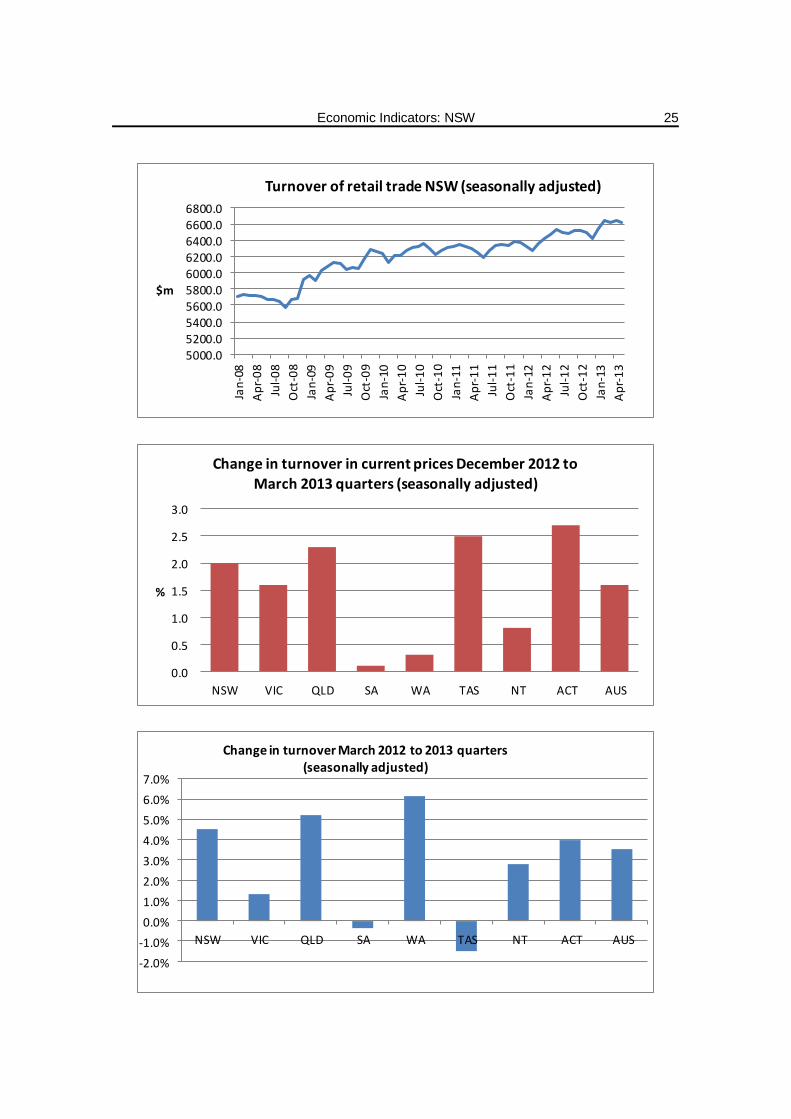
Average monthly turnover of retail trade in NSW rose by 2.0% in the March 2013 quarter to $6.604 billion. This was the fourth greatest increase of the States and Territories, and was above the Australian average of 1.6% growth. Retail turnover in NSW was up 4.5% from 12 months previously.
Average monthly turnover of retail trade per quarter, seasonally adjusted, $m
NSW VIC QLD SA WA TAS NT ACT AUS
Mar-08 5713 4593 3842 1333 2029 397 188 349 18445
Jun-08 5698 4556 3828 1357 2076 408 195 349 18467
Sep-08 5622 4609 3908 1390 2107 414 203 346 18598
Dec-08 5751 4755 3990 1407 2102 427 212 356 18999
Mar-09 5964 4887 4072 1415 2121 433 219 363 19475
Jun-09 6103 4957 4151 1441 2152 444 218 371 19836
Sep-09 6053 4920 4074 1413 2137 439 217 371 19625
Dec-09 6241 4963 4102 1431 2176 445 223 374 19955
Mar-10 6189 5029 4080 1441 2188 439 223 376 19966
Jun-10 6264 5112 4092 1472 2196 439 228 379 20183
Sep-10 6327 5211 4139 1460 2200 432 226 377 20373
Dec-10 6270 5225 4125 1444 2215 433 218 384 20314
Mar-11 6333 5189 4198 1457 2295 427 228 385 20511
Jun-11 6246 5323 4222 1432 2333 428 228 377 20589
Sep-11 6321 5318 4250 1444 2387 436 231 377 20765
Dec-11 6366 5343 4255 1458 2448 434 233 379 20915
Mar-12 6317 5358 4352 1459 2511 433 236 388 21053
Jun-12 6478 5361 4424 1471 2571 430 241 392 21366
Sep-12 6502 5381 4447 1469 2614 422 239 398 21471
Dec-12 6481 5355 4481 1452 2656 417 241 394 21476
Mar-13 6604 5430 4580 1453 2665 426 242 404 21803
Source: ABS, Retail Trade, Australia, May 2013, 8501.0, July 2013.
Economic Indicators: NSW
25
5000.05200.05400.05600.05800.06000.06200.06400.06600.06800.0
Jan
-08
Ap
r-0
8
Jul-
08
Oct
-08
Jan
-09
Ap
r-0
9
Jul-
09
Oct
-09
Jan
-10
Ap
r-1
0
Jul-
10
Oct
-10
Jan
-11
Ap
r-1
1
Jul-
11
Oct
-11
Jan
-12
Ap
r-1
2
Jul-
12
Oct
-12
Jan
-13
Ap
r-1
3
$m
Turnover of retail trade NSW (seasonally adjusted)
0.0
0.5
1.0
1.5
2.0
2.5
3.0
NSW VIC QLD SA WA TAS NT ACT AUS
%
Change in turnover in current prices December 2012 to March 2013 quarters (seasonally adjusted)
-2.0%
-1.0%
0.0%
1.0%
2.0%
3.0%
4.0%
5.0%
6.0%
7.0%
NSW VIC QLD SA WA TAS NT ACT AUS
Change in turnover March 2012 to 2013 quarters (seasonally adjusted)

NSW Parliamentary Library Research Service
26
VEHICLE SALES
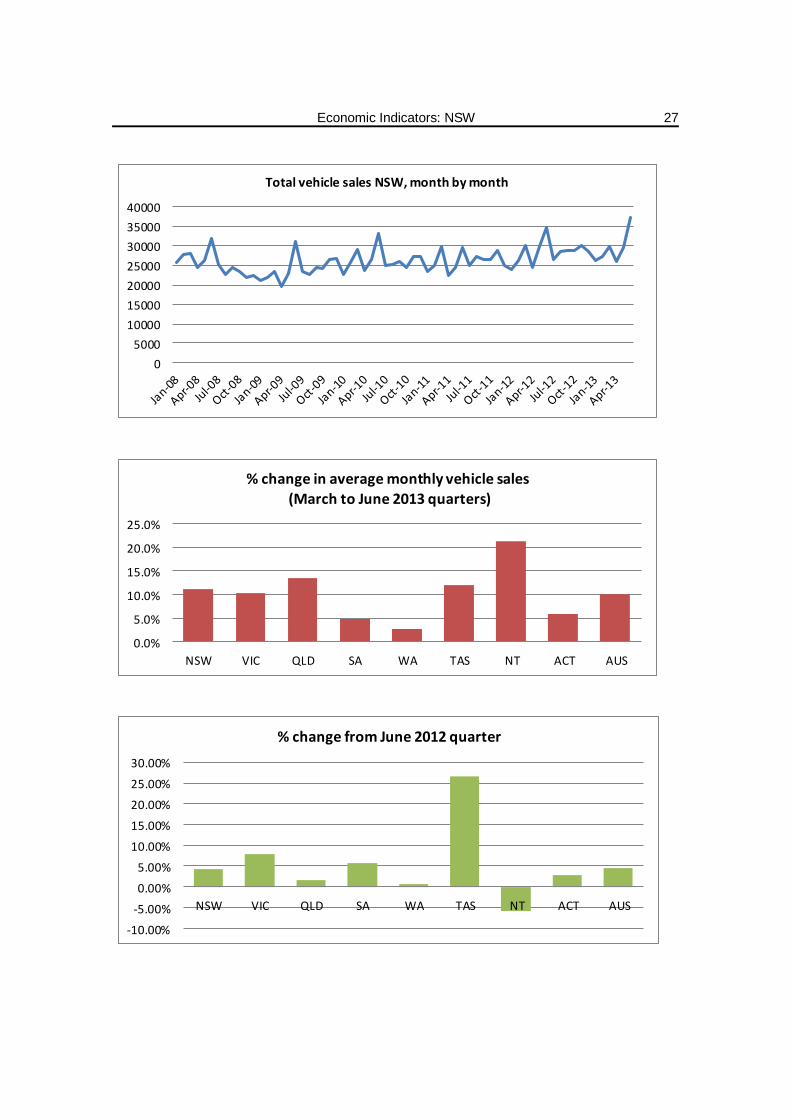
The average number of new vehicles sold per month in NSW rose by 11.2% in the June 2013 quarter to 30,961. All of the States and Territories experienced an increase in average monthly sales, with growth in sales averaging 10.1%.
Average monthly sales of new vehicles per quarter
NSW VIC QLD SA WA TAS NT ACT AUS
Mar-08 27264 22667 18706 5399 10028 1481 902 1370 87818
Jun-08 27617 24439 20705 5888 10369 1620 1067 1376 93081
Sep-08 24133 21442 16780 5115 9637 1584 837 1219 80746
Dec-08 22637 20295 15433 5011 8850 1571 748 1199 75744
Mar-09 22201 18423 14750 4490 7947 1283 671 1225 70990
Jun-09 24548 20966 17731 5186 8677 1455 871 1317 80751
Sep-09 23514 19863 16106 4823 8012 1347 727 1190 75584
Dec-09 25886 22935 17848 5806 8811 1794 748 1292 85118
Mar-10 25870 22683 17159 5448 9068 1557 832 1324 83942
Jun-10 27796 25282 19217 5950 10861 1571 1001 1436 93114
Sep-10 25472 22441 16474 5330 9815 1471 828 1353 83184
Dec-10 26356 23404 16450 5420 9407 1853 747 1314 84951
Mar-11 26119 22526 16659 5093 8898 1367 816 1343 82821
Jun-11 25575 21399 17995 5102 9076 1278 930 1236 82591
Sep-11 26276 22675 17893 5518 9356 1424 828 1329 85297
Dec-11 26894 22800 17745 5207 9168 1520 758 1344 85436
Mar-12 26868 23242 18096 5334 9777 1172 883 1335 86707
Jun-12 29674 24682 21015 5721 10887 1260 1157 1513 95911
Sep-12 28051 24317 19201 5565 10698 1428 911 1435 91607
Dec-12 29147 25685 20029 6046 11306 1800 915 1525 96453
Mar-13 27850 24119 18817 5765 10674 1425 897 1470 91016
Jun-13 30961 26632 21377 6047 10963 1596 1088 1557 100221
Source: ABS, Sales of new motor vehicles, Australia, June 2013, 9314.0, July 2013
0
10000
20000
30000
40000
NSW VIC QLD SA WA TAS NT ACT
Average vehicles sales per month (June 2013 quarter)
Economic Indicators: NSW
27
0
5000
10000
15000
20000
25000
30000
35000
40000
Total vehicle sales NSW, month by month
0.0%
5.0%
10.0%
15.0%
20.0%
25.0%
NSW VIC QLD SA WA TAS NT ACT AUS
% change in average monthly vehicle sales
(March to June 2013 quarters)
-10.00%
-5.00%
0.00%
5.00%
10.00%
15.00%
20.00%
25.00%
30.00%
NSW VIC QLD SA WA TAS NT ACT AUS
% change from June 2012 quarter

NSW Parliamentary Library Research Service
28
DWELLING APPROVALS
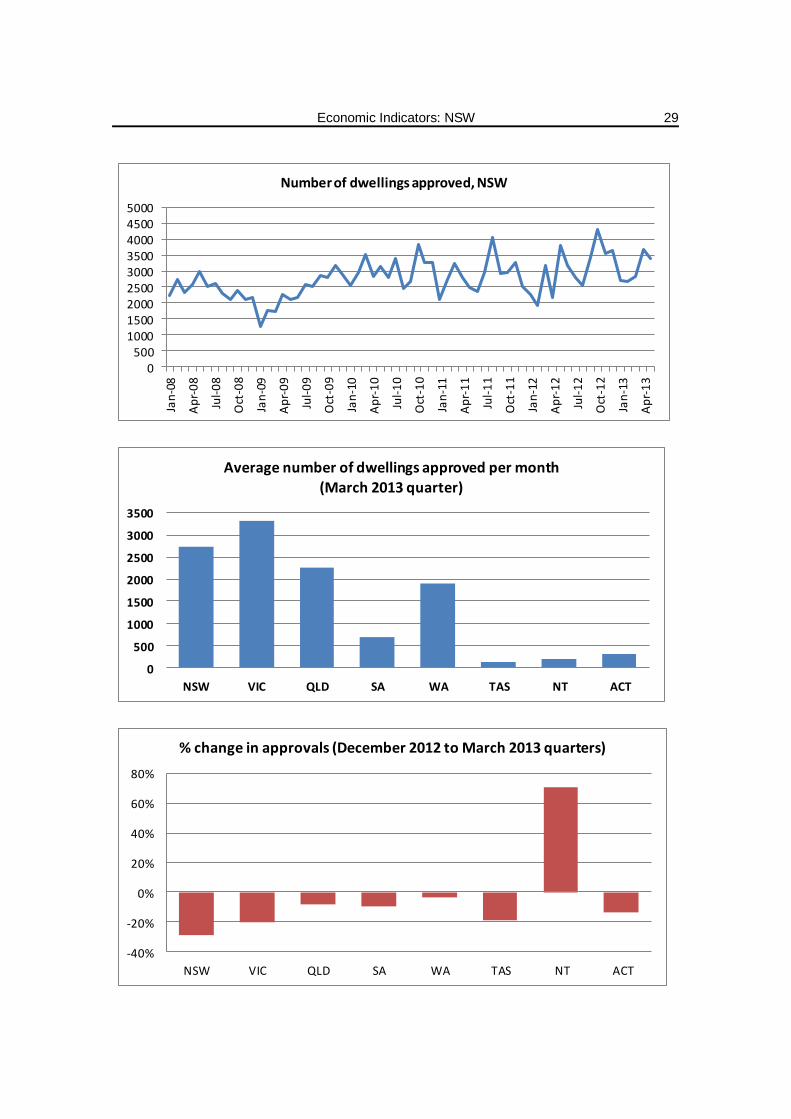
The number of dwellings approved on average per month in NSW fell by 29% in the March 2013 quarter to 2733. However, the number of approvals was still above that of a year previously, when the average monthly number of dwellings approved in the March 2012 quarter was 2456. The Northern Territory was the only jurisdiction to not experience a drop in the number of dwelling approvals between the quarters. Victoria had the greatest number of approvals, at an average of 3314 per month (down 20% from the previous quarter). 51% of dwellings approved in NSW in the March 2013 quarter were houses, compared to 40% in the previous quarter.
Average monthly number of dwellings approved per quarter
NSW VIC QLD SA WA TAS NT ACT AUS
Mar-08 2425 3261 3128 949 1987 236 88 144 12219
Jun-08 2696 3604 3618 1285 1988 251 102 253 13796
Sep-08 2328 3789 3222 1231 1909 304 85 211 13079
Dec-08 2214 3166 2366 932 1487 252 217 271 10906
Mar-09 1585 3340 1846 903 1359 233 80 169 9516
Jun-09 2172 3634 2422 1002 1749 289 106 311 11685
Sep-09 2652 4687 2890 1073 2049 301 109 385 14146
Dec-09 2969 4755 2976 1021 2125 314 146 347 14651
Mar-10 3029 4748 3021 1052 2347 250 55 310 14811
Jun-10 2951 5044 3233 1145 2030 253 168 471 15295
Sep-10 2838 5882 2729 1206 1850 293 207 401 15406
Dec-10 3467 5239 2631 939 1847 270 136 636 15163
Mar-11 2695 4515 2053 845 1613 230 59 396 12407
Jun-11 2544 4541 2458 961 1697 248 110 522 13082
Sep-11 3335 4654 2570 843 1734 207 148 511 14003
Dec-11 2921 3726 2140 709 1596 166 124 407 11789
Mar-12 2456 3567 2047 697 1686 168 78 217 10916
Jun-12 3065 4880 2434 628 1402 167 189 486 13252
Sep-12 2926 4693 2448 680 1877 171 254 216 13264
Dec-12 3852 4151 2478 752 1971 149 117 346 13815
Mar-13 2733 3314 2271 680 1909 120 200 299 11527
Source: ABS, Building Approvals, Australia, May 2013, 8731.0, July 2013
Economic Indicators: NSW
29
0500
100015002000250030003500400045005000
Jan
-08
Ap
r-0
8
Jul-
08
Oct
-08
Jan
-09
Ap
r-0
9
Jul-
09
Oct
-09
Jan
-10
Ap
r-1
0
Jul-
10
Oct
-10
Jan
-11
Ap
r-1
1
Jul-
11
Oct
-11
Jan
-12
Ap
r-1
2
Jul-
12
Oct
-12
Jan
-13
Ap
r-1
3
Number of dwellings approved, NSW
0
500
1000
1500
2000
2500
3000
3500
NSW VIC QLD SA WA TAS NT ACT
Average number of dwellings approved per month (March 2013 quarter)
-40%
-20%
0%
20%
40%
60%
80%
NSW VIC QLD SA WA TAS NT ACT
% change in approvals (December 2012 to March 2013 quarters)

NSW Parliamentary Library Research Service
30
HOUSING FINANCE
The average loan size for first home buyers in NSW fell by 1% in the March 2013 quarter to reach $310,000. This was the third highest average loan size for first home buyers in Australia, after the ACT and Western Australia at $318,000 and $316,000 respectively.
First home buyers – average loan size - $’000
NSW VIC QLD SA WA TAS NT ACT
Mar-08 246 216 237 196 233 172 235 240
Jun-08 262 226 246 203 243 166 250 226
Sep-08 267 239 265 219 252 183 258 269
Dec-08 283 254 282 231 277 203 284 304
Mar-09 289 257 289 239 294 208 294 314
Jun-09 291 260 284 237 298 206 302 312
Sep-09 288 263 271 235 296 208 304 310
Dec-09 309 272 283 236 300 211 327 304
Mar-10 305 275 287 244 295 206 291 309
Jun-10 314 280 291 244 285 208 328 297
Sep-10 308 285 288 243 284 206 304 317
Dec-10 310 284 287 242 278 207 305 323
Mar-11 305 281 276 237 273 204 294 329
Jun-11 313 286 279 245 281 212 305 306
Sep-11 304 289 280 245 285 213 306 322
Dec-11 295 287 275 241 282 219 305 319
Mar-12 292 282 273 237 289 214 304 311
Jun-12 303 288 278 238 296 210 319 336
Sep-12 308 287 281 246 296 205 336 322
Dec-12 313 289 276 241 302 213 301 332
Mar-13 310 288 283 242 316 211 303 318
Source: ABS, Housing Finance, Australia, May 2013, 5609.0, July 2013

Economic Indicators: NSW
31
150
200
250
300
350
$'000
Average loan size, first home buyers, NSW, month by month
0
50
100
150
200
250
300
350
NSW VIC QLD SA WA TAS NT ACT
$'000
Average loan size, first home buyers, March 2013 quarter
-6%
-4%
-2%
0%
2%
4%
6%
NSW VIC QLD SA WA TAS NT ACT
% change in size of average first home buyers loan (December to March 2013 quarters)

NSW Parliamentary Library Research Service
32
BANKRUPTCIES
The number of bankruptcies in NSW rose in the June 2013 quarter to reach 1634 (11% fewer bankruptcies than a year previously). The number of bankruptcies increased in all the States and Territories, except for Tasmania and the Northern Territory. One-third of all bankruptcies in Australia occurred in NSW.
Bankruptcies per quarter (Parts IV and XI of the Bankruptcy Act 1966 (Cth))
NSW VIC QLD SA WA TAS NT ACT
Mar-08 2382 1321 1415 537 396 161 31 63
Jun-08 2781 1548 1508 550 375 214 38 44
Sep-08 2646 1434 1433 521 387 194 23 55
Dec-08 2577 1461 1460 457 400 210 31 53
Mar-09 2742 1527 1662 483 435 217 25 73
Jun-09 2532 1562 1688 483 438 221 24 66
Sep-09 2671 1580 1708 513 532 227 36 62
Dec-09 2451 1314 1800 452 476 175 41 61
Mar-10 2229 1393 1700 492 468 183 36 63
Jun-10 2403 1435 1801 489 410 204 36 64
Sep-10 2332 1274 1549 418 431 180 22 54
Dec-10 1994 1098 1668 409 389 175 31 48
Mar-11 1861 1020 1430 414 441 186 30 40
Jun-11 1936 1126 1504 364 437 169 22 44
Sep-11 1951 1125 1528 392 435 183 17 46
Dec-11 1950 1067 1538 388 391 166 25 48
Mar-12 1895 1039 1622 375 378 173 22 46
Jun-12 1831 1018 1563 368 363 172 16 32
Sep-12 1880 1147 1608 414 410 159 28 45
Dec-12 1732 1044 1542 350 384 137 28 42
Mar-13 1553 934 1411 332 322 140 23 59
Jun-13 1634 1055 1491 397 353 139 23 60
Source: Insolvency and Trustee Service Australia, ‘Quarterly Statistics’, www.itsa.gov.au

Economic Indicators: NSW
33
0
500
1000
1500
2000
2500
3000
Bankruptcies per quarter, NSW
0
200
400
600
800
1000
1200
1400
1600
1800
NSW VIC QLD SA WA TAS NT ACT
Number of bankruptcies - June 2013 quarter
-40%
-20%
0%
20%
40%
60%
80%
100%
NSW VIC QLD SA WA TAS NT ACT
% change from number of bankruptcies in corresponding
quarter of previous year - June 2013

NSW Parliamentary Library Research Service
34
RENT
Six of the rental categories (all dwellings) in NSW experienced increases in the average weekly rent for new bonds in the March 2013 quarter, three categories remained flat, and prices fell for one group. The greatest percentage increase was for the price of three bedroom dwellings in Sydney, up by 4.3% on the December 2012 quarter.
Sydney
The average weekly rent for new bonds in Sydney in the March 2013 quarter was: $420 for a one bedroom place; $465 for two bedrooms; $480 for three bedrooms; and $600 for four or more bedrooms.
The highest median rent for a two bedroom place in Sydney was in the
Sydney local government area at $680 a week. Woollahra local government area had the highest median rent for a three bedroom place at $1070.
The lowest median rents were in the Wyong local government area at $280 for a two bedroom place and $340 for a three bedroom place.
Rest of the Greater Metropolitan Region
The average rental price in the Greater Metropolitan Region (GMR) excluding Sydney (includes Cessnock, Kiama, Lake Macquarie, Maitland, Newcastle, Port Stephens, Shellharbour and Wollongong) was: $215 for a one bedroom place; $320 for two bedrooms; $380 for three bedrooms; and $440 for four or more bedrooms.
The highest median rents in the rest of the GMR were in Newcastle at $365 a
week for a two bedroom place and $435 for a three bedroom place in Kiama.
The lowest median rent for a two bedroom place was in Cessnock, Port
Stephens and Shellharbour at $280. Cessnock had the lowest median rent for a three bedroom place at $320.
Economic Indicators: NSW
35
Rural NSW
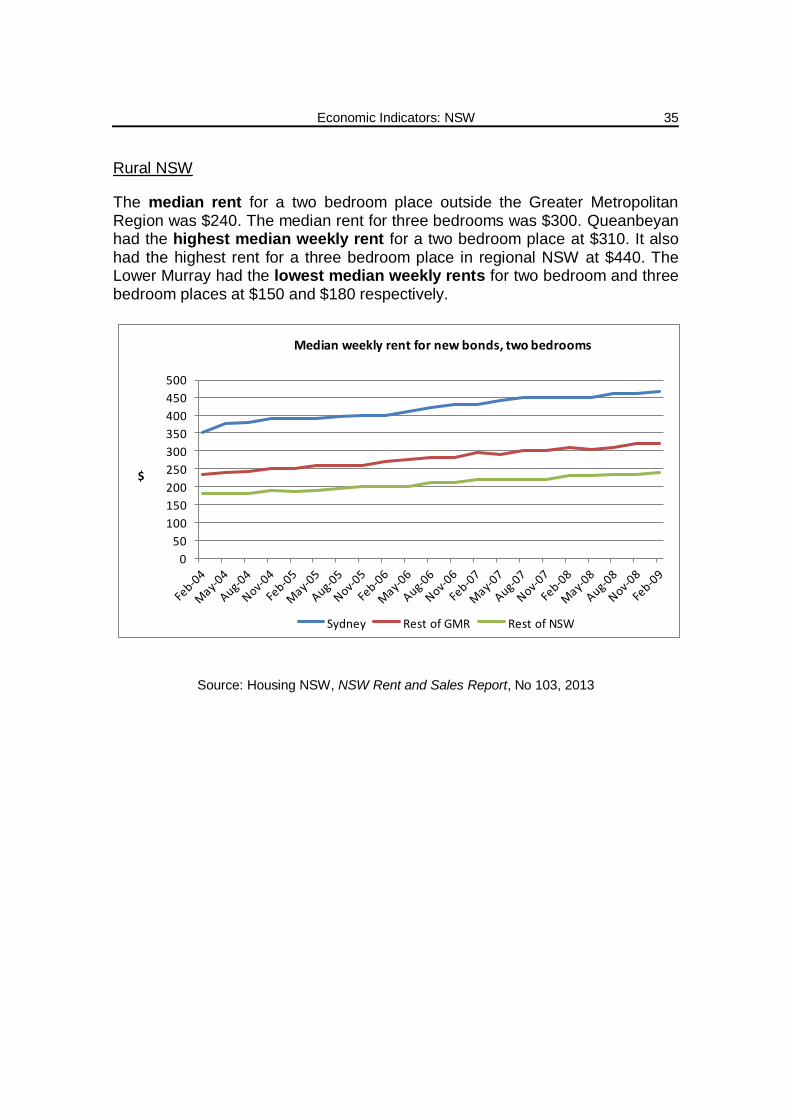
The median rent for a two bedroom place outside the Greater Metropolitan Region was $240. The median rent for three bedrooms was $300. Queanbeyan had the highest median weekly rent for a two bedroom place at $310. It also had the highest rent for a three bedroom place in regional NSW at $440. The Lower Murray had the lowest median weekly rents for two bedroom and three bedroom places at $150 and $180 respectively.
0
50
100
150
200
250
300
350
400
450
500
$
Median weekly rent for new bonds, two bedrooms
Sydney Rest of GMR Rest of NSW
Source: Housing NSW, NSW Rent and Sales Report, No 103, 2013

NSW Parliamentary Library Research Service
36
GLOSSARY
The following definitions are those used by the Australian Bureau of Statistics, unless otherwise stated.
Agricultural income: The income accruing from agricultural production during the year. It is equal to gross agricultural product at factor cost less consumption of fixed capital, compensation of employees, and net rent and interest payments.
Average weekly earnings: Average gross (before tax) earnings of employees. Estimates of average weekly earnings are derived by dividing estimates of weekly total earnings by estimates of number of employees.
Cash target rate: Monetary policy decisions are expressed in terms of a target for the cash rate, which is the overnight money market interest rate. (Source: Reserve Bank of Australia, www.rba.gov.au)
Chain volume measures: Estimates that exclude the direct effects of changes in prices. Unlike current measure estimates, they take account of changes to price relativities that occur from one year to the next. Annually re-weighted chain volume indexes are referenced to the current price values in a chosen reference year.
Consumer price index: The Consumer Price Index (CPI) measures quarterly changes in the price of a 'basket' of goods and services which account for a high proportion of expenditure by the CPI population group (i.e. metropolitan households). This 'basket' covers a wide range of goods and services, arranged in the following eleven groups: food; alcohol and tobacco; clothing and footwear; housing; household contents and services; health; transportation; communication; recreation; education; and financial and insurance services.
Employed: All persons aged 15 years and over who, during the reference week: worked for one hour or more for pay, profit, commission or payment in kind in a job or business, or on a farm (comprising employees, employers and own account workers); or worked for one hour or more without pay in a family business or on a farm (i.e. contributing family workers); or were employees who had a job but were not at work and were: away from work for less than four weeks up to the end of the reference week; or away from work for more than four weeks up to the end of the reference week and received pay for some or all of the four week period to the end of the reference week; or away from work as a standard work or shift arrangement; or on strike or locked out; or on workers' compensation and expected to return to their job; or were employers or own account workers, who had a job, business or farm, but were not at work.
Free on board (FOB): The value of goods measured on a free on board (f.o.b.) basis includes all production and other costs incurred up until the goods are placed on board the international carrier for export. Free on board values exclude international insurance and transport costs. They include the value of

Economic Indicators: NSW
37
the outside packaging in which the product is wrapped, but do not include the value of the international freight containers used for transporting the goods.
Gross domestic product: Is the total market value of goods and services produced in Australia within a given period after deducting the cost of goods and services used up in the process of production but before deducting allowances for the consumption of fixed capital. It is equivalent to gross national expenditure plus exports of goods and services less imports of goods and services.
Gross State product (GSP): GSP is defined equivalently to gross domestic product (GDP) but refers to production within a State or Territory rather than to the nation as a whole.
Labour force: For any group, persons who were employed or unemployed, as defined.
Participation rate: For any group, the labour force expressed as a percentage of the civilian population aged 15 years and over in the same group.
Private business investment: Investment in non-dwelling construction, plus machinery and equipment, plus cultivated biological resources, plus intellectual property products.
Seasonally adjusted estimates: Seasonally adjusted estimates are derived by estimating and removing from the original series systematic calendar related effects, such as seasonal (e.g. Christmas), trading day and moving holiday (e.g. Easter) influences. Seasonal adjustment does not aim to remove the irregular or non-seasonal influences which may be present in any particular month. These irregular influences may reflect both random economic events and difficulties of statistical recording.
Trend series: A smoothed seasonally adjusted series of estimates.
Unemployed: Persons aged 15 years and over who were not employed during the reference week, and: had actively looked for full time or part time work at any time in the four weeks up to the end of the reference week and were available for work in the reference week; or were waiting to start a new job within four weeks from the end of the reference week and could have started in the reference week if the job had been available then.
Unemployment rate: For any group, the number of unemployed persons expressed as a percentage of the labour force in the same group.
Weekly ordinary time earnings: Weekly ordinary time earnings refers to one week's earnings of employees for the reference period, attributable to award, standard or agreed hours of work. It is calculated before taxation and any other deductions (e.g. superannuation, board and lodging) have been made.