Economic Indicators: May 1977 - St. Louis Fed · Economic Indicators May 1977 ... s and sen Federal...
40
95th Congress, 1st Session Economic Indicators May 1977 Prepared for the Joint Economic Committee by the Council of Economic Advisers UNITED STATES GOVERNMENT PRINTING OFFICE WASHINGTON : 1977 Digitized for FRASER http://fraser.stlouisfed.org/ Federal Reserve Bank of St. Louis
Transcript of Economic Indicators: May 1977 - St. Louis Fed · Economic Indicators May 1977 ... s and sen Federal...
95th Congress, 1st Session
Economic Indicators
May 1977
Prepared for the Joint Economic Committee by the
Council of Economic Advisers
UNITED STATES
GOVERNMENT PRINTING OFFICE
WASHINGTON : 1977
Digitized for FRASER http://fraser.stlouisfed.org/ Federal Reserve Bank of St. Louis
JOINT ECONOMIC COMMITTEE(Created pursuant to Sec. 5(a) of Public Law 304, 79th Cong.)
RICHARD BOLLING, Missouri, ChairmanHUBERT H. HUMPHREY, Minnesota, Vice Chairman
HOUSE OF REPRESENTATIVESHENRY S. REUSS (Wisconsin)WILLIAM S. MOORHEAD (Pennsylvania)LEE H. HAMILTON (Indiana)GILLIS W. LONG (Louisiana)OTIS G. PIKE (New York)CLARENCE J. BROWN (Ohio)GARRY BROWN (Michigan)MARGARET M. HECKLER (Massachusetts)JOHN H. ROUSSELOT (California)
SENATEJOHN SPARKMAN (Alabama)WILLIAM PROXMIRE (Wisconsin)ABRAHAM RIBICOFF (Connecticut)LLOYD M. BENTSEN, JR. (Texas)EDWARD M. KENNEDY (Massachusetts)JACOB K. JAVITS (New York)WILLIAM' V. ROTH, JR. (Delaware)JAMES A. McCLURE (Idaho)ORRIN G. HATCH (Utah)
JOHN R. STARK, Executive Director
COUNCIL OF ECONOMIC ADVISERSCHARLES L. SCHULTZE, Chairman
LYLE E. GRAMLEYWILLIAM D. NORDHAUS
[PUBLIC LAW 120—81sx Congress; CHAPTER 237—1st SESSION]
JOINT RESOLUTION [S J. Res. 55]
To print the monthly publication entitled "Economic Indicators"
Resolved by the Senate and House of Representatives of the United States of America in Congress assembled. That the JointEconomic Committee be authorized to issue a monthly publication entitled "Economic Indicators," and that asufficient quantity be printed to furnish one copy to each Member of Congress; the Secretary and the Sergeant atArms of the Senate; the Clerk, Sergeant at Arms, and Doorkeeper of the House of Representatives; two copies tothe libraries of the Senate and House, and the Congressional Library; seven hundred copies to the Joint EconomicCommittee; and the required numbers of copies to the Superintendent of Documents for distribution to depositorylibraries; and that the Superintendent of Documents be authorized to have copies printed for sale to the public.
Approved June 23, 1949.
Charts drawn by Art Production Branch, Office of the Secretary, Department of Commerce.
Economic Indicators, published monthly, is available at 85 cents a single copyor by subscription at $10.10 per year ($2.55 additional for foreign mailing) from:
SUPERINTENDENT OF DOCUMENTSGOVERNMENT PRINTING OFFICE
WASHINGTON D.C. 20402
Digitized for FRASER http://fraser.stlouisfed.org/ Federal Reserve Bank of St. Louis
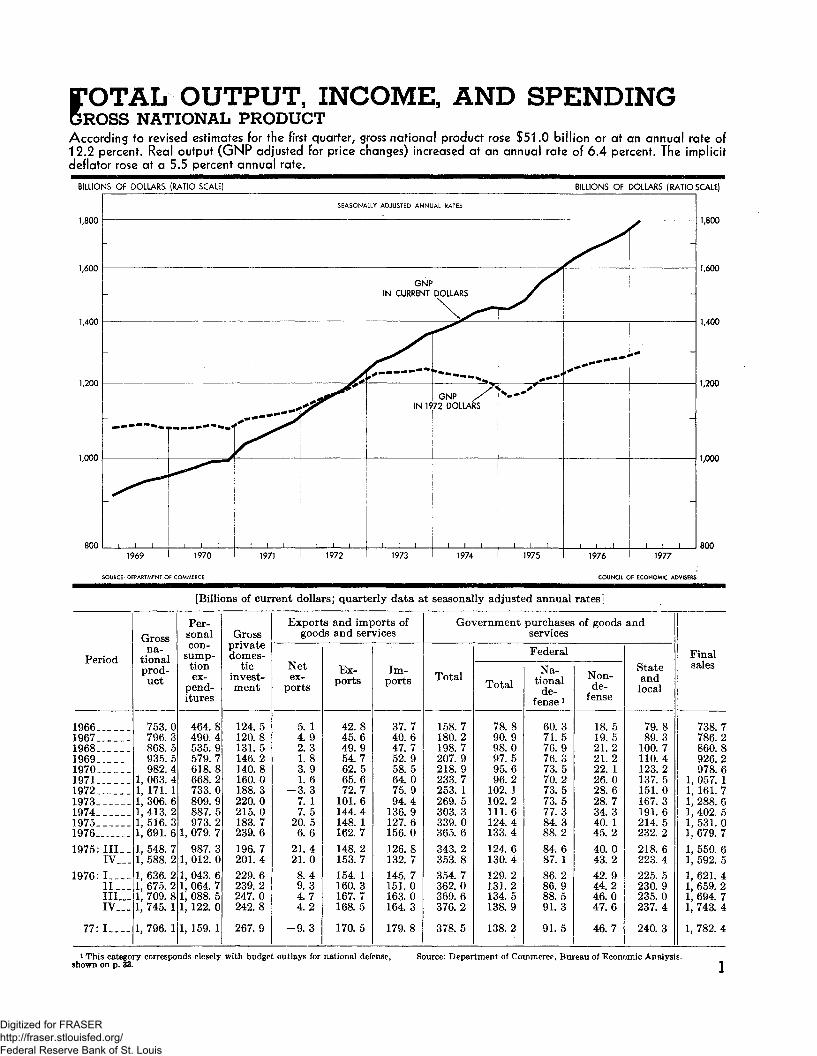
TOTAL OUTPUT, INCOME, AND SPENDINGGROSS NATIONAL PRODUCTAccording to revised estimates for the first quarter, gross national product rose $51.0 billion or at an annual rate of12.2 percent. Real output (GNP adjusted for price changes) increased at an annual rate of 6.4 percent. The implicitdeflator rose at a 5.5 percent annual rate.
BILLIONS OF DOLLARS. (RATIO SCALE)
1,800
1,600
1,400
BILLIONS OF DOLLARS (RATIOSCALE)
1,800
1,600
1,400
1,200 1,200
1,000 1,000
1969 I 1970
SOURCE: DEPARTMFNT OF COMMERCE
1976 1977
COUNCIL OF ECONOMIC ADVISERS
[Billions of current dollars; quarterly data at seasonally adjusted annual rates!
Period
196619671968196919701971197219731974197519761975: III__
IV___1976: I
IIlidIV._.
77:I_.._
Grossna-
tionalprod-uct
753.0796.3868, 5935. 5982.4
1, 063. 41, 171. 11, 306. 61, 413. 21, 516. 31, 691. 61, 548. 71, 588. 21, 636. 21, 675. 21, 709. 81, 745. 1
1, 796. 1
Per-sonalcon-
sump-tionex-
pend-itures
464. 8490.4535. 9579.7618. 8668.2733.0809.9887.5973. 2
1, 079. 7987.3
1, 012. 01, 043. 61, 064. 71, 088. 51, 122. 0
1, 159. 1
Grossprivatedomes-
ticinvest-ment
124. 5120.8131.5146.2140.8160. 0188.3220.0215.0183. 7239.6196.7201.4229.6239. 2247.0242. 8
267.9
Exportgooc
Netex-
ports
5. 14.92.31.83.91. 6
-3.37. 17.5
20. 56.6
21.421. 08. 49.34.742
-9.3
s and imp:s and ser
Ex-ports
42. 845.649. 954.762.565. 672. 7
101.6144. 4148. 1162.7148.2153. 7154. 1160. 3167.7168.5
170.5
)orts ofvices
Im-ports
37.740.647. 752.958.564. 075.994.4
136.9127. 6156. 0126.8132. 7145. 7151.0163.0164.3
179.8
Goi
Total
158.7180.2198.7207.9218.9233.7253. 1269.5303.3339. 0365. 6343. 2353.8354. 7362. 0369.6376.2
378.5
/ernment
Total
78.890.998. 097.595.696. 2
102. 1102.2111. 6124. 4133.4124.6130. 4129. 2131.2134.5138.9
138.2
purchasesservices
Federal
Na-tional
de-fense l
60. 371.576. 976.373.570.273.573.577.384. 388.284 687 186 286 988 591 3
91.5
of goods
Non-de-
fense
18. 519. 521. 221. 222. 126. 028.628.734.340. 145. 240.043.242. 944.246.047.6
46.7
and
Stateandlocal
79.889.3
100.7110. 4123.2137. 5151. 0167. 3191.6214. 5232. 2218.6223.4225. 5230.9235.0237.4
240. 3
Finalsales
738.7786. 2860.8926.2978. 6
1, 057. 11, 161. 71, 288. 61, 402. 51, 531. 01, 679. 71, 550. 61, 592. 51, 621. 41, 659. 21, 694. 71, 743. 4
1, 782. 4
i This category corresponds clcsely with budget outlays for national defense,shown on p. 33.
Source: Department of Commerce, Bureau of Economic Analysis.
Digitized for FRASER http://fraser.stlouisfed.org/ Federal Reserve Bank of St. Louis
GROSS NATIONAL PRODUCT IN 1972 DOLLARS
[Billions of 1972 dollars; quarterly data at seasonally adjusted annual rates]
Period
19661967196819691970197119721973197419751976
1975 : III. _IV—
1976:1 —II-,I I I __IV—
1977:1
Grossnationalproduct
981.01, 007. 71, 051. 81, 078. 81, 075. 31, 107. 51, 171. 11, 235. 01, 214. 01, 191. 71, 264. 7
1, 209. 31, 219. 2
1, 246. 31, 260. 01, 272. 21, 280. 4
1, 300. 3
Per-sonalcon-
sump-tion
expend-itures
586. 1603.2633.4655. 4668.9691.9733.0767.7759. 1770. 3813.7
775. 3783.9
800.7808.6815.7829.7
843.8
Gross ]ii
Non-resi-
dentialfixed
106. 1103.5108. 0114.3110.0108.0116.8131.0128.5111.4115.7
110. 1110.5
112.6114.9117.5117.9
122.3
mvate doavestmen
Resi-dentialfixed
38.537.242.843.240.452.262. 059.745.038. 447.1
39.641. 9
44. 145.747.451. 1
51.6
mesti ct
Changein busi-ness in-vento-
ries
16.712.08.7
10.64.36.69.4
16. 58.5
— 12. 08.1
-1.0-5.5
10.411.110.2
.9
9.2
Expa]
M£»+INCt
exports
4.33.5-.4
-1.31.4
-.6-3.3
7.616.522 616.0
22.823. 1
16.616.015.715.5
10.9
orts of goad service
Exports
51.654.258.562.267. 167.972.787. 497.290. 696. 1
90. 793.9
93. 695.498.097.4
97.8
odss
Imports
47. 350.758.963.565.768.575.979.980.768. 180. 1
67.970.8
77.079.482.381.8
86.9
Governrgood
Total
229. 3248.3259.2256.7250.2249.4253. 1252. 5256.4261.0264. 1
262.4265.2
261. 9263.6265.5265.3
262.4
nent pures and sen
Federal
112.5125.3128.3121.8110.7103.9102. 196.695. 395.796.7
95.697. 2
95.496.097.398. 1
96.4
bases ofrices
Stateandlocal
116.8123. 1130.9134.9139.5145.5151.0155.9161. 1165.2167.4
166.9168.0
166.6167.7168.2167.3
166.0
Finalsales
964.3995.7
1, 043. 11, 068. 21, 071. 01, 100. 91, 161. 71, 218. 51, 205. 51, 203. 71, 256. 6
1, 210. 21, 224. 7
1, 235. 91, 248. 81, 262. 01, 279. 5
1, 291. 1
IMPLICIT PRICE DEFLATORS FOR GROSS NATIONAL PRODUCT
[1972=100]
Period
196619671968.19691970197119721973197419751976
1975:111IV
1976: IIIIIIIV
1977:1
Grossnationalproduct
76.7679.0282.5786.7291.3696.02
100. 00105. 80116. 41127. 25133. 75
128. 07130. 27
131. 29132. 96134. 40136. 30
138. 14
Personal
Total
79.381.384.688.592.596.6
100.0105.5116.9126.3132.7
127.3129. 1
130. 3131.7133.4135.2
137.4
consump
.
goods
85.787.490.793. 195.599.0
100.0101. 6108.3117.7124.4
118.2120.2
121.8123.8124.9127.0
128.9
tion expei
Non-durablegoods
80. 181.985.389.493.696.6
100.0107 9124.0133.7138.0
135. 1136.2
136.4136.9138.5139.9
142.2
iditures
Services
76.578.882. 086. 190.595.8
100.0104.7113.5122. 7131.0
123.6125.9
128.0129.8132.01340
136.2
Gross idom<
invest
Nonres-idential
fixed
76.879.382.686.691.396.4
100.0103.8116. 1132. 1138.2
132.7134.5
136.2137.5138.7140.5
142.2
mvate3StiCment
Resi-dentialfixed
74.677.080.787.790.694.9
100.0110.8122.3133.2143.9
132.8135. 9
139.0142.9145.3147.7
155.3
Exporimports
and se
Exports
82.884.085.387.993. 196.6
100.0116.2148.6163.4169.3
163.4163.7
164.6168. 1171.1173.0
174.3
ts andof goodsrvices
Imports
79.780. 180.983.389. 193.5
100.0118.2169.6187.4194.7
186.6187.3
189.2190.4198. 1200.8
206.8
Governrrehases c
and se
Federal
70.172.676.480.086.492.6
100.0105.8117.1130.0138.0
130.4134.2
135.4136.7138.3141.6
143.3
tent pur->f goodsrvices
Stateandlocal
68.472.576.981.988.394.5
100. 0107.3119.0129.8138.7
131.0132.9
135.4137.7139.7141.9
144. 8
Source: Department of Commerce, Bureau of Economic Analysis.
Digitized for FRASER http://fraser.stlouisfed.org/ Federal Reserve Bank of St. Louis
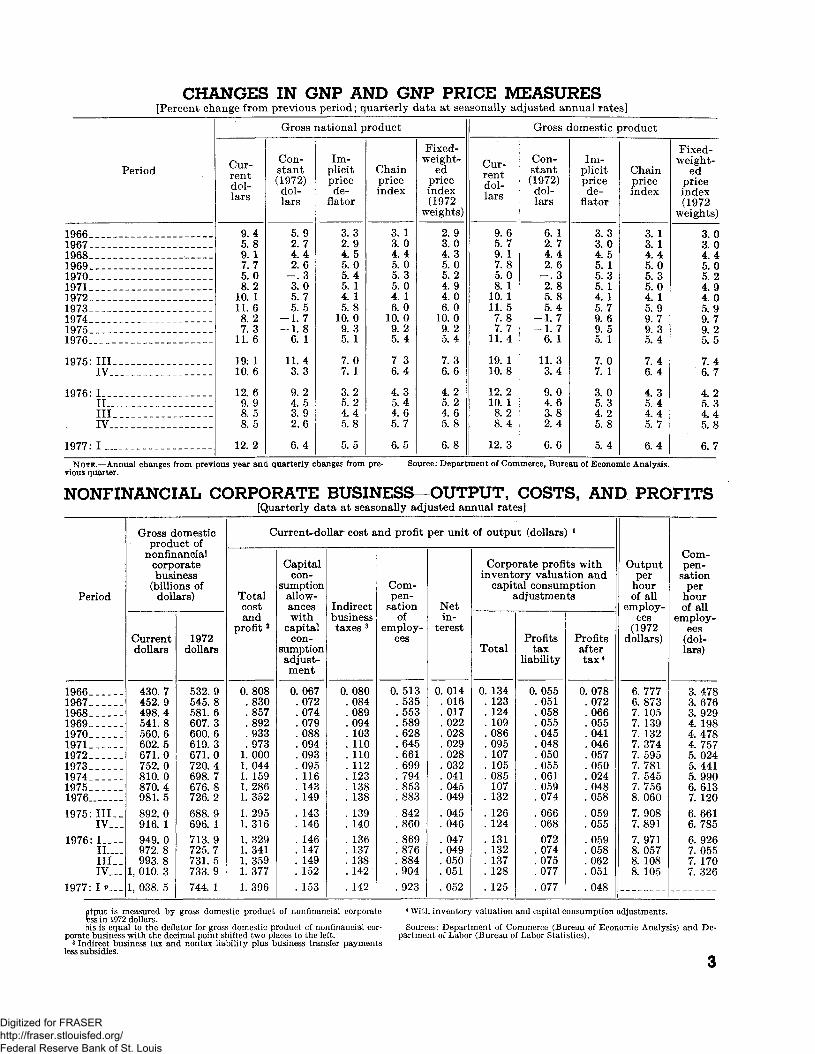
CHANGES IN GNP AND GNP PRICE MEASURES[Percent change from previous period; quarterly data at seasonally adjusted annual rates]
Period
19661967196819691970197119721973197419751976
1975: IIIIV
1976: IIIIIIIV
1977: I
Cur-rentdol-lars
9.45.89.17.75.08.2
10. 111.68.27.3
11.6
19: 110.6
12. 69.98. 58.5
12. 2
Gross i
Con-stant(1972)dol-lars
5.92.74.42.6-.33.05.75.5
-1.7-1.8
6. 1
11.43.3
9.24.53.92.6
6.4
[national p
Im-plicitpricede-
flator
3.32.94.55.05.45. 14. 15. 8
10.09. 35. 1
7. 07. 1
3.25.24.45.8
5.5
roduct
Chainpriceindex
3. 13.04. 45.05.35.04. 16.0
10. 09.25.4
7 36.4
4.35.44.65.7
6.5
Fixed-weight-
edpriceindex(1972
weights)
2.93.04.35. 05.24.94.06.0
10.09. 25.4
7.36.6
4.25.24.65.8
6.8
Cur-rentdol-lars
9.65.79. 17.85.08. 1
10. 111.57.87.7
11.4
19. 110.8
12. 210. 18. 28. 4
12. 3
Gross c
Con-stant(1972)dol-lars
6. 12.74.42. 6-.32.85. 85. 4
-1.7-1.7
6. 1
11.33.4
9.04. 63.82.4
6.6
lomestic {
Im-plicitpricede-
flator
3. 33.04.55. 15.35. 14. 15. 79.69. 55. 1
7.07. 1
3.05.34.25.8
5. 4
>roduct
Chainpriceindex
3. 13. 14.45.05.35.04. 15.99.79.35.4
7.46.4
4.35.44.45.7
6.4
Fixed-weight-
edpriceindex(1972
weights)
3.03.04.45.05.24.94.05.99.79.25.5
7.46.7
4.25.34.45.8
6.7
NOTE.—Annual changes from previous year and quarterly changes from pre- Source: Department of Commerce, Bureau of Economic Analysis,vious quarter.
NONFINANCIAL CORPORATE BUSINESS—OUTPUT, COSTS, AND PROFITS[Quarterly data at seasonally adjusted annual rates]
Period
196619671968196919701971197219731974197519761975: I I I__
IV—1976: I
IL_._III__IV._.
1977 : ! * > _ _
Gross dprodi
nonfinGorp<busi
(billicdoll
Currentdollars
430.7452. 9498.4541.8560.6602.5671. 0752. 0810.0870. 4981.5892.0916. 1949. 0972. 8993.8
1, 010. 31, 038. 5
omesticict ofancialsrateness>ns ofars)
1972dollars
532.9545. 8581.6607.3600.6619.3671.0720. 4698.7676. 8726.2688.9696. 1713.9725. 7731.5733.9744. 1
C
Totalcostand
profit 2
0. 808.830. 857.892. 933.973
1.0001.0441. 1591.2861.3521.2951. 3161.3291.3411. 3591. 3771. 396
urrent-do
Capitalcon-
sumptionallow-anceswith
capitalcon-
sumptionadjust-ment
0.067.072. 074.079.088.094.093. 095. 116. 143. 149. 143. 146. 146. 147. 149. 152. 153
liar cost a
Indirectbusinesstaxes 3
0. 080.084. 089.094. 103. 110. 110. 112. 123. 138. 138. 139. 140. 136. 137. 138.142. 142
nd profit
Com-pen-
sationof
employ-ees
0.513. 535.553. 589.628.645. 661. 699. 794. 853.883
842.860. 869.876.884.904.923
per unit
Netin-
terest
0. 014. 016.017. 022.028.029. 028. 032.041. 045.049. 045. 046. 047.049.050.051.052
of outpu
Corpcinvent
capitt
Total
0. 134. 123. 124. 109.086.095. 107. 105.085
107. 132. 126. 124. 131. 132. 137. 128. 125
t (dollars]
>rate profiDry valualal consunidjustmen
Profitstax
liability
0.055.051.058.055. 045.048.050.055. 061.059.074. 066.068
072.074. 075. 077.077
) i -
ts withbion andiptionts
Profitsaftertax4
0. 078.072.066.055.041.046.057.050. 024.048.058.059. 055.059.058.062.051. 048
Outputper
hourof all
employ-ees
(1972dollars)
6. 7776. 8737. 1057. 1397. 1327.3747. 5957.7817. 5457.7568.0607.9087.8917.9718.0578. 1088. 105
Com-pen-
sationper
hourof all
employ-ees
(dol-lars)
3.4783.6763.9294. 1984.4784. 7575. 0245. 4415.9906.6137. 1206. 6616. 7856.9267.0557. 1707. 326
tttput is measured by gross domestic product of nonfmancial corporatefess in 1972 dollars.ais is equal to the deflator for gross domestic product cf nonfinancial cor-
porate business with the decimal point shifted two places to the left.3 Indirect business tax and nontax liability plus business transfer payments
less subsidies.
4 With inventory valuation and capital consumption adjustments.
Sources: Department of Commerce (Bureau of Economic Analysis) and De-partment of Labor (Bureau of Labor Statistics).
Digitized for FRASER http://fraser.stlouisfed.org/ Federal Reserve Bank of St. Louis

NATIONAL INCOME[Billions of dollars; quarterly data at seasonally adjusted annual rates]
Period
196619671968 .19691970197119721973 ..1974197519761975: III
IV-1976: I-
IIIIIIV _
1977: I*
Na-tional
income
622.2655. 8714. 4767. 9798.4858. 1951.9
1, 064. 61, 135. 71, 207. 61, 348. 41, 233. 41, 264. 61, 304. 71, 337. 41, 362. 51, 389. 31, 431. 4
Com-pensa-tion of
em-pi oy-ees 1
439.3471. 9519.8571.4609. 2650.3715. 1799.2875. 8928.8
1, 028. 4935. 2963. 1994. 4
1, 017. 21, 037. 51, 064. 51, 097. 7
Proprimcom<
inventortion anc
consunadjust
Farm
13. 612. 112. 013.913.914. 318.032.025. 824. 922.829. 228.321.927. 521. 720.324.0
etors'3 withy valua-capital
aptionments
Non-farm
46.748.951. 452.351.253.458. 160.461. 165.373.866. 369.071.472. 874.476.879.6
Rental
of per-
withcapital
con-sump-tion
adjust-ment
18.219.418. 618. 118. 620. 121. 521. 621. 022. 423.522. 422.923.323. 123. 424.325. 1
Corporand
Total
82.579. 385.881.467.977. 292. 199. 184.891. 6
117.8105. 3105.6115. 1116.4122.0117.8116.2
ate profitscapital co
Profitsvaluatand ^
consum
Total
78,675. 682. 177. 966.476.989. 697. 287.8
103. 1133.3117.9119. 1129.6131.8137.6134.2133.1
with inv(nsumptioi
with invcion adjusiwithout caption adji
Profitsbefore
tax
80.777. 385. 683.471.582.096. 2
115. 8127.6114. 5147. 9126. 9131.3141. 1146.2150. 2154. 2156.3
mtory vali adjustm
mtorytmentpitalistment
Inven-tory
valua-tion
adjust-ment
2. 1-1. 7-3.4-5.5-5. 1-5.0-6.6
-18.6-39. 8-11. 4-14.6-9. 0
-12.3-11.5-14.4-12. 6-20.0-23. 1
uationents
Capitalcon-
sump-tion
adjust-ment
3.93.73.73. 51.5. 3
2.51. 9
-3.0-11. 5-15. 5-12. 6-13. 5-14.5-15.4-15.7-16. 4-17.0
Netinterest
21. 924.326. 830.837. 542.847. 052.367. 174.682.074. 975.878.680.383.585.688.9
i Includes employer contributions for social insurance. (See also p. 5.) Source: Department of Commerce, Bureau of Economic Analysis.
PERSONAL CONSUMPTION EXPENDITURES[Billions of dollars except as noted; quarterly data at seasonally adjusted annual rates]
Period
19661967196819691970_1971__19721973 _1974197519761975: I I I _ _ _
IV__ .1976: I
III I I _ _ _I V _ _ _ _
1977: I
Tn+«*1JLOtcU.personal
con-sumptionexpendi-
tures
464. 8490. 4535. 9579. 7618.8668. 2733. 0809.9887. 5973. 2
1, 079. 7987.3
1, 012. 01, 043. 6I , 064. 71, 088. 51, 122. 01, 159. 1
D
Totaldurablegoods l
67.769.680.085.584.997.1
111.2123.7121. 6131.7156. 5136.0141. 8151.4155. 0157.6162. 0174.0
urable goo
Motorvehicles
andparts
30. 129.735.837. 734. 943.850.655.247. 953.270.756. 359.268.070.471.772.783. 6
ds
Furni-tureand
house-hold
equip-ment
27. 729. 532.635. 036.739.444,850.754.757.663.058. 260.661. 262. 362.965.666.6
Totalnon-
durablegoods *
204.7212. 6230. 4247.0264. 7277.7299. 3333. 8376. 2409. 1440. 4414. 6421.6429. 1434.8441.8456.0464.7
Nondura
Food
106. 6109. 6118.3126. 1136.3140. 6150.4168. 1189.9209. 5224. 4211.8215.2219. 2223. 1225.2230. 2236.4
ble goods
Clothingand
shoes
36. 638.241.845. 146. 650.555. 161.365. 170.075. 471. 373.073.573. 275.979.078.9
Gasolineand oil
16. 017.018. 420.422. 023.424. 927. 836.338.941.539.239.940. 140.341. 644. 144.2
Services
192. 4208. 1225.6247. 2269. 1293.4322.4352.3389. 6432. 4482.8436. 7448. 6463.2474. 9489. 1504.0520. 4
Retailnew pacars (n
of U]
Do-mes-tics
8.47.68.68.57. 18.79.39. 77.57. 18. 67. 67.78.98. 78. 68.39.5
sales ofssengerlillionsaits)
Im-ports
0. 7.8
1. 01. 11. 31.61.61.81.41.61.51.61. 41. 31. 41.51. 71.8
1 Total includes other items not shown separately. Source: Department of Commerce, Bureau of Economic Analysis.
Digitized for FRASER http://fraser.stlouisfed.org/ Federal Reserve Bank of St. Louis
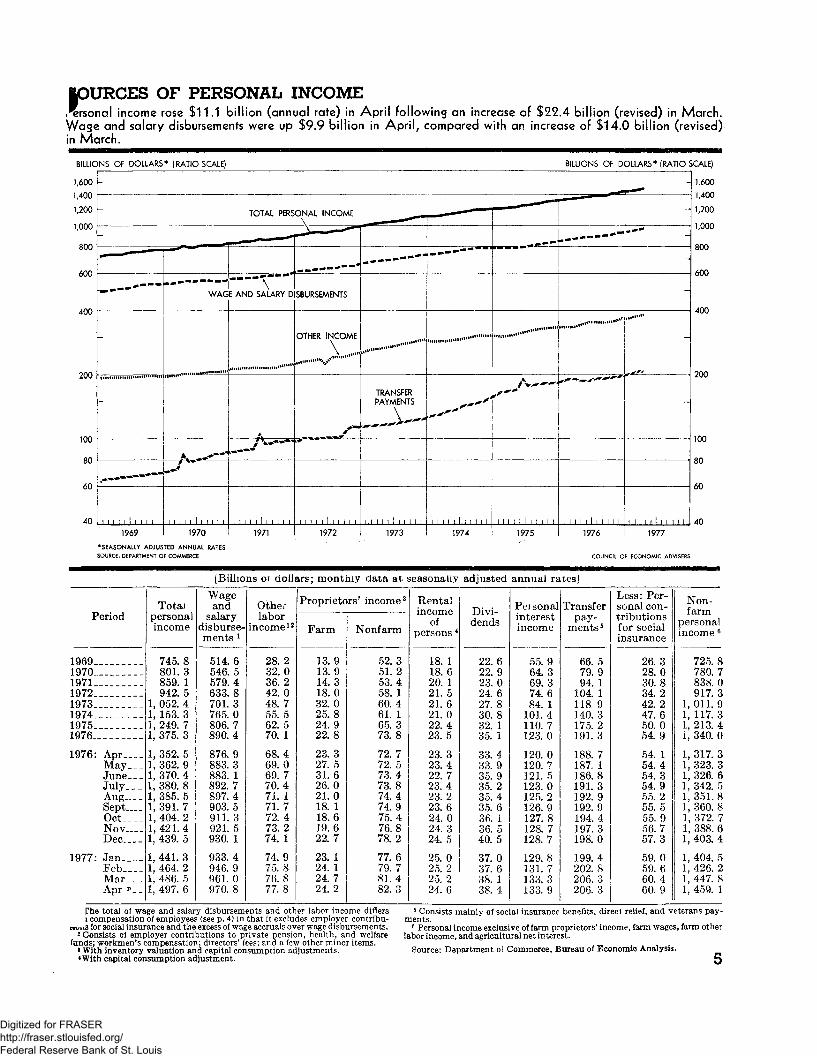
|OURCES OF PERSONAL INCOME.^rsonal income rose $11.1 billion (annual rate) in April following an increase of $22.4 billion (revised) in March,Wage and salary disbursements were up $9.9 billion in April, compared with an increase of $14.0 billion (revised)in March.
BILLIONS OF DOLLARS* (RATIO SCALE) BILLIONS OF DOLLARS* (RATIO SCALE)
60
40 401969 1977
^SEASONALLY ADJUSTED ANNUAL RATES
SOURCE: DEPARTMENT OF COMMERCE COUNCIL OF ECONOMIC ADVISERS
(Billions 01 dollars; monthly data at seasonally adjusted annual ratesj
Period
1969197(L197119721973___197419751976
1976: A p r _ _ _ _MayJune___July___AugSept____OctNov.___Dec
1977: JanFeb____MarApr *_ _
Totalpersonalincome
745.8801.3859. 1942.5
1, 052. 41, 153. 31, 249. 71, 375. 3
1, 352. 51, 362. 91, 370. 4I, 380. 81, 385. 51, 391. 71, 404. 21,421.41, 439. 5
1, 441. 3I , 464. 21, 486. 51, 497. 6
Wageand
salarydisburse-ments 1
514. 6546.5579. 4633.8701. 3765. 0806. 7890. 4
876.9883.3883. 1892. 7897.4903.5911. 3921.5930. 1
933.4946. 9961. 0970.8
Otherlabor
income12
28.232. 036.242.048.755.562. 570. 1
68.469. 069.770.471. 171. 772. 473.274. 1
74.975. 876. 877.8
Proprietc
Farm
13.913. 914.318.032.025. 824.922.8
23. 327.531. 626.021.018. 118.619.622.7
23. 124. 124.724. 2
rs' income3
Nonfarm
52.351. 253. 458. 160.461. 165.373.8
72.772. 573.473.874.474.975.476.878. 2
77.679.781.482. 3
Rentalincome
ofpersons 4
18. 118.620. 121. 521. 621.022. 423.5
23. 323.422. 723.423. 223.624.024. 324. 5
25. 025, 225. 224. 6
Divi-dends
22. 622. 923.024. 627. 830.832. 135. 1
33.433. 935. 935. 235.435. 636. 136. 540. 5
37.037. 638. 138. 4
Personalinterestincome
55.964. 369.374.684. 1
101.4110.7123.0
120.0120. 7121.5123. 0125. 2126.9127. 8128.7128.7
129.8131. 7133. 3133.9
Transferpay-
ments 5
66.579. 994. 1
104. 1118. 9140. 3175.2191.3
188.7187. 1186.8191.3192.9192.9194. 4197.3198.0
199.4202.8206. 3206. 3
Less: Per-sonal con-tributionsfor socialinsurance
26.328. 030.834. 242. 247. 650.054.9
54. 154. 454.354.955. 255.555.956.757.3
59.059.660. 460. 9
Non-farm
personalincome 6
725.8780.7838.0917.3
1,011. 91, 117. 31, 213. 41, 340. 0
1, 317. 31, 323. 31, 326. 61, 342. 51, 351. 81, 360. 81, 372. 71, 388. 61, 403. 4
1, 404. 51, 426. 21, 447. 81, 459. 1
The total of wage and salary disbursements and other labor income differsi compensation of employees (see p. 4) in that it excludes employer contribu-
OTWWS for social insurance and the excess of wage accruals over wage disbursements.2 Consists oi employer contributions to private pension, health, and welfarefunds; workmen's compensation; directors' fees: and a few other minor items.8 With inventory valuation and capital consumption adjustments.
< With capital consumption adjustment.
5 Consists mainly of social insurance benefits, direci relief, and veterans pay-ments.6 Personal income exclusive of farm proprietors' income, farm wages, farm otherlabor income, and agricultural net interest.
Source: Department of Commerce. Bureau of Economic Analysis.
Digitized for FRASER http://fraser.stlouisfed.org/ Federal Reserve Bank of St. Louis

DISPOSITION OF PERSONAL INCOMEReal per capita disposable income increased slightly again in the first quarter.
BILLIONS OF DOLLARS* (RATIO SCALE)
1,400
BILLIONS OF DOLLARS* (RATIO SCALE)1,400
3,000
2,000
1969 1970
* SEASONALLY ADJUSTED ANNUAL RATES
SOURCE: DEPARTMENT OF COMMERCE
1977
3,000
2,000
COUNCIL OF ECONOMIC ADVISERS
Period
196819691970197119721973197419751976
1975: III__IV. _
1976: I. _ _ _IL_.III__IV___
1977: L _ _ _
Per-sonal
income
685. 2745. 8801.3859. 1942.5
1, 052. 41, 153. 31, 249. 71, 375. 3
1 265. 51 299. 71 331. 31 362. 01 386.01 421. 71, 464. 0
Less:Per-sonaltaxandnon-tax
pay-ments
Bil
97. 1115.4115.3116.3141.2150.8170.4168. 8193.6
174. 0179.8183.8189.5195.8205.3218.2
Equals:Dispos-
ableper-
sonalincome
lions of d
588. 1630.4685. 9742.8801.3901.7982.9
1, 080. 91, 181. 7
1, 091. 51, 119. 91, 147. 61, 172. 51, 190. 21, 216. 51, 245. 8
Less:Per-sonalout-lays l
ollars
550. 1595.3635.4685. 5751.9831.3910. 7996.9
1, 105. 2
Seas1, Oil. 11, 036. 21, 068. 01, 089. 61, 114. 31, 148. 61, 186. 1
Equals :Per-sonal
saving
38. 135. 150.657. 349.470.372. 284.076.5
onally adj80.583.779.582.975.867.859.7
Per (dispc
persona
Currentdollars
2,9303, 1113,3483,5883,8374,2854, 6395, 0625,493
usted anil5, 1055,2275, 3475,4555,5265,6375,763
japita>sablei income
1972dollars
Dol
3,4643,5153,6193, 7143,8374,0623, 9684, 0074, 140
ual rates4, 0094, 0494, 1034, 1434, 1424, 1684, 195
Per capsonal cc
tion exp<
Currentdollars
lars
2, 6702,8603,0203,2273, 5103, 8494, 1884,5585,019
4,6184,7244,8634,9545,0545, 1995, 362
ita per-msump-snditures
1972dollars
3, 1563,2343,2653,3423,5103, 6483,5823,6083,783
3, 6263,6593,7313, 7623,7883,8453,903
Percentchangein real
percapitadispos-
ableper-
sonalincome
2.81.53.02.63.35.9
-2. 31.03. 3
-6.64. 15. 44.0-. 12.52.6
Savingas per-cent ofdispos-
ableper-
sonalincome
6. 55.67.47.76.27.87.37.86.5
7.47.56.97. 16.45.64.8
Popula-tion
(thou-sands) 2
200, 706202, 677204, 878207, 053208, 846210, 410211, 901213, 540215, 118
213, 805214, 245214, 599214, 926215, 355215, 805216, 180
1 Includes personal consumption expenditures, interest paid by consumersto business, and personal transfer payn ents to lomgnerF (net).2 Includes Armed Forces abroad. Annual data are for July 1; quarterly dataare for middle oi period, interpolated from monthly data.
Source: Department ol Commerce (Bureau of Economic Analysis and Buof the Census).
6
Digitized for FRASER http://fraser.stlouisfed.org/ Federal Reserve Bank of St. Louis
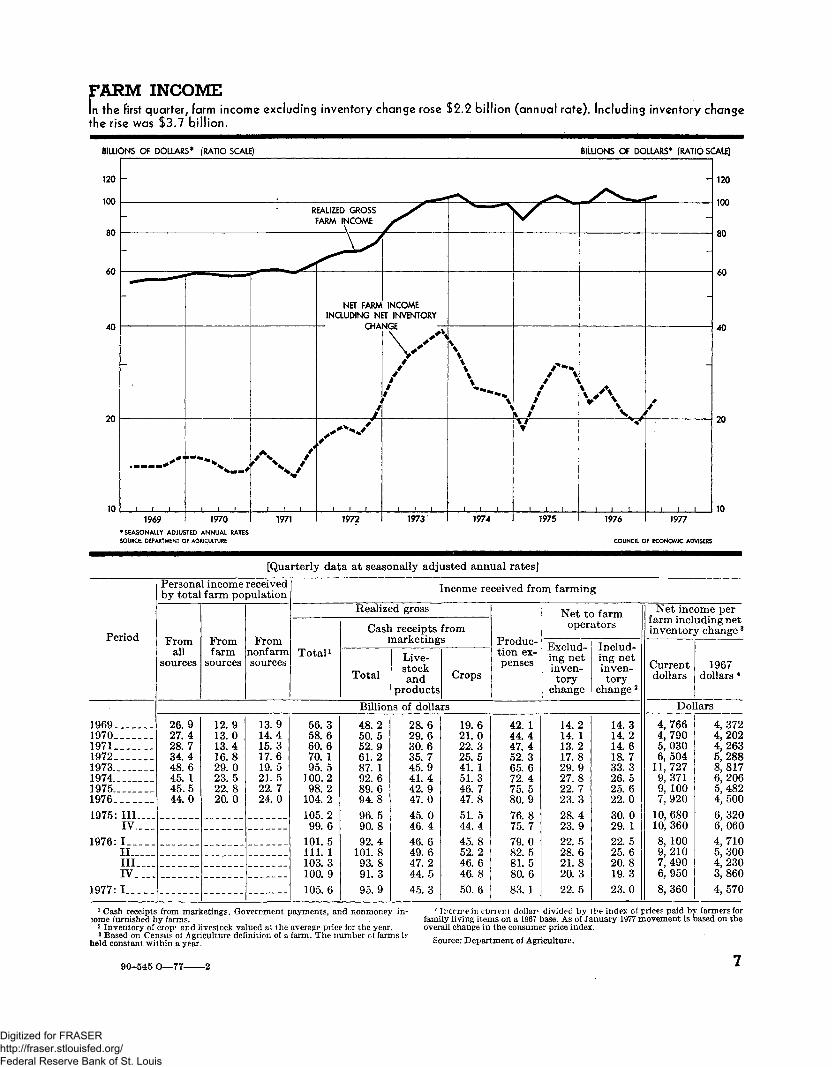
FARM INCOMEIn the first quarter, farm income excluding inventory change rose $2.2 billion (annual rate). Including inventory changethe rise was $3.7 billion.
BILLIONS OF DOLLARS* (RATIO SCALE) BILLIONS OF DOLLARS* (RATIO SCALE)
120
100
80
60
40
20
NET FARM INCOMEINCLUDING NET INVENTORY
CHANGE -
\ / \
\/V\
120
100
80
60
40
20
10 101969 1970 1971 1972 1973 1974 1975 1976 1977
* SEASONALLY ADJUSTED ANNUAL RATES
SOURCE: DEPARTMENT OF AGRICULTURE COUNCIL OF ECONOMIC ADVISERS
[Quarterly data at seasonally adjusted annual rates]
Period
19691970.197119721973197419751976L975: III....
IV, _1976:1
IIIII____IV
1977:1
Personaby tota]
Fromall
sources
26.927.428.734.448.645. 145.544. 0
1 incomefarm po
Fromfarm
sources
12.913.013.416. 829.023. 522. 820.0
receivedpulation
Fromnonfarmsources
13.914. 415. 317.619.521.522.724. 0
Total1
56.358.660.670. 195.5
100.298.2
104.2105.299.6
101.5111. 1103.3100.9105.6
Realize
Casti
Total
Billioi
48.250.552.961.287. 192.689.694.896.590.892. 4
101.893.891.395.9
?d gross
i receiptsnarketing
Live-stockand
productsis of doll a
28.629.630.635.745. 941.442. 947.045.046.446. 649.647.244.545.3
[ncome re
froms
Crops
rs
19.621. 022.325.541. 151.346. 747.851.544. 445.852.246.646.850.6
ceived fro
Produc-tion ex-penses
42. 144.447.452.365. 672.475.580.976. 875.779.082.581.580.683. 1
m f armin
Net t(oper
Exclud-ing netinven-tory
change
14.214. 113.217.829. 927.822. 723.328.423.922.528.621. 820. 322. 5
g
> farmators
Includ-ing netinven-tory
change 2
14.314.214.618. 733.326.525. 622.030.029. 122.525.620. 819. 323.0
Net incfarm inclinventor
Currentdollars
Dol
4,7664,7905,0306,504
11, 7279,3719, 1007,920
10, 68010, 3608, 1009,2107,4906,9508,360
ome peruding nety change 3
1967dollars 4
lars
4,3724,2024,2635,2888,8176,2065,4824, 5006,3206,0604, 7105,3004,2303,8604,570
1 Cash receipts from marketings, Government payments, and nonmoney in-come furnished by farms.2 Inventory of cropc and livestock valued at the average price for the year.
3 Based on Census oi Agriculture definition of a farm. The number ol farms isheld constant within a year.
' Jrccirein current dollar* divided by the index ol price? paid by farmers forfamily living items on a 1967 base. As of January 1977 movement is based on theoverall change in the consumer price index.
Source: Department of Agriculture.
90-545 O—77-
Digitized for FRASER http://fraser.stlouisfed.org/ Federal Reserve Bank of St. Louis

CORPORATE PROFITSAccording to preliminary estimates, profits before tax rose $2.1 billion (annual rate) in the first quarter, whilprofits with inventory valuation adjustment fell $1.1 billion.
BILLIONS OF DOLLARS BILLIONS OF DOLLARS
40 40
1977
SOURCE: DEPARTMENT OF COMMERCE COUNCIL OF ECONOMIC ADVISERS
[Billions of dollars; quarterly data at seasonally adjusted annual rates]
Period
1966196719681969197019711972 „ _ _1973- _ _ _ _ _19741975_ .1976 _ _1975: I I I___
I¥1976: I
IIIIIIV
1977: I*
Profil
Total 2
78. 675.682, 177.966.476.989. 697.287. 8
103. 1133.3117.9119. 1129. 6131.8137.6134. 2133. 1
}s (before
Total
75.972.678.974.262. 672.484.790.476.797.0
125. 8111. 4112.7121. 9125.0130. 5125.6125. 6
tax) witadjustn
Domes
Finan-cial
8.59.0
10.411.312.614. 115.416.214. 112.914. 412. 112. 914. 013.814.415.415. 8
i invent<lent '
stie indu
N
Total 3
67.463.668. 562.950. 158.269.374. 162. 684. 1
111. 499.399. 8
107.9111.2116.0110. 3109. 8
Dry valu*
stries
onfinanc
Manu-fac-tur-mg
41.637.941.236.827. 132.440.644. 136. 946.464. 357. 055. 361. 266.467.262.3
ition
ial
Whole-saleand
retailtrade
8.08.9
10. 110. 19.4
11.713.314.712. 420.928. 124. 425.029. 026.628.827.9
Profitsbefore
tax
80.777.385. 683.471.582.096.2
115.8127. 6114. 5147.9126.9131. 3141. 1146.2150.2154.2156. 3
Taxlia-
bility
33.732.539.439. 734537.741.548. 752. 449.264.454.857. 261. 463.565. 167. 468. 6
Pro
Total
47. 144.946. 243.837.044. 354.667. 175.265. 383.672. 174. 179.782. 785. 186.887.6
fits after
Divi-dends
19.420. 121.922. 622. 923.024.627.830. 832. 135. 132. 632. 233. 134.435.437.737.6
tax
TT_un-dis-trib-utedprof-
its
27.624.724.221.214. 121. 330.039.344. 433.248.439.541.946.648. 349.749. 150.0
Inven-tory
valua-tion
adjust-ment
-2. 1-1.7-3,4-5.5-5. 1-5.0-6.6
-18.6-39.8-11.4-14.6-9.0
-12. 3-11.5-14. 4-12.6-20. 0-23. 1
1 See p. 4 for profits with inventory valuation and capital consumption adjust-ments.
* Includes rest of the world, not shown separately.
3 Includes industries not shown separately.Source: Department ol Commerce, Bureau ol Economic Analysis.
8
Digitized for FRASER http://fraser.stlouisfed.org/ Federal Reserve Bank of St. Louis
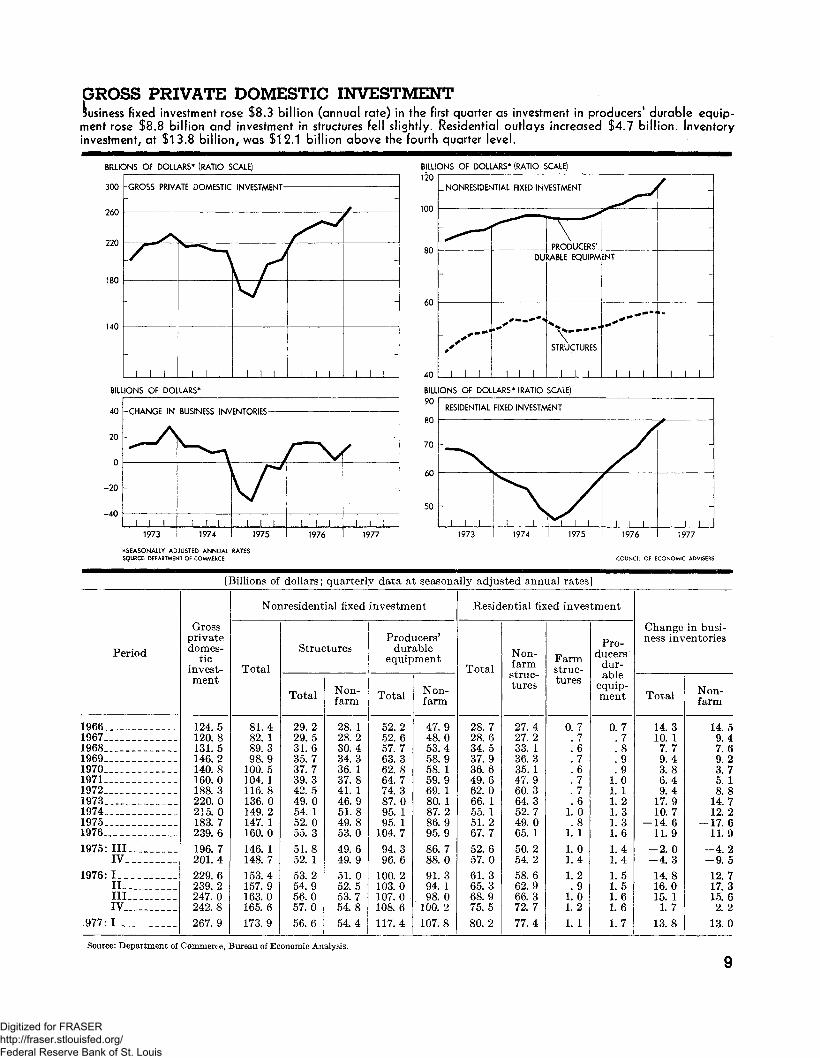
GROSS PRIVATE DOMESTIC INVESTMENTbusiness fixed investment rose $8.3 billion (annual rate) in the first quarter as investment in producers1 durable equip-ment rose $8.8 billion and investment in structures fell slightly. Residential outlays increased $4.7 billion. Inventoryinvestment, at $13.8 billion, was $12.1 billion above the fourth quarter level.
BILLIONS OF DOLLARS* (RATIO SCALE) BILLIONS OF DOLLARS* (RATIO SCALE)120
_ NONRESIDENTIAL FIXED INVESTMENT
100
180
140
60
DURABLE EQUIPMENT
I I I
V~STRUCTURES
I I I
BILL
40
20
-20
40
IONS OF DO
-CHANGE IN
xN
_
i i i1973
.LARS*
BUSINESS INN
"^^\
I I I1974
^ENTORIES
A
KI I i
1975
r \/
i i i1976
_
_
I i . I1977
40
BILLIONS OF DOLLARS* (RATIO SCALE)
J_J L
50 -
1973
*SEASONALLY ADJUSTED ANNUAL RATESSOURCE: DEPARTMENT OF COMMERCE
1977
COUNCIL Of ECONOMIC ADVISERS
[Billions of dollars; quarterly data at seasonally adjusted annual rates]
Period
1966-19671968196919701971197219731974_.__ _ _ _ _1975___19761975: III
IV1976:1 _
I I__ _IIIIV _ _ _ _
.977:1
Grossprivatedomes-
ticinvest-ment
124. 5120. 8131. 5146.2140.8160.0188.3220. 0215. 0183.7239.6196.7201. 4229. 6239.2247.0242.8267.9
Nor
Total
81.482. 189.398.9
100.5104. 1116.8136.0149. 2147. 1160. 0146. 1148. 7153.4157.9163.0165.6173.9
iresident
Struc
Total
29.229.531.635.737.739.342.549.054. 152. 055. 351.852. 153.254.956. 057.056.6
ial fixed
tures
Non-farm
28. 128.230.434.336. 137. 841. 146.951. 849.853.049.649. 951. 052.553. 754.854.4
investmc
Prodidur
equip
Total
52. 252. 657.763. 362.864. 774.387.095. 195. 1
104.794.396.6
100. 2103.0107. 0108. 6117.4
;nt
jeers'ablement
Non-farm
47.948.053.458.958. 159. 969. 180. 187. 286.995.986.788.091. 394. 198. 0
100. 2107.8
Resid
Total
28. 728.634. 537. 936.649. 662.066. 155. 151.267. 752.657. 061.365.368.975.580.2
ential fix
Non-farm
struc—tures
27. 427.233. 136.335.147. 960.364. 352.749.065. 150.254. 258.662. 966.372. 777.4
ed inves
Farmstruc-tures
0.7.7.6.7.6. 7. 7.6
1. 0.8
1. 11.01. 41.2.9
1.01. 21. 1
tment
Prn
ducersdur-o Hip
equip-ment
0.7. 7.8.9.9
1.01. 11.21.31.31.61.41. 41. 51.51. 61.61.7
Changeness inv
Total
14.310. 17.79.43.86.49. 4
17.910.7
-14. 611.9
-2.0-4.314.816.015. 11. 7
13.8
in busi-entories
Non-farm
14.59.47.69.23.75. 18.8
14.712.2
-17.611.9
-4.2-9.512.717.315.62. 2
13.0
Source: Department of Commerce, Bureau of Economic Analysis.
Digitized for FRASER http://fraser.stlouisfed.org/ Federal Reserve Bank of St. Louis

EXPENDITURES FOR NEW PLANT AND EQUIPMENTBusiness plans to increase capital spending 11.7 percent in 1977, according to a survey conducted in January ai.February. Spending rose 6.8 percent in 1976.
BILLIONS OF DOLLARS (RATIO SCALE) BILLIONS OF DOLLARS (RATIO SCALE)
TOTAL NEW PLANT AND EQUIPMENT
40
20 201969 1970
J/ SEE FOOTNOTE 4 BELOW.
SOURCE: DEPARTMENT OF COMMERCE
1977
[Billions of dollars; quarterly data at seasonally adjusted annual rates]
Period
19701971197219731974197519761977 41976: I
IIIIIIV
1977: I 4
II 4 ___. .2nd
half 4_
Total *
79.7181.2188. 4499.74
112.40112. 78120. 49134. 58114.72118. 12122. 55125. 22129. 19132. 71
137. 90
Mi
Total
31. 9529.9931. 3538.0146.0147. 9552. 4859. 1649. 2150. 6454. 7854. 4456. 1757.90
61.06
E?
mufacturi
Dur-able
goods
15. 8014. 1515.6419.2522.6221.8423. 6826.8821.6322.5424.5925. 5025.3326. 77
27. 60
cpenditur€
ng
Non-durablegoods
16. 1515.8415.7218.7623. 3926. 1128.8132. 2927.5828.0930. 2028.9330.8431. 13
33.46
js for plan
Total
47.7651. 2257. 0961.7366. 3964.8268.0175. 4265. 5167.4867. 7670.7873.0274.81
76.84
t and equ
N
Mining
1. 892. 162. 422.743. 183. 794.004. 293.833.834.214. 134. 264. 16
4.37
ipment
onmanuf
Trans-porta-tion
6. 044.935. 726.036.667.577.456.506.558. 247. 257.537.006.58
6. 30
aeturing
Publicutili-ties
13. 1415. 3017.0018. 7120.5520. 1422. 2826. 2621.9121.8521. 6723.4624. 5226. 20
27. 02
Com-muni-cation
10. 1010. 7711.8912.8513.9612.7413. 3015.0612.5412.6213.6414.30
37.37.
39.
Com-mer-cialand
other 2
16.5918. 0520.0721. 4022. 0520.6020.9923.3120.6820. 9420. 9921.36
2587
15
Starts cand equ
proje
Manu-factur-
ing
29. 1828.0035. 2147.5752. 4948. 2451.05
11. 6412. 7713. 2212.88
f plantipmentcts 3
Publicutili-ties
17.2022. 2228.6038. 1345. 7434.5029.66
3. 438. 567. 54
10. 22
1 Excludes agricultural business; real estate operators; medical, legal, educa-tional, and cultural service; and nonprofit organizations. These figures do notagree precisely with the nonresidential fixed investment data in gross nationalproduct estimates, mainly because those data include investment by farmers,professionals, nonprofit institutions, and real estate firms, and certain outlayscharged to current account.' Includes trade, service, construction, finance, and insurance.
10
s Starts are estimated by adding changes in carryover to expenditures duringgiven period.
4 Expenditures estimates based on expected capital expenditures as reported bbusiness in late January and February 1977.
NOTE.—Annual total is the sum of unadjusted quarterly totals.Estimates (as noted in footnote 4) include adjustments when necessary for sys-
tematic biases in expectations data.Source: Department of Commerce, Bureau of Economic Analysis.
Digitized for FRASER http://fraser.stlouisfed.org/ Federal Reserve Bank of St. Louis
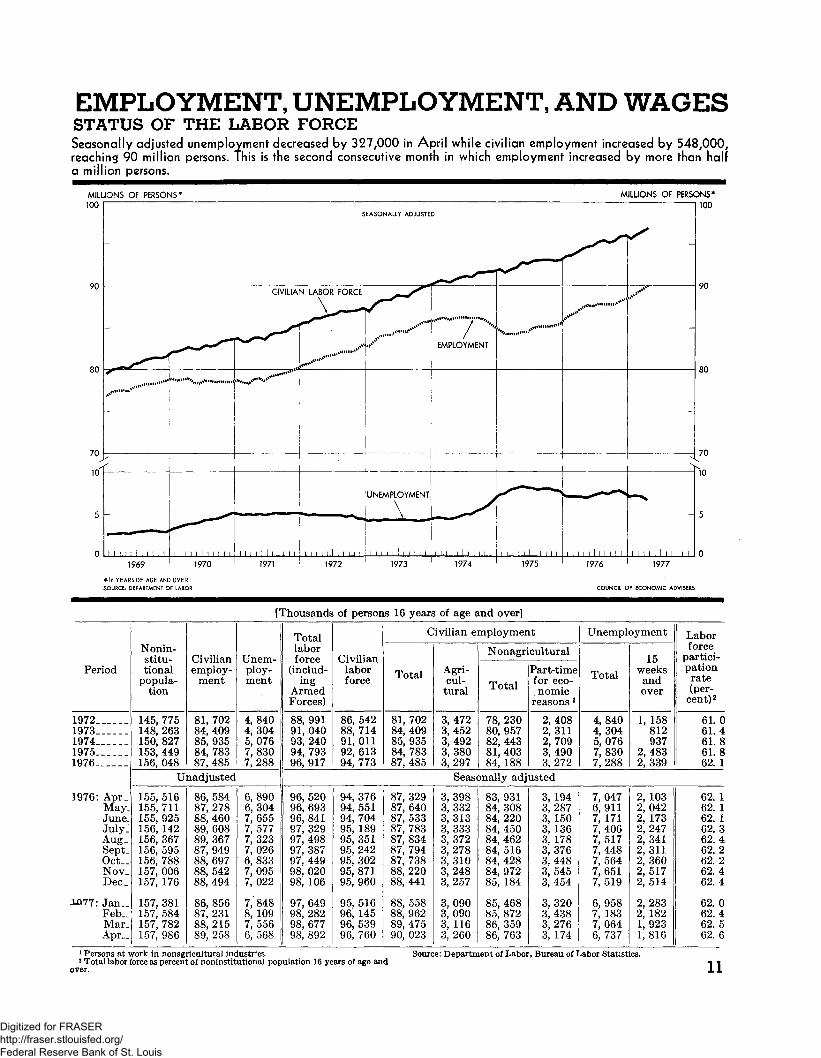
EMPLOYMENT, UNEMPLOYMENT, AND WAGESSTATUS OF THE LABOR FORCESeasonally adjusted unemployment decreased by 327,000 in April while civilian employment increased by 548,000,reachins 90 million persons. This is the second consecutive month in which employment increased by more than halfa million persons.
MILLIONS OF PERSONS100
MILLIONS OF PERSONS*100
5 -
1969 1970 1971 1972 1973 1974 1975 1976 1977
*16 YEARS OF AGE AND OVER.
SOURCE: DEPARTMENT OF LABOR COUNCIL OF ECONOMIC ADVISERS
Period
19721973197419751976-_ .
1976: Apr_May.June.July.Aug_Sept_Oct..Nov.Dec_
i077: jan__Feb..Mar.Apr__
Nonin-stitu-tional
popula-tion
145, 775148, 263150, 827153, 449156, 048
U
155, 516155, 711155, 925156, 142156, 367156, 595156, 788157, 006157, 176
157, 381157, 584157, 782157, 986
Civilianemploy-
ment
81, 70284, 40985, 93584, 78387, 485
nad justed
86, 58487, 27888, 46089, 60889, 36787, 94988, 69788, 54288, 494
86, 85687, 23188, 21589, 258
Unem-ploy-ment
4,8404, 3045,0767,8307,288
6,8906,3047,6557,5777,3237,0266,8337, 0957,022
7,' 8488, 1097, 5566,568
Totallaborforce
(includ-ing
ArmedForces)
88, 99191, 04093, 24094, 79396, 917
96, 52096, 69396, 84197, 32997, 49897, 38797, 44998, 02098, 106
97, 64998, 28298, 67798, 892
Civilianlaborforce
86, 54288, 71491,01192, 61394, 773
94, 37694, 55194, 70495, 18995, 35195, 24295, 30295, 87195, 960
95, 51696, 14596, 53996, 760
C
Total
81, 70284, 40985, 93584, 78387, 485
87, 32987, 64087, 53387, 78387, 83487, 79487, 73888, 22088, 441
88, 55888, 96289, 47590, 023
ivilian e
Agri-cul-tural
3,4723,4523,4923,3803,297
Seasc
3,3983,3323, 3133,3333,3723,2783,3103,2483,257
3,0903,0903, 1163, 260
mploymer
Nonagr;
Total
78, 23080, 95782, 44381, 40384, 188
mally adj
83, 93184, 30884, 22084, 45084, 46284, 51684, 42884, 97285, 184
85, 46885, 87286, 35986, 763
it
cultural
Part-timefor eco-nomic
reasons *
2,4082, 3112,7093,4903,272
usted
3, 1943,2873, 1503, 1363, 1783,3763,4483,5453,454
3,3203,4383,2763, 174
Unempl
Total
4,8404,3045,0767,8307,288
7,0476,9117, 1717,4067,5177,4487,5647,6517,519
6,9587, 1837,0646, 737
oyment
15weeksandover
1, 158812937
2,4832,339
2, 1032,0422, 1732,2472,3412,3112,3602, 5172,514
2,2832, 1821,9231, 816
Laborforce
partici-pationrate(per-
cent)2
61.061.461.861.862. 1
62. 162. 162. 162.362.462.262.262.462.4
62.062.462. 562. 6
1 Persons at work in nonagrieulturaJ industries.2 Total labor force as percent oi noninstitutional population 16 years of age andover.
Source: Department of Labor, Bureau of Labor Statistics.
11
Digitized for FRASER http://fraser.stlouisfed.org/ Federal Reserve Bank of St. Louis
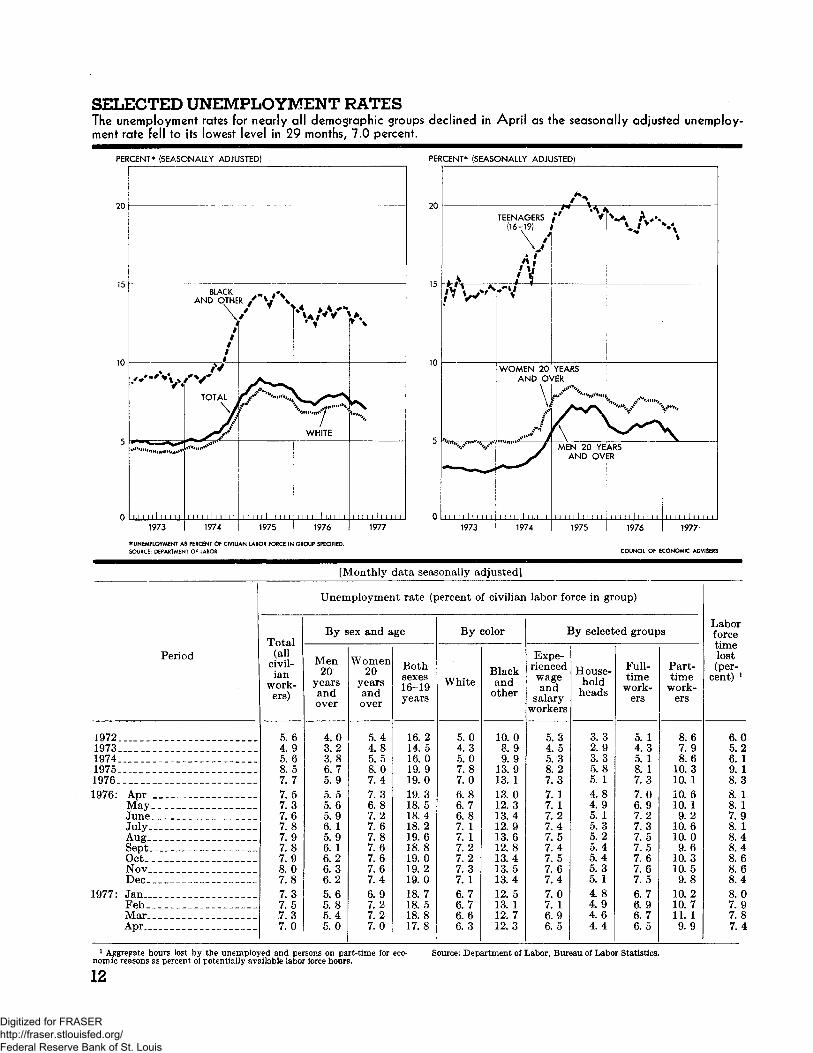
SELECTED UNEMPLOYMENT RATESThe unemployment rates for nearly all demographic groups declined in April as the seasonally adjusted unemploy-ment rate fell to its lowest level in 29 months, 7.0 percent.
PERCENT* (SEASONALLY ADJUSTED) PERCENT* (SEASONALLY ADJUSTED)
1973
* UNEMPLOYMENT AS PERCENT OF CIVILIAN LABOR FORCE IN GROUP SPECIFIED.SOURCE: DEPARTMENT OF LABOR
1976 1977
COUNCIL OF ECONOMIC ADVISERS
[Monthly data seasonally adjusted]
Period
1972. _._19731974 .197519761976: Apr _ __
May.,JuneJuly .Aug_SeptO c t _ _ _Nov _Dec.
1977: JanFebMarApr___
Total(all
civil-ian
work-ers)
5.64.95.68.57.77.57.37.67. 87.97.87.98.07.87.37.57.37.0
Uneir
By s
Men20
yearsandover
4.03.23.86.75.95.55.65.96. 15.96. 16.26.36.25.65.85.45. 0
i
iploymei
ex and a
Women20
yearsandover
5.44. 85.58.07.47.36.87.27.67.87.67.67.67.46. 97.27.27. 0
it rate (p
ge
Bothsexes16-19years
16. 214. 516.019. 919. 019.318.518.418.219.618.819.019. 219. 018.718.518.817.8
>ercent o
By <
White
5.04. 35.07.87.06.86.76.87. 17. 17.27.27.37. 16.76.76.66.3
f civilian
3olor
Blackand
other
10.08.99.9
13.913. 113. 012.313.412. 913.612. 813.413.513.412.513. 112. 712. 3
labor fo
I
Expe-riencedwageand
salaryworkers
5.34.55.38.27.37.17. 17.27.47.57.47.57.67.47.07. 16.96. 5
rce in gr
3y select
House-hold
heads
3.32.93.35.85. 14.84.95. 15. 35.25.45.45.35. 14.84.94.64.4
oup)
ed group
Full-time
work-ers
5. 14.35. 18. 17.37.06.97.27.37.57.57.67.67.56.76.96.76.5
s
Part-time
work-ers
8.67.98.6
10.310. 110.610. 19.2
10.610.09.6
10.310.59.8
10.210.711. 19. 9
Laborforcetimelost(per-
cent) 1
6.05.26. 19. 18.38. 18. 17.98. 18.48.48.68.68.48.07.97.87.4
1 Aggregate hours lost by the unemployed and persons on part-time for eco-nomic reasons as percent of potentially available labor force hours.
Source: Department of Labor, Bureau of Labor Statistics.
12
Digitized for FRASER http://fraser.stlouisfed.org/ Federal Reserve Bank of St. Louis
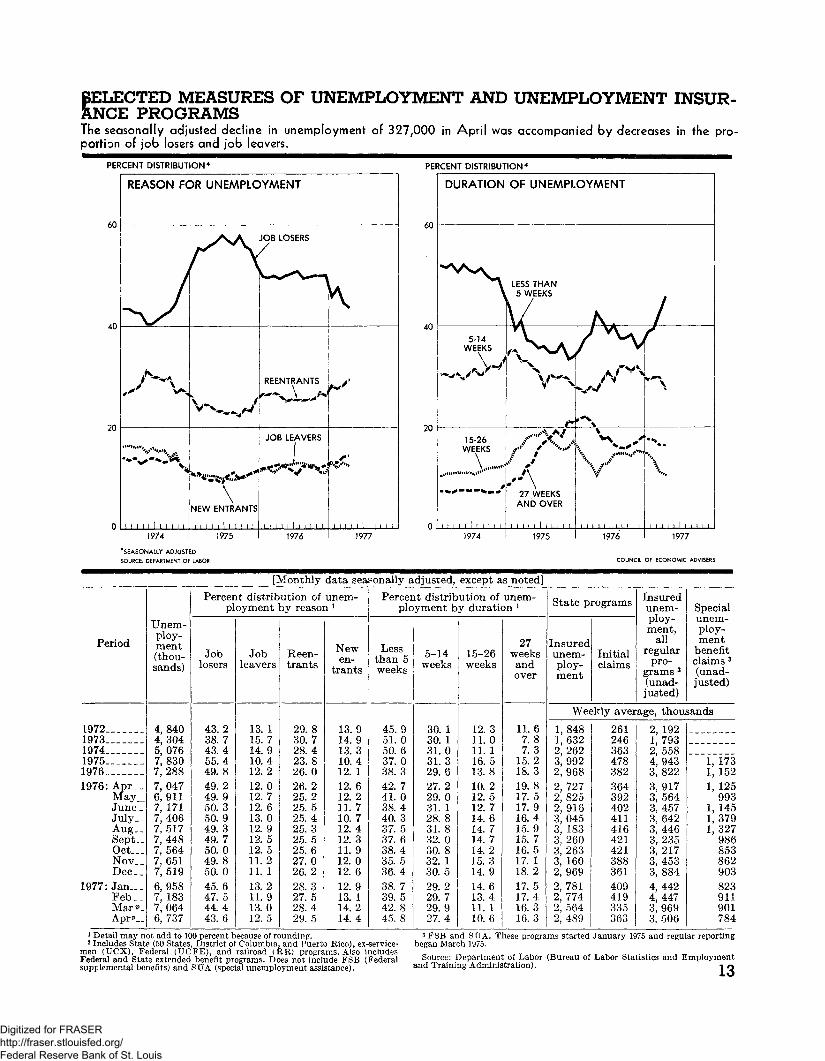
BELECTED MEASURES OF UNEMPLOYMENT AND UNEMPLOYMENT INSUR-ANCE PROGRAMSThe seasonally adjusted decline in unemployment of 327,000 in April was accompanied by decreases in the pro-port! Dn of job losers and job leavers.
PER
60
40
20
0
CENT D1STRIBUT
REASON FC
/^X
y^v..»..,..,
\
I I I 1 I 1 I | i LI1974
'SEASONALLY ADJUST
SOURCE: DEPARTMENT O
ION*
DR UNEMPLC
r^\
K
NEW ENTRANTS
| | ! 1 I 1 1 1 I 1 1
1975
EDLABOR
>YMENT
JOB LOSERS/
nlREENTRANTS
JOB LEAVERS
«**?**
i i i i i 1 i i i i i1976
^**'*
P&».
i i i i i I i i i i i1977
PEF
60
40
20
0
?CENT DISTRIBUT
DURATION
-^
5-14WEEKS
^*-w\/^r
15-26WEEKS
\,«««tltf
.»'»«"1§"""̂
. . /
i i i i i ! i i i i i1974
ION*
OF UNEMPL
LESS THAN5 WEEKS
U—V A
'v -^
v\s..<\*/
/ s\s<* s-•A
27 WEEKSAND OVER
i , i | , i i i . t i1975
OYAAENT
-A^~/ ^AJ/A/-,
%'V
'^
\ ^^V
1976
COUNCIL
//f
^v
•%.
V
. . . . . I i i ij_LJ
1977
OF ECONOMIC ADVISERS
[Monthly data seasonally adjusted, except as noted]
Period
197219731974197519761976: Apr_ _
May_June_July-Aug__Sept__Oct___Nov__Dec__
1977: Jan___Feb__Mar*>_Apr*>__
Unem-ploy-ment(thou-sands)
4,8404, 3045,0767,8307,2887,0476,9117, 1717,4067,5177,4487, 5647, 6517,5196,9587, 1837, 0646, 737
Percerpl
Joblosers
43.238.743.455.449. 849.249.950. 350.949. 349. 750.049. 850. 045. 647.544. 443. 6
it distriboyment
Jobleavers
13.115. 714.910. 412.212.012.712. 613.012.912. 512. 511.211. 113.211.913.012. 5
ution ofDy reasoi
Reen-trants
29.830.728.423.826. 026. 225.225.525. 425. 325.525.627.026.228. 327.528.429. 5
unem-i 1
Newen-
trants
13.914.913. 310. 412. 112. 612.211.710.712. 412. 311. 912. 012. 612. 913. 114. 214. 4
Percerplo
Lessthan 5weeks
45.951.050. 637.038. 342. 741.038.440. 337. 537. 638. 435. 536. 438. 739. 542. 845. 8
it distribyment b
5-14weeks
30. 130. 131. 031.329.627. 229. 031. 128.831. 832. 030.832. 130. 529. 229.729.927. 4
ution ofy durati(
15-26weeks
12. 311.011. 116.513. 810. 212.512.714. 614.714. 714.215. 314. 914. 613.411. 110. 6
unern-m 1
27weeksandover
11. 67.87.3
15.218.319.817.517.916. 415. 915. 716.517. 118. 217.517.416. 316. 3
State p
Insuredunem-ploy-ment
Wee
1, 8481,6322,2623,9922,9682,7272, 8252, 9163,0453, 1833, 2603,2633, 1602, 9692,7812,7742, 5642, 489
ro grams
Initialclaims
skly aver
261246363478382364392402411416421421388361409419335363
Insuredunem-ploy-ment,
allregular
pro-grams 3
(unad-justed)
age, thorn
2, 1921,7932,5584,9433, 8223,9173,5643,4573, 6423, 4463, 2353,2173,4533, 8844, 4424, 4473,9693,506
Specialunem-ploy-ment
benefitclaims 3
(unad-justed)
sands
1, 1731, 1521, 125
9931, 1451,3791,327
986853862903823911901784
1 Detail may not add to 100 percent because of rounding.2 Includes State (50 States, District of Columbia, and Puerto Rico), ex-service-
men (UCX), Federal (UCFE), and railroad (RR) programs. Also includesFederal and State extended benefit programs. Does not include FSB (Federalsupplemental benefits) and SUA (special unemployment assistance).
3 FSB and SUA. These programs started January 1975 and regular reportingbegan March 1975.
Source: Department of Labor (Bureau of Labor Statistics and Employmentand Training Administration). -i Q
Digitized for FRASER http://fraser.stlouisfed.org/ Federal Reserve Bank of St. Louis
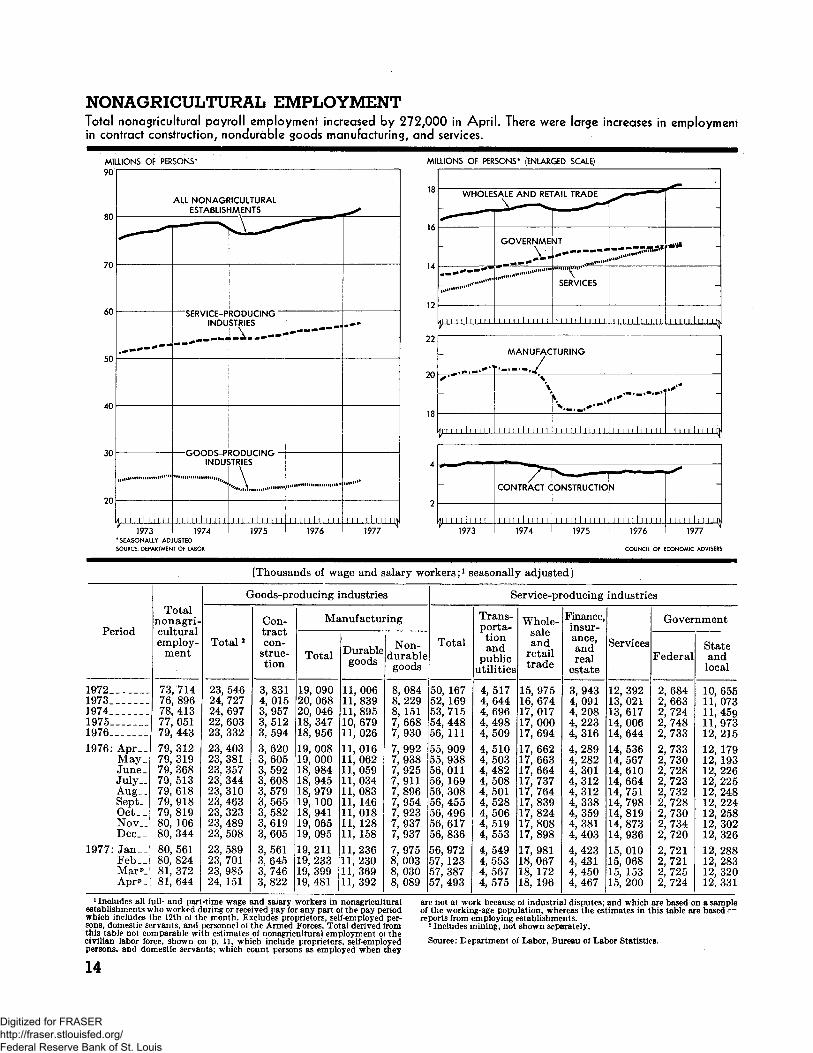
NONAGRICULTURAL EMPLOYMENTTotal nonagricultural payroll employment increased by 272,000 in April. There were large increases in employmentin contract construction, nondurable goods manufacturing, and services.
MILLIONS OF PERSONS*
90'|
MILLIONS OF PERSONS* (ENLARGED SCALE)
80
70
60
50
40
30
20
ALL NONAGRICULTURALESTABLISHMENTS
"SERVICE-PRODUCING"INDUSTRIES
-GOODS-PRODUCING -INDUSTRIES
1973 1974* SEASONALLY ADJUSTED
SOURCE: DEPARTMENT OF LABOR
1975 1976 1977
18
16
14
12
22
20
18
WHOLESALE AND RETAIL TRADE
,,,.•"<*"
GOVERNMENT
X4—::::„„„..""""
..™rSERVICES
---"-r
.«,•.»**"
-
in i i i 1 1 i i i i
AAANUFAC
\
i i 1 1 1 1 i i M 1
TURING
* .-'1
i i i 1 1 I 1 1 i i i
^^ *«
1 1 I i i 1 1 1 1 1 1
-
.-"
i i i i i 1 i i M ib
* - "' • •
~
41 i i 1 1 I ! 1 ! 1 I
1973
"7=1CONTRACT (
1974
ONSTRUCTIO
I I i i I I i i i i i1975
N
1 1 i i i I i i i 1 11976
COUNCIL OF E
•X*
"M i l l I I I I I IV
1977
CONOMIC ADVISERS
[Thousands of wage and salary workers;1 seasonally adjusted]
Period
197219731974197519761976: Apr__
May.June_July__Aug_._Sept..Oct__Nov__Dec__
1977: Jan__Feb__Marp_Apr*>_
Totalnonagri-culturalemploy-
ment
73,71476, 89678, 41377, 05179, 44379, 31279, 31979, 36879, 51379, 61879, 91879, 81980, 10680, 34480, 56180, 82481, 37281, 644
C
Total 2
23, 54624, 72724, 69722, 60323, 33223, 40323, 38123, 35723, 34423, 31023, 46323, 32323, 48923, 50823, 58923, 70123, 98524, 151
;roods-pr(
Con-tractcon-
struc-tion
3,8314,0153,9573,5123,5943,6203,6053,5923,6083,5793, 5653,5823,6193,6053,5613, 6453,7463,822
educing i
Ma
Total
19, 09020, 06820, 04618, 34718, 95619, 00819, 00018, 98418, 94518, 97919, 10018, 94119, 06519, 09519,21119, 23319, 39919, 481
ndustrie
mufactui
Durablegoods
11, 00611,83911,89510, 67911, 02611,01611, 06211, 05911, 03411, 08311, 14611, 01811, 12811, 15811,23611, 23011, 36911, 392
3
ing
Non-durablegoods
8,0848,2298, 1517,6687,9307,9927,9387,9257,9117,8967,9547,9237,9377,9377,9758,0038, 0308,089
Total
50, 16752, 16953, 71554, 44856, 11155, 90955, 93856,01156, 16956, 30856, 45556, 49656, 61756, 83656, 97257, 12357, 38757, 493
S
Trans-porta-tionand
publicutilities
4,5174,6444,6964,4984,5094,5104, 5034,4824,5084, 5014,5284,5064,5194,5534,5494,5534,5674, 575
ervice-pi
Whole-saleand
retailtrade
15, 97516, 67417, 01717, 00017, 69417, 66217, 66317, 66417, 73717, 76417, 83917, 82417, 80817, 89817, 98118, 06718, 17218, 196
oducing
Finance,insur-ance,andreal
estate
3,9434,0914,2084,2234,3164,2894,2824,3014,3124,3124,3384,3594,3814,4034,4234,4314,4504,467
Industrie
Services
12, 39213, 02113, 61714, 00614, 64414, 53614, 56714, 61014, 66414, 75114, 79814, 81914, 87314, 93615, 01015, 06815, 15315, 200
S3
Gover
Federal
2,6842,6632,7242, 7482, 7332, 7332, 7302,7282, 7232,7322,7282,7302,7342,7202,7212,7212,7252,724
nment
Stateandlocal
10, 65511,07311,45911, 97312, 21512, 17912, 19312, 22612, 22512, 24812, 22412, 25812, 30212, 32612, 28812, 28312, 32012, 331
1 Includes all full- and part-time wage and salary workers in nonagriculturalestablishments who worked during or received pay lor any part ol the pay periodwhich includes the 12th oJ the month. Excludes proprietors, self-employed per-sons, domestic servants, and personnel oi the Armed Forces. Total derived fromthis table not comparable with estimates of nonagricultural employment ol thecivilian labor force, shown on p. 11, which include proprietors, self-employedpersons, and domestic servants; which count persons as employed when they
14
are not at work because oi industrial disputes; and which are based on a sampleof the working-age population, whereas the estimates in this table are based r-reports from employing establishments.1 Includes mining, not shown separately.
Source: Department of Labor, Bureau of Labor Statistics.
Digitized for FRASER http://fraser.stlouisfed.org/ Federal Reserve Bank of St. Louis
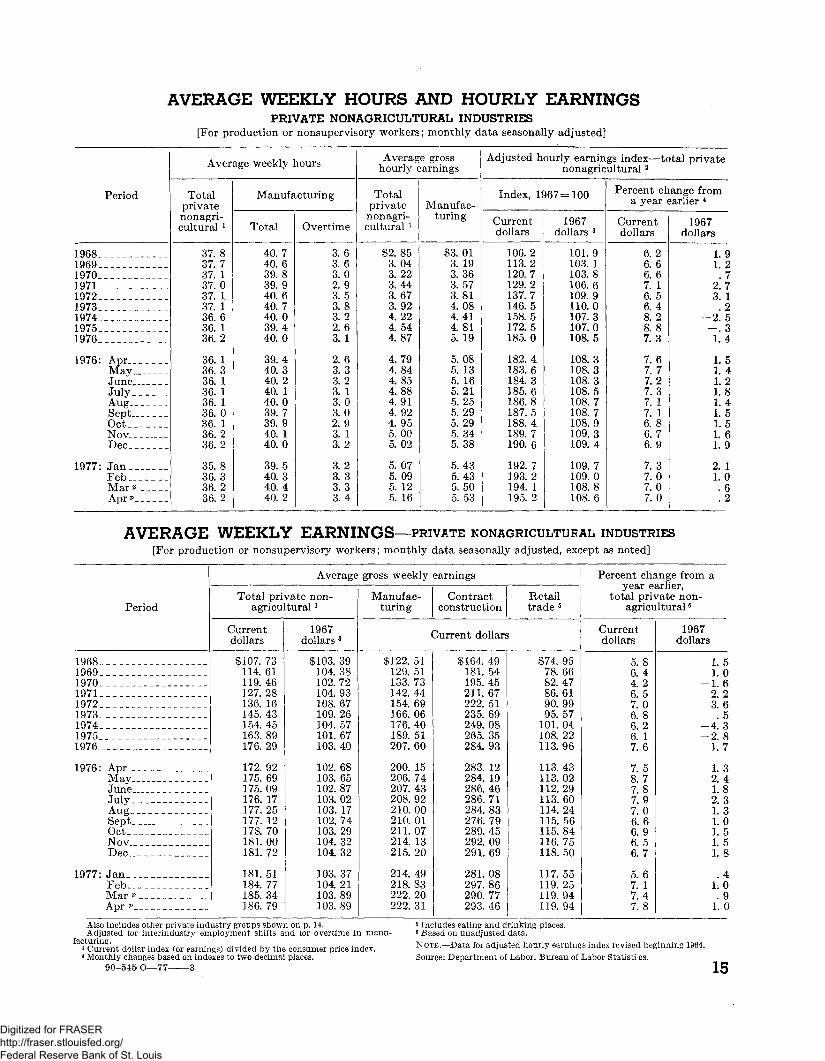
AVERAGE WEEKLY HOURS AND HOURLY EARNINGSPRIVATE NONAGRICULTURAL INDUSTRIES
[For production or nonsupervisory workers; monthly data seasonally adjusted]
Period
19681969197019711972 .1973197419751976
1976: AprMay __ _JuneJulyAugSeptOctNov.Dec
1977: JanFebMar J> _Apr»_
Aver
Totalprivatenonagri-cultural l
37. 837. 737. 137. 037. 137. 136. 636. 136.2
36. 136. 336. 136. 136. 136. 036. 136.236.2
35. 836.336.236.2
age weekly '.
Manufa
Total
40. 740.639.839.940. 640. 740.039. 440. 0
39. 440. 340. 240. 140. 039.739. 940. 140.0
39.540.340. 440. 2
lours
LCturing
Overtime
3.63.63.02.93. 53.83.22.63. 1
2.63. 33.23. 13.03.02. 93. 13.2
3.23. 33.33. 4
Averaghourly €
Totalprivatenonagri-cultural l
$2.853. 043.223. 443. 673.924. 224. 544.87
4. 794. 844.854.884.914.924. 955.005. 02
5. 075. 095. 125. 16
e grossearnings
Manufac-turing
$3.013. 193.363. 573. 814.084. 414.815. 19
5.085. 135. 165.215.255. 295.295.345. 38
5.435.435.505. 53
Adjusted h
Index, 1<
Currentdollars
106.2113.2120.7129. 2137.7146.5158.5172.5185.0
182.4183.6184.3185.6186.8187.5188. 4189.7190. 6
192.7193.2194. 1195.2
ourly earninnonagric
)67=100
1967dollars 3
101.9103. 1103.8106.6109. 9110.0107.3107.0108.5
108. 3108.3108.3108.5108.7108. 7108.9109.3109.4
109.7109.0108. 8108. 6
gs index — tcultural 2
Percent cha year (
Currentdollars
6. 26. 66. 67. 16. 56. 48. 28. 87.3
7.67. 77.27.37. 17. 16.86.76.9
7.37.07.07.0
>tal private
ange fromearlier 4
1967dollars
1.91.2.7
2.73. 1.2
-2.5-.31. 4
1.51. 41.21.81. 41.51.51. 61.9
2. 1L 0.6. 2
AVERAGE WEEKLY EARNINGS—PRIVATE KONAGRICULTUFAL INDUSTRIES[For production or nonsupervisory workers; monthly data seasonally adjusted, except as noted]
Period
1968196919701971 „1972_197319741975__ _1976
1976: AprMayJuneJulyAug,. _ __ _ _SeptOctNov__Dec _
1977: Jan _ _ _FebMar PApr v
Total priagncu
Currentdollars
$107. 73114. 61119. 46127. 28136. 16145. 43154. 45163. 89176. 29
172. 92175. 69175. 09176. 17177. 25177. 12178. 70181. 00181. 72
181. 51184. 77185. 34186. 79
Average
vate non-tural l
1967dollars 3
$103. 39104. 38102. 72104. 93108. 67109. 26104. 57101. 67103. 40
102. 68103. 65102. 87103. 02103. 17102. 74103. 29104. 32104. 32
103. 37104. 21103. 89103. 89
gross weekly
Manufac-turing
<
$122. 51129. 51133. 73142. 44154. 69166. 06176. 40189. 51207. 60
200. 15206. 74207. 43208. 92210. 00210. 01211. 07214. 13215. 20
214. 49218. 83222. 20222. 31
earnings
Contractconstruction
Current dollars
$164. 49181. 54195. 45211.67222. 51235. 69249. 08265. 35284.93
283. 12284. 19286. 46286. 71284. 83276. 79289. 45292. 09291. 69
281. 08297. 86290. 77293. 46
Retailtrade 5
$74. 9578.6682. 4786.6190.9995. 57
101. 04108. 22113. 96
113. 43113. 02112. 29113. 60114. 24115. 56115. 84116. 75118. 50
117. 55119. 25119. 94119.94
Percent chzyear e
total prhagncu
Currentdollars
5.86. 44.26. 57. 06.86.26. 17.6
7.58.77.87.97.06.66.96. 56.7
5.67. 17.47.8
inge from aarlier,/ate non-Itural 6
1967dollars
1.51.01.62. 23.6.5
-4. 3-2.8
1.7
1.32.41.82.31.31.01.51.51. 8
. 41.0.9
1. 0
Also includes other private industry groups shown on p. 14.Adjusted for interindustry employment shifts and for overtime in manu-
facturing.3 Current dollar index (or earnings) divided by the consumer price index.4 Monthly changes based on indexes to two decimal places.
90-545 O—77 3
5 Includes eating and drinking places.6 Based on unadjusted data.NOTE.—Data for adjusted hourly earnings index revised beginning 1964.Source: Department of Labor, Bureau of Labor Statist! cs.
15
Digitized for FRASER http://fraser.stlouisfed.org/ Federal Reserve Bank of St. Louis

PRODUCTIVITY AND RELATED DATA, PRIVATE BUSINESS ECONOMY
Period
196619671968...1969
197019711972 „_19731974
1975 -.1976
1975: IIIIIIIV
1976: IIIIIIIV _
1977: I
1966196719681969
1970.1971197219731974_
1975__.1976
1975: IIIIIIIV
1976: IIIIIIIV
1977: I
Outi
Totalprivatebusiness
98.0100.0105. 1108. 3
107.4110. 3117.6124. 5120.8
118. 1126. 1
114.2116.7120. 1121.2
124.2125. 8126. 8127.5
130.0
5.52.05. 13.0
— . 92.86.65.9
-3.0
-2.36.8
-11.28.9
12. 33.6
10.25.52.92.3
8.0
Hit1
Privatenon-farm
business
98. 1100.0105.4108.6
107.4110.3117. 9125.0121. 1
118.0126.2
114.4116.6119.9121.3
124.3126.0126.9127.5
130. 1
6. 01.95.43.0
-1. 12.76.96.0
-3. 1
-2.66.9
-11.37.9
12. 14.5
10.55.43.01.9
8.3
Hourspers
Totalprivatebusiness
100.3100.0101.7104. 5
102.8102.3106. 0110. 1110.6
106. 1108.9
105.7104. 9105.9107.5
108.2108.9108. 9109.5
110. 4
Percei
2.3-.31.72.7
-1.6-.43.63.9.4
-4.12.7
-12.5-2.7
3.95.9
2.92.6. 1
2.1
3.2
of allons2
Privatenon-farm
business
1967 =
100.0100.0102. 1105.3
104. 0103.7107. 6112.2112.7
108.0111.4
107.8106.9107.7109.7
111.0111.2111. 3112.2
113. 3
at change
3.3.0
2. 13. 2
-1. 2-.33.74.3. 4
-4.13.1
-12,3-3.5
2.97.6
4.81.0.4
3.2
4 1
Output ]of all p
Totalprivatebusiness
= 100; quai
97.8100.0103.3103.7
104.5107.8111.0113. 1109.2
111.3115.7
108.1111.2113.4112.8
114.7115.5116.3116.4
117.8
; quarterly
3.22.33.3.3
.73.22.91.93.4
1.940
1.412.08.1
-2. 1
7.02.92.9.3
47
3er hourersons
Privatenon-farm
business
rterly dat«
98. 1100.0103.2103. 1
103.2106.3109. 5111.4107.5
109.2113. 2
106.0109.0111.4110.6
112.0113.2114.0113.6
114.8
y data at
2.51.93.2-.2
.22.93.01.7
-3.5
1.63.7
1. 111.88.9
-2.8
5.44.42.6
-1.2
41
Compeper 1"
Totalpri-vate
business
a, seasons
94.7100. 0107.6115. 1
123.3131.5138.9150.3164 3
179.9193.7
176. 1178.7180.81842
188.8191.8195.3199.2
204.4
seasonal
7.05.67.67.0
7.26.65.78.29.3
9.57.7
12.96.14.87.6
10. 46.57.58.2
10.9
nsationlour 3
Privatenon-farm
business
illy adjusl
94.5100. 0107.3114.3
121.9129.9137.4148. 1162.0
177.4190.5
173. 1176. 1178.9181. 4
185.4188.9192. 1195.4
200. 2
y adjuste
6.15.87.36.5
6,76.65.87.89.4
9.57.4
11.67.16.45.8
9.07.77.17.0
10.3
UnitCO
Totalpri-vate
business
,ed
96.8100. 0104 1111.0
118. 1121.9125,2132. 9150. 4
161. 6167.4
162.9160.7159.5163.3
1646166.0167. 8171. 1
173.6
d annual
3.73.34 16.6
6.43.22.76.2
13.2
7.53.6
11.3-5.2-3.110.0
3.13.5458.0
5.9
laborsts
Privatenon-farm
business
96.4100. 0103.9110.9
118. 1122.2125. 5133.0150.8
162.4168.2
163.3161.5160.6164 1
165. 4166.8168.5171.9
1744
rates
3.43.83.96.6
6.53.52.76.0
13.4
7.73.6
10.4-42-2.3
8.9
3.43.2438.3
6.0
Implicidefla
Totalpri-vate
business
97.2100. 0103.9108.8
113.9118.9123. 2130.3143.8
157.51646
154.5155. 9158.4160.9
161.7163. 8165.4167.4
169.4
3.22.93.947
474.43.65.8
10.3
9.545
11.33.56. 66.6
2. 15.23.95.0
48
t pricetor*
Privatenon-farm
business
96.8100.0104 0108.7
1140119.2122. 9128.0142.0
156.4163.9
1540155. 0157.0159.3
161.0162.51648167.2
168.6
2.93.34045
49453. 141
11.0
10.148
13.52.65.36.2
433.65.85.9
3.5
1 Output refers to gross domestic product originating in the sector in 1972 dollars.2 Hours of all persons in private industry engaged in production, including
hours of proprietors and unpaid family workers. Estimates based primarily onestablishment data.
3 Wages and salaries of employees plus employers' contributions for socialinsurance and private benefit plans. Also includes an estimate of wages, salaries,and supplemental payments for the self-employed.
4 Current dollar gross domestic product divided by constant dollar gross domes-tic product.
NOTE.—Percent changes are from preceding period and are based on originaldata; they therefore may differ slightly from percent changes based on indexesshown here.
Source: Department of Labor, Bureau of Labor Statistics.
16
Digitized for FRASER http://fraser.stlouisfed.org/ Federal Reserve Bank of St. Louis

PRODUCTION AND BUSINESS ACTIVITYINDUSTRIAL PRODUCTION AND CAPACITY UTILIZATIONIndustrial production rose 0.8 percent in April following a 1.4 percent increase in March. Relatively large gainswere widespread, except for automobile production, which declined following a sharp rise in March.
INDEX, 1967=100* (RATIO SCALE)160
TOTAL INDUSTRIAL PRODUCTION
MANUFACTURING PRODUCTION
INDEX, 1967=100* (RATIO SCALE)180
160
140
120
100
UTILITIES AND MINING PRODUCTION
*0*
di
MINING
ill1973 1974
PERCENT (RATIO SCALE)100
UTILITIES
1975
i n I ii1976 1977
MANUFACTURING CAPACITY UTILIZATION RATE
1973 1974 1975 1976 1977 1973 1974 1975 1976 1977
* SEASONALLY ADJUSTED
SOURCE: BOARD OF GOVERNORS OF THE FEDERAL RESERVE SYSTEM COUNCIL OF ECONOMIC ADVISERS
[Seasonally adjusted]
Period
1967 proportion1971 ..19721973___197419751976 ___1976: Apr
MayJuneJulyAugSeptOct.NovDec
1977: Jan_._Feb.-Mar v
Apr *
Total iiprodi
Index,1967=
100
100. 00109.6119.7129.8129.3117.8129.8128,4129.6130. 1130.7131.3130. 8130.4131.8133. 1132. 1133.2135.0136. 1
idustrialiction
Per-cent
changefromyear
earlier
1.79.28.4-. 4
-8.910.214.014. 011.810.48.57. 16.76.77.05. 14.65.46.0
IndusM,
Total
87.95108.2118.9129.8129.4116. 3129.4128.5129.6130.2131.0131.6130.7129.9131. 9132.8131.5132.9134.8135. 9
try produanufacturi
Dur-able
51.98102.4113.7127. 1125.7109.3121.4120. 1121.7122. 3124. 2125. 1122.4121.5123. 8125.2123. 0123.9126.4127. 5
ction indng
Non-dur-able
35.97116. 6126. 5133.8134. 6126.4141.0140.7140.9141.3141. 1140.9142.6142. 2143.5143.7143. 7145. 7146.8147.9
exes, 196
Mining
6. 36109. 8113. 1114. 7115.3112.8114 1113.5113.0114.4112.5114.4115.7116.7116. 2116. 2113.2114.3118. 8118.5
7=100
Utili-ties
5. 69130.5139.4145.4143.7146.0151.7150.8153.0151.2150.8151. 3150. 1151. 2154.0155.5161. 5159. 3156.2157.0
Manuf
Federalsen
Totalmanu-factur-
ing
78.083. 187.584.273.680. 179.880.380.580.981. 180. 479.780.881.280.280.881.882.2
acturing crate, p<
Reservees
Mate-rials
83 188.092.487.773.680.380. 180.880.881. 281.681.080.380.380.179. 180. 181. 282.0
japaeity i^rcent l
Com-merceseries 2
808386837781
82
80
81
itilization
Whar-ton
series 8
86.491.897. 193.080.487.6
87.8
88.2
87.9
88. 4
(Output as percent of capacity.'Annual data are averages of four monthly indexes.3 Quarterly data entered in last month of quarter. Annual data are
quarterly data.
Sources: Board of Governors of the Federal Reserve System, Department ofCommerce (Bureau of Economic Analysis), and Wharton School of Finance.
17
Digitized for FRASER http://fraser.stlouisfed.org/ Federal Reserve Bank of St. Louis
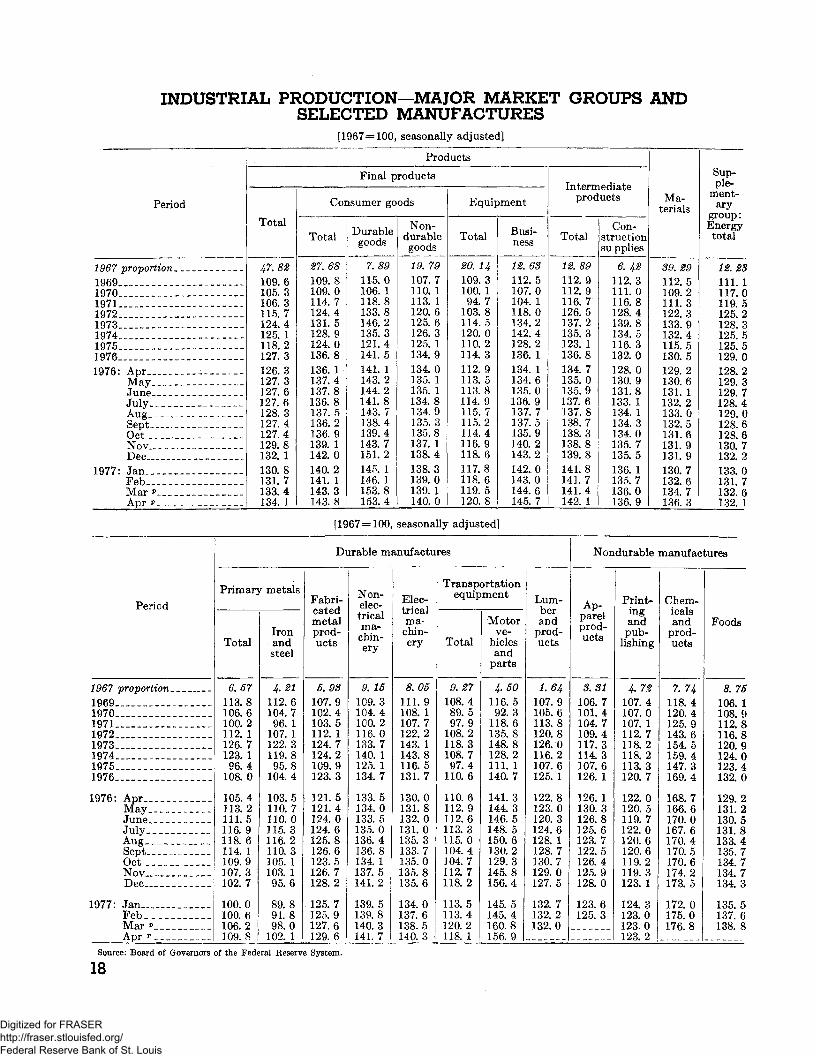
INDUSTRIAL PRODUCTION—MAJOR MARKET GROUPS ANDSELECTED MANUFACTURES
[1967=100, seasonally adjusted]
Period
1967 proportion1969 .-1970 -1971.19721973___19741975—1976 _ -1976: Apr .
MayJuneJulyAug^ _-.Sept - -- -Oct ..Nov _ „ _ _Dec._
1977: Jan...FebMar p
Apr * » _ _
Total
47.82109.6105.3106. 3115.7124.4125. 1118. 2127. 3126.3127.3127. 6127.6128.3127.4127,4129.8132, 1130.8131.7133.4134. 1
Coi
Total
27. 68109. 8109.0114. 7124.4131.5128.9124.0136.8136. 1137.4137.8136. 8137. 5136.2136. 9139. 1142. 0140.2141. 1143.3143. 8
Final p
isumer go
Durablegoods
7. 89115. 0106. 1118.8133.8146. 2135. 3121. 4141. 5141. 1143.2144.2141. 8143.7138.4139.4143.7151.2145. 1146. 1153.8153. 4
Proc
roducts
ods
Non-durablegoods
19. 79107.7110. 1113. 1120. 6125.6126. 3125. 1134.9134.0135. 1135. 1134.8134.9135. 3135.8137. 1138. 4138.3139.0139. 1140.0
iucts
Equij
Total
20. 14109.3100. 194.7
103.8114.5120.0110.2114. 3112.9113. 5113. 8114. 9115.7115.2114. 4116.9118. 6117.8118.6119.5120. 8
>ment
Busi-ness
12.63112. 5107.0104. 1118. 0134.2142.4128. 2136. 1134. 1134.6135. 0136. 9137.7137.5135. 9140.2143. 2142. 0143.0144.6145. 7
Intermprod
Total
12.89112. 9112.9116.7126. 5137. 2135. 3123. 1136.8134.7135.0135.9137. 6137.8138.7138.3138.8139.8141.8141. 7141.4142. 1
lediateucts
Con-structionsu pplies
6.4$112. 3111. 0116.8128. 4139.8134. 5116. 3132.0128.0130.9131.8133. 1134. 1134.3134.0135.7135. 5136. 1135.7136.0136.9
Ma-terials
89. 29112.5109.2111. 3122.3133.9132.4115.5130.5129. 2130.6131. 1132.2133.0132.5131.6131.9131.9130.7132.6134.7136.3
Sup-ple-
ment-ary
fouP:
lergytotal
12. 2$111. 1117.0119. 5125. 2128. 3125.5125. 5129.0128,2129.3129. 7128.4129.0128.6128.6130.7132. 2133.0131.7132.6132. 1
[1967=100, seasonally adjusted]
Period
1967 proportion19691970197119721973197419751976
1976: AprMayJuneJuly ..Aug..Sept-. .OctNovDec
1977: JanFebMar »_ . 'Apr * „ _
Primary
Total
6.57113.8106.6100.2112. 1126. 7123. 196. 4
108. 0
105. 4113. 2111.5116.9118. 6114. 1109.9107.3102.7
100.0100.6106.2109.8 !
r metals
Ironandsteel
4.81112.6104.796. 1
107. 1122.3119. 895.8
104.4
103.5110.7110.0115. 3116.2110.3105. 1103. 195.6
89.891.898.0
102. 1
Di
Fabri-catedmetalprod-ucts
5.9S107.9102.4103.5112. 1124.7124. 2109. 9123.3
121.5121.4124. 0124. 6125.8126.6123.5126.7128.2
125.7125. 9127. 6129. 6
irable m
Non-elec-tricalma-chin-ery
9. u109.3104.4100. 2116.0133.7140. 1125. 1134.7
133.5134.0133. 5135. 0136.4136. 8134. 1137.5141. 2
139.5139.8140.3141. 7
anufactu
Elec-tricalma-
chin-ery
8.05111.9108. 1107.7122.2143. 1143.8116.5131.7
130.0131.8132. 0131.0135. 3133. 7135.0135. 8135.6
134.0137.6138.5140. 3
res
Transpequip
Total
9.27108.489.597.9
108. 2118. 3108.797.4
110. 6
110.6112. 9112.6113.3115. 0104. 4104.7112. 7118.2
113. 5113. 4120.2118. 1
ortationment
Motorve-
hiclesand
parts
4.50116.592. 3
118.6135.8148.8128.2111. 1140.7
141.3144. 3146. 5148. 5150.6130.2129.3145.8156.4
145.5145.4160.8156. 9 1
Lum-berand
prod-ucts
1. 64107. 9105.6113. 8120.8126.0116. 2107.6125. 1
122.8123.0120. 3124. 6128. 1128.7130.7129.0127.5
132.7132. 2132.0
Non
Ap-parelprod-ucts
S.31106. 7101.4104.7109. 4117.3114.3107.6126. 1
126. 1130.3126.8125.6123.7122.5126.4125. 9128.0
123. 6125.3
durable
Print-ingandpub-
lishing
4. 72107.4107. 0107. 1112.7118.2118.2113.3120. 7
122. 0120.5119.7122. 0120. 6120.6119.2119. 3123. 1
124. 3123.0123.0123.2
manufac
Chem-icalsand
prod-ucts
7.74118.4120.4125. 9143.6154.5159.4147.3169.4
168.7166.6170.0167.6170.4170.5170.6174.2173.5
172.0175.0176. .8
iures
Foods
8. 75106. 1108. 9112.8116.8120.9124.0123.4132. 0
129. 2131.2130.5131.8133.4135.7134.7134.7134.3
135.5137.6138. 8
Source: Board of Governors of the Federal Reserve System.
18
Digitized for FRASER http://fraser.stlouisfed.org/ Federal Reserve Bank of St. Louis

NEW CONSTRUCTION
Period
1970___197119721973197419751976
1976: MarAprMayJune___JulyAugSeptOct___. __NovDec
1977: JanFeb*Mar p
Total newconstruc-
tionexpendi-
tures
94.9110. 0124. 1137. 9138.5132. 0144.8
145. 1144. 5143. 4145.4140. 9141.9146.6148. 5152.8152.2137. 1149. 0157.3
Total
66.880. 193.9
105.4100.293. 0
108.4
107. 1106.6107. 2106.5104. 1104.5109.0114. 5118.8118.9107.2116.5124.3
Resid
Total *
Bi]
31.943. 354.359. 750. 446.559.9
Seasonally
58. 158.958. 858.757.055. 259. 165. 469. 270.063.469. 174. 3
Private
lential
Newhousing
unites
lions of doll
24. 335. 144.950. 140. 634.446.7
/ adjusted ar
43.844. 243.945.446.946. 548.851. 152.754.350.056.661.4
Commer-cial and
industrial
ars
16. 317.018. 121. 723.820.819. 5
mual rates
21.019.819. 318.718.719.919.719.019. 019.318.318.820.5
Other
18. 619.821.524. 026. 025. 729.0
28. 027. 929. 129. 128. 529. 430. 230. 130.629.725. 528.529. 5
Federal,State,
andlocal
28. 129.930.232. 538.339.036.4
38.037.936.238.936.837.337. 634.034. 133.329.932.533.0
Construction
Total valueindex
(1967=100)
123. 1145. 4165.3179. 5169.7167.9194. 1
Seasonallyadjusted
192208205187215186203237186183203207207
contracts 2
Commer-cial andindustrial
floor space(millions ofsquare feet)
743727854
1,010840555602
Seasonallyadjustedannual
rates
628634632646627609582618631658643615809
1 Includes nonhousekeeping residential construction and additions and alter-ations, not shown separately.
2 F. W. Dodge series. Relates to 50 States beginning 1969 for value index andbeginning 1971 for floor space.
Note.—New construction expenditures data prior to 1973 not comparable withlater data.
Sources: Department of Commerce (Bureau of the Census) and McGraw-HillInformation Systems Company, F. W. Dodge Division.
NEW PRIVATE HOUSING AND VACANCY RATES[Thousands of units or homes, except as noted]
Period
19691970197119721973197419751976
1976: AprMayJuneJulyAug.— . _ _SeptOetNovDec
1977: JanFeb 9
i Mar *__Apr *_
Units
Total
1, 466. 81, 433. 62, 052. 22, 356. 62, 045. 31, 337. 71, 160. 41, 537. 5
1,3851, 4351,4941,4131, 5301,7681, 7151,7061, 8891, 3841,8022,1141,875
Is
started, by
1 unit
810.6812. 9
1, 151. 01, 309. 21, 132. 0
888. 1892.2
1, 162. 4
1, 0711,0911, 1221, 1291, 1721,2541, 2691,2361,3241,0061,4241,5201,444
Jew private
type of stri
2-4units
85. 084.8
120. 3141.3118. 368. 164.085.9
Seasonally
7788757283
1069898
120103120116107
housing unil
icture
5 or moreunits
571.2535.9780. 9906.2795. 0381.6204.3289.2
adjusted ar
237256297212275408348372445275258478324
bs
Unitsauthor-
ized
1, 323. 71, 351. 51, 924. 62, 218. 91, 819. 51, 074. 4
939.21, 280. 5
mual rates
1,0821, 1581, 1501,2151,2961,5041,4921,5901, 5141,3071, 5291,7121,534
Unitscompleted
1, 399. 01, 418. 41, 706. 11, 971. 52, 013. 81, 691. 71, 296. 81, 362. 1
1,2941,3991,3731, 3171, 3801,4021, 3391,3991,4441, 4161,6421,659
New priv
Homessold
448485656718620501544639
604551595606656714728694808815864807
ate homes
Homes forsale atend ofperiod l
222220287409450403380431
392402406410410415420429431432435438
Vacancyrate forrental
housingunits
(percent) 2
5.55.35.55.65.86.26.05.6
5.8
5.7
5.3
5. 1
1 Seasonally adjusted.2 Quarterly data entered in last month of quarter.Source: Department of Commerce, Bureau of the Census.
19
Digitized for FRASER http://fraser.stlouisfed.org/ Federal Reserve Bank of St. Louis

BUSINESS SALES AND INVENTORIES—TOTAL AND TRADEBusiness sales rose 3.4 percent in March and business inventories increased $3.0 billion. According to the advancesurvey, retail sales were virtually unchanged in April, following a rise of 2.1 percent in March.
BILLIONS OF DOLLARS* (RATIO SCALE) BILLIONS OF DOLLARS* (RATIO SCALE)
100
INVENTORY-SALES RATIO
100 -
1973
SEASONALLY ADJUSTEDSOURCE: DEPARTMENT OF COMMERCE
1977
COUNCIL OF ECONOMIC ADVISERS
Period
197119721973197419751976 „1976: Mar
AprMayJune_JulyAugSept _.Oct.NovDec
1977: Jan___ ,FebMar P _ _Apr *»_ _ _ _
Total bi
Q _ 1 _ _ 2oales
112, 323125, 269145, 297166, 771172, 511192, 720189, 940191, 404190, 445193, 360193, 302194, 302193, 868192, 591196, 477204, 365201, 988207, 500214, 630
usiness l
Inven-tories 3
184, 756198,045227, 926278, 386275, 484299, 123281, 256283, 062285, 693289, 138290, 866293, 308296, 537298, 179298, 941299, 123301, 970303, 985306, 991
Who]
On1s%_, Jbales a
Millions
22, 32724, 86230, 40037, 34436, 58340, 21239, 09439, 53039, 38640, 78040, 61640, 58141, 38140, 67640, 79641, 76741, 93143, 23343, 873
esale
Inven-tories 3
oi doll
29, 69532, 81738, 30246, 56445, 11550, 13146, 39846, 82647, 79948, 64548, 80549, 00649, 72349, 84750, 16750, 13150, 87251, 65852, 215
Tntfi 1
ars, seat
34, 07137, 36541, 94344, 81548, 70254, 32453, 34453, 69652, 86853, 98353, 75454, 64354, 10054, 63455, 57357, 89856, 66058, 17559, 40059, 397
Sales 2
Dur-able
goodsstores
onally a
10, 98512, 47214, 19013, 94315, 06017, 84717, 40318, 04617, 41917, 80317, 69918, 20817, 48117, 55918, 15719, 73019, 02419, 76420, 61820, 147
Re
Non-durablegoodsstores
d justed
23, 08624, 89327, 75430, 87233, 64236, 47635, 94135, 65035, 44936, 18036, 05536, 43536, 61937, 07537, 41638, 16837, 63638,41138, 78239, 250
tail
In
TPntfil
52, 57157, 15665, 22973, 85174, 67682, 40577, 29878, 10278, 40679, 37579, 91781, 11881, 84881, 65881, 66082, 40583, 61683, 87885, 397
ventorie^
Dur-able
goodsstores
23, 86426, 05629, 59334, 30134, 47438, 22435, 23135, 46235, 54735, 86336, 52337, 51537, 82237, 51837, 93338, 22438, 93138, 91239, 613
5 '*
Non-durablegoodsstores
28, 70731, 10035, 63639, 55040, 20244, 18142, 06742, 64042, 85943, 51243, 39443, 60344, 02644, 14043, 72744, 18144, 68544, 96645, 784
Inventcrat
Totalbusi-ness 1
1.611. 521.461.511.601.501.481.481.501.501.501.511.531.551. 521.461.491.461.43
)ry-salesio 4
Retail
1.471.461.461.531.511.461.451.451.481.471.491.481.511.491.471.421.481.441.44
1 The term "business" also includes manufacturing (see page 21).* Monthly average for year and total for month.•Book value, end oi period, seasonally adjusted.* For annual period?, ratio of weighted average inventories to average monthly
sales; for monthly data, ratio of inventories at end of month to sales for month.
20
NOTE.-—Total (and manufacturing) sales revised beginning December 1975.Source: Department of Commerce (Bureau of Economic Analysis and Burea
of the Census)
Digitized for FRASER http://fraser.stlouisfed.org/ Federal Reserve Bank of St. Louis

MANUFACTURERS' SHIPMENTS, INVENTORIES, AND NEW ORDERSManufacturers' shipments, new orders, and inventories rose in March. Preliminary estimates indicate durable goodsmanufacturers' shipments and orders fell in April.
BILLIONS OF DOLLARS* (RATIO SCALE)
120 -
100
BILLIONS OF DOLLARS* (RATIO SCALE)
40
1973 1974 1975 1976 1977
BILLIONS OF DOLLARS* (RATIO SCALE)
r)Af\
*5AA
160
120
100
QA
60
Af\
INVENTO
-
-
TC
^~~-\
^t*— •••""".j,.**11"
t i i i i I i i | i i•N*
RIES
TAL ****
---T'DURAB
4**^*
x%
M l l l l l M H
.E GOODS
,̂.,,.-
NONDURABL
\ \ i u l
^ r^*— |
GOODS
1 I 1 I 1 1 I 1 ! 1 1
-
MM*
-
-
_
1 1 1 1 1 1 I ! 1 1 1
RATIO*2.20
2.00INVENTORY-SHIPMENTS RATIO
1.20
1973 1974 1975
*SEASONAUY ADJUSTEDSOURCE; DEPARTMENT OF COMMERCE
1976 1977
COUNCIL OF ECONOMIC ADVISERS
Period
1971 _1972 _19731974 _ _197519761976: Mar__
Apr___May__June--July __Aug__Sept__Oct___Nov__Dec—
1977: Jan___Feb___Mar__Apr p_
Manufac
Total
55, 92563, 04272, 95484, 61287, 22698, 18497, 50298, 17898, 19198, 59798, 93299, 07898, 38797, 281100, 108104, 700103, 397106, 092111,357
turers' sh
Durablegoods
29, 97334, 04239, 70444, 04343, 91250, 39250, 38250, 14650, 55850, 60651, 09051, 64850, 06049, 26751, 42755, 52053, 24754, 72959, 02957, 167
ipments *
Non-durablegoods
25, 95328, 99933, 25040, 56943, 31347, 79247, 12048, 03347, 63447, 99047, 84247, 43048, 32848, 01448, 68149, 18050, 15051, 36352, 328
Manufad
Total
Millie
102, 490108, 072124, 395157, 971155, 693166; 587157, 560158, 134159, 488161, 118162, 144163, 184164, 966166, 674167, 114166, 587167, 482168, 449169, 379
)urers' in-v
Durablegoods
ms of doll
66, 14970, 09881, 218101, 780100, 310105, 729100, 740101, 033101, 502102, 429102, 856103, 282104, 117105, 589106, 128105, 729106, 562107, 222107, 685
entories 2
Non-durablegoods
ars, seasor
36, 34137, 97443, 17756, 19155, 38260, 85856, 82057, 10157, 98658, 68959, 28859, 90260, 85061, 08560, 98660, 85860, 92061, 22761, 694
Manu
Total
lally ad jus
55, 93764, 24676, 21786, 98885, 65998, 51398, 26798, 41599, 02599, 13598, 81197, 55498, 47699, 244100, 973106, 825105, 116106, 534111, 950
"acturers
Durab
Total
sted
29, 95135, 14242, 88846, 57042, 16450, 69751, 11150, 24551, 35451, 24951, 18050, 38050, 06850, 99352, 42457, 26554, 94355, 15959, 38659, 161
' new ore
e goods
Capitalgoodsindus-tries,non-
defense
7,5758,94711, 16912, 65610, 89912, 83712, 17312, 47612, 66612, 60713, 77812, 69013, 46814, 30212, 87814, 11214, 77814, 33514, 79415, 072
lers i
Non-durablegoods
25, 98629, 10433, 32940, 41843, 49547, 81647, 15548, 17047, 67047, 88647, 63147, 17448, 40948, 25248, 54949, 56050, 17351, 37552, 564
Manu-fac-
turers'unfilledorders 3
107, 656122, 362161, 766190, 271171, 438175, 453170, 450170, 687171, 520172, 059171, 938170, 414170, 503172, 468173, 333175, 453177, 179177, 623178, 214
Manu-fac-
turers'inven-tory —ship-mentsratio 4
1. 831. 671. 581. 661. 801. 641.621. 611.621.631. 641. 651.681. 711. 671. 591.621. 591.52
1 Monthly average for year and total for month. Shipments are the same as sales.2 Book value, end of period.3 End of period.4 For annual periods, ratio cf weighted average inventories to average monthly
shipments; for monthly data, ratio of inventories at end of month to shipmentsformohth.
NOTE.—Total and nondurable shipments and new orders revised beginningDecember 1975.
Source: Department of Commerce, Bureau of the Census.
21Digitized for FRASER http://fraser.stlouisfed.org/ Federal Reserve Bank of St. Louis
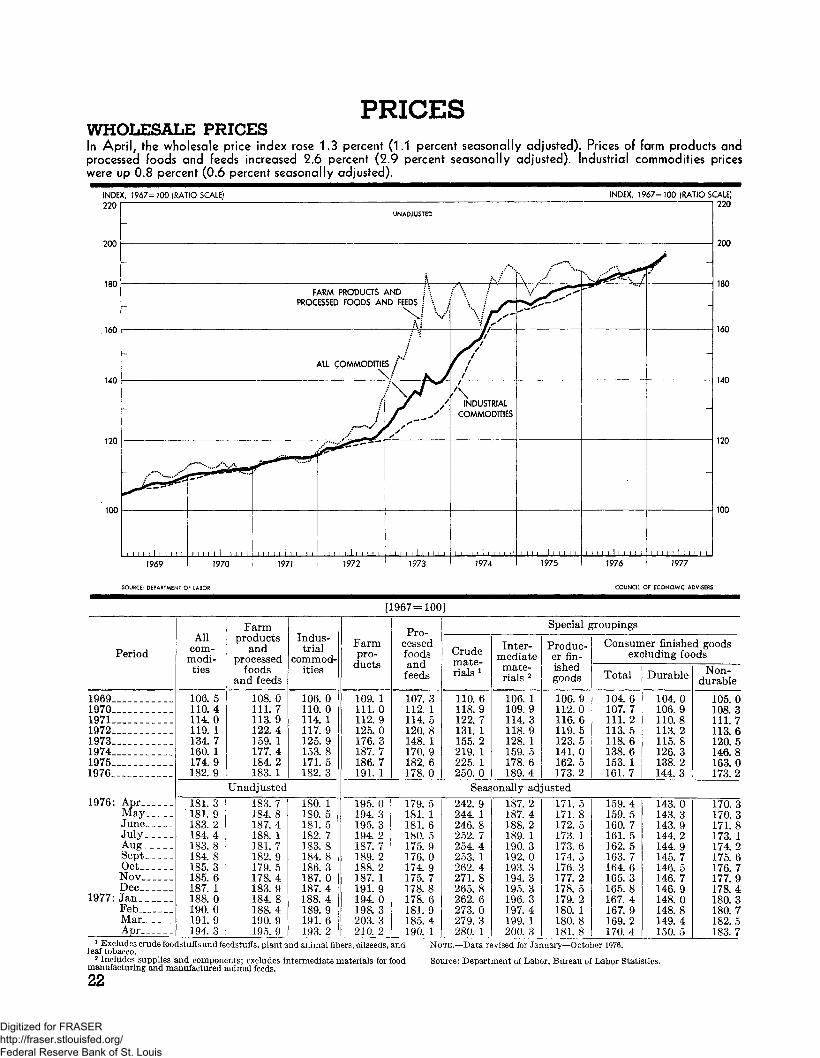
PRICESWHOLESALE PRICESIn April, the wholesale price index rose 1.3 percent (1.1 percent seasonally adjusted). Prices of farm products andprocessed foods and feeds increased 2.6 percent (2.9 percent seasonally adjusted). Industrial commodities priceswere up 0.8 percent (0.6 percent seasonally adjusted).
INDEX, 1967= 100 (RATIO SCALE)220
200
180
160
140
120
100
INDEX, 1967=100 (RATIO SCALE)220
i
FARM PRODUQS AND I \PROCESSED FOODS AND FEEDS I \ ;
\/ V1
Ai
ALL COMMODITIES /"'
f •-•'
1969 1970 1971 1972 1973
120
100
1977
SOURCE: DEPARTMENT OF LABOR COUNCIL OF ECONOMIC ADVISERS
[1967=100]
Period
19691970197119721973197419751976
1976: AprMay_ __June. _ .JulyAug_ _ _SeptOctNovDec__
1977: JanFebMar___ _Apr
Allcom-
modi-ties
106.5110.4114.0119. 1134. 7160. 1174. 9182. 9
181. 3" 181. 9183.2184.4183.8184. 8185.3185.6187. 1188. 0190.0191. 9194. 3
Farmproducts
andprocessed
foodsand feeds
108. 0111. 7113. 9122. 4159. 1177.4184.2183. 1
Unadjusted183. 7184.8187.4188. 1181.7182.9179. 5178.4183.9184.8188. 4190.9195. 9
Indus-trial
commod-ities
106. 0110.0114. 1117.9125.9153. 8171.5182. 3
180. 1180. 5181. 5182. 7183. 8184.8186.3187. 0187.4188.4189. 9191.6193. 2
Farmpro-
ducts
109. 1111.0112. 9125. 0176.3187.7186.7191. 1
195.0194.3195. 3194. 2187. 7189. 2188. 2187. 1191.9194. 0198. 3203.3210. 2
T5Pro-cessedfoodsandfeeds
107. 3112. 1114.5120. 8148. 1170. 9182.6178.0
179. 5181. 1181. 6180. 5175. 9176. 0174.9175.7178.8178.6181.9185. 4190. 1
Crudemate-rials l
110. 6118.9122. 7131. 1155. 2219. 1225. 1250.0
Seas242.9244. 1246. 8252. 7254. 4253. 1262. 4271.8265.8262. 6273.0279. 3280. 1
Inter-mediatemate-rials 2
106. 1109.9114.3118. 9128. 1159. 5178,6189.4
onally ad187.2187.4188. 2189. 1190.3192.0193.3194.3195. 3196.3197. 4199. 1200. 3
Special g
Produc-er fin-ishedgoods
106.9112.0116.6119. 5123.5141. 0162.5173.2
usted171.5171.8172. 5173. 1173.6174. 5176. 3177.2178.5179.2180. 1180. 8181. 8
groupings
Consunexc
Total
104. 6107. 7111. 2113. 5118.6138. 6153. 1161.7
159.4159.5160. 7161. 5162. 5163.7164. 6165. 3165.8167.4167.9169. 2170. 4
ler finishe;luding fo<
Durable
104.0106.9110.8113. 2115.8126.3138. 2144.3
143. 0143.3143.9144.2144. 9145. 7146. 5146.7146. 9148. 0148.8149. 4150. 5
d goods)ds
Non-durable
105. 0108.3111.7113.6120.5146.8163.0173.2
170. 3170. 3171.8173. 1174.2175.6176.7177.9178.4180.3180.7182.5183.7
1 Excludes crude foodstuffs and feedstuffs, plant and animal fibers, oilseeds, and1 eaf tobacco.
2 Includes supplies and components; excludes intermediate materials for foodmanufacturing and manufactured animal feeds.
NOTE.—Data revised for January—October 1976.
Source: Department of Labor, Bureau of Labor Statistics.
22
Digitized for FRASER http://fraser.stlouisfed.org/ Federal Reserve Bank of St. Louis
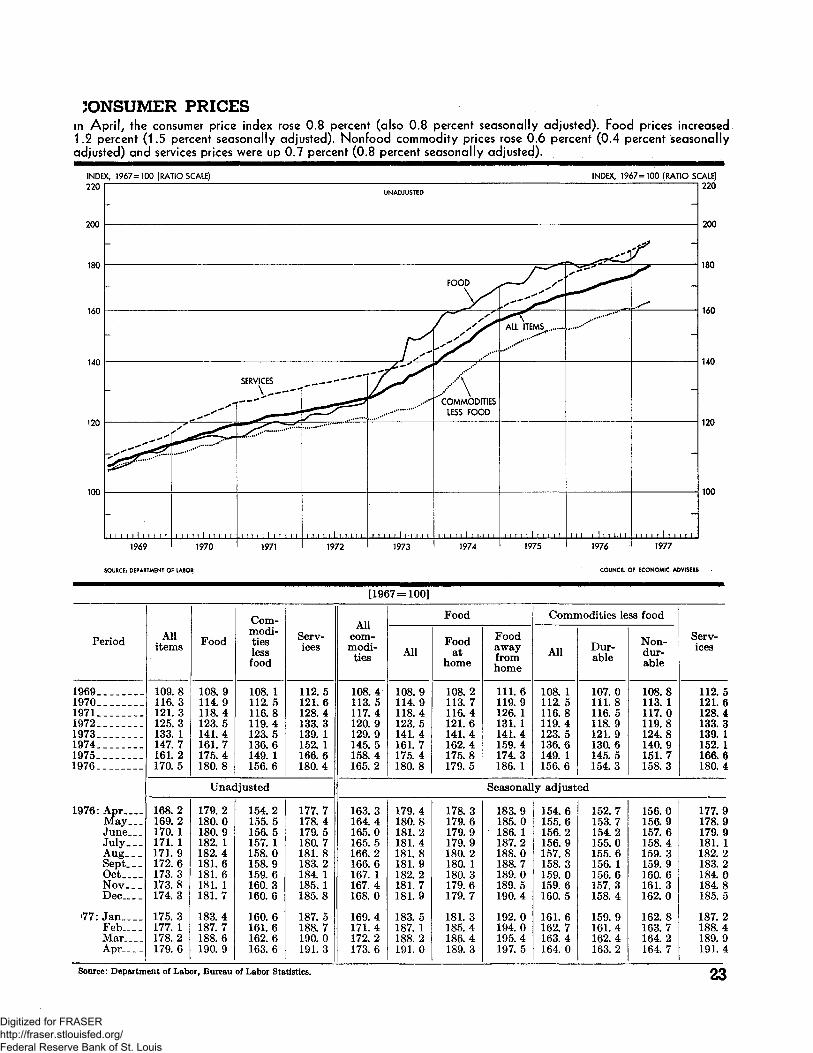
JONSUMER PRICESin April, the consumer price index rose 0.8 percent (also 0.8 percent seasonally adjusted). Food prices increased1.2 percent (1.5 percent seasonally adjusted). Nonfood commodity prices rose 0.6 percent (0.4 percent seasonallyadjusted) and services prices were up 0.7 percent (0.8 percent seasonally adjusted).
INDEX, 1967=100 (RATIO SCALE)220
INDEX, 1967=100 (RATIO SCALE)220
100 100
1969 1970 1971 1972 1973 1974 1975 1976 1977
SOURCE: DEPARTMENT OF LABOR COUNCIL OF ECONOMIC ADVISERS
[1967=100]
Period
19691970197119721973197419751976
1976: Apr.._.May— .JuneJuly_._Aug —Sept.__OctNovDec
'77: JanFeb____MarApr
Allitems
109.8116.3121.3125.3133. 1147.7161.2170.5
168.2169.2170. 1171. 1171.9172.6173.3173.8174.3
175.3177. 1178.2179.6
Food
108.9114.9118.4123.5141.4161.7175.4180.8
Unac
179.2180.0180.9182. 1182.4181.6181.6181. 1181.7
183.4187.7188.6190. 9
Com-modi-tieslessfood
108. 1112.5116.8119.4123.5136.6149. 1156.6
ljusted
154.2155.5156. 5157. 1158.0158.9159.6160.3160.6
160.6161.6162.6163.6
Serv-ices
112. 5121.6128.4133. 3139. 1152. 1166. 6180.4
177.7178.4179. 5180.7181.8183.2184. 1185. 1185.8
187.5188.7190.0191.3
Allcom-modi-ties
108. 4113.5117. 4120.9129.9145.5158.4165.2
163.3164.4165.0165.5166.2166.6167. 1167.4168.0
169.4171. 4172. 2173.6
All
108.9114.9118.4123. 5141.4161.7175.4180.8
179.4180.8181.2181.4181.8181.9182.2181.7181.9
183.5187. 1188.2191.0
Food
Foodat
home
108.2113.7116.4121.6141.4162. 4175.8179.5
178.3179.6179.9179.9180.2180. 1180.3179.6179.7
181.3185.4186.4189.3
Foodawayfromhome
111.6119.9126. 1131. 1141.4159.4174.3186. 1
Seasonal
183.9185.0186. 1187.2188.0188.7189.0189. 5190. 4
192.0194.0195. 4197. 5
Comii
All
108. 1112.5116.8119.4123.5136. 6149. 1156.6
y adjust
154.6155.6156.2156.9157.8158.3159. 0159.6160. 5
161. 6162.7163.4164. 0
Qodities le
Dur-able
107.0111.8116. 5118.9121. 9130.6145.5154.3
ed
152.7153.7154.2155.0155.6156. 1156.6157.3158. 4
159.9161.4162.4163.2
-ss food
Non-dur-able
108.8113. 1117.0119.8124.8140.9151.7158.3
156. 0156.9157.6158. 4159. 3159. 9160.6161.3162. 0
162.8163.7164.2164. 7
Serv-ices
112.5121.6128.4133.3139. 1152. 1166.6180.4
177.9178.9179.9181. 1182.2183.2184.0184.8185.5
187.2188.4189.9191. 4
Source: Department of Labor, Bureau of Labor Statistics. 23
Digitized for FRASER http://fraser.stlouisfed.org/ Federal Reserve Bank of St. Louis
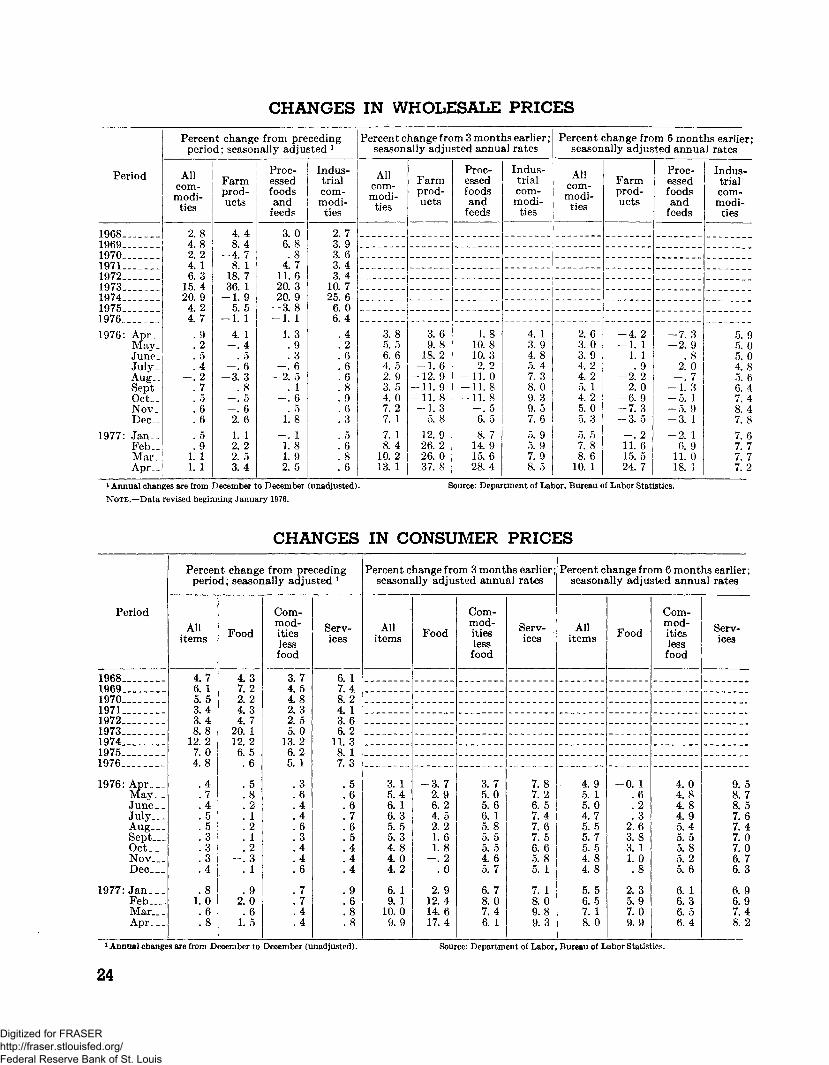
CHANGES IN WHOLESALE PRICES
Period
1968196919701971197219731974197519761976: Apr__
May_June.July.Aug..Sept.Oct__Nov_Dec..
1977: Jan__Feb__Mar_Apr__
Percerperio
Allcom-modi-ties
2.84.82. 24. 16.3
15.420.9
4. 24.7. 9. 2. 5.4
2. 7. 5. 6. 6. 5.9
1. 11. 1
it changed; seasor
Farmprod-ucts
4. 48.4
-4. 78. 1
18. 736. 1
-1.95. 5
-1. 14. 1
_^ 4. 5
-. 6-3.3
.8-.5-. 62.61. 12. 22. 53.4
» from prelally adju
Proc-essedfoodsand
feeds
3. 06. 8.8
4. 711.620.320. 9
-3.8-1. 1
1.3. 9. 3
— . 6-2. 5
. 1-. 6
. 51.8
— . 11. 81.92.5
cedingsted 1
Indus-trialcom-modi-ties
2. 73. 93.63.43.4
10. 725. 66. 06.4.4. 2. 6
A
. 6
. 8
. 9
. 6
. 3
. 5
. 6
.8
.6
Percent cseason.
Allcom-modi-ties
3. 85. 56.64. 52. 93. 54. 07.27. 17. 18.4
10. 213. 1
lange f really adju
Farmprod-ucts
3. 69.8
18. 2-1. 6
-12. 9-11.9-11.8-1.3
5. 812. 926.226. 037.8
>m 3 montsted annu-
Proc-essedfoodsand
feeds
1. 810.810.32. 2
-11.0-11. 8-11.8
— . 56. 58. 7
14. 915. 628. 4
is earlier;aJ rates
Indus-trialcom-modi-ties
4. 13.94. 85. 47. 38. 09.39. 57. 65. 95. 97.98. 5
Percent <season
Allcom-modi-ties
2.63.03.94.24. 25. 14. 25. 05.35. 57.88.6
10. 1
jhange froally ad jus
Farmprod-ucts
-4. 2-1. 1
1. 1.9
-2.22.0
-6. 9-7.3-3.5-. 211. 615. 524. 7
m 6 montted annua
Proc-essedfoodsand
feeds
-7.3-2.9
. 82. 0
__. 7-1. 3-5. 1-5. 9-3. 1-2. 1
6. 911. 018. I
tis earlier;j rates
Indus-trialcom-modi-ties
5.95.05. 04.85. 66.47. 48.47.87. 67. 77.77. 2
1 Annual changes are from December to December (unadjusted).NOTE.—-Data revised beginning January 1976.
Source: Department of Labor, Bureau of Labor Statistics.
CHANGES IN CONSUMER PRICES
Period
19681969197019711972197319741975.1976
1976: Apr___May__June » _July__.Aug___Sept___O c t _ _ _Nov___Dec___
1977: Jan. _ _Feb._..-Mar._ .Apr
Percerperio
Allitems
4.76. 15.53.43.48.8
12. 27. 04.8
.4
.7
. 4
. 5
.5
.3
.3
.3
. 4
.81.0. 6.8
it changed; seasor
Food
4.37.22. 24. 34. 7
20. 112.26.5.6
. 5
.8
. 2
. 1
.2
. 1
. 2g
. 1
.92. 0. 6
1. 5
i from prelally adju
Com-mod-itieslessfood
3.74.54.82.32.55.0
13.26.25. 1
.3
.6
. 4
.4
.6
. 3
. 4
. 4
.6
.7
.7
.4
.4
cedingsted *
Serv-ices
6. 17.48.24. 13.66.2
11.38. 17.3
.5
.6
.6
.7
.6
.5
. 4
.4
. 4
.9
.6
. 8
.8
Percent cseasons
Allitems
3. 15.46. 16.35.55. 34.84.04. 2
6. 19. 1
10.09.9
lange f reilly adju
Food
-3.72.96.24. 52.21.61.8
-.2.0
2.912. 414.617.4
>m 3 montsted annu
Com-mod-itieslessfood
3.75.05.66. 15.85. 55.54.65.7
6. 78. 07.46. 1
tis earlier ;al rates
Serv-ices
7.87.26.57.47.67.56.65.85. 1
7. 18.09.89.3
Percent cseasons
Allitems
4.95. 15.04.75. 55. 75.54.84.8
5. 56.57. 18.0
lange f reilly adju
Food
-0. 1.6. 2.3
2,63.83. 11.0.8
2. 35.97.09. 9
>m 6 montsted annu
Com-mod-itieslessfood
4.04.84. 84.95.45.55.85.25. 6
6. 16.36.56. 4
as earlier;al rates
Serv-ices
9.58.78.57.67.47.07.06.76.3
6.96.97.48.2
1 Annual changes are from December to December (unadjusted). Source: Department of Labor, Bureau of Labor Statistics.
24
Digitized for FRASER http://fraser.stlouisfed.org/ Federal Reserve Bank of St. Louis

'RICES RECEIVED AND PAID BY FARMERSPrices received by farmers rose 11/2 percent in the month ended April 15. Contributing most to the increase werehigher prices for soybeans, cattle, oranges, and potatoes. Partially offsetting were lower prices for vegetables, hogs,eggs, cotton, and corn. Prices paid by farmers also rose 11A percent.
INDEX, 1967=100 (RATIO SCALE)
PRICES RECEIVED(ALL FARM PRODUCTS)
PRICES PAID(ALL ITEMS, INTEREST,
TAXES, AND WAGE RATES)
80
70 P
601969 1970 1971 1972 1973 1974
J/ RATIO OF INDEX OF PRICES RECEIVED TO INDEX OF PRICES PAID, INTEREST, TAXES, AND WAGE RATES, ON 1910-14=100 BASE.
SOURCE: DEPARTMENT OF AGRICULTURE
1975 1976 ' 1977
COUNCIL OF ECONOMIC ADVISERS
Period
196919701971_.__19721973197419751976
1976: Apr 15May 15June 15July 15Aug 1 5 _ _ _ _ _ _ _Sept 15Oct 15. —Nov 15Dec 15
1977: Jan 15Feb 15Mar 15_-_ ___ _Apr 15
Prices
All farmproducts
107110113125179192186186
189191196195187187178173179
183187190193
received by
Crops
97100108114175224201198
193198211215201204195187192
198203211217
farmers
Livestockand
products
Index, 1<
117118118136183165172177
186185184179175172165162168
170174171172
PricesAll items,interest,
taxes, andwage rates
567=100
108112120125144166180192
191191193194193193192192193
198200201204
paid by far
Familylivingitems
109114118123133151166176
174174175177177178179180181
182(3)(3)(3)
mers
Produc-tion
items
104108113121146166182193
193193196196194194192191193
196199201204
Parity
Actual
7372697491857671
737375747171686668
68696970
ratio 1
Adjusted 2
7977737994867672
737475757272696769
68707070
1 Percentage ratio of index of prices received by fanners to index of prices paid,interest, taxes, and wage rates on 1910-14=100 base.
» The adjusted parity ratio reflects Government payments made directly tofanners.
3 Index discontinued. Consumer price index (Department of Labor) substitutedin calculating total prices paid beginning January 1977.
Source: Department of Agriculture. 25
Digitized for FRASER http://fraser.stlouisfed.org/ Federal Reserve Bank of St. Louis

MONEY, CREDIT, AND SECURITY MARKETSMONEY STOCKMi grew at an annual rate of 21.6 percent in April while M2 grew at a rate of 13.9 percent.
BILLIONS OF DOLLARS* (RATIO SCALE) BILLIONS OF DOLLARS* (RATIO SCALE)
300 — 300
200 200
1969
* SEASONALLY ADJUSTED
SOURCE: BOARD OF GOVERNORS OF THE FEDERAL RESERVE SYSTEM
1977
COUNCIL OF ECONOMIC ADVISERS
[Averages of daily figures; billions of dollars, seasonally adjusted, except as noted]
Period
1972: Dec...1973: Dec...1974: Dec...1975: Dec...1976:Dec___1976: Apr___
May__June__July..Aug___Sept..OctNov ._Dec __
1977: Jan___Feb__Mar__Apr »_
Over
M,
255. 3270.5283. 1294.8312.8301.8303. 5303.2305.0306. 5306.9310.5310.6312.8314.3314.5316. 1321. 3
all measi
M2
525.3571.4612.4664.3739. 3690. 6695.7698.2705.2710.4716.3725.7731.7739.3745. 0749. 1754.2762.4
ires l
M3
844.5919.6981.5
1, 092. 61, 236. 11, 139. 71, 149. 71, 156. 51, 168. 81, 180. 81, 193. 91, 210. 51, 222. 81, 236. 11, 247. 61, 256. 61, 266. 21, 279. 2
Cur-rency
56.961.567.873.780. 676.677.377.578. 178.679.279. 880. 380.681.382.082.483. 3
Deposi
Demand
198.4209.0215.3221. 0232. 1225.2226. 2225. 6226.9227.9227.7230.7230.3232. 1233.0232.5233.7238. 1
Compon
ts at coi
Tim
Total
313.5363.9418.3451.7489.8460.0460. 7465.3469.0468.9472.5477.5483.4489. 8493.8497. 8500.2502. 7
tents anc
nmercia
e and sa
LargeCDs
43.563. 089.082. 163.371.268.670.268.965.063. 162.362. 263.363. 163.362.261. 6
related il
banks
vings
Other
270.0300.9329.3369.6426. 5388. 9392. 1395. 1400. 1403.9409.4415. 2421.2426.5430. 7434.5438.0441. 1
terns
Depositsat
nonbankthrift
institu-tions
319.3348. 1369. 1428.3496.8449. 1454.0458. 2463.6470.5477.6484.8491.0496.8502.6507.5512.0516.8
U.S. Gov-ernmentdemanddeposits
(unadjust-ed)
7.46.34.94. 14.53.93.84.83.53.75.04.04. 14. 53.94. 14. 35.3
Perchai
M,
9.26.04.74. 16. 15.85.45.86.76.66.05.84.76.46.25.36. 17. 1
centage 2
M2
11.48.87.28.5
11.310.910.410.510.79.7
10. 110. 410.612. 111.611.210.910.4
! is currency plus demand deposits; M2 is MI plus time deposits at com-mercial banks other than large certificates of deposit (CDs); and M3 is M2 plusdeposits at nonbank thrift institutions.
26
J Annual changes are from December to December and monthly changes arefrom 6 months earlier at a seasonally adjusted annual rate.
Source: Board of Governors of the Federal Keserve system.
Digitized for FRASER http://fraser.stlouisfed.org/ Federal Reserve Bank of St. Louis

PRIVATE LIQUID ASSET HOLDINGS— NONFINANCIAI, INVESTORS[Averages of daily figures; billions of dollars, seasonally adjusted]
Period
1970: Dec1971: Dec1972: Dec1973: Dec1974: Dec1975: Dec1976: Dec
1976: Apr__ _ _ _ _ _ _ _ _ _ _ _May _ _ __ _JuneJuly.Aug _ _ _Sept.OctNovDec
1977: Jan_FebMar__ _Apr v _ _
Totalliquidassets
769.5852. 5967.9
1, 079. 51, 166. 21, 289. 71, 424. 1
1, 334. 51, 344. 91, 354. 91, 368. 81, 378. 51, 388. 21, 403. 61, 413. 81, 424. 1
1, 438. 41, 451. 91, 461. 01, 475. 2
Total
632.4718.7817.0887.4944.5
1, 053. 31, 191. 1
1, 100. 91, 111. 11, 117. 11, 129. 11, 141. 31, 153. 21, 168. 61, 179. 31, 191. 1
1, 204. 11, 212. 51, 221. 81, 235. 2
Curr<
Cur-rency
49. 152.656.961.567.873.780.6
76.677. 377.578. 178. 679.279.880. 380.6
81.382.082.483.3
mcy and
Demanddeposits
151.8161.5176.5183.3186. 5190. 7197.0
194.6195.9194. 7195.6196.3195. 5197.8196. 3197. 0
199. 2198.3199. 3203.9
deposits
Time d
Com-mercialbanks
198.9233. 6264.4294.4321. 1360.6416. 6
380. 6383. 9386.7391.8395. 9401.0406.2411. 8416.6
421. 0424.8428. 1431. 1
eposits
Nonbankthrift
institu-tions
232.7271. 1319.3348. 1369. 1428.3496.8
449. 1454. 0458.2463.6470.5477.6484.8491. 0496. 8
502.6507. 5512.0516.9
U.S. TJsecui
Savingsbonds
52.054.357.560.463.367.371.9
68.769. 069.469.770.270.871. 171.571.9
72. 372.773.073.4
reasury•ities
Short-term
market-able se-curities
41.931.734.543.247.466. 366.6
68.969. 169.771. 471.469.769.669.366. 6
67.671.070. 671.0
Nego-tiablecertifi-
cates ofdeposit
21. 827.636.254.070.760.045.0
51.349.651.250.346. 745. 344.844. 445. 0
44.344. 743. 342.6
Otherprivatemoneymarketinstru-ments
21.420.222.734.540.442.849.5
44.846. 147.448.248. 849.249.449.449.5
50. 151. 152.353.1
NOTE.—Data revised beginning 1975. Source: Board of Governors oi the Federal Reserve System.
CONSUMER INSTALMENT CREDIT[Millions of dollars; monthly data seasonally adjusted]
Period
19691970197119721973197419751976
1976: MarAprMayJuneJulyAugSeptOctNovDec
1977: JanFebMar
Instalm
Total *
109, 146112, 175123, 086140, 072160, 228160, 008163, 483186, 221
15, 52115, 00315, 04115, 59215, 24015, 68515, 77516, 05515, 76316, 702
16, 87017, 18618, 253
ent credit e:
Auto-mobile
32, 55329, 96534, 77840, 26646, 10543, 20948, 10355, 807
4, 6894,5834,4714,6004,4774, 7124,7694,5874,6325,263
4,9405,2055,654
stended
Bankcreditcards
4,3986,7688,377
10, 39013, 86317, 09820,42825, 481
2, 1181,9852, 1032,0882, 1522, 1832,1652, 1982,1812,217
2, 1172,3322,434
Instalm*
Total l
99, 786107, 385113, 788124, 513140, 552151, 056156, 640169, 682
14, 04813, 57613, 56614, 26113, 93714, 28214, 29414, 49114, 52014, 879
14, 95215, 16415, 536
3nt credit lie
Auto-mobile
29, 97430, 43231, 30334, 70540, 13742, 88345, 47248, 337
4,0263,8513,8194,0743,9224, 0904,1654,0594, 1554,250
4, 1834,3204,453
juidated
Bankcreditcards
3,0665,6157,6799,472
12, 43315, 65519, 20823, 905
1,9261,8461,9111,9901,9812,0972,0002,0742,1102,250
2,0892,1612, 141
Net change
Total l
9,3604,7909,299
15, 55919, 6768,9526,843
16, 539
1,4731,4271,4741,3301,3031,4031,4811,5641,2431,823
1,9182,0222,717
in amount
Auto-mobile
2,579-4683,4765,5615,968
3272,6317,470
663732652526556621605528477
1,013
758884
1,201
outstanding
Bankcreditcards
1,3321, 153
699918
1,4301,4431,2201,576
19213919398
17186
16612371
-33
28170293
- •• includes some items not shown separately. Source: Board of Governors of the Federal Reserve System.
27
Digitized for FRASER http://fraser.stlouisfed.org/ Federal Reserve Bank of St. Louis

BANK LOANS, INVESTMENTS, AND RESERVESBusiness loans at commercial banks increased at an annual rate of 12.5 percent in April while bank holdings <U.S. Government securities fell.
BILLIONS OF DOLLARS*(RATIO SCALE) BILLIONS OF DOLLARS* (RATIO SCALE)
1,000
800
600
400
200
"ALL COMMERCIAL BANKS" 1,000
800
600
400
200
INVESTMENT IN OTHER SECURITIES||M««|||ltl**
m*
MtMIMMMM"***" '••«"***'
10)
80
60
40
„..,.'«'""*"*
M h l I II II I ! I II I I I I I I I I I I 1 I
„„.*•»•"«",„,„„„»«««"'
INVESTMENT IN
U.S. GOVERNMENT SECURITIES
I ! i I I I M I
100
80
60
401969 1970 1971 1972 1973 1974 1975 1976 1977
* SEASONALLY ADJUSTED, END OF MONTHSOURCE: BOARD OF GOVERNORS OF THE FEDERAL RESERVE SYSTEM COUNCIL OF ECONOMIC ADVISERS
[Billions of dollars, seasonally adjusted, except as noted]
Period
19691970 ..1971.19721973__.19741975__1976*1976: Apr
MayJuneJuly *Aug»Sept 9Oct*Nov p_Dec 9
1977: Jan »Feb 9Mar p _Apr 9
Totalloansand
invest-ments
401.7435.5485. 7558.0633.4
4 690. 4721. 1774.9740.3744.0748.8750.2756.0759. 8767.6773.8774.9
780.5790. 1797. 1806.4
Allc
L<
Total ex-cludinginter-bank279.4292.0320.9378.9449.0500.2496. 9528. 1505.8506.5509. 3511. 1514.0517. 9525.8528.4528. 1
535. 0539. 3545. 3551.9
ommercial b
:>ans
Commer-cial and
industrial
105.7110.0116. 1130.2156.4183.3176.0
5 178. 8171.8172.2172. 1173.0173.3174.4177.2179.3178.8
179.9181.4183.0184.8
anks l
Investn
U.S. Gov-ernmentsecurities
51.257.860.662.654.550.479.496.990.293. 194.793. 095.594.493.894.796.9
96. 1100.7102.7101. 9
lents
Othersecu-rities
71. 185.7
104.2116.5129.9139.8144.8149.9144.3144.4144.8146. 1146.5147.5148.0150.7149.9
149.4150. 1149. 1152. 6
I
Total
27.9429. 1231.2231.4134.9436.6034.73349534.0534. 1734.2934.3434.5134.3434.5134. 8534. 95
34.7834.4034.3134.68
All me
leserves 2 3
Non-borrowed
26.8228.7931. 1030.3633.6435.8734.6034.9034.0034.0534. 1634.2134.41342734 4134.783490
34.71343334203461
mber ban
Re-quired
27.6628.8731.0431. 1234.6436.343446346833.8933.96340734 11343134 14342934 593468
3451342034 093449
ksBorrowiilions ofunadju
Total
1,086321107
1,0491,298
7031276244
12112012310475668462
6179
11073
ags (mil-dollars,isted) *
Sea-sonal
41321312111120242831322112
8121315
1 Data are tor end of period.2 Averages of daily figures. Annual data are for December.3 Member bank reserves series reflects actual reserve requirement percentages
with no adjustment to eliminate the effect of changes in Kegulations D and M.
28
4 During 1974. total loans and investments were increased $0.6 billion dna bank merger and were reduced $1.5 billion due to liquidation of a large ban*.
5 Loan ^classifications reduced these loans by $1.2 billion as of March 31,1976.Source: Board of Governors of the Federal Keserve System.
Digitized for FRASER http://fraser.stlouisfed.org/ Federal Reserve Bank of St. Louis
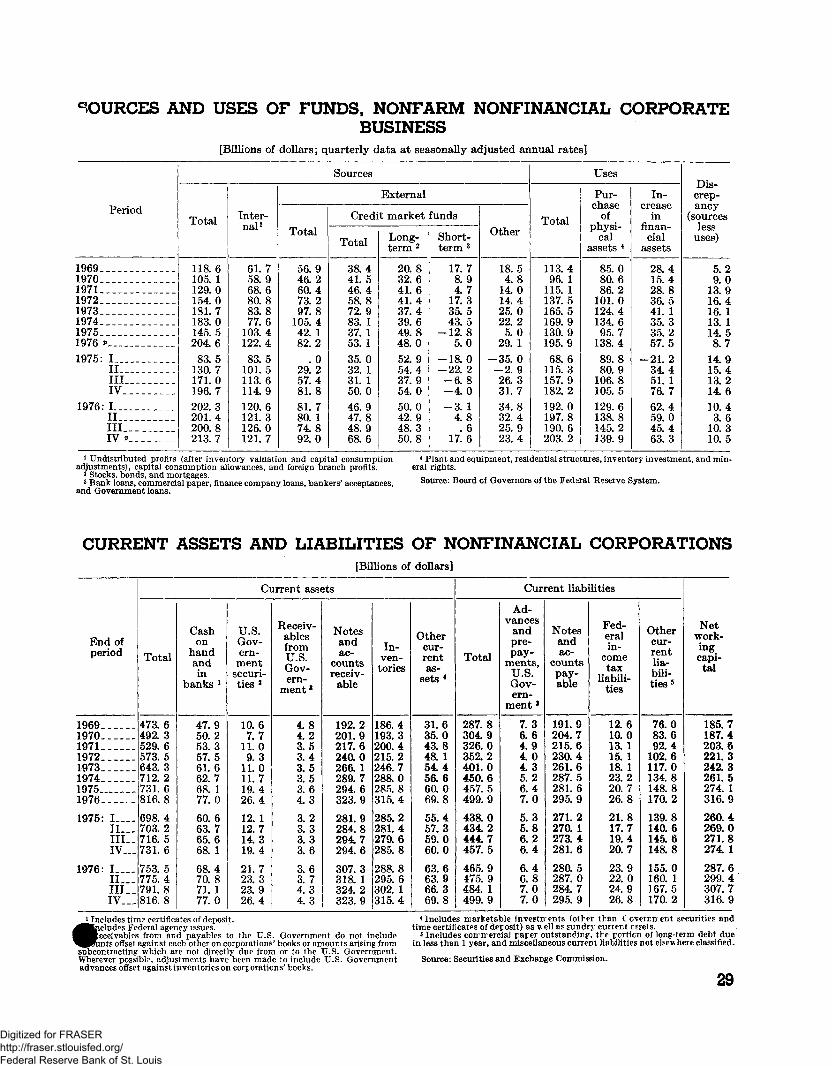
SOURCES AND USES OF FUNDS, NONFARM NONFINANCIAL CORPORATEBUSINESS
[Billions of dollars; quarterly data at seasonally adjusted annual rates]
T> • A
19691970197119721973197419751976 *>— _1975: I
IIIIIIV
1976: I _IIIIIIV »
Total
118.6105. 1129.0154.0181.7183.0145.5204.683.5
130.7171.0196.7202.3201.4200.8213.7
Inter-nal1
61.758.968.680.883. 877.6
103.4122.483.5
101.5113.6114. 9120.6121.3126.0121.7
Total
56.946.260. 473.297.8
105. 442. 182.2
.029. 257.481.881. 780. 174.892. 0
Sources
Credi
Tnf al
38.441.546. 458.872.983. 137. 153. 135.032. 131. 150.046.947.848.968.6
External
t market
Long-term 2
20.832.641. 641.437.439.649.848.052.954.437.954. 050.042.948.350.8
funds
Short-term 3
17.78.94.7
17.335.543.5
— 12.85.0
— 18. 0-22.2-6.8-4.0-3. 1
4.8. 6
17.6
Other
18.54.8
14.014.425.022.25.0
29. 1-35.0-2.926. 331.734.832. 425. 923.4
Total
113.496. 1
115. 1137.5165.5169.9130.9195.968.6
115.3157. 9182.2192.0197.8190. 6203.2
Uses
Pur-chase
ofphysi-
calassets 4
85.080.686.2
101.0124. 4134. 695.7
138.489. 880.9
106.8105. 5129.6138.8145.2139.9
In-crease
infinan-cial
assets
28.415.428.836. 541. 135. 335.257.5
-21. 234. 451. 176.762.459.045.463.3
Dis-crep-ancy
(sourcesless
uses)
5. 29.0
13.916.416. 113. 114. 58.7
14.915.413.214.610.43. 6
10.310. 5
1 Undistributed profits (after inventory valuation and capital consumptionadjustments), capital consumption allowances, and foreign branch profits.2 Stocks, bonds, and mortgages.
3 Bank loans, commercial paper, finance company loans, bankers' acceptances,and Government loans.
4 Plant and equipment, residential structures, inventory investment, and min-eral rights.
Source; Board of Governors of the Fedsral Reserve System.
CURRENT ASSETS AND LIABILITIES OF NONFINANCIAL CORPORATIONS[Billions of dollars]
End ofperiod
19691970197119721973197419751976
1975: !_._.II._.III_.IV.._
1976: !___.II...III__IV___
Total
473.6492. 3529.6573.5643.3712.2731. 6816.8
698.4703.2716.5731.6
753.5775.4791.8816.8
Cashon
handandin
banks l
47.950.253.357.561.662.768. 177.0
60.663.765.668. 1
68. 470.871. 177.0
Ci
U.S.Gov-ern-ment
securi-ties2
10.67.7
11.09.3
11.011.719. 426.4
12. 112.714.319.4
21.723.323.926.4
irrent ass<
Receiv-ablesfromU.S.Gov-ern-
ment1
4.84.23.53.43.53.53. 64.3
3.23.33.33.6
3.63.74.34.3
JtS
Notesandac-
countsreceiv-
able
192.2201.9217.6240.0266. 1289.7294. 6323.9
281.9284.8294.7294.6
307.3318. 1324.2323.9
In-ven-tories
186.4193.3200.4215.2246.7288.0285. 8315.4
285.2281.4279.6285.8
288.8295.6302.1315. 4
Othercur-rentas-
sets 4
31.635.043.848. 154.456.660. 069.8
55.457.359.060.0
63.663.966.369.8
Total
287.8304.9326.0352.2401.0450.6457. 5499.9
438.0434.2444.7457.5
465.9475.9484. 1499.9
Gun
Ad-vances
andpre-pay-
ments,U.S.Gov-ern-
ment s
7.36.64.94.04.35.26.47.0
5.35.86.26.4
6.46.87.07.0
rent liabi
Notesandac-
countspay-able
191.9204.7215.6230.4261.6287.5281. 6295.9
271.2270. 1273.4281.6
280.5287*0284.7295.9
lities
Fed-eralin-
cometax
liabili-ties
12.610.013. 115. 118. 123.220.726.8
21.817.719.420.7
23.922.024.926.8
Othercur-rentlia-bili-ties5
76.083.692.4
102.6117.0134.8148.8170.2
139.8140.6145.6148.8
155.0160. 1167.5170.2
Network-ingcapi-tal
185.7187.4203.6221.3242. 3261.5274. 1316.9
260.4269.0271.8274. 1
287.6299.4307.7316.9
L Includes time certificates of deposit,es Federal agency issues.ables from and payables to the U.S. Government do not include
nts offset against each other on corporations' books or amounts arising fromsubcontracting which are not directly due from or to the U.S. Government.Wherever possible, adjustments have been made to include U.S. Governmentadvances offset against inventories on corporations' books.
4 Includes marketable investments (other than Coverrnent securities andtime certificates of deposit) as v ell as sundry current resets.
*Includes coirirereial paper outstanding, the portion of long-term debt duein less than 1 year, and miscellaneous current liabilities not elsewhere classified.
Source: Securities and Exchange Commission.
Digitized for FRASER http://fraser.stlouisfed.org/ Federal Reserve Bank of St. Louis
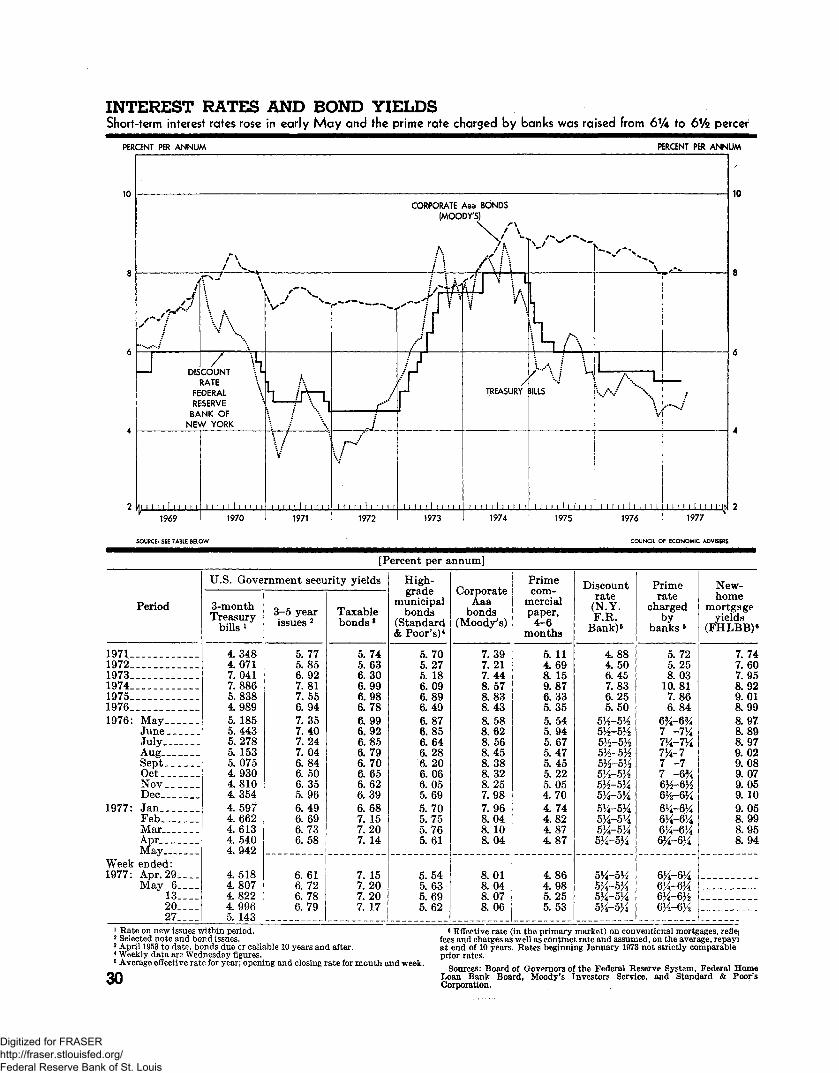
INTEREST RATES AND BOND YIELDSShort-term interest rates rose in early May and the prime rate charged by banks was raised from 6% to 6% percef^
PERCENT PER ANNUM PERCENT PER ANNUM
JCI— 1 DIS
FERE
6ANE\
1969
„
/ >»_r"^ —' \\ \\ ,v\
COUNT \>-RATE \DERAL \SERVE *J
NK OFV YORK
1970
V
I A\ k~(
• '••• !\ / \ '\ 1 \
"'• / ':
V
II 1 ! 1 ! I 1 I I 1
1971
„--"-
/*•""
4
J
»•••..»*
i i i i i I i i i i i
1972
CORPORATE
(MOO
A• :/ !1 *JH
/ H ?
Jtf 1_J1*
1 1 I I 1 I 1 1 1 I 11973
taa BONDSDY'S)
\ Ax/ s/•
/C * :
<'l\ V \ L\P UV '\
/TREASURY i
I i i i i I i i i i i1974
/*» ^**V7 ^
L
\X/Vu// \ / h
'ss 'JILLS
1 1 1 1 1 1 1 r i • i i1975
^" ^**>.X\
A I. / V U
W \\V
M II I I I I I I I
1976
<»**
.-.*.. /
'
1 i i i i 1 i i i riK1977
10 10
SOURCE: SEE TABLE BELOW COUNCIL OF ECONOMIC ADVISERS
[Percent per annum]
Period
1971. _ _1972 _19731974197519761976: May
JuneJulyAugSeptOct_NovDec
1977: JanFebMarAprMay
Week ended:1977: Apr. 29
May 6132027
U.S. Gove
3-monthTreasury
bills l
4.3484.0717. 0417.8865.8384.9895. 1855.4435.2785. 1535.0754.9304.8104.3544.5974.6624.6134.5404.942
4.5184.8074.8224.9965. 143
rnment seen
3-5 yearissues 2
5.775.856.927.817.556.947.357.407.247.046.846.506.355.966.496.696.736.58
6. 616. 726.786.79
rity yields
Taxablebonds '
5.745.636.306.996.986.786.996.926.856.796.706.656.626.396.687. 157.207. 14
7. 157.207. 207. 17
High-grade
municipalbonds
(Standard& Poor's)4
5.705. 275. 186.096.896.496.876.856.646.286.206.066.055.695.705.755.765.61
5.545.635.695.62
CorporateAaa
bonds(Moody's)
7.397.217.448.578.838.438.588.628.568.458.388.328. 257.987.968.048. 108.04
8.018.048.078.06
Primecom-
mercialpaper,4-6
months
5. 114. 698. 159.876.335.355.545. 945.675.475. 455.225.054.704.744.824.874.87
4.864.985.255.53
Discountrate
(N.Y.F.R.
Bank)8
4.884.506.457.836.255.50
5 -̂S1/5H-5H5V2-5
1/25H-5H5H-5H5H-5H
5^-5^5H-5K5H~5145J4-5M
5M~ 5M5K-5K5%—5l/i5%— 5%
Primerate
chargedby
banks 8
5.725.258.03
10.817.866.84
6%-6%7 -7y47K-7K
7 -77 -6%
6%-6%51,̂ 5̂6K~6^gi,^_gi^gi^_gi£
6J4~6K6%-6}46K-6H6^—6}^
New-home
mortgageyields
(FHLBB)6
7.747.607.958.929. Ql8.998.978.898.979.029.089.079.059.109.058.998.958.94
1 Eate on new issues within period.2 Selected note and bond issues.3 April 1953 to date, bonds due or callable 10 years and after.* Weekly data are Wednesday figures.s Average effective rate for year; opening and closing rate for month and week.
30
6 Effective rate (in the primary market) on conventicnal mortgages, refleifees and charges as well as contract rate and assumed, on the average, repayiat end of 10 years. Kates beginning January 1973 not strictly comparableprior rates.
Sources: Board of Governors of the Federal Keserve System, Federal HomeLoan Bank Board, Moody's Investors Service, and Standard & Poor'sCorporation.
Digitized for FRASER http://fraser.stlouisfed.org/ Federal Reserve Bank of St. Louis

COMMON STOCK PRICES AND YIELDSStock prices remained relatively stable in late April and early May.
INDEX, DEC 31,1965=5080
INDEX, DEC 31,1965=5080
50 -
40
30 -
1969
PERCENT
20
15
50
40
- 30
PERCENT.•
EARNINGS-PRICE RATIO ON COMMON STOCKS
(S&P)
10 10
I I I I
1969 1970 1971 1972 1973 1974 1975 1976 1977
SOURCES: NEW YORK STOCK EXCHANGE AND STANDARD & POOR'S CORPORATION COUNCIL OF ECONOMIC ADVISERS
Period
1971197219731974197519761976: Apr
MayJuneJulyAug_SeptO c t _ _ _ ..Nov__Dec___.
1977: JanFebMar. _ _ _ _Apr
Week ended:1977: Apr 22
29May 6___
1320___
New York
Composite
54. 2260. 2957.4243.8445. 7354. 4654.2853. 8754.2355. 6855. 1856.2954.4354. 1756.3456. 2854. 9354. 6753.92
54.3953.3254. 3154. 1054.52
Stock Exel:
Industrial
57.9265.7363. 0848.0850. 5260. 4460.6260. 2260.7062. 1161. 1462.3560. 0759. 4561.5461.2659. 6559. 5658.47
58.9657.6358. 7058.3158. 73
Comi
tange indexe
Transpor-tation
44. 3550. 1737.7431. 8931. 1039.5738. 6639. 7140. 4142. 1240. 6340. 3638. 3739.2841. 7741. 9340. 5940.5241.51
42. 5641.6842.8043. 1044. 09
lion stock p
s (Dec. 31,
Utility
39. 5338.4837.6929. 7931.5036.9735.6935. 4035. 1636.4937. 5638.7738. 3338.8540.6141. 1340.8640. 1840.24
40. 5240.2040.9741. 2341.51
rices 1
1965 = 50) 2
Finance
70. 3878.3570. 1249. 6747. 1452.9452. 7150. 9951.8254. 0654. 2254.5252. 7453. 2557.4557.8655.6554. 8454.30
54.8554. 1054. 9254. 9755.49
Dow-Jones
industrialaverage s
884. 76950. 71923. 88759. 37802. 49974. 92992. 51988. 82985. 59993. 20981. 63994. 37951. 95944. 58976. 86970. 62941. 77946. 11929. 10
937. 40921. 64937. 26930. 00935. 57
Standard& Poor'scomposite
index(1941-43 =
10) *
98. 29109. 20107. 4382. 8586. 16
102. 01101. 93101. 16101. 77104. 20103. 29105. 45101. 89101. 19104. 66103. 81100. 96100. 5799.05
99. 8497.7799. 5899. 0499.77
Common g(perc
Dividend-
ratio
3. 142.843.064.474.313.773.663. 763.753.643.743.713. 854. 043.933.994.214.374.47
4.424.554. 514.584.51
tock yieldsent) 5
Earnings-
ratio
5.415.507. 12
11.599. 15
"8. 89
8.87
9.07
"9. 20
1 Averages of daily closing prices.1 Includes all the stocks (more than 1,500) listed on the N YSE.1 Includes 30stocks. * Includes500stocks.5 Standard & Poor's series. Dividend-price ratios based on Wednesday closing
prices. Earnings-price ratios based on prices at end of quarter.
NOTE.—All data relate to stocks listed on the New York Stock Exchange(NYSE).
Sources: New York Stock Exchange, Dow-Jones & Company, Inc., and Stand-ard & Poor's Corporation. <j ••
Digitized for FRASER http://fraser.stlouisfed.org/ Federal Reserve Bank of St. Louis
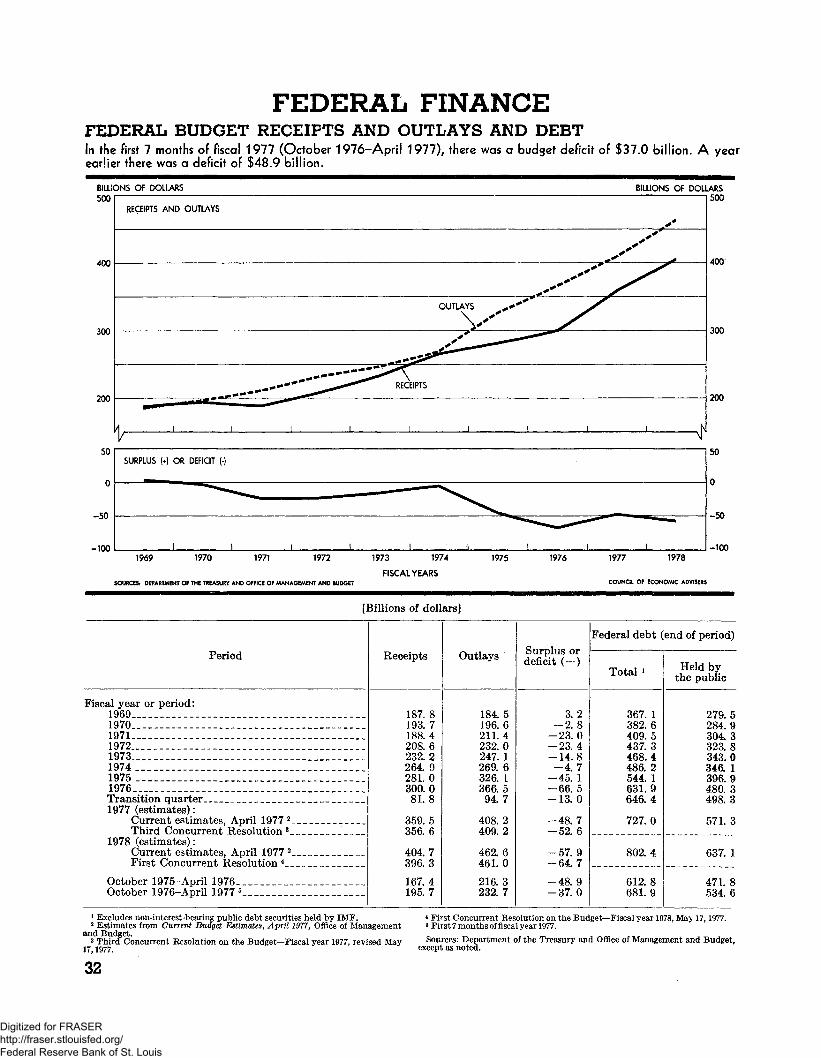
FEDERAL FINANCEFEDERAL BUDGET RECEIPTS AND OUTLAYS AND DEBTIn the first 7 months of fiscal 1977 (October 1976-April 1977), there was a budget deficit of $37.0 billion. A yearearlier there was a deficit of $48.9 billion.
BILLIONS OF DOLLARS500
BILLIONS OF DOLLARS500
200 - 200
50
0
-50
-100
50
0
-50
-100
SURPLUS (+) OR DEFICIT (-)
1969 1970 1971 1972 1973 1974
FISCAL YEARS
1975 1976 1977 1978
SOURCESi DEPARTMENT OF THE TREASURY AND OFFICE OF MANAGEMENT AND iUDGET COUNCIL OF ECONOMIC ADVISERS
[Billions of dollars]
Period
Fiscal year or period:19691970197119721973197419751976 „Transition quarter ....1977 (estimates) :
Current estimates, April 1977 2
Third Concurrent Resolution 3_1978 (estimates):
Current estimates, April 1977 2
First Concurrent Resolution 4 __
October 1975- April 1976October 1976- April 1977 5__ _ _ _ __ _
Receipts
187.8193. 7188. 4208. 6232.2264. 9281. 0300.081.8
359. 5356.6
404.7396.3
167.4195.7
Outlays
184.5196. 621L 4232.0247.1269. 6326. 1366.594. 7
408.2409.2
462.6461.0
216.3232. 7
Surplus ordeficit (-)
3. 2-2.8
-23.0-23.4-14.8-4.7
—45. 1-66.5-13. 0
-48.7-52.6
57.9-64.7
48.9-37.0
Federal debt (
Tnt ill 1
367. 1382.6409. 5437.3468.4486. 2544. 1631.9646.4
727.0
802.4
612.8681.9
end of period)
Held bythe public
279.5284.9304.3323. 8343.0346. 1396. 9480. 3498.3
571. 3
637. 1
471.8534.6
1 Excludes non-interest-bearing public debt securities held by IMF.2 Estimates from Current Budget Estimates, April 1977, Office of Managementand Budget.
s Third Concurrent Resolution on the Budget—Fiscal year 1977, revised May17,1977.
* First Concurrent Resolution on the Budget—Fiscal year 1978, May 17,1977.5 First 7 months of fiscal year 1977.Sources: Department of the Treasury and Office of Management and Budget,
except as noted.
32
Digitized for FRASER http://fraser.stlouisfed.org/ Federal Reserve Bank of St. Louis
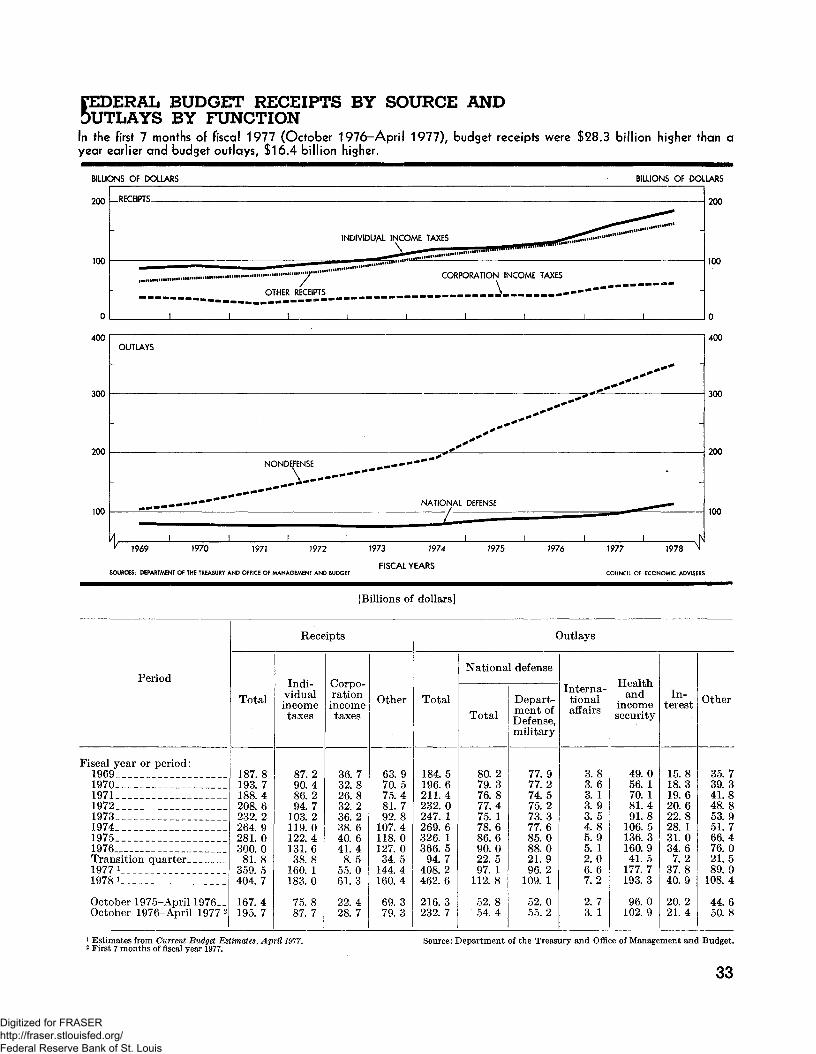
CEDERAL BUDGET RECEIPTS BY SOURCE ANDOUTLAYS BY FUNCTIONIn the first 7 months of fiscal 1977 (October 1976-ApriI 1977), budget receipts were $28.3 billion higher than ayear earlier and budget outlays, $16.4 billion higher.
BILLIONS OF DOLLARS BILLIONS OF DOLLARS
200
100
-RECEIPTS-
CORPORATION INCOME TAXES/ \
— ...... OTHER RECEIPTS „„„„„„„„—— J—«™«-*-—'
200
100
400
300
200
100
OUTLAYS
NONDEFENSE
400
300
200
100
1969 1970 1971 1972
SOURCES; DEPARTMENT OF THE TREASURY AND OFFICE OF MANAGEMENT AND BUDGET
1973 1974
FISCAL YEARS
1975 1976 1977 1978
COUNCIL OF ECONOMIC ADVISERS
[Billions of dollars]
Fiscal year or period:19691970 _ _ _ _ _19711972_ _ _ _ _ „1973_1974 __1975 _ _1976 _ _Transition quarter.19771
19781
October 1975-April 1976__October 1976- April 1977 2
Total
187.8193. 7188. 4208.6232. 2264. 9281.0300.081.8
359. 5404.7
167. 4195.7
Rece
Indi-vidualincometaxes
87.290.486.294.7
103.2119. 0122.4131. 638. 8
160. 1183.0
75. 887.7
ipts
Corpo-rationincometaxes
36.732. 826. 832. 236.238. 640.641. 48.5
55.061.3
22. 428. 7
Other
63.970.575.481. 792. 8
107.4118.0127. 034.5
144. 4160.4
69.379.3
Total
184. 5196.6211. 4232.0247. 1269.6326. 1366.5
94.7408.2462.6
216.3232. 7
Nationa
Total
80.279. 376.877.475. 178.686. 690. 022. 597. 1
112. 8
52.854. 4
(
1 defense
Depart-ment ofDefense,military
77. 977.274.575.273.377.685.088.021. 996.2
109. 1
52.055. 2
)utlays
Interna-tionalaffairs
3.83.63. 13.93. 54.85. 95. 12.06.67. 2
2. 73. 1
Healthand
incomesecurity
49.056. 170. 181.491, 8
106.5136.3160.941.5
177.7193.3
96. 0102.9
In-terest
15.818.319. 620.622.828, 131.034.67.2
37.840.9
20. 221.4
Other
35.739.341.848.853.951.766.476.021. 589.0
108. 4
44. 650.8
1 Estimates from Current Budget Estimates, April 1977.2 First 7 months of fiscal year 1977.Source: Department of the Treasury and Office of Management and Budget.
33
Digitized for FRASER http://fraser.stlouisfed.org/ Federal Reserve Bank of St. Louis
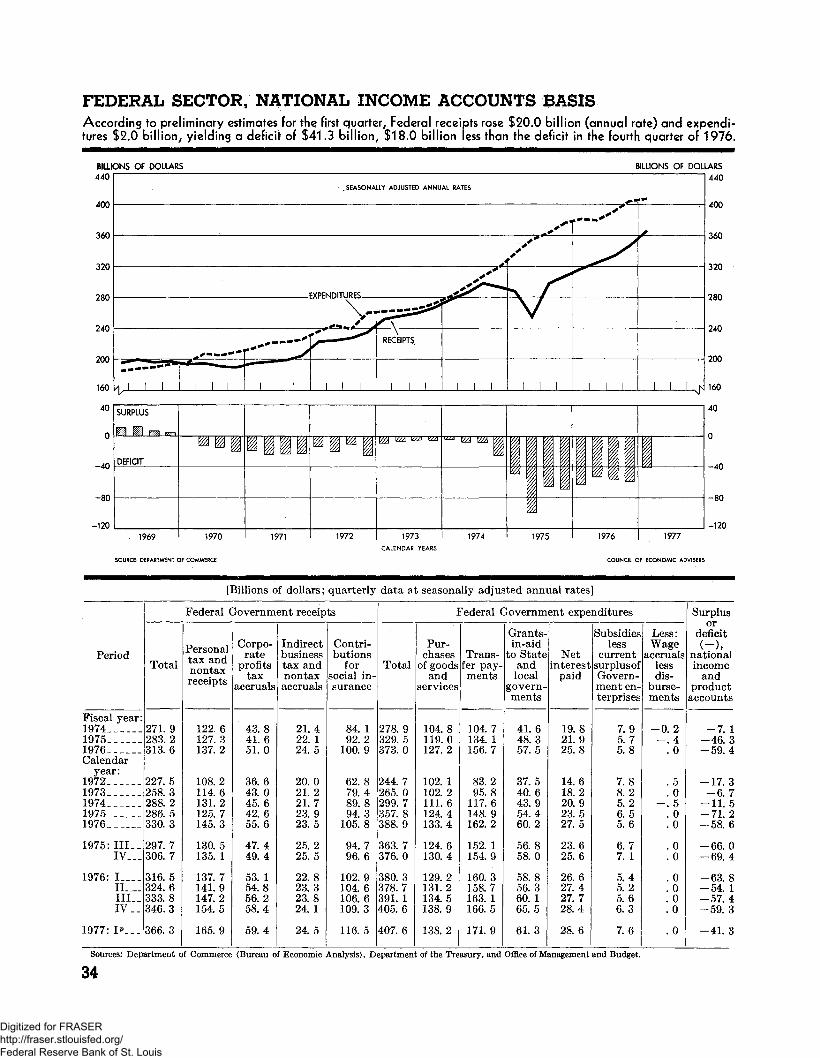
FEDERAL SECTOR, NATIONAL INCOME ACCOUNTS BASISAccording to preliminary estimates for the first quarter, Federal receipts rose $20.0 billion (annual rate) and expendi-tures $2.0 billion, yielding a deficit of $41.3 billion, $18.0 billion less than the deficit in the fourth quarter of 1976.
BILLIONS OF DOLLARS440
400
BILLIONS OF DOLLARS
440
160
40
-40
-80
-120
40
-40
-80
-120
SURPLUS
DEFICIT
1969
"I
1970
iiii
1971
^ m m n
1972
Y/A fcZd w*Q *&3
1973
"" &22 WA Kgl
1974
ImIII
197
I1
5
I1\% I1
19
IW
76
1n \1977
CALENDAR YEARS
SOURCE: DEPARTMENT OF COMMERCE COUNCIL OF ECONOMIC ADVISERS
[Billions of dollars; quarterly data at seasonally adjusted annual rates]
Period
Fiscal year:197419751976Calendar
year:19721973197419751976
1975: III..IV___
1976: IIL_-III..IV __
1977: !*___
Total
271.9283. 2313.6
227.5258.3288.2286. 5330.3
297. 7306.7
316.5324. 6333.8346.3
366. 3
Federal (
Personaltax andnontaxreceipts
122. 6127.3137.2
108. 2114. 6131.2125.7145. 3
130.5135. 1
137.7141.9147.2154.5
165. 9
jrovernm
Corpo-rate
profitstax
accruals
43.841. 651.0
36.643. 045.642. 655.6
47.449.4
53. 154.856.258.4
59. 4
ent reeeip
Indirectbusinesstax andnontaxaccruals
21.422. 124. 5
20. 021. 221.723.923.5
25. 225.5
22.823. 323.824. 1
24. 5
ts
Contri-butions
forsocial in-surance
84. 192. 2
100.9
62. 879.489,894.3
105.8
94.796. 6
102. 9104. 6106.6109.3
116. 5
Total
278.9329. 5373.0
244.7265. 0299.7357.8388.9
363. 7376.0
380.3378.7391. 1405.6
407.6
I
Pur-chases
of goodsand
services
104.8119. 0127. 2
102. 1102. 2111.6124.4133.4
124. 6130. 4
129. 2131. 2134. 5138.9
138.2
^ederal (
Trans-fer pay-ments
104.7134. 1156.7
83.295. 8
117.6148.9162.2
152. 1154. 9
160. 3158. 7163. 1166.5
171.9
•rovernm
Grants-in-aid
to Stateandlocal
govern-ments
41.648. 357.5
37.540. 643.954. 460.2
56.858.0
58. 856. 360. 165.5
61. 3
ent expe
Netinterest
paid
19.821. 925. 8
14.618.220.923.527.5
23. 625.6
26.627.427.728.4
28. 6
nditures
Subsidiesless
currentsurplus ofGovern-ment en-terprises
7.95. 75.8
7.88. 25.26.55.6
6.77. 1
5.45.25.66.3
7.6
Less:Wage
accrualslessdis-
burse-ments
-0.2-.4
.0
.5
.0
. o
.0
.0
.0
.0
.0
. 0
.0
.0
.0
Surplusor
deficit(-),nationalincome
andproductaccounts
-7. 1-46.3-59.4
-17.3-6.7
-11.5-71.2-58. 6
-66.0-69.4
-63.8-54. 1-57.4-59. 3
-41.3
Sources: Department of Commerce (Bureau of Economic Analysis), Department of the Treasury, and Office of Management and Budget.
34
Digitized for FRASER http://fraser.stlouisfed.org/ Federal Reserve Bank of St. Louis
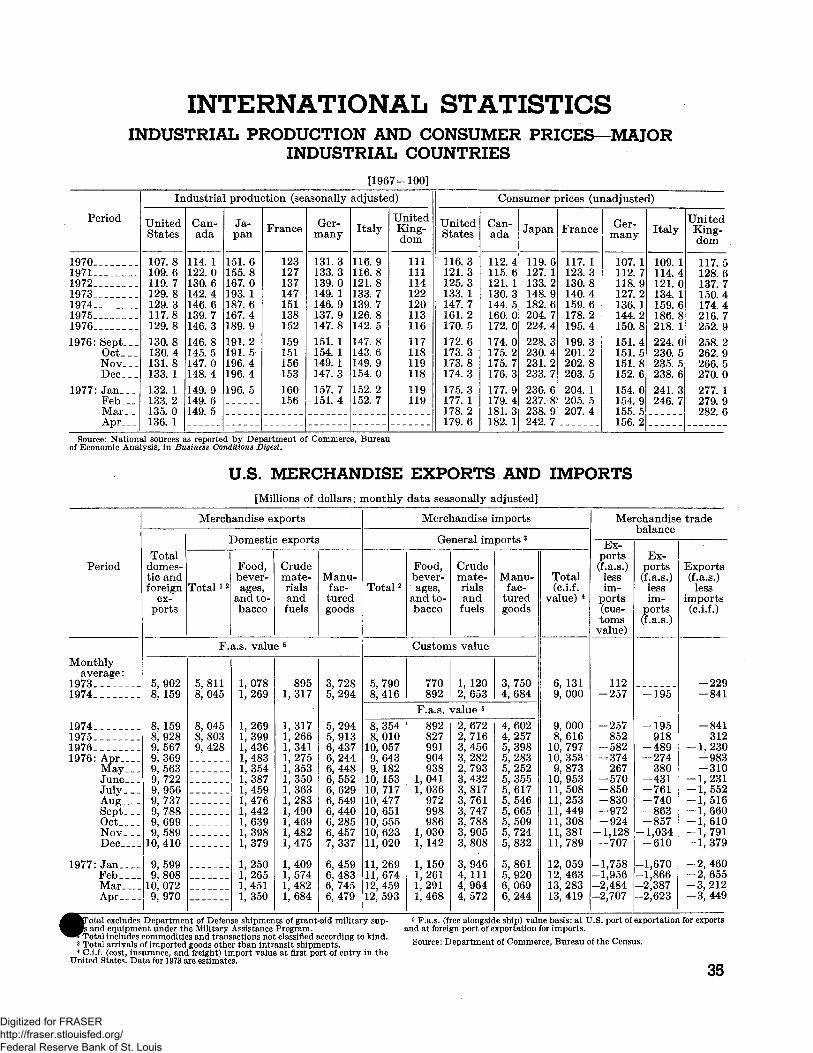
INTERNATIONAL STATISTICSINDUSTRIAL PRODUCTION AND CONSUMER PRICES—MAJOR
INDUSTRIAL COUNTRIES[1967=100]
Period
19701971___ _ _197219731974___ _ _ _197519761976: Sept.—
O c t _ _ _NovD e c _ _ _
1977: Jan___Feb—Mar__Apr
In
UnitedStates
107.8109.6119.7129.8129.3117.8129.8130.8130.4131.8133. 1132. 1133.2135. 0136. 1
dustria]
Can-ada
114. 1122. 0130.6142.4146.6139. 7146.3146.8145.5147. 0148.4149. 9149.6149. 5
I produc
Ja-pan
151. 6155.8167.0193. 1187.6167.4189.9191. 2191. 5196.4196.4196. 5
3tion (sei
France
123127137147151138152159151156153160156
isonally
Ger-many
131.3133.3139.0149. 1146.9137.9147.8151. 1154. 1149. 1147. 3157.7151. 4
ad juste
Italy
116.9116.8121. 8133.7139.7126.8142. 5147.8143.6149.9154. 0152. 2152.7
d)
UnitedKing-dom
111111114122120113116117118119118119119
UnitedStates
116.3121. 3125.3133. 1147.7161. 2170.5172. 6173.3173.8174.3175.3177. 1178.2179.6
Con
Can-ada
112.4115. 6121. 1130.3144. 5160. 0172.0174.0175. 2175.7176.3177.9179.4181. 3182. 1
sumer i
Japan
119.6127. 1133.2148. 9182.6204.7224.4228.3230.4231.2233.7236.6237.8238. 9242.7
>riees (ui
France
117. 1123.3130,8140.4159. 6178.2195.4199.3201. 2202.8203.5204. 1205.5207. 4
iadjuste<
Ger-many
107. 1112. 7118. 9127.2136. 1144. 2150.8151.4151.5151.8152.6154.0154.9155.5156. 2
D
Italy
109.1114.4121. 0134. 1159.6186.8218. 1224. 0230.5235.5238.6241. 3246. 7
UnitedKing-dom
117.5128.6137.7150.4174.4216.7252.9258.2262. 9266.5270.0277. 1279.9282.6
Source: National sources as reported by Department of Commerce, Bureauof Economic Analysis, in Business Conditions Digest.
U.S. MERCHANDISE EXPORTS AND IMPORTS[Millions of dollars; monthly data seasonally adjusted]
Period
Monthlyaverage :
19731974
1974197519761976: A p r _ _ _ _
MayJuneJu ly___AugSept.-.OctNovDec
1977: JanFebMarApr_ _
Totaldomes-tic andforeign
ex-ports
5,9028, 159
8, 1598,9289, 5679,3699, 5639,7229,9569,7379,7889,6999, 589
10,410
9,5999,808
10, 0729,970
Merch
]
Total i 2
F.
5,8118,045
8,0458,8039,428
andise e
Domestic
Food,bever-ages,
and to-bacco
a.s. valu
1,0781,269
1,2691,3991,4361,4831,3541,3871,4591,4761,4421,6391, 3981,379
1,2501,2651,4511,350
xports
3 exports
Crudemate-rialsandfuels
e 5
8951,317
1,3171,2661,3411, 2751,3531,3501,3631,2831,4901,4691,4821,475
1,4091,5741,4821,684
Manu-fac-turedgoods
3,7285,294
5,2945, 9136,4376,2446,4486,5526, 6296, 5496,4406,2856,4577,337
6,4596,4836, 7456,479
Total 2
5,7908,416
8,3548,010
10, 0579,6439,182
10, 15310, 71710, 47710, 65110, 55510, 62311, 020
11,26911, 67412, 45912, 593
Merc!
Ge
Food,bever-ages,
and to-bacco
Custom
770892
F.a.s. <892827991904938
1,0411,036
972998986
1, 0301, 142
1, 1501,2611,2911,468
landise i
neral im
Crudemate-rialsandfuels
s value
1, 1202,653
value 5
2,6722,7163,4563,2822,7933,4323,8173, 7613,7473,7883,9053,808
3,9464, 1114,9644,572
mports
ports 3
Manu-fac-
turedgoods
3,7504,684
4,6024,2575,3985,2835,2525, 3555,6175,5465,6655,5095,7245,832
5,8615,9206,0696,244
Total(c.i.f.
value) 4
6, 1319,000
9,0008,616
10, 79710, 3539,873
10, 95311, 50811, 25311, 44911, 30811, 38111, 789
12, 05912, 46313, 28313, 419
Mei
Ex-ports(f.a.s.)lessim-
ports(cus-toms
value)
112-257
-257852
-582-374
267-570-850-830-972-924
-1,128-707
-1,758-1,956-2,484-2,707
-ehandisebalance
Ex-ports(f.a.s.)
lessim-
ports(f.a.s.)
-195
-195918
-489-274
380-431-761-740-863-857
-1,034-610
-1,670-1,866-2,387-2,623
3 trade
Exports(f.a.s.)
lessimports(c.i.f.)
-229-841
-841312
-1,230-983— 310
-1,231-1,552-1, 516-1,660-1,610-1,791-1,379
-2, 460-2, 655-3,212-3,449
Total excludes Department of Defense shipments of grant-aid military sup-s and equipment under the Military Assistance Program.
*Total includes commodities and transactions not classified according to kind.3 Total arrivals of imported goods other than intransit shipments.4 C.i.f. (cost, insurance, and freight) import value at first port of entry in theUnited States. Data for 1973 are estimates.
5 F.a.s. (free alongside ship) value basis: at U.S. port of exportation for exportsand at foreign port of exportation for imports.
Source: Department of Commerce, Bureau of the Census.
35
Digitized for FRASER http://fraser.stlouisfed.org/ Federal Reserve Bank of St. Louis
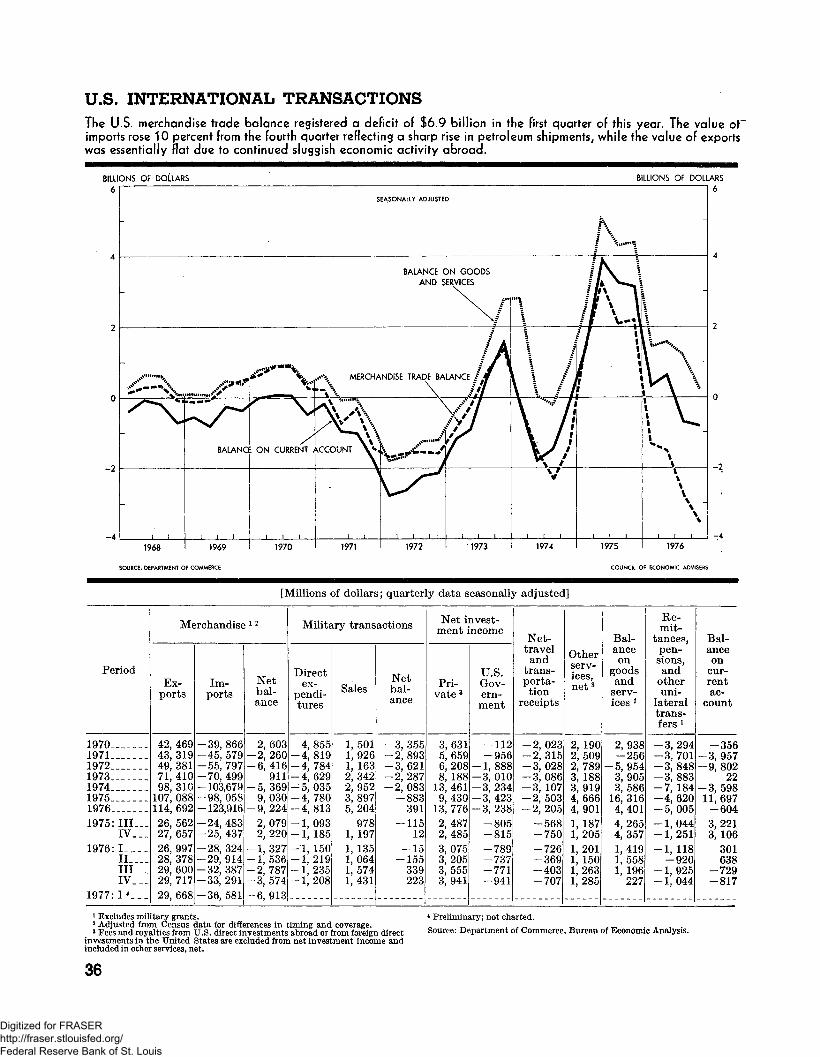
U.S. INTERNATIONAL TRANSACTIONSThe U.S. merchandise trade balance registered a deficit of $6.9 billion in the first quarter of this year. The value oFimports rose 10 percent from the fourth quarter reflecting a sharp rise in petroleum shipments, while the value of exportswas essentially flat due to continued sluggish economic activity abroad.
BILLIONS OF DOLLARS
6
BILLIONS OF DOLLARS6
1968
SOURCE: DEPARTMENT OF COMMERCE
1976
COUNCIL OF ECONOMIC ADVISERS
[Millions of dollars; quarterly data seasonally adjusted]
Period
19701971197219731974197519761975:111—
IV. -1976: I
II.__-III.__I V _ _ _
1977: I 4 _ _ _
Me
Ex-ports
42, 46943, 31949, 38171, 41098, 310
107, 088114, 69226, 56227, 65726, 99728, 37829, 60029, 71729, 668
;rchandise
Im-ports
-39,866-45, 579-55, 797-70,499-103,679-98,058-123,916-24,483-25,437-28, 324-29, 914-32,387-33, 291-36, 581
1 2
Netbal-ance
2,603-2,260-6,416
911-5,369
9,030-9,224
2,0792,220
-1,327-1,536-2,787-3, 574-6,913
Milits
Directex-
pendi-tures
-4, 855-4, 819-4, 784-4, 629-5,035-4, 780-4,813-1,093-1, 185-1, 150-1,219-], 235-1,208
try trans
Sales
1,5011,9261, 1632,3422,9523,8975,204
9781, 1971, 1351,0641, 5741,431
actions
Netbal-ance
-3, 355-2, 893-3, 621-2, 287-2, 083
-883391
-11512
-15-155
339223
Netiiment ;
Pri-vate 3
3, 6315,6596,2088, 188
13, 4619,430
13, 7762,4872,4853,0753,2053,5553,941
nvest-ncome
U.S.Gov-ern-ment
-112-956
-1,888-3,010-3,234-3,423-3,238
-805-815-789-737-771-941
Net-traveland
trans-porta-tion
receipts
-2, 023-2,315-3,028-3,086-3, 107-2,503-2, 205
-568-750-726-369-403-707
Otherserv-ices,net 3
2, 1902,5092,7893,1883,9194, 6664,9011, 1871,2051,2011, 1501,2631,285
Bal-anceon
goodsand
serv-ices *
2,938-256
-5, 9543,9053,586
16, 3164,4014,2654,3571,4191,5581, 196
227
Re-mit-
tance?,pen-sions,and
otheruni-
lateraltrans-fers1
-3, 294-3, 701-3, 848-3,883-7, 184-4, 620-5,005-1,044-1,251-1, 118
-920-1,925-1,044
Bal-anceon
cur-rentac-
count
-356-3, 957-9,802
22-3,59811, 697
-6043,2213,106
301638
-729-817
1 Excludes military grants.2 Adjusted from Census data for differences in timing and coverage.3 Fees and royalties from U.S. direct investments abroad or from foreign direct
investments in the United States are excluded from net investment income andincluded in other services, net.
4 Preliminary; not charted.Source: Department of Commerce, Bureau of Economic Analysis.
36
Digitized for FRASER http://fraser.stlouisfed.org/ Federal Reserve Bank of St. Louis

J.S. INTERNATIONAL TRANSACTIONS—ContinuedI.S. assets abroad increased $43.0 billion in 1976 compared with a rise of $31.6 billion in 1975. The increase in
large part was accounted for by bank lending to foreigners. Foreign assets in the United States rose sharply last year,by $33.1 billion, with foreign official assets responsible for most of the increase.
BILLIONS OF DOLLARS15
BILLIONS OF DOLLARS15
CHANGE INU.S. ASSETS
ABROAD. NET
-10
-151968 1969 1970 1971 1972 1973 1974 1975 1976
SOURCE: DEPARTMENT OF COMMERCE COUNCIL OF ECONOMIC ADVISERS
[Millions of dollars; quarterly data seasonally adjusted, except as noted]
Period
197019711972 „ _ .197319741975. ___1976
1975:III_.__IV ._
1976:1I I _ _I I I__.IV.__.
77: I"1
U.J[mere*
Total
-6,032-9,596- 10, 245-16,434-33, 392-31, 593-43, 021
-4,411-11,238
-10,007-9, 875-8, 681
-14,459
3. assetsise/eapital
U.S.officialreserveassets 1 2
2,4772,348
32209
-1,434-607
-2,530
-34289
-773-1, 578
-407228
-388
abroad, noutflow
OtherU.S.
Govern-mentassets
-1,589-1,884-1,568-2,645
365-3,463-4, 295
-772952
-684-1,009-1,450-1, 153
iet(-)]
U.S.privateassets 2
-6,920-10, 060-8, 708-13, 998-32, 323-27, 523-36, 195
-3, 29710, 375
8,550-7,288-6, 824-13, 534
Forei[incr<
Total
5,92322, 44521, 12718, 51932, 43315,32633, 129
2,7085,874
5,3967,3308,247
12, 156
gn assets3ase/capit<
Foreignass
Total
6,90726, 89510, 7056,299
10, 9816,899
18, 107
-1,6062,771
3,9424, 1052, 9997,061
in the U.al inflow
officialets
Assets offoreignofficialreserveagencies
7,36227, 40510, 3225, 145
10, 2575, 166
13, 094
-1,9772, 272
2,4603,3081, 2536,073
4, 751
S., net(+)P
Otherforeignassets
-984-4,45010, 42212, 22021, 4528,427
15, 022
4,3133, 103
1,4543,2255,2485,095
Alloca-tions
ofspecial
drawingrights(SDR)
86771771C
Statidiscre
TYktal
(sum oxthe
itemswith signreversed)
-402-9,609-1,790-2, 107
4,5574,570
10, 495
— 1, 5172,258
4, 3101,9071, 1633, 120
sticalpancy
Ofwhich :
Seasonaladjust-ment
diserep-
-2,5611,275
95873
-2, 8001,773
U.S.officialreserveassets,net1
(unad-justed,end ofperiod)
14, 48712, 16713, 15114, 37815, 88316, 22618, 747
16, 29116, 226
16, 94118, 47718, 94518, 747
19, 120
* Consists of gold, special drawing rights (SDR), convertible currencies, andthe U.S. reserve position in the IMF.
2 Quarterly data are not seasonally adjusted.
Sources: Department of Commerce (Bureau of Economic Analysis) and De-partment of the Treasury.
37
Digitized for FRASER http://fraser.stlouisfed.org/ Federal Reserve Bank of St. Louis

UNITED STATESGOVERNMENT PRINTING OFFICE
DIVISION OF PUBLIC DOCUMENTS
WASHINGTON. D.C. 2O4O2
POSTAGE AND FEES PAIDU.S. GOVERNMENT PRINTING OFFII
375
OFFICIAL BUSINESS
First-Class Mail
ContentsTOTAL OUTPUT, INCOME, AND SPENDING Page
Gross National Product 1Gross National Product in 1972 Dollars 2Implicit Price Deflators for Gross National Product 2Changes in GNP and GNP Price Measures 3Nonfinancial Corporate Business—Output, Costs, and Profits 3National Income 4Personal Consumption Expenditures 4Sources of Personal Income 5Disposition of Personal Income 6Farm Income 7Corporate Profits 8Gross Private Domestic Investment 9Expenditures for New Plant and Equipment 10
EMPLOYMENT, UNEMPLOYMENT, AND WAGESStatus of the Labor Force -. 11Selected Unemployment Rates 12Selected Measures of Unemployment and Unemployment Insurance Programs 13Nonagricultural Employment 14Average Weekly Hours and Hourly Earnings—Private Nonagricultural Industries 15Average Weekly Earnings—Private Nonagricultural Industries 15Productivity and Related Data, Private Business Economy 16
PRODUCTION AND BUSINESS ACTIVITYIndustrial Production and Capacity Utilization 17Industrial Production—Major Market Groups and Selected Manufactures 18New Construction 10New Private Housing and Vacancy Rates 11Business Sales and Inventories—Total and Trade 29Manufacturers' Shipments, Inventories, and New Orders 29
PRICESWholesale Prices 22Consumer Prices 23Changes in Wholesale Prices 24Changes in Consumer Prices , . 24Prices Received and Paid by Farmers 25
MONEY, CREDIT, AND SECURITY MARKETSMoney Stock 26Private Liquid Asset Holdings—Nonfinancial Investors 27Consumer Instalment Credit 27Bank Loans, Investments, and Reserves 28Sources and Uses of Funds, Nonfarm Nonfinancial Corporate Business 29Current Assets and Liabilities of Nonfinancial Corporations 29Interest Rates and Bond Yields 30Common Stock Prices and Yields 31
FEDERAL FINANCEFederal Budget Receipts and Outlays and Debt 32Federal Budget Receipts by Source and Outlays by Function 33Federal Sector, National Income Accounts Basis 34
INTERNATIONAL STATISTICSIndustrial Production and Consumer Prices—Major Industrial Countries 35U.S. Merchandise Exports and Imports 35U.S. International Transactions 36
For sale by the Superintendent oJ Documents, U.S. Government Printing Office, Washington, D.C. 20401Price 85 cents (single copy). Subscription price: $10.10 per year; $2.55 additional
for loreign mailing.
38 U.S. G O V E R N M E N T P R I N T I N G OFFICE: It77
Digitized for FRASER http://fraser.stlouisfed.org/ Federal Reserve Bank of St. Louis