Economic Indicators: December 1950 - FRASER
35
Economic Indicators DECEMBER 1950 i - Prepared for the Joint Committee on the Economic Report by the Council of Economic Advisers ! A> UNITED STATES GOVERNMENT PRINTING OFFICE WASHINGTON : 1950 Digitized for FRASER http://fraser.stlouisfed.org/ Federal Reserve Bank of St. Louis
Transcript of Economic Indicators: December 1950 - FRASER

Economic IndicatorsDECEMBER 1950
i -
Prepared for the Joint Committee on the Economic Report
by the Council of Economic Advisers
!A>
UNITED STATES
GOVERNMENT PRINTING OFFICE
WASHINGTON : 1950
Digitized for FRASER http://fraser.stlouisfed.org/ Federal Reserve Bank of St. Louis

JOINT COMMITTEE ON THE ECONOMIC REPORT
(Created pursuant to Sec. 5 (a) of Public Law 304, 79th Cong.)
JOSEPH C. O'MAHONEY, Wyoming, Chairman
EDWARD J. HART, New Jersey, Via Chairman
FRANCIS J. MYERS, Pennsylvania WRIGHT PATMAN, Texas
JOHN J. SPARKMAN, Alabama WALTER B. HUBER, Ohio
PAUL H. DOUGLAS, Illinois FRANK BUCHANAN, Pennsylvania
ROBERT A. TAFT, Ohio JESSE P. WOLCOTT, Michigan
RALPH E, FLANDERS, Vermont ROBERT F. RICH, Pennsylvania
ARTHUR V. WATKINS, Utah x CHRISTIAN A, HERTER, Massachusetts
THEODORE J. KREPS, Staff Director
GSOVBR W. ENSLEY, Associate Staff Director
JOHN W. LEHMAN, Clerk
COUNCIL OF ECONOMIC ADVISERS(Created pursuant to Sec. 4 (a) of Public Law 304, 79th Cong.)
LEON H. KEYSERLING, Chairman
JOHN D. CLARK
ROY BLOUGH
[PUBLIC LAW 120—81sx CONGRESS; CHAPTER 237—IST SESSION]
JOINT RESOLUTION [S. J. Res. 55]
To print the monthly publication entitled " Economic Indicators"
Resolved by the Senate and House of Representatives of the United States of America in Congress assembled, That the JointCommittee on the Economic Report be authorized to issue a monthly publication entitled "Economic Indicators/'and that a sufficient quantity be printed to furnish one copy to each Member of Congress; the Secretary and theSergeant at Arms of the Senate; the Clerk, Sergeant at Arms, and Doorkeeper of the House of Representatives; twocopies to the libraries of the Senate and House, and the Congressional Library; seven hundred copies to the JointCommittee on the Economic Report; and the required number of copies to the Superintendent of Documents fordistribution to depository libraries; and that the Superintendent of Documents be authorized to have copies printedfor sale to the public.
Approved June 23, 1949.
Charts drawn by Graphics Unit, Office of the Secretary, Department of Commerce
11
Digitized for FRASER http://fraser.stlouisfed.org/ Federal Reserve Bank of St. Louis

ContentsTHE TOTAL OUTPUT OF THE ECONOMY
The Nation's Economic Budget 1Gross National Product 2
PRICESConsumers' Prices 3Wholesale Prices 4Prices Received and Paid by Farmers 5Stock Prices 6
Labor Force 7Nonagricultural Employment—Selected Industries 8Average Weekly Hours—Selected Industries 9Average Hourly Earnings—Selected Industries 10Average Weekly Earnings—Selected Industries 11Work Stoppages 12
PRODUCTION ACTIVITYIndustrial Production 13Weekly Production—Selected Indicators 14Production of Selected Manufactures .. 15New Construction 16New Housing Starts 17Expenditures for New Plant and Equipment 18New Corporate Security Issues 19Inventories and Sales 20Merchandise Exports and Imports 21
National Income 22Corporate Profits 23Personal Income 24Consumer Income, Spending, and Saving 25Personal Consumption Expenditures 26Per Capita Disposable Income 27Farm Income 28Consumer Credit 29
MONEY, FEDERAL FINANCEBank Loans and Investments 30Money Supply 31Federal Cash Receipts From and Payments to the Public 32
Digitized for FRASER http://fraser.stlouisfed.org/ Federal Reserve Bank of St. Louis
THE TOTAL OUTPUT OF THE ECONOMY
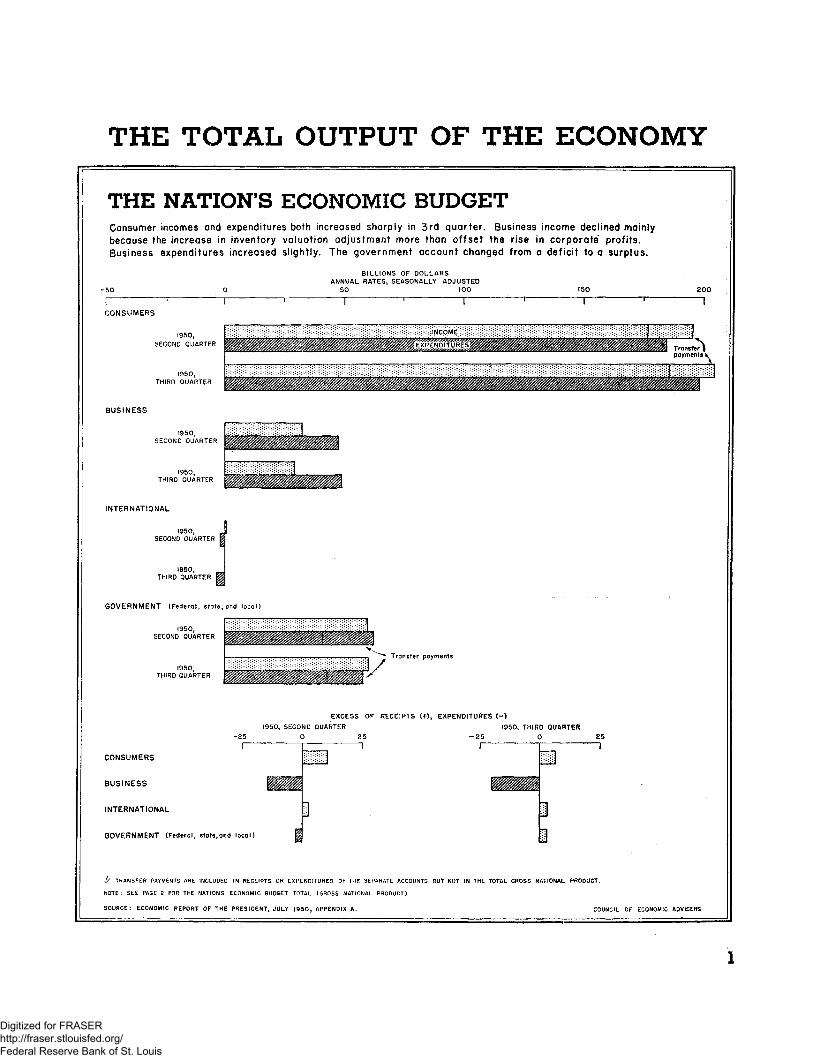
THE NATION'S ECONOMIC BUDGETConsumer incomes and expenditures both increased sharply in 3rd quarter, Business income declined mainlybecause the increase in inventory valuation adjustment more than offset the rise in corporate profits.Business expenditures increased slightly. The government account changed from a deficit to a surplus.
BILLIONS OF DOLLARSANNUAL RATES, SEASONALLY ADJUSTED
50 100
CONSUMERS
1950,SECOND QUARTER
1950,THIRD QUARTER
Transfer!payments \
BUSINESS
1950,SECOND QUARTER
1950,THIRD QUARTER
INTERNATIONAL
I95O,SECOND QUARTER
1950,THIRD QUARTER
GOVERNMENT (Federal, state, ond local)
I960,SECOND QUARTER
1950,THIRD QUARTER
Transfer payments
EXCESS OF RECEIPTS {+}, EXPENDITURES (-)
1950, SECOND QUARTER I960, THIRD QUARTER-25 0 25 -25 0 25
CONSUMERS
BUSINESS
INTERNATIONAL
GOVERNMENT (Federal, state,ond local)
1 m i
. TRANSFER PAYMENTS ARE INCLUDED IN RECEIPTS OR EXPENDITURES OF THE SEPARATE ACCOUNTS BUT NOT IN THE TOTAL GROSS NATIONAL PRODUCT.
NOTE: SEE PAGE 2 FOR THE NATIONS ECONOMIC BUDGET TOTAL (GROSS NATIONAL PRODUCT)
SOURCE: ECONOMIC REPORT OF THE PRESIDENT, JULY I95O, APPENDIX A. COUNCIL OF ECONOMIC ADVISERS
Digitized for FRASER http://fraser.stlouisfed.org/ Federal Reserve Bank of St. Louis

GROSS NATIONAL PRODUCTTotal expenditures for goods and services rose $14 billion (annual rate), or 5 percent, in 3rd quarter.Personal consumption expenditures increased 7 percent and business 'investment, 3 percent. Governmentpurchases showed little increase. Net foreign investment continued to drop.
BILLIONS OF DOLLARS300
-50 LJ
ANNUAL TOTALS
iSONAL CONSUMPTION EXPENDITURES
NATIONAL PRODUCT
PRIVATE DOMESTtClNVESTMENT
RNMENT PURCHASES OF GOODS AND SERVICES'
FOREIGN INVESTMENT"
SOURCE;-DEPARTMENT OF COMMERCE (EXCEPT AS NOTED}
1950
BILLIONS OF DOLLARS300
[Billions of dollars]
Period*
1939.19441946. _1947. ..19481949
1949: First quarter ._• .Second quarterThird quarterFourth quarter..
1950: First quarter. _._ ._Second quarter .Third quarter
Total grossnationalproduct
91.3213.7211. 1233.3259. 1255.6
Personalconsump-
tion expend-itures
67.5111.6146.9165.6177.4178.8
Gross privatedomestic
investment
9.97.7
28.730.243. 133.0
Net foreigninvestment
0.9-2.1
4.68.91.9.4
Governmentpurchases ofgoods and
services
13. 196.530.928. 636.643.3
Annual rates, seasonally adjusted
258.8255. 2254.4253.8
263.4270.3284.3
177.4178.4179.0180.6
182.4185.2198.4
37.531.332. 131.2
41.746.948.4
1.01.3. 1
-.7
-1.7-2.0-3.3
42.944.343.242.8
41.040.240.8
NOTE.—Detail will not necessarily add to totals because of rounding.Source: Department of Commerce.
Digitized for FRASER http://fraser.stlouisfed.org/ Federal Reserve Bank of St. Louis

PRICES
CONSUMERS' PRICESConsumers* prices rose 0.6 percent from September 15 to October 15, to exceed the previous 1948 peak by0.2 percent. The sharpest price increases were for apparel and housefurnishings. Food prices, althoughslightly higher, were held down by seasonal declines in meat prices.
PERCENT OF 1935-39 AVERAGEE20
PERCENT OF 1935-39 AVERAGE220
1948 1949 I960
SOURCE: DEPARTMENT OF LABOR
[1935-39=100]
Period
1940 monthly average1942 monthly average1943 monthly average1944 monthly average1945 monthly average1946 monthly average1947 monthly average1948 monthly average1949 monthly average1949: September 15 .
October 15 .November 15December 15
1950: January 15 .February 15—March 15April 15 -.May 15June 15July 15. __August 15September 15October 15
All items
100.2116. 5123. 6125.5128.4139.3159. 2171.2169. 1169 6168. 5168. 6167. 5166. 9166. 5167.0167. 3168 6170. 2172. 5173. 0173.8174. 8
Food
96.6123.9138.0136. 1139. 1159. 6193. 8210. 2201.9204 2200. 6200. 8197 3196 0194. 8196. 0196. 6200 3204 6210. 0209.0208.51 209. 0
Apparel
101.7124.2129.7138. 8145.9160. 2185.8198.0190. 1187 2186 8186. 3185 8185 0184. 8185 0185. 1185 1185 0184. 7185. 9190.5193. 4
Rent
104.6108.5108.0108.2108.3108.6111.2117.4120.8121 2121 5122 0122 2122 6122. 8122 9123. 1123 5123 9124. 3124. 6124.8125. 0
Fuel, elec-tricity, andrefrigeration
99.7105.4107. 7109.8110.3112.4121. 1133.9137.5137 0138. 4139. 1139 7140. 0140. 3140.9141. 4138 8138 9139. 5140. 9141.8143. 1
House fur*nishings
100.5122.2125. 6136.4145.8159.2184.4195. 8189.0185. 6185. 2185. 4185. 4184. 7185.3185. 4185. 6185. 4185. 2186.4189.3195.4199.8
Miscellane-ous
101. 1110. 9115.8121.3124. 1128. 8139. 9149.9154. 6155. 2155.2154.9155. 5155. 1155. 1155.0154.8155. 3155. 3156. 2158. 1158.8159.5
* A special survey indicates that food prices increased 0.2 percent between October 15 and November }5?
NOTE.—Prices are for moderate-income families in large cities. : Department of Labor.
Digitized for FRASER http://fraser.stlouisfed.org/ Federal Reserve Bank of St. Louis

WHOLESALE PRICESWholesale prices advanced to new postwar peaks during November, with prices* of industrial products,farm products, and foods all increasing.
PERCENT OF 1926 AVERAGE PERCENT OF I§26 AVERAGEE20
160
120
100
LATEST DATA PLOTTED ; MONTHLY -. NOVEMBERW E E K L Y - NOVEMBER 28
SOURCE: DEPARTMENT OF LABOR. COUNCIL OF ECONOMIC ADVISERS
[1926=100]
Period
1942 monthly average1946 monthly average .1947 monthly average1948 monthly average1949 monthly average.. _ _1949: October
November11 . December _
1950: JanuaryFebruaryMarch „AprilMayJuneJulyAugustSeptemberOctober _ _November *
Week ended:1950: November 7
14 _21 _ __28 _
December 5
All com-modities
98. 8121. 1152. 1165. 1155. 0152 2151. 6151. 2151. 5152 7152 7152 9155 9157. 3162 9166. 4169. 5169. 1171. 1
170. 0171. 0171. 2171. 7172.6
Farm prod-ucts
105. 9148. 9181.2188. 3165. 5159 6156. 8154. 9154. 7159 1159 4159 3164. 7165. 9176 0177. 6180. 4177. 8183. 0
181. 3183. 1184. 9185. 7187.5
Foods
99. 6130. 7168. 7179. 1161.4159. 6158. 9155.7154. 8156. 7155. 5155. 3159. 9162. 1171. 4174. 6177.2172. 5174. 9
173. 6176. 5177.5178. 2180.0
Other thanfarm prod-
ucts and foods95. 5
109. 5135.2151.0147. 3145.0145.0145.4145. 8145.9146. 1146. 4147. 6148. 8151. 5155. 5159.2161. 5163. 1
162. 2162.6162.4162.8163.4
' Estimates based on change in weekly data.Source: Department of Labor.
Digitized for FRASER http://fraser.stlouisfed.org/ Federal Reserve Bank of St. Louis

PRICES RECEIVED AND PAID BY FARMERSPrices received by farmers jumped sharply in November, reaching a point 12 percent above the pre-Koreanlevel. Prices paid by farmers were at a record high.
PERCENT OF 1910-14 AVERAGE350
100 ^«p
PERCENT OF 1910-14 AVERAGE350
PRICES RECEIVED
.1
PRICES PAID(INCL. INTEREST, TAXES
AND WAGE RATES)
PARITY RATIO*
I I I I I I I I I I I I I I I I I I I I I I I M M I I I 1 I I
30©
ZOO
1939 40 41 42 43 44 45 46 47 48 491949
SOURCE: DEPARTMENT OF AGRICULTURE COUNCIL ECONOMIC ADVISERS
[1910-14=100]
Period
1939 monthly average1942 monthly average - _ . _ „1944 monthly average1946 monthly average - - . _ • «1947 monthly average1948 monthly average . .....1949 monthly average1949* October 15
November 15 -- - «December 15 '
1950: January 1 5 _ _ . _Februarv 15 . - -« -March 15April 15 - .. -May 15 ...June 15 -_July 15 -August 15 -September 15October 15November 15 .
Pricesreceived
by farmers
95158
3 1962 234
275285249242237233235237237241247247263267272268276
Prices paid byfarmers (includ-
ing interest,taxes, and
wage rates)
123152182207240259250246245246249248250251254255256258261261263
Parity ratio *
77104108113115110100989795949695969797
103103104103105
1 Ratio of index of prices received to index of prices paid, interest, taxes, and wage rates.* Includes wartime subsidy payments paid on beef cattle, sheep, iambs, milk, and butterfat between October 1943 and June 1946.Source: Department of Agriculture.
15086—50
Digitized for FRASER http://fraser.stlouisfed.org/ Federal Reserve Bank of St. Louis

STOCK PRICESIndustrial and railroad stock prices made record gains during most of November but declined sharply in thelast week of the month.
PERCENT OF 1935-39 AVERAGE PERCENT OF 1935-39 AVERAGE
150
1 25
0
WEEKLY AVERAGE
.•A
if\' / ' ^— """"""""""N^
/ /A \//\\A/ / t \I / \ \
^ // I x-"*
\ ¥x^/
1 I I 1 I 1 I I I 1
fWEEKLY AVERAGE S\ /
J
AtyINDUSTRIALS A' /^Hf'/^VI
^ y^/ \ A
\ / / i-fwy/i\A fiV^ \/ ^ • A .\W^! '\/v\v^t W/7>NRA1LBOAOS i
\A 1 rv"VV r"\-*
v -^ y^X^"^ UTILITIES **'"
1 1 I I I I I I | 1 1
r s /y v/v/
, .J ^\ / p,/V
r\/~^Jf
, COMPOSITE INDEX
?\I *, S* j. i
^^H x1^»/N<v/
v/JV
" ~1 1 1 1 1 lj I 1 I 1
s^ \i
A 1. - v..•"""••I
AX^"'Il **" ' K ^^^^^V
^^
I I 1 1 1 1 1 I I I 1
150
125
0
1948 1949 1950
SOURCE: STANDARD AND POOR'S CORPORATION COUNCIL OF ECONOMIC ADVISERS
[1935-39=100]
Period
Weekly average:1939 _19421946 _ . . _194819491949: October ~ _ ._
November _ _ _;December
1950: January „FebruaryMarch _ .April _ .M a y ' _June __ -JulyAugust _SeptemberOctoberNovember _ _
Week ended:1950: November 1
815
" ' 2 2 _." - _29 2
Compositeindex l
94. 269. 4
139. 9124. 4121. 3127. 3129. 1132. 7135. 1136. 7138., 8141. 8146. 9147. 7138. 2147. 2151. 7157. 8156. 1
154. 6154. 1157. 1160. 0154. 5
Industrials
94. 871. 3
143. 4130. 6127. 5134. 4136. 5140. 3142. 6144. 4146. 5150. 0156. 1157. 6147. 3158. 0163. 3170. 6168. 8
167. 0166 6169. 9173. 5167. 1
Railroads
74. 766. 1
143. 0114. 796. 497. 696.2
101.0107.8107. 2108. 5109.5109. 7107. 1109. 7120. 6125. 1129. 2126. 5
123. 7123. 1128. 4131. 5125. 7
Utilities
98. 661. 3
120. 296.297. 5
101.2102.6104. 1105. 8107.4109. 6111.0112.8111.5103. 0104. 2104. 9106. 2105. 0
105.4104. 7105. 3105. 5104.0
1 Composite index prior to June 23,1948, was based on 402 common stocks, and included 354 industrials, 20 railroads, and 28 utilities; thereafter,416 common stocks are represented with 365 industrials, 20 railroads, and 31 utilities.
2 Data became available after chart was prepared. Source: Standard & Poor's Corporation.
Digitized for FRASER http://fraser.stlouisfed.org/ Federal Reserve Bank of St. Louis

EMPLOYMENT AND WAGES• T S "D/ 'O TC / TDI IC11
lJJHLJ5\JJX C \JK\JJLA - \Most changes in the labor force in November were due to seasonal factors. Agricultural employment dropped* inonagricultural employment increased. Unemployment was higher, chiefly because of women entering ;thelabor force in search of holiday jobs and a small number of factory workers affected by conversion t©defense production.
MILLIONS OF PERSONS MtUJONS OF PERSONS
60
50
40
30
20
10
0
H
_
_
-
-
1
•B
:
PU^^WMt
m•^^W&
•^^^
_
_
-
-
UNEMPLOYMENT TOTAL^5-- ^ LABOR FORCE ^ X - _™,
^^^^^^^^^MAGRICULTURAL EMPLOYMENT W^mmm.
- • :-
_
NONAGR
-
-
1 i t i 1 1 t 1 i i J
CULTURAL EMPLOYMENT
1 i t 1 i I I 1 ! t ! ,
-
^^XKm^^m^^^^^^^^^
"' • ' j _
- ' • • _
" - ; -
, , / - / : - : _
' i - i t- i i t-*4'-: i ' i -\-- i
70
60
50
40
30
20
10
n
PERCENT PERCENT20
15
10
5
0
._. I I M C T M D I nVft/lCTMT _ DtTDCCTMT HC n\/ll 1AM 1 A BAP PHRTP
~
~
~
-
S ~
rmi pij jii| till
-
-
~^— _ ^^^^^WMMmMMMMMMim
939 1944 1947 1948 1949^^^^^^^•ffl ^ ft KS1^^^ : ^ |
20
15
10
5
0I
MONTHLY AVERAGE l948 1949 l950
Period
1939 monthly average^1944 monthly average1947 monthly average1948 monthly average1949 monthly average
1949: OctoberNovemberDecember
1950: JanuaryFebruaryMarchAprilMay _ _JuneJulyAugustSeptemberOctoberNovember _ _ .
Civilian labor force
TotalEmployment 1
Total Agricul-tural
Nonagri-cultural
Unem-ploy-ment
Thousands of persons, 14 years of age and over55, 230545 63060, 16861, 44262, 105
62, 57662, 92762, 045
61, 42761, 63761, 67562, 18362, 78864, 86664, 42764, 86763, 56763, 70463,512
45, 75053, 96058, 02759, 37858, 710
59, 00159, 51858, 556
56, 94756, 95357, 55158, 66859, 73161, 48261, 21462, 36761, 22661, 76461,271
9, 6108, 9508,2667,9738,026
7,7107,8786,773
6, 1986,2236,6757, 1958,0629,0468,4408, 1607,8118,4917,551
36, 14045, 01049, 76151, 40550, 684
51, 29051, 64051, 783
50, 74950, 73050, 87751, 47351, 66952, 43652, 77454, 20753, 41553, 27353, 721
9,480670
2, 1422, 0643, 395
3, 5763, 4093,489
4,4804, 6844, 1233, 5153,0573,3843, 2132,5002,3411,9402,240
Unemploy-ment as per-cent of total
civilianlabor force
17. 21.23. 63.45. 5
5. 75.45.6
7.37.66.75.74.95.25.03.93.73.03. 5
i Includes part-time workers and those who had jobs but were not at work for such reasons as vacation, illness, bad wea-ther, temporary lay-off, and industrial disputes.
i.—Detail will not necessarily add to totals because of rounding. Source: Department of Commerce.
Digitized for FRASER http://fraser.stlouisfed.org/ Federal Reserve Bank of St. Louis

NONAGRICULTURAL EMPLOYMENT - SELECTED INDUSTRIESManufacturing employment rose by 70,000 between mid-September and mid-October to nearly 15.8million, a new postwar record. The increase reflected acceleration in plant and equipment expendituresand record sales of consumers1 goods. Employment increased seasonally in trade.
MILLIONS OF WAGEAND SALARY WORKERS
MILLIONS OF WAGEAND SALARY WORKERS
NONDURABLE MANUFACTURING
I I I IJ F M A M J J A S O N D J F M A M J J A S O N O
CONTRACT CONSTRUCTION
lbl*M
r~ i
COUNCIL OF ECONOMIC ADVISERS
[Thousands of wage and salary workers *]
Period
1939 monthly average. „1943 monthly average1946 monthly average1947 monthly average1948 monthly average1949 monthly average1949: September _
OctoberNovemberDecember
1950: JanuaryFebruaryMarch . .April . _MayJune _ _ _JulyAugust 2
September 2
October 2
Manufacturing
Total
10, 07817,38114, 46115, 24715, 28614, 14614, 31213, 89213, 80714, 03113, 98013, 99714, 10314, 16214, 41314, 66614, 77715, 44215, 68715, 757
Durablegoods
4,68311,0777,7398,3738,3157, 4657,4096, 9867,0507,3037,3427,3247,4187,5487,8097,9647,9788, 2878,4358,563
Nondur-able goods
5,3946,3046,7226,8746,9706,6816,9036,9066,7576,7286,6386,6736,6856,6146,6046, 7026,7997, 1557,2527,194
Contractconstruc-
tion
1, 1501, 5671,6611,9822, 1652, 1562, 3412,3132,2442,0881, 9191,8611,9072,0762, 2452,4142,5322,6212,6102,595
Trade
6,6127,1898,6129, 1969,4919,4389,4099,5059,607
10, 1569,2469,1529,2069,3469,3269,4119,3909,4599,6489,745
Financeand
service
4,7035,3206, 2076,4276,5156,5456,6046, 5616,5346,5086,4736, 4736,4996, 5606,6026,6536,6726,6666,6446,577
Govern-ment
(Federal,State,local)
3,9876,0495,6075,4545,6135,8115,8935,8665,7836,0415,7775,7425,7695,9155,9005,8325,7415,7936,0046,039
Transpor-tationand
publicutilities
2,9123,6194,0234,1224, 1513,9773,9593,8713,8923,9303,8693,8413,8733,9283,8854,0234,0624,1184, 1364,112
Mining
845917852943981932948593917940861595938939940946922954951944
1 Includes all full- and part-time wage and salary workers in nonagricultural establishments who worked or received pay during the pay period ending nearestthe 15th of the month. Excludes proprietors, self-employed persons, domestic servants, and personnel of the armed forces. Total derived from this table not com-parable with estimates of nonagricultural employment of the civilian labor force reported by the Department of Commerce (p. 7) which include proprietors, self-employed persons, and domestic servants; which count persons as employed when they are not at work because of industrial disputes; and which are based on anenumeration of population, whereas the estimates in this table are based on reports from employing establishments.
2 Preliminary estimates Source: Department of Labor,
8
Digitized for FRASER http://fraser.stlouisfed.org/ Federal Reserve Bank of St. Louis

HOUF
42
40
38
36
34
0
42
40
38
36
34
0
AVERAGE WEEKLY HOURS - SELECTED INDUSTRIESThe average workweek in manufacturing industries increased to 41,4 hours in October, the longestworkweek since December 1945.
?S PER WEEK HOURS PER WEEK
DURABLE MANUFACTURINGA . .
Till, I . M . I
, -*T
1 1 1 i 1 1 1 1 M I
vvv
1 1 1 L 1 i 1 t 1 1 1 1 1 1 1 1 1 1 1 1 1 1
1947 1948 1949 I960
BUILDING CONSTRUCTION
*
i i l i i 1 M 1 M
v^
J LJ 1 1 I I l_l 1 1
1947 1948
* NOT AVAILABLE PRIOR TO JANUARY 1943
VX /A
V¥
f I 1 1 1 1 I I t l 1 1 1 1 I I 1 1 M 1 1
1949 ,1950
42
40
38
36
34
0
NONDURABLE MANUFACTURING
x .
t i i i i I i i i i t
^
1 1 1 1 1 1 1 1 1 1 i
^^
1 1 1 1 1 1 1 1 1 1 1
rV
M i l l Li . 1 1 I
1947 1948 1949 (950
42
40
38
36
34
0
RETAIL TRADE
^£\^_/\ yv^/X/T^/N
1 I 1 1 l 1 I I I M
<%/
t i 1 1 i 1 l i 1 1 t
1947 1948
1 1 1 1 1 1 1 1 1 1 1 1 1 1 1 1 t M 1 1 1
1949 1950
[Hours per week, selected industries !]
Period
1939 monthly average . _1943 monthly average1946 monthly average1947 monthly average1948 monthly average1949 monthly average - .. _1949: September _ _
OctoberNovemberDecember _
1950: January „_ .February .MarchAprilMayJuneJuly__August 3September 3
October3 _ _
Total
37. 744. 940. 440. 440. 139. 239. 639. 739. 139. 839. 739. 739 739 739 940. 540. 541. 241. 041. 4
Manufacturing
Durablegoods
38.046. 640. 240. 640. 539. 539 639. 939. 040 140. 040. 140 240 740 841. 341. 141. 841 742. 2
Nondurablegoods
37.442. 540.540. 139. 638. 839. 639. 639. 339. 539. 439. 339.238 538. 939. 539. 840. 540. 240. 3
construction
(2)(2)
(2)(2)
37.336.736. 536.936. 135.834.833.734. 535. 636. 537. 036.937. 536.4
(2)
Retail trade
(2)(2)(2)
40.340.340.440. 540.440. 140.740.440.440.340.240.440.941.241.340.4
(2)
1 For production and related workers. iNotaraqable, * Preliminary estimates.Source: Department of Labor.
Digitized for FRASER http://fraser.stlouisfed.org/ Federal Reserve Bank of St. Louis

DOLL1,60
1.50
1.40
1.30
1.20
0
2.1 0
2.00
1.90
1.00
1.70
0
«
AVERAGE HOURLY EAFHourly earnings in industries manufacturing durable goo*October. But in nondurable goods industries, they r
t^RS PER HOUR
DURABLE MANUFACTURING ^
1949 DOLLARS* X***X
^^>T^/ CURRENT DOLLARS
~, , , , ! , , , , , , , , , . ! , , , . . 1 1 1 1 1 1 1 I I 1 1
^^
1 1 , i .71947 1948 1949 1950
BUILDING CONSTRUCTION
X-N. /
1949 DOLLARS* J /
**r*^* CURRENT
1 1 1 ! 1 1 1 1 1 1 1 1 1 ! 1 1 IJ 1 1 1 1
DOLLARS
1 1 1 l 1 1 1 1 1 1 1
''
1 1 1 1 1 1 1 I 1 1 1 1
jNiisjs rose bDse by o
DOLL1.50
1.40
1.30
1.20
I.! 0
0
1.30
1.20
1. 10
1. 00
.90
0 [
fGS - SELECTED INDUSTRIES
y slightly over 1 cent between September andver 2 cents.
ARS PER HOUR
NONDURABLE MANUFACTURING
1949 DOLLARS* ^^r**-jt
~~/<\S*^ CURRENT DOLLARS
i 1 J 1 1 1 1 I 1 I 1 1 1 M 1 Ll 1 L 1
p^-A-—
M i l ! 1 i 1 I 1
/ x^ .
i 1 i 1 1 1 1 I 1 1 1
1947 1948 1949 IfSO
, RETAIL TRADE,
1949 DOLLARS* p^^^****^
S*****'^ CURRENT DOLLAF
^
1 l l 1 i l 1 l l i l i i i i l l l l
1947 1948 1949 1950 1947 1948
sOURCE: DEPARTMENT OF LABOR
s
I ' l l ) J JJl 1 J
^pXTl
1 1 1 1 1 1 1 1 1 11949 I960
[Selected industries l]
Period
1939 monthly average1943 monthly average1946 month1 v average _1947 monthly average1948 monthly average1949 monthly average1949' September
OctoberNovember .December
1950* JanuaryFebruary _ _March _AprilMav ,-- --Aucojr ,JuneJulvAugust * .' - - - -September 4
October 4
All manufacturing
Currentdollars
$0. 633.961
1. 0861.2371. 3501.4011.4071.3921. 3921.4081. 4181. 4201.4241. 4341.4421.4531. 4621.4631.4801. 497
1949dollars 2
$1. 0771. 2861. 2871.3121.3341.4011.4031.3981. 3961.4211.4371.4421.4411.4501. 4461. 4441.4331.4301. 4401. 448
Durable goodsmanufacturing
Currentdollars
$0. 6981.0591. 1561.2921.4101. 4691.4821.4581.4571. 4761.4851. 4831.4861. 4991. 5091. 5221. 5331.5371. 5611. 572
1949dollars 2
$1. 1871. 4181.3701.3701. 3931. 4691.4781. 4641.4611.4891. 5051. 5061.5041. 5161.5141. 5131. 5031.5021. 5181. 520
Nondurable goodsmanufacturing
Currentdollars
$0. 582.803
1.0151. 1711.2781.3251. 3281. 3251.3251. 3341.3431.3501. 3531.3551. 3581. 3651.3751. 3751. 3811.402
1949dollars 2
$0. 9901.0981.2321.2421.2631. 3251. 3241.3301. 3291.3461.3611. 3711.3691. 3701. 3621.3571.3481.3441.3431.356
Buildingconstruction
Currentdollars
(S)
(3)(8)
(3)$1. 8481.9351.9381. 9441.9471.9641.9761.9881. 9951.9861.9981. 9952.0062. 0312.076
(a)
1949dollars 2
(3)(3)(i)«
$1. 8261.9351.9321. 9521. 9531.9822.0022.0182. 0192.0082.0041.9831.9671. 9852. 018
(3)
Retail trade
Currentdollars
(3)(B)
(3)$1. 009
1. 0881. 1371. 1501. 1401. 1381. 1261. 1531. 1451. 1481. 1561. 1621. 1751. 1891. 1901.198
(3)
1949dollars 2
(3)(3)(3)
$1. 0701.0751. 1371. 1471. 1451. 1411. 1361. 1681. 1621. 1621. 1691. 1651. 1681. 1661. 1631. 165(3)
i Production and related workers.»Not available.Source: Department of Labor,
* Current dollars divided by consumers' price index «m tee 1949=100, ge§ note 3 to table on page 27.* Preliminary estimates.
10
Digitized for FRASER http://fraser.stlouisfed.org/ Federal Reserve Bank of St. Louis

DDL65
60
55
50
45.
0
80
75
70
65
60
0
AVERAGE EAiAverage weekly earnings in manufacturing continuedthey increased by $1.25, largely because of the lon^increased by about $1.00, due chiefly to wage rate
LARS PER WEEK /
DURABLE MANUFACTURING //
1949 DOLLARS* f^/^
y-C
IT , , M l , , , , ,
r^RRENT DOLLARS
rs^^v
mil l
v-T
fj1947 1948 1949 1950
BUILDING CONSTRUCTION
/"
1949 DOLLARS*
T, . . . I . . . . .
y"CURRENT C
1 MM hl l l l
1947 1948
b>/^W
OLLARS
i i 1 i 4 1 n i \ \
/^¥
,M, , i , , , , r1949 1950
JNIIstheir ste3er workvncreases
DOL60
55
50
45
40
0
50
45
40
35
30
0
^
fGS -ady rise in October. In durable goods industries,week. In nondurable goods industries, they
LARS PER WEEK
NONDURABLE MANUFACTURING
+s
£1949 DOLLARS* . -*
^^jr^^
^^xX^-. CURRENT DOLLARS
1 ' ' 1 ' I 1 1 LLJ, 1 1 I 1 i 1 I M i l
rS~w
i . . . i 1 i . . i .
2£^rS>~
H1947 1948 1949 1950
RETAIL TRADE
i + 1949 DOLLARS* ^^*^^A
-/ X*V '*""
'~'r^\ ~'•"•"""''' CURRENT
I ' 1 ! ' 1 1 ' 1 ' '
DOLLARS
i i I i I 1 i I i i i _
1947 1948
fe^^
1949 1950
COUNCIL OF ECONOMIC ADVISORS
[Selected industries *]
Period
1939 monthly average - -1943 monthly average.. _ .1946 monthly average1947 monthly average .1948 monthly average1949 monthly average1949: September.
OctoberNovemberDecember . .. .
1950: January...FebruaryMarch. ... _AprilMayJuneJulyAugust 4
September 4 .October 4
All manufacturing
Currentdollars
$23. 8643. 1443. 8249.9754. 1454.9255. 7255. 2654. 4356. 0456. 2956. 3756. 5356.9357.5458. 8559.2160. 2860. 6861.98
1949dollars 2
$40. 5857.7551.9252. 9953. 5054.9255.5555. 4854. 5956.5557. 0357.2357. 2257. 5657. 7158. 5058. 0558. 9259. 0359. 94
Durable goodsmanufacturing
Currentdollars
$26. 5049.3046.4952. 4657. 1158. 0358.6958. 1756. 8259. 1959. 4059.4759.7461. 0161.5762. 8663 0164.2565. 0966. 34
1949dollars 2
$45. 0766. 0055. 0855.6356. 4358.0358. 5158.4056.9959.7360. I8-60. 3860.4761. 6961.7662. 4861.7762.8163 3264. 16
Nondurable goodsmanufacturing
Currentdollars
$21. 7834.1241. 1446.9650.6151.4152. 5952.4752. 0752. 6952. 9153. 0653. 0452. 1752. 8353.9254. 7355. 6955. 5256. 50
1949dollars 2
$37. 0446.6849. 9349.8050. 0151. 4152. 4352. 6852.2353. 1753. 6153.8753. 6852. 7552. 9953. 6053.6654. 4454, 0154. 64
Buildingconstruction
Currentdollars
(8)P)«(3)
$68. 8570. 9570.6971.8070. 2170.2668. 7667.0068.8370. 7072. 9373.8274.0275. 5776.16
P)
1949dollars 2
(3)(3)«(3)
$68. 0370.9570.4872. 0970. 4270.9069. 6768. 0269.6771.4973. 1573. 3872.57^73.8774.09
(3)
Retail trade
Currentdollars
(3)(3)(3)
$40. 6643.8545. 9346.5846. 0645. 6345. 8346. 5846.2646.2646. 4746.9448. 0648. 9949. 1548. 40
(3)
1949dollars *
P)(3)(3)
$43. 1243.3345. 9346.4446.2445.7746.2547. 1946.9646. 8246.9947.0847. 7748. 0348. 0447.08
(3)
i For production and related workers.8 Not available.Source: Department of Labor,
8 Current dollars divided by conmrnen' prioe tncjei on. the base 1948^100,8 Preliminary estimates.,
gee note 3 to table on page 27.
11
Digitized for FRASER http://fraser.stlouisfed.org/ Federal Reserve Bank of St. Louis

WORK STOPPAGESMan-days of idleness resulting from work stoppages decreased In October. No large stoppages began duringthe month.
MILLIONS OF MAN-DAYS IDLE20
MONTHLY AVERAGE
0 I I I I I I I I I I I1939 1940 1941 1942 1943 1944 1945 1946 1947 1948 1949
MILLIONS OF MAN-DAYS IDLE
20
SOURCE: DEPARTMENT OF LABOR. COUNCIL Of ECONOMIC ADVISERS
Period
193919411942194419451946194719481949
1949: SeptemberOctober _ .NovemberDecember
1950: January1
February *March1 .. ..April1...May *June *July1 ...August *September1^October1
Man-days of idlenessduring period
Monthlyaverage
(thousands)
1,4831,917
348727
3,1679,6672,8832,8424,208
6,27017, 5006,2701,350
2,6007,8503,7503, 1503,0002,7502,9002,9003, 5002,450
Percent ofestimated
working time
0.28.32.05.09.47
1.43.41.37.59
.872.49.93. 19
.381.27.49.47.40.36.41.35.48.30
Workers involved instoppages
Beginningin
period(thousands)
1, 1702,360
8402, 1203,4704,6002, 1701,9603,030
5075705746
1857580
160325260225350275180
In effectduringmonth
(thousands)
603977914417
300515530300500400400465460300
Number of stoppages
Beginningin
period
2,6134,2882,9684,9564,7504,9853,6933,4193,606
287256197170
225210260400450425425560525525
In effectduringmonth
536475388323
340325400550650650650800800800
1 Preliminary estimates. Source: Department of Labor.
12
Digitized for FRASER http://fraser.stlouisfed.org/ Federal Reserve Bank of St. Louis
PRODUCTION AND BUSINESS ACTIVITY
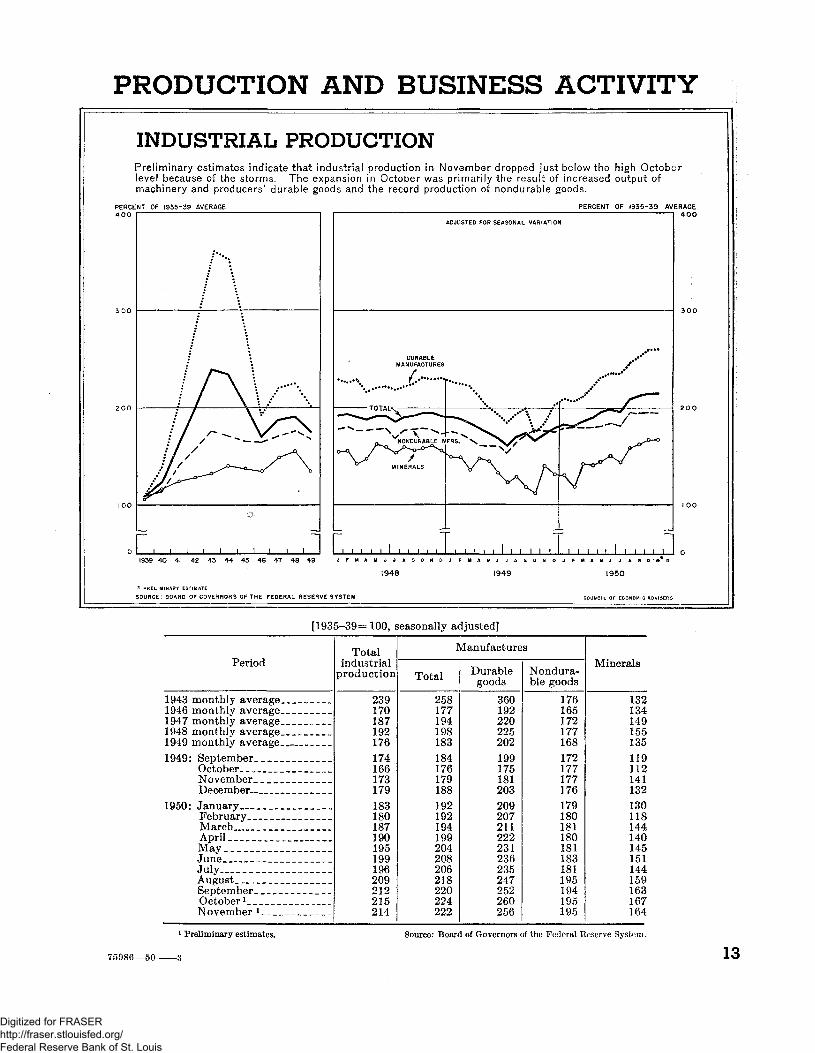
INDUSTRIAL PRODUCTIONPreliminary estimates indicate that industrial production in November dropped just below the high Octoberlevel because of the storms. The expansion in Octooer was primarily the result of increased output ofmachinery and producers' durable goods and the record production of nondurable goods.
PERCENT OF 1935-39 AVERAGE400
PERCENT OF 1935-39 AVERAGE40O
1939 4O 4i 42 43 44 45 46 47 48 49I I . . . . . , , , I , , , , .
SOURCE: BOARD OF GOVERNORS OF THE FEDERAL RESERVE SYSTEM
[1935-39=100, seasonally adjusted]
1 Preliminary estimates.
Period
1943 monthly average1946 monthly average1947 monthly average1948 monthly average-1949 monthly average -1949: September
October-November. _ „December.-
1950: JanuaryFebruaryMarchApril _ _ _ . _MavjJuneJuly .AugustSeptember-October 1 _ _ _ _November 1
Totalindustrial
production
239170187192176174166173179183180187190195199196209212215214
1
Total
258177194198183184176179188192192194199204208206218220224222
Manufacture
Durablegoods
360192220225202199175181203209207211222231236235247252260256
s
Nondura-ble goods
176165172177168172177177176179180181180181183181195194195195
Minerals
132134149155135119112141132130118144140145151144159163167164
Source: Board of Governors of the Federal Reserve System.
75986—50- 13
Digitized for FRASER http://fraser.stlouisfed.org/ Federal Reserve Bank of St. Louis

WEEKLY PRODUCTION - SELECTED INDICATORSSteel mill operations averaged 102.7 percent of rated capacity during November, breaking all previoustonnage records. Electric power production established new peaks; coal output continued at a high rate.Although assembly of cars and trucks declined because of changing models and taking inventories,production' was above last year,
MILLIONS OF TONS BILLIONS OF KILOWATT HOURS
SOURCES: AMERICAN IRON AND STEEL INSTITUTE, EDISON ELECTRIC INSTITUTE, DEPARTMENT OF THE INTERIOR, WARD'S AUTOMOTIVE .REPORTS.
Period
Weekly average:1947__ .19481949 ....
Week ended:1949: November 5
121926
December 3 _10
1950: November 4 __ _1118__ _ - -25
December 29
St
Thousands ofnet tons
1,6281,6951,496
162387
1,0581, 4421, 6171, 690
1, 9751, 9871, 9811, 9811, 5761, 938
eel
Percent oftheoreticalcapacity *
93.094. 181.0
8. 821. 057. 478. 287. 791. 7
102. 4103. 0102. 7102. 781. 7
100. 5
Electric power,by utilities(millions of
kilowatt-hours)
4,8215S 3005,500
5, 4355, 4355, 6445, 5375, 7435,881
6, 5516, 5746, 7286, 5086, 716
Bituminouscoal
(thousands ofshort tons) 8
2,0581,9481,427
4571,2132,4312, 4581, 5911, 601
1, 9021,8311, 9741, 8101,567
Cars andtrucks
(number)
92, 16382, 340
120, 350
112, 838111, 727111, 77971, 86068, 38546, 667
169, 553153, 695118, 404116, 059145, 864
i Bawd on weekly net ton capacity of 1,749,928 for 1947,1,802,476 for 1948,1,843,516 for 1949,1,906,268for the first half of 1950, and 1,928,721 beginning July 1,1950.1 Daily average for week.Sources: American Iron and Steel Institute, Edison Electric Institute, Department of the Interior, and Ward's Automotive Reports.
14
Digitized for FRASER http://fraser.stlouisfed.org/ Federal Reserve Bank of St. Louis

]1
PERC250
200
150
1OO
0
350
300
250
200
150
IOO
0
PRODUCTION OF SELECTED MANUFACTURES ~]
deduction of iron and steel and machinery climbed substantially above September levels in October; output ofDther durable goods continued strong, There was increased activity among nondurable industriesmanufacturing textiles, chemicals, and petroleum products.
IRON A
S°\ A
/Y// V1^6
W
ER
STEEL^y--nfx/Y^V.\»w/^^AND PRODUCTS*
L J L-r-r i i . i i i i i ri nTiiilm ii
A
Vjl
*-~v|1 1 1 1 1 1 1 1 1 1 1
/,--~V
1 1 1 1 i 1 i ii iT
n\^\l\f \,'\1 /',' \I 'J NONFERROUS
^ 1 1 . . i I 1 i f=
H NERYv
METALS AND PROD
Lm.nrii.LLi
\ ^Vv,
)\ r'/ % 1
,CTS %/
1 I I t 1 1 1 I i 1
40 42 44 46 48 1948 1949
/
,y//
l . l l l l l MM5
1950
E SYSTEM
250
200
150
100
0
350
300
250
200
150
100
o l
I \ PETROLE
/ V ••"»•\ /N/ V
/A ^\/ • ^»**w/|v ^/X ^"TEXTILE
/
^ i 1 1 1 i 1 1 1 1
uwoc
s
AND COALv,UCTS ^y»-^'^\f
^V>XND PRODUCTS
L~ril 1 1 1 1 n 1 1 1
K.v•v rVJJ_L1 LLt I I I 1
hy/
w
1 1 j i j i i 1 1 nn
K! \1 \
i \xCHEM
; \ / \r^i
iii1 ^**^**
c M. PRODUCTS
^^ ,A/>- T*. x^
-**«^NX*Y.i s~~*^f y| ^^ ^-MANUFACTURED FOOD/ /r PRODUCTS
* JL_ J Li i i i i i i i i n rTi i » 1 1 M 1 1 140 42 44 46 48 S948
XX
. — ^_
1 ! 1 1 1 I 1 Ii 1 1
^^^^ x~X
1 1 1 1 1 1 1 1 1 iTl1949 i950
s
[1935-39=100, seasonally adjusted]
Period
1943 monthly average.1946 monthly average-1947 monthly average-1948 monthly average.1949 monthly average. _ _ __1949: September....
OctoberNovemberDecember
1950: JanuaryFebruaryMarchAprilMayJuneJuly .....AugustSeptember.October 1 _
Durable manufactures
Iron andsteel
208150195208188179102145201203201205222226231228236245254
Lumberand
products
129131143145130132133147159144150156159158155151165165165
Machinery
- 443240276277234224226217227229236243251258262265279286300
Nonferrousand
products
267157187193160157164163166180190200198107207202212216222
Nondurable manufactures
Textilesand
products
153162163170147155169175173178179173174175173165189191194
Petroleumand coalproducts
185173193218209208198205219211205207206216222229238242247
Manufac-tured foodproducts
145149157159163167165160160161161165164164164167168168164
Chemicalproducts
384236251254241236240243245248247247252256261263267270275
i Preliminary estimates. Source: Board of Governors of the Federal Reserve System.
15
Digitized for FRASER http://fraser.stlouisfed.org/ Federal Reserve Bank of St. Louis

NEW CONSTRUCTIONExpenditures of $2.4 billion (seasonally adjusted) for new construction in November were practicallyunchanged from the October level but- were 22 percent above a year ago. Private residential nonfarmactivity continued to decline moderately from its September peak. Other private and public constructionwere above their October levels.
MILLIONS OF DOLLARS2,500
E.OOO
1,500
1,000
ADJUSTED FOR SEASONAL VARIATION
1948
PRIVATE RESIDENTIAL(NON FARM)
OTHER PRIVATE _^.
FEDERAL, STATE, AND LOCAL
MILLIONS OF DOLLARS2,500
2,000
1,500
I .OOO
1950
SOURCES: DEPARTMENT OF COMMERCE AND DEPARTMENT OF LABOR COUNCIL OF ECONOMIC ADVISERS
[Millions of dollars, seasonally adjusted]
Period
1 939 monthly average1942 monthly average1944 monthly average ._1946 monthly average1947 monthly average1948 monthly average1949 monthly average1949: October...
November ,_ .December
1950: January _„FebruaryMarch _AprilMayJuneJulyAugustSeptember.October2 _November 2
Total newconstruction
6831,173
4381,0001,3861,7981,8831, 9341,9852,0392,0682, 1272, 1672,2162,2402,2842,3192,3692,4082,4192,423
Private constructionTotal
private
366285182803
1,0941,3891,3501,3751,4281,4711,5061,6001,5791,6371,6741,7191,7721,8081,8241,8221,786
Residential(nonfarm)
22314368
335526715691752792842863956938991
1,0151,0551,0991, 1281, 1361,1101,047
Other
142142114469568674659623636629643644641646659664673680688712739
Federal,State, and
local l
317888256197291409532559557568562527588579566565547561584597637
1 Includes public residential construction.2 Preliminary estimates.Sources: Department of Commerce and Department of Labor
16
Digitized for FRASER http://fraser.stlouisfed.org/ Federal Reserve Bank of St. Louis

NEW HOUSING STARTSNew housing starts in October dropped 10 percent below the September level and, for the first time thisyear, were below the corresponding month of 1949. Credit restrictions probably contributed to the decline,
THOUSANDS OF UNITS
200THOUSANDS OF UNITS
200
SOURCE:DEPARTMENT OF LABOR
New nonfarm units startedlYiOUlll
JanuaryFebruary 1March _April .MayJune .. _JulyAugustSeptember _OctoberNovemberDecember
Total
Monthly average
1947
39 30042, 80056 00067, 10072 90077 20081 10086' 30093, 80094 00079, 70058, 800
849, 000
70 750
1948
53 50050, 10076 40099 500
100 30097, 80095 00086 70082, 30073 40063 70052, 900
931, 600
77, 600
1949
50, 00050, 40069, 40088, 30095 40095, 50096 10099, 000
102, 900104 30095, 50078, 300
1, 025, 100
85, 425
1950
78, 70082,900
117, 300133, 400149, 100144, 300144, 400
1 141, 0001115,0001 103, 000
* Preliminary estimates. Source; Department of Labor,
17
Digitized for FRASER http://fraser.stlouisfed.org/ Federal Reserve Bank of St. Louis

FOR NEW PLANTANDNonfarm plant and equipment expenditures have risen in each quarter of 1950. Businessmen reportedin November that in the first quarter of next year outlays would exceed those of any previous first quarterand show an increase of 30 percent over the first quarter of 1950.
BILLIONS OF DOLLARS25
ANNUAL TOTALS ANNUAL RATES
BILLIONS OF DOLLARS25
••£v*/••:3
1939 1941 1948 1949 2 3 41948
:: TRANSPORTATION AND':>S:
fexELEGTRIG ANDUTILITIES
MANUFACTURINGAND
MINING
;i
1 2 3 41949
2 3 4I960
SOURCES: SECURITIES AND EXCHANGE COMMISSION AND U, S. DEPARTMENT OF COMMERCE
[Millions of dollars, annual rates, not adjusted for seasonal variation]
Period
193919411945 _1948194919503
1949: First quarter .Second quarterThird quarterFourth quarter
1950: First quarterSecond quarter _.Third quarter 3_Fourth quarter 3
1951 : First quarter 3 _
Total »
5?2008, 1906,630
19, 23018, 12018, 130
17, 84018, 64017, 48018, 520
14, 80017, 32018, 76021, 640
19, 240
Manufac-turing
1,9303,4003,2108,3407, 2507,950
7,4007,5206,7607,320
6,0807,4408,200
10, 080
8,760
Mining
380680440800740690
760760720720
600640720800
680
Transportation
Railroad
280560550
1,3201, 3501,140
1,4401,5201,2401,200
9201,2001, 1201,280
1,280
Other
280340320700520430
520560560480
320360480560
600
Electric andgas utilities
480710630
2,6803, 1403,220
2,7203,1203, 1603,560
2,6003,0403,2803,960
2,960
Commercialand miscel-
laneous *
1,8502,4901,4805,3905, 1204,700
5,0405,1605,0405,280
4,2404,6404,9204,960
4,920
1 Excludes agriculture.2 Commercial and miscellaneous composed of trade, service, finance, and communication.3 Revisions for actual third and anticipated fourth quarter of 1950 and first quarter of 1951 expenditures became available after the chart was prepared.NOTE.—These figures do not agree with the totals included in the gross national product estimates of the Department of Commerce, principally because the
latter cover agricultural investment and also certain equipment and construction outlays charged to current expense. Figures for 1939-44 are Federal BeserveBoard estimates based on Securities and Exchange Commission and other data.
Detail will not necessarily add to totals because annual rates are based on quarterly figures rounded to the nearest 10,000,000*Sources: Securities and Exchange Commission and Department of Commerce (except as noted).
18
Digitized for FRASER http://fraser.stlouisfed.org/ Federal Reserve Bank of St. Louis

NEW CORPORATE INet proceeds from new security issues showed a large seasonal decline in 3rd quarter of the year. Aboutf of the total for financing expansion in and working capital- the remainder for retirement ofand stock.
BILLIONS OF DOLLARS3...0
BILLIONS OF DOLLARS3,0
f . O
SOURCE: SECURITIES AND EXCHANGE COMMISSION.
[Millions of dollars]
Period
1939 quarterly average - ~1943 Quarterly average -~» - - -1946 quarterly average . ___ . . , _1947 quarterly average - •1948 quarterly average— - ~ .. . -1949 quarterly average1948' Third quarter - _ _ _ _ . -
Fourth, quarter - - _-. , - ~ ~1949' First quarter . . . - _ „ _
Second quarter . ~. , -Third quarter - -. ~-Fourth quarter .
1950: First quarter - --Second quarter - .Third quarter 2 -
Estimatednet
cecds
529287
1,6891, 6171, 7401?4901, 3212, 0511, 2102 ?4411,0091?2991,3982, 1931, 120
]
Total
8177
8201, 1481, 4821, 1511, 056I, 870
9701, 986
788861
1,0143, 275
742
3roposed
New money
Plant andequipment
4335
529852
1, 055931743
1, 469784
1?675669596777958577
of net proceed
Workingcapital
3942
291296428221314401186312120265237317165
i
Retirementof debt and
stock l
448210869469258338264182240456219438384918379
* Includes small amount for other purposes.3 Preliminary estimates.NOTs.—Detail will not necessarily add to totals ofSource: Securities and Exchange Commissions
19
Digitized for FRASER http://fraser.stlouisfed.org/ Federal Reserve Bank of St. Louis

orderSj inventories, all substantially.'
BILLIONS OF DOLLARS
60TOTAL* AND
MONTHLY AVERAGE
I1.
SEASONALLY ADJUSTED
. X,,jf ** *'
TOTAL INVENTORIES*^"^
,LLLJJJ
BILLIONS OF DOLLARS
20MONTHLY AVERAGE
40 42 44 46 48
MONTHLY AVERAGE
42 44 46 48
•£• WHOLESALE, MANUFACTURIWC, AND RETA5L
I960 40 42 44 46 48
level. Manufacturer's new
RETAIL
SEASONALLY ADJUSTED
^-INVENTORIES x
.• 'f .-...X
JLlJJjJjJ_LLL
y- SALES
1 I 1 1 1 1 1 1 i 1 1
^—^-
1 II 1 1 1 1 1 1 1 11948 1949 - 1950
AVERAGE
DEPARTMENT STORES
SEASONALLY ADJUSTED
.. ~fES /\
INV
JJJLIlJ-LLLLL
^C^^^ENTORIES*^
1 1 ! 1 ! 1 1 1 1 I I
s</K /
1 1 1 1 1 1 1 1 1 1 11948 1949 1950
COUNCIL OF ECONOMIC ADVISERS
Period
19391943..19451946..194719481949.1949: September ....
OctoberNovember - _December
1950: JanuaryFebruary.MarchApril.May ....JuneJulyAugust 7_September 7
October 7 _ _
Total business 1
Inven-tories f
8
Manufacturing
Inven-tories 2 Sales1 New
orders 4
Retail
Inven-tories * Sales •
Millions of dollars^ seasonally adjusted 4
20, 17231, 14330, 57142, 38950, 79456, 75651, 59452, 86152, 53552, 10551, 59452, 00351, 79652, 44852, 83753, 45654, 11753, 11954, 37456, 26358, 130
11, 10922, 37224, 18127, 55933, 57137, 02334, 88635, 99533, 59634, 40433, 50534, 24435, 30536, 59935, 64538, 652395 89641, 80545, 08541, 95041, 798
11,46520, 09818, 39024, 49828, 92032, 27628, 86529, 32028, 92328, 65628, 86529, 01428, 96129, 03729, 31529, 56229, 90429, 70629, 73630, 59431, 400
5, 10012.82212, 88312, 61715, 91817,81116, 66617, 62115, 79816, 22115, 75616,21616, 87717, 79717, 20619, 30919, 83820, 09222,61320, 96521, 200
(«)(8)(fl)
13, 69415, 62217, 50416, 10218, 17217, 15116, 86816, 00917, 03216, 86118, 81017, 18219, 09720, 66622, 04627, 13423, 581
* 24, 600
5,5327,3617, 543
11, 22613, 22114, 96913, 69814, 35514, 47514, 33613, 69813, 99813, 80014, 28214, 13814,41614, 72014, 12515, 07615, 79316, 548
3,5045,2776,3158,3589,909
10, 83710, 68210, 85610, 67810, 63010, 50310, 85511, 10111, 12511, 08011, 32711,69912, 70012, 68212, 13011,760
Department stores
Inven-tories 5 Sales *
1935-39=100, season-ally adjusted
102155166213255291270263270273271272279285286285276268284309328
106168207264286302285289276277293282280274292290298362335320292
1 Total business includes manufacturing, retail, and wholesale (not shownseparately in this table).
2 Book value, end of period.' Monthly average for year and total for month.4 Data for new orders not adjusted for seasonai variation.
1 Indeies computed from data on retail value of sales for month and retailbook value of inventories, end of period.
• Not available.* Preliminary estimates.
20 Department of and of Oovemors erf thi Federal Beserve
Digitized for FRASER http://fraser.stlouisfed.org/ Federal Reserve Bank of St. Louis

MERCHANDISE EXPORTSIn October, merchandise imports rose to a new high of $921 million, 67.percent above the 1949monthly average. As in August, they slightly exceeded exports, which remained virtually unchangedin October after having increased greatly in September.
MILLIONS OF DOLLARS1,600
1,200
MILLIONS OF DOLLARS,600
1936-38 1946 1947 1948 1949
SOURCES' DEPARTMENT OF COMMERCE, DEPARTMENT OF THE ARMY, AND DEPARTMENT OP THE HAVY. COUHCIL Or ECONOMIC ADVISEf
of
Period
1936—38 monthly average . . .. ....... ......1943 monthly average1946 monthly average . . - . . . .1947 monthly average .. - ... ... ...--.1948 monthly average1949 monthly average - .1 949 : September
October -November _ . . .December « . -
1950* January ..February . .March.. .April .. -..-.MayJune_ .Julv . . . . .... - ........ ..AugustSeptemberOctober 3
J
24?1,080
8491,2781, 0541SGG3
910853841944743770864806828876774763911904
Imports f
207282410480594555530557593605623600664583659685707820857921
Kxcess ofexports
4079843979946144837929624833912017020022316919167
— 575317
1 Recorded merchandise exports, including reexports, and civilian supplies for occupied areas,2 Recorded general merchandise imports.8 Data became available after chart was prepared.NOTE: Detail will not necessarily add to totals because of rounding.Sources: Department of Commerce, Department of the Army, and Department of the Navy.
21
Digitized for FRASER http://fraser.stlouisfed.org/ Federal Reserve Bank of St. Louis

POWER
The increase of over $IO'/4 billion (annual In national income 2nd and 3rd quarters was thelargest quarterly gain, dollar-wise, on record. Percentage-wise, the increase was more than 4l/2 percent,or about the same as between the first two quarters of 1948.
BILLIONS OF DOLLARS250
BILLIONS OF DOLL
:;•:•::;•;:::;:::CORPORATE PROFITS AND:'•'-•-•rfrW:!:;:;INVENTORY VALUATION:':'
195!
SOURCE:DEPARTMENT OF COMMERCE (EXCEPT AS NOTED).
[Billions of
Period
1939 ~-_1944 _ - _ _1946 _ _ . _1947 -19481949 - _
1949: First quarterSecond quarterThird quarterFourth quarter
1950: First quarterSecond quarterThird quarter
Totalnationalincome
72. 5183.8180.3198.7223.5216.8
Compensa-tion of
employees
47,8121. 2117. 1
: 128, 0140. 2140.6
Proprietors1
(business,professional^
farm)
income
14735.542. 042. 447.341.7
Net
4. 23. )2. 93, 54 1
. 4.7
Corporate profits and inventoryvaluation adjustment
5.824018.324 731.829.9
Profitsbeforetaxes
6.524323. 530.533.927.6
Inventoryvaluation
adjustment
-0.7-».3
-5.2-5.8-2.0+ 2.2
Annual rates, seasonally adjusted
218. 8217. 8216. 7214 2
216. 9229. 1
1 239. 7
141. 5140.5140.0140. 2
142. 3147. 9155. 2
43.842. 240. 140.7
41.541. 245.4
464 74848
5.05.05.0
28. 830. 431.828.4
28.235. 0
*34 1
28. 326.4
i 28.227. 6
29. 237. 4
!42.0
+.5+ 3.9+3.7+.8
-1.0-2.3-7.9
i Estimates by Council of Economic Advisers; based on incomplete data.NOTE.—Detail will not necessarily add to totals because of rounding.Source: Department of Commerce (except as notecQ.
22
Digitized for FRASER http://fraser.stlouisfed.org/ Federal Reserve Bank of St. Louis

CORPORATE PROFITSEstimated corporate profits for both 2nd and 3rd quarters of I960 have been revised upward by about$2 billion (seasonally adjusted annual rates). Despite the high corporate tax liability, at an annual rateof $17.6 billion in 3rd quarter, 67 percent higher than in 1949, profits after taxes were also running atan all-time high. Both dividends and undistributed profits benefited in the increase.
BILLIONS OF DOLLARS BILLIONS OF DOLLARS40
ANNUAL RATES, SEASONALLY ADJUSTED^
SOURCE: DEPARTMENT OF COMMERCE {EXCEPT AS NOTED)
[Billions of dollars]
Period
193919441946194719481949
1949: First quarter. .Second quarterThird quarterFourth quarter
1950: First quarterSecond quarterThird quarter * _ _ _ _
Corporateprofits
before
6.524. 323.530.533.927.6
Corporatetax
liability
1.513. 59.6
11. 913.010. 6
Corporate profits after
Total
5.010.813. 918.520.917.0
Dividendpayments
3.84.75.86.67.57.8
Undistributedprofits
1.26. 18. 1
12.013.49.2
Annual rates, seasonally adjusted
28.326.428. 227. 6
29. 237.442.0
10.910.010.810. 6
12. 015. 117.6
17.416.417. 316.9
17.222.224.4
7.97.77.48.2
8. 18.29. 4
9.58.7
10.08.7
9. 114.015.0
1 Estimates by Council of Economic Advisers; based on incomplete data.NOTE.—No allowance has been made for inventory valuation adjustment. See p. 22 for profits before taxes and inventory valuation
adjustmentDetail will not necessarily add to totals because of rounding.Source: Department of Commerce (except as noted).
23
Digitized for FRASER http://fraser.stlouisfed.org/ Federal Reserve Bank of St. Louis

IMCOMEPersonal income continued to increase in October due primarily to further advances in wages and salariesand a gain in farm income. Transfer payments also rose as Old Age and Survisors1 Insurance benefits wereincreased under the new Social Security Act. Dividends dropped.
BILLIONS OF DOLLARS BILLIONS OF DOLLARS
ANNUAL RATES, SEASONALLY ADJUSTED
ESS, PROFESSIONAL, AND RENTAL INCOME
^
;•;-;• ".-FARM PROPRIETORS'INCOME.>>>':><
!939 1944 1348 1949 I960 J A S O N D J F M A M J J A S O N D J F M A M J J A S O N D J F M A M J
SOURCE:'DEPARTMENT OF COMMERCE.
[Billions of dollars]
Period
1939194419471948 . _ .1949
1949: SeptemberOctoberNovemberDecember
1950: JanuaryFebruaryMarch.April _MayJuneJulyAugustSeptemberOctober2
Total per-sonal income
72. 6165.9191. 0209. 5206. 1
Labor income(salaries,
wages, andother labor
income)
45.6116. 2122. 3135. 0134.9
Proprietors' income
Farm
4.511.815. 617.713.4
Business,professional,and rental
income
10.223.726.829.628.3
Dividendsand personal
interest
9.210.614.516. 117.2
Transferpayments
3.03.6
11.811.212.3
Annual rates, seasonally adjusted203.4202. 4205. 7208.4214. 6215. 4219.3213. 8214. 5217. 1220.7225.4228.7230. 1
134. 6133.3134.4136. 0135.2134. 5136. 9138.6141. 1143.6145. 1148.9151.2153. 4
11. 612. 113. 612. 714.612. 311.411.012. 112. 113.613.713.313. 9
27.727.728. 127.928.928. 728. 828.829.430. 231.932.431.731.7
17.017.217.218.917. 517. 7.18. 018.217.817.817.818.421.119. 1
12.612. 112.412.9
*18.4122. 2124.2i 17.2114. 11 13. 412.312.011.412.0
24
1 Inchides veterans' insurance dividend. During first quarter, the payment was at annual rate of $8.5 billion (or $2.1 billion, quarterly total)and during second quarter at $2.0 billion (or $502 million, quarterly total).2 Preliminary estimates.
NOTE.—Detail will not necessarily add to totals because of rounding.Souree: Department of Commerce.
Digitized for FRASER http://fraser.stlouisfed.org/ Federal Reserve Bank of St. Louis

CONSUMER INCOME, SPENDING, AND SAVINGConsumption expenditures rose more rapidly than incomes in 3rd quarter, resulting in a drop in saving.
SILL10NS OF DOLLARS BILLIONS OF DOLLARS2 S O
CONSUMPTION EXPENDITURESxxxxxxxxxxxxxxxxxxx
OF ECONOMIC ftOVISERS
Period
1939-194119421944.19461947-19481949.
1949:
1950:
First quarterSecond quarter - -Third quarterFourth quarter
First quarterSecond quarter .Third quarter _ _
Disposablepersonalincome l
Less: Personalconsumptionexpenditures
Equals: Per-sonal net
saving
Billions of dollars70.292.0
116.7147.0158. 9169. 5188.4187.4
67.582.391.2
111. 6146. 9165. 6177. 4178.8
2. 79.8
25. 635. 412. 03. 9
10. 98. 6
Net saving aspercent of dis-posable income
3.810.721.924. 17.62. 35.84. 6
Annual rates, seasonally adjusted189. 9188.2185. 1186.8
197. 5195.6204.7
177.4178.4179.0180. 6
182.4185.2198.4
12. 59. 86.26.2
15. 010. 46.4
6. 65.23.33.3
7.65.33. 1
*Income less taxes.NotB .—Detail will not necessarily add to totals because of rounding.Souree; Dtpartment of Commerce.
25
Digitized for FRASER http://fraser.stlouisfed.org/ Federal Reserve Bank of St. Louis

PERSONAL CONSUMPTION EXPENDITURESConsumption expenditures rose $13 billion (annual rate) from 2nd to 3rd quarter. Expenditures for
'durable goods 25 percent above the high levels of first: half of this year. Expenditures fornondurable goods and services also reached new highs.
BILLIONS OF DOLLARS B I L L I O N S OF D O L L A R S
ANNUAL RATES, SEASONALLY ADJUS
TOTAL EXPENDITURES
1939 1944 1948 1949 1950
SOURCE: DEPARTMENT OF COMMERCE
[Billions of dollars]
Period
1939-1944_1946-1947-1948.1949-
1949:
1950:
First quarter..Second quarterThird quarter .Fourth quarterFirst quarterSecond quarterThird quarter
Personal consumption expenditures
Total
67.5111.6146.9165.6177.4178.8
Nondurablegoods
35.367. 185. 895. 1
100.998.5
Durablegoods
6. 77. 1
16.621.422. 923.8
Services
25.537.444. 549. 153.756.4
Annual rates, seasonally adjusted
177.4178.4179.0180. 6182.4185.2198.4
99.499.297.697.997.499.3
104.9
22.423.024.725.326. 926.733. 5
55.656.256. 657.458. 159.259.9
NOTE.—Detail will not necessarily add to totals because of rounding.Source: Department of Commerce.
26
Digitized for FRASER http://fraser.stlouisfed.org/ Federal Reserve Bank of St. Louis

PER CAPITA DISPOSABLE INCOME*Per capita disposable income gained l-| percent in terms of purchasing power between the 2nd and 3rdquarters.
DOLLARS1,600
DOLLARS1,600
S.EOO
ANNUAL AVERAGES
1949 DOLLARS-*'
I, 200
CURRENT DOLLARS
1948
2 31949
2 3I960
I 21951
SOURCES : DEPARTMENT OF COMMERCE AND DEPARTMENT OF LABOR
Period
1939 -_ „1941 _ . _1942 . . .. . . . .1944 . .1946 ._ ,..19471948 ..1949
1949: First quarter .* .Second quarter . .Third quarter „ _ _Fourth quarter..
1950: First quarter „ _Second quarter..Third quarter
Per capita disposable personalincome l
Currentdollars
$536691867
1,0651,1251,1771,2851,256
1949 dollars 2
$9121, 1101,2471,3881,3331,2481,2701, 256
Annual rates, seasonallyadjusted
$1, 2801,2641,2371,243
1,3091,2911.345
$1, 2751,2611,2391, 249
1,3271,2941,314
Consumers *price index2
1949 = 100
58.862. 269.576.784.494.3
101. 2100.0
Not adjustedfor seasonal
variation
100. 4100.299. 999.5
98.699. 8
102.4
i Income less taxes.* Current dollars dMded by the consumers' price index on the base 1949=100.1 The consumers' price index has been roughly adjusted to take account of the understatement from December 1941-Febraary 1947,
adjustment is in line with the report of the Mitchell Committee. The unadjusted index will be found on page 3.Sources: Department of Commerce and Department of Labor.
This
27
Digitized for FRASER http://fraser.stlouisfed.org/ Federal Reserve Bank of St. Louis

FARM INCOMEFarm income in October was 6 percent higher than in October 1949. With prices paid alsoincreasing 6 percent, the purchasing power of farm income was about the same as in 1949.
BILLIONS OF DOLLARS
MONTHLY AVERAGE
1949 DOLLARS*
I I I I I ' 1 I
BILLIONS OP DOLkAJtt4
1940 41 42 43 44 45 46 4? 48 49 50
•INCLUDES CASH FARM INCOME FROM MARKETING**FARM INCOME IN CURRENT DOLLARS DIVIDED BY
SOURCE: DEPARTMENT OF AGRICULTURE. COUNCIL OF ECONOMIC ADVISERS
Period
1939 monthly average1941 monthly average -1942 monthly average . - - - -1944 monthly average - - - - - -1946 monthly average - - -1947 monthly average - - - - - - - -1948 monthly average - -1949 monthly average . - -1949: September ..
OctoberNovember-.December ,.
1950: January . .. ......February . . . . - -March ..April .Mav _^«j ,June _July _AugustSeptember *» .October *.. _ .
Farm income(millions of
currentdollars) »
724981
1,3391,7642, 1362,5272,5672,3592,9293,3662,905
%2, 4732,2541, 6141,6741,5941,8191,8592,3562,5512,9133,580
Prices paid byfarmers (incl.interest, taxes,
and wage rates)1949= 100 2
495361738396
10410099989898
10099
100100102102102103104104
Farm income(millions of
1949 dollars) »
1,4781,8512, 1952,4162.5732,6322,4682,3592,9593,4352,9642,5232,2541,6301,6741,5941,7831,8232,3102,4772,8013,442
28
1 Includes cash farm income from marketings and Government payments.2 Converted from the reported base, 1910-14=100, to the base 1949=100.s Farm income in current dollars divided by prices paid by fanners, interest, taxes, and wage rates, 1949»100.* Preliminary estimates.Source: Department of Agriculture.
Digitized for FRASER http://fraser.stlouisfed.org/ Federal Reserve Bank of St. Louis

CONSUMER CREDITConsumer credit expanded slightly in October. Instalment credit, which had paced the growth in precedingmonths, rose only $42 million, largely because of the impact of Regulation W and th« decline inanticipatory buying. The increase in instalment credit was the smallest since the usual January decline.
BILLIONS OF DOLLARS25
BILLIONS OF DOLLARS25
SOURCE : BOARD OF GOVERNORS OF THE FEDERAL RESERVE SYSTEM COUNCIL OF ECONOMIC ADVISERS
[Millions of dollars]
End of period
193919431946 -194719481949.1949: September .
October . _ _NovemberDecember. .
1950: JanuaryFebruary ... ....MarchAprilMayJuneJulyAugustSeptemberOctober 2 1
Totalconsumer
creditoutstanding
7,0314,6008,677
11,86214, 36616, 80914, 95715, 33615, 88416, 809
16, 36816, 15916, 33816, 63917, 07717, 65118, 29518, 84219,31519, 366
Instalment credit
Total
4,4242,0014,0006,4348,600
10, 8909,899
10, 16610,44110, 890
10, 83610, 88411,07711,32211,66712, 10512, 59813, 00913, 33713. 379
Automobilesale
credit
1,267175544
1,1511,9613, 1442,8762,9863,0853, 144
3, 1793,2563,3553,4703,6003,7903, 9944,1074,2134,231
Other salecredit and
loans
3, 1571,8263,4565,2836,6397,7467,0237,1807,3567, 746
7,6577,6287,7227,8528,0678,3158,6048,9029, 1249,148
Chargeaccounts
1,5441,4983,0543,6123,8543,9093, 1233, 1973,4543,909
3,5063,2333,2113,2413,2903,3923,5273,6363,7413,703
Otherconsumercredit *
1,0631,1011,6231,8161,9122,0101,9351,9731,9892,010
2,0262,0422,0502,0762,1202, 1542,1702,1972, 2372.284
i Other consumer credit includes single-payment loans under $3,000 made by commercial banks and pawnbrokers and service credit. The single-paymentloan item was revised in November to exclude loans over $3,000. See Federal Eeserve Bulletin for November 1950, pages 1465-6. 3 Preliminary estimates
NOTE.—Detail will not necessarily add to totals because of rounding.Source: Board of Governors of the Federal Eeserve System. OQ
Digitized for FRASER http://fraser.stlouisfed.org/ Federal Reserve Bank of St. Louis

MONEY, BANKING, AND FEDERAL FINANCE
BANK LOANS AND INVESTMENTSCommercial bank loans expanded in October but at a much lower rate than in September. There was nochange in investment total.
BILLIONS OF DOLLARS150
BILLIONS OF DOLLARS150
1939 1943 1943 1949 J F M A M J J A S O N O J F M A M J J A S O N O J F M A M J j A S O N O
END OF YEAR 1948 1949 1950
END OF MONTH
SOURCE : BOARD OF GOVERNORS OF THE FEDERAL RESERVE SYSTEM COUNCIL OF ECONOMIC ADVISERS
[Billions of dollars, all commercial banks]
End of period
...1945- . ... .1947. -1948-1949 ... - .. __1949: September
October . _November . ..December
1950: JanuaryFebruaryMarch .AprilMay . . .June-JulyAugust . .September .October1
m_.A_ilotailoans and
investments
40.7124. 0116.3114. 3120.2118. 5119. 5119. 7120.2121.2120.6120.3120. 3121.2121. 8122. 3123.3123.7124 5
Bank loans
17.226. 138. 142.543.041.741.842.743.042.943. 143. 743. 844. 144. 846.047.349.049.9
Total
23.497.978.271.877.276.877.777.077.278. 377.576.676.577. 177.076.376.074.674.6
InvestmentsU.S.
Governmentsecurities
16.390.669.262.667.066. 767.666.967. 068.067.165.865.566.165. 865.064. 262. 5
• . 62.5
Othersecurities
7.17.39.09.2
10.210.210. 110. 110. 210.310.410.811.011. 011.211.411.812. 112.1
* Preliminary estimates.NOTE.—Detail will not necessarily add to totals because of rounding.Source: Board of Governors of the Federal Beserre System.
30
Digitized for FRASER http://fraser.stlouisfed.org/ Federal Reserve Bank of St. Louis

MONEY SUPPLYThe privately-held money supply increased $ 1.3 billion during October, Demand deposits rose sharply. Thedecline in time deposits, that started in July, subsided.
BILLIONS OF DOLLARS200
BILLIONS OF DOLLARS200
TOTAL DEPOSITS AND CURRENCY
(EXCLUDING U.S. GOVERNMENT DEPOSITS)
1939 1943 1948 1949
END OF YEAR
SOURCE: BOARD OF GOVERNORS OF THE FEDERAL RESERVE SYSTEM.
1949
END OF MONTH
1950
[Billions of dollars]
End of period
1939 .. _1943 . :...1946 -1947 _1948- -19491949 : September
OctoberNovemberDecember . .. .
1950: JanuaryFebruary . ....March .. .. - -AprilMay - -
. June - - -July
, August'September ... --- October 3 » -
Total pri-vately-held
money supply
63.3112.4164.0170.0169. 1169. 8166. 3167. 7168. 1169.8169.7168. 2167. 1168. 4169.2170. 0170. 2171. 0171.7173. 0
Currencyoutsidebanks
6. 418.826. 726. 526. 125.424. 924. 925. I25.424. 524. 724.624.624. 725. 224. 424. 524.524.6
Adjusteddemand
deposits *
29. 860. 883. 387. 185. 585. 883. 184 385. 085. 886.484. 583. 384.385.085. 086. 587. 488. 189.4
Timedeposits *
27. 132. 754. 056. 457. 558 658 458 458 058 658. 759 059 359. 559 559. 759. 459 159. 059. 0
i Includes demand deposits, other than interbank and U, S. Government, less cash items in process of collection.* Includes deposits in commercial banks, mutual savings banks, and Postal Savings System.s Preliminary estimates.Source: Board of Governors of the Federal Reserve System. NOTE.—Detail will not necessarily add to totals because of rounding.
31
Digitized for FRASER http://fraser.stlouisfed.org/ Federal Reserve Bank of St. Louis

FEDERAL CASH RECEIPTS FROMAND PAYMENTS TO THE PUBLICIn 3rd quarter of I960, cash payments to the public were $1.1 billion smaller than receipts. In thecorresponding quarter of 1949 payments exceeded receipts by $386 million.
BILLIONS OF DOLLARS BILLIONS OF DOLLARS
XCASH RECEIPTS
_ CASH PAYMENTS
J,
»
2 IQ47 3 4 2 IQ/S.Q 3 4 2 ,949 3 4
''/'.
EXCESS OF CASH RECEIPTS
LJ *"**'EXCESS OF CASH PAYMENTS
i%w^ m mr u I
1 " PI .
11949 '
C A L E N D A R Y E A R S
SOURCE: BUREAU OF THE BUDGET AND TREASURY DEPARTMENT.
[Millions of dollars]
Calendar years
Calendar year total:1946 .1947 .19481949
Quarterly total, not adjusted for seasonal:1947: Third quarter .. _ _
Fourth quarter
1948: First quarterSecond quarterThird quarter » „ _ . .-Fourth quarter
1949: First quarterSecond quarterThird quarter _.Fourth quarter -
1950: First quarter...Second quarter «,Third quarter *_
Federal cashreceipts from
the public
41, 45144, 28244, 92241, 346
10, 2209,869
15, 03710, 23910, 0859,560
13, 1228,814
10, 1439,267
12, 2359,303
10, 494
Federal cashpayments tothe public
41, 39938, 61636, 89742, 642
10, 2888,536
8,6419,0338,735
10, 488
9,96411, 38910, 52810, 762
10, 76011, 1059,351
Excess of re-ceipts (+) orpayments (— )
4-524-5, 66648,027-1,295
-674-1,332
4-6, 399+ 1,205+ 1,349
-926
+ 3, 159-2, 574
-386-1,495
+ 1,475-1,803+ 1,143
1 Preliminary estimates based on incomplete data.Sources: Treasury Department and Bureau of the Budget.
NOTE.—Detail will not necessarily add to totals because of rounding.
32For sale by the Superintendent of Documents, U. S. Government Printing Office, Washington 25, D. C.
Price 15 cents per copy; $1.75 per year; $2.25 foreign
Digitized for FRASER http://fraser.stlouisfed.org/ Federal Reserve Bank of St. Louis


![Economic Indicators: May 1979 - FRASER · JOINT RESOLUTION fS J. Res. S5] To print the monthly publication entitled ''Economic Indicators" Resolved by the Senate and House of Representatives](https://static.fdocuments.in/doc/165x107/5ea121ad7826b77be3544d0e/economic-indicators-may-1979-fraser-joint-resolution-fs-j-res-s5-to-print.jpg)