Economic Impacts of Sanitation in Indonesia - wsp.org · the economic and social impacts of...
94
Economic Impacts of Sanitation in Indonesia A five-country study conducted in Cambodia, Indonesia, Lao PDR, the Philippines, and Vietnam under the Economics of Sanitation Initiative (ESI) Research Report August 2008
Transcript of Economic Impacts of Sanitation in Indonesia - wsp.org · the economic and social impacts of...

Economic Impacts of Sanitation in IndonesiaA five-country study conducted in Cambodia, Indonesia, Lao PDR, the Philippines, and Vietnam under the Economics of Sanitation Initiative (ESI)
Research Report August 2008
Water and Sanitation ProgramEast Asia and the Pacifi c (WSP-EAP)World Bank Offi ce JakartaIndonesia Stock Exchange Building Tower II/13th Fl.Jl. Jend. Sudirman Kav. 52-53Jakarta 12190 IndonesiaTel: (62-21) 5299-3003Fax: (62-21) 5299-3004
Printed in 2008.The volume is a product of World Bank staff and consultants. The fi ndings, interpretations, and conclusions expressed herein do not necessarily refl ect the views of the Board of Executive Directors of the World Bank or the governments they represent.The World Bank does not guarantee the accuracy of the data included in this work. The boundaries, colors, denominations, and other information shown on any map in this work do not imply any judgment on the part of the World Bank concerning
the legal status of any territory or the endorsement of acceptance of such boundaries.
Research Report August 2008
Economic Impacts of Sanitation in IndonesiaA fi ve-country study conducted in Cambodia, Indonesia, Lao PDR, the Philippines, and Vietnam under the Economics of Sanitation Initiative (ESI)
EXECUTIVE SUMMARY
1Economic Impacts of Sanitation in Indonesia
A five-country study conducted in Cambodia, Indonesia, Lao PDR, the Philippines, and Vietnam under the Economics of Sanitation Initiative (ESI)
Executive SummaryAt 55% in 2004, sanitation coverage in Indonesia is below the regional average for Southeast Asian countries of 67%. Nationwide, sanitation coverage has increased by 9 percentage points since 1990, representing signifi cant progress towards the target of 73% set by the Millennium Development Goal joint water supply and sanitation target. However, at current trends Indonesia will fall short of the MDG sanitation target by 10 percentage points, equivalent to 25 million people. The Government of Indonesia recognizes that in terms of providing adequate water supply and sanitation facilities, it is facing a “…losing battle in keeping up with the population increase”.
This study shows that the high number of people living with unimproved household sanitation is imposing large fi nancial and economic costs to the Indonesian economy, not only to private individuals but also to the public and commercial sectors. The results of this study support the need for greater investment in water and sanitation infrastructure and in promoting improved hygiene practices. The results will be of interest to national policy makers, local authorities, civil advocacy groups, universities and donor agencies.
Unimproved sanitation and hygiene have a wide array of impacts, which can be categorized into impacts on: health, water-related activities, the external environment, life choices, population preferences, and tourism. For Indonesia, impacts are evaluated for all these categories since they are all important at the national level. The study is based on information from national and provincial data and surveys, smaller scale research studies, and consultations with experts.
In 2006, Indonesia lost an estimated IDR 56 trillion (USD 6.3 billion) due to poor sanitation and hygiene, equivalent to approximately 2.3% of gross domestic product (GDP). Figure A shows overall economic losses by impact type.
At IDR 275,000 (USD 31.10) annually in urban areas, per capita costs of poor sanitation and hygiene were estimated to be higher than in rural areas at IDR 224,000 (USD 25.40); however, signifi cantly more people still do not have access to improved sanitation in rural areas.
Of the impacts evaluated, health and water resources contribute most to the overall economic losses estimated in the study. These impacts are expected to cause fi nancial losses to populations, as shown in Figure A, who have to pay for health services or who pay more to access clean water supplies, or who may lose income due to poor health.
Poor sanitation, including hygiene, causes at least 120 million disease episodes and 50,000 premature deaths annually. The resulting economic impact is more than IDR 29 trillion (USD 3.3 billion) per year. Poor sanitation also contributes signifi cantly to water pollution—adding to the cost of safe water for households, and reducing the production of fi sh in rivers and lakes. The associated economic costs of polluted water attributed to poor sanitation exceed IDR 13 trillion (USD 1.5 billion) per year. Poor sanitation also contributes up to IDR 11 trillion (USD 1.2 billion) per year in population welfare losses (due to additional time required to access unimproved sanitation), IDR 1.5 trillion (USD 166 million) per year in tourism losses, and IDR 0.9 trillion (USD 96 million) in environmental losses due to loss of productive land. A number of intangible eff ects, relating to the population’s preferences for a safe, convenient and private place to defecate, were not quantifi ed in this study but are known to infl uence population behavior and overall welfare.
EXECUTIVE SUMMARY
2Economic Impacts of Sanitation in IndonesiaA five-country study conducted in Cambodia, Indonesia, Lao PDR, the Philippines, and Vietnam under the Economics of Sanitation Initiative (ESI)
Figure A. Economic and fi nancial impacts of poor sanitation (IDR trillion)
29.5
13.3
0.8 1.5
10.8
56.0
2.7
8.0 10.7
0
10
20
30
40
50
60
Health Water Environment Tourism Otherwelfare
TOTAL
Econ
omic
loss
es (I
DR
trill
ion)
Financial losses
Economic losses
With the universal implementation of improved sanitation and hygiene, it is assumed that all the attributed impacts shown in Figure A would be mitigated, except for health impacts, for which up to 45% of the estimated losses would be mitigated.
Figure B shows the gains according to diff erent components of sanitation improvement. The overall economic saving would be IDR 40 trillion (USD 4.5 billion) annually. In addition, the implementation of ecological sanitation approaches (biogas and fertilizer) in 900,000 households would be worth an estimated IDR 0.6 trillion (USD 67 million) annually; and input markets generated from improved sanitation and hygiene—corresponding to 2.3 million households reached per year to attain the sanitation MDG target—could be worth an estimated IDR 5.3 trillion (USD 600 million) per year, generating jobs and revenue for the private sector.
Figure B. Economic gains resulting from improvement in sanitation (IDR billion)
0
2000
4000
6000
8000
10000
12000
14000
16000
Latrine time access
Toilet systemand hygiene
practices
Waterresource
protection
Solid wastemanagement
Waste re -use Improvedtourist
facilities
Sanitation &hygiene input
markets
Econ
omic
gai
ns (I
DR
bill
ion)
EXECUTIVE SUMMARY
3Economic Impacts of Sanitation in Indonesia
A five-country study conducted in Cambodia, Indonesia, Lao PDR, the Philippines, and Vietnam under the Economics of Sanitation Initiative (ESI)
This is the fi rst study in Indonesia to compile economic evidence on a range of impacts of poor sanitation and hygiene. The results indicate that poor sanitation and hygiene have signifi cant fi nancial and economic costs, with major implications for the socio-economic development of Indonesia and the attainment of short-, medium- and long-term development goals. The study highlights the links between improved sanitation and several other MDG targets, including poverty, hunger reduction, gender equality, child health, access to safe drinking water, and the quality of life of slum-dwellers.
The study demonstrates that poor sanitation aff ects everyone, but especially the poor and vulnerable, including children, women, the disabled and senior citizens. Hence, sanitation should receive greater attention from all levels of Indonesian government, and from development partners, the private sector and households. Decision makers should act now, and in a concerted way, to stimulate demand for improved sanitation and hygiene practices, at the same time increasing the opportunities for households to satisfy their demand.
FOREWORD
4Economic Impacts of Sanitation in IndonesiaA five-country study conducted in Cambodia, Indonesia, Lao PDR, the Philippines, and Vietnam under the Economics of Sanitation Initiative (ESI)
ForewordIndonesia, like other countries of Southeast Asia, is on a development path that is lifting large numbers of people out of poverty, and the economy is now growing at over 5% per annum. As well as economic growth, populations demand improved quality of life through improved health, housing, access to welfare services, and living environments. However, in a world of multiple government and donor priorities, some aspects of development remain neglected.
Sanitation is one such neglected aspect of development. Among the many priorities of households as well as governments, it is often pushed down the agenda, and left as an issue to be dealt with by someone else, or not at all. Indeed, without information on the link between sanitation and economic development, it is hardly surprising that sanitation is sidelined.
If governments and households are to be convinced that expenditure on improving sanitation is worthwhile, stronger evidence is needed to better understand the various impacts of poor sanitation: on health, the environment, population welfare, and, ultimately, on economic indicators.
Based on this premise, the World Bank’s Water and Sanitation Program (WSP) in East Asia and the Pacifi c (WSP-EAP) is leading the ‘Economics of Sanitation Initiative’ (ESI) to compile existing evidence and to generate new evidence on socio-economic aspects of sanitation. The ultimate aim of the ESI is to assist decision makers at various levels to make informed choices on sanitation policies and resource allocations.
The fi rst major activity of the Economics of Sanitation Initiative was to conduct a ‘sanitation impact’ study, to examine the economic and social impacts of unimproved sanitation on the populations and economies of Southeast Asia, as well as the potential economic benefi ts of improving sanitation. Once these questions are answered, national stakeholders can continue the discussions about policy making and priority setting armed with a better evidence base for decision making. They will be further supported in their policy debates following the completion of the second ESI study, a ‘sanitation options’ study, which will examine the cost-eff ectiveness and cost-benefi t of alternative sanitation improvement options and management approaches in a range of settings in each country.
The research under this program is initially being conducted in Cambodia, Indonesia, the Philippines, Vietnam and Lao PDR. While the WSP has supported the development of this study, it is an ‘initiative’ in the broadest sense, which includes the active contribution of many people and institutions (see Acknowledgments).
ABBREVIATIONS
5Economic Impacts of Sanitation in Indonesia
A five-country study conducted in Cambodia, Indonesia, Lao PDR, the Philippines, and Vietnam under the Economics of Sanitation Initiative (ESI)
AbbreviationsALRI Acute lower respiratory tract infectionBEST Bina Ekonomi Sosial Terpadu, an NGO in IndonesiaBPS Indonesian Bureau of StatisticsBOD biochemical oxygen demandDHS Demographic and Health SurveyDO dissolved oxygenEAP East Asia and the Pacifi cEcoSan ecological sanitationESI Economics of Sanitation InitiativeGDP gross domestic productHRQL Health-Related Quality of LifeID international dollarJMP Joint Monitoring Programme (WHO, UNICEF)MDG Millennium Development GoalMOH Ministry of HealthN nitrogenNAD Nanggroe Aceh Darussalam ProvinceNGO non-governmental organizationOECD Organization of Economic Cooperation and DevelopmentP phosphorousIDR Indonesian rupiahSusenas National Socioeconomic SurveyTSS total suspended solidsUSD United States dollarVIP ventilated improved pit latrineVOSL value of a statistical lifeWHO World Health OrganizationWSP Water and Sanitation Program

ACKNOWLEDGMENTS
6Economic Impacts of Sanitation in IndonesiaA five-country study conducted in Cambodia, Indonesia, Lao PDR, the Philippines, and Vietnam under the Economics of Sanitation Initiative (ESI)
AcknowledgmentsThe Sanitation Impact Study was conducted in four countries: Cambodia, Indonesia, the Philippines, and Vietnam. A study is ongoing in Lao PDR. The study was led by the East Asia and Pacifi c Offi ce of the World Bank’s Water and Sanitation Program (WSP), with the contribution of WSP teams in each of the participating countries. The study took one year to complete and has undergone two major peer review processes.
Guy Hutton (WSP-EAP senior water and sanitation economist) led the development of the concept and methodology for the Economics of Sanitation Initiative (ESI) and the management and coordination of the country teams. The study benefi ted from the continuous support of other WSP-EAP staff . Isabel Blackett was the task team leader until December 2007, and Jema Sy, Brian Smith, Almud Weitz, and Richard Pollard provided inputs to concept development and study execution. Bjorn Larsen (WSP consultant) contributed to the study methodology and provided the fi gures for malnutrition-related health eff ects of poor sanitation.
The country team in Indonesia consisted of Lydia Napitupulu (WSP consultant, country lead), and Dedek Gunawan (WSP consultant). Guy Hutton led report drafting and fi nalization.
The ESI Indonesia study has been fi nanced by the regional component of the Sustainable Sanitation for East Asia (SUSEA) Program, funded by the Swedish International Development Agency (SIDA). ESI has also received funding from the UK Department for International Development, the Danish International Development Agency, and the Dutch Ministry of Foreign Aff airs. WSP and the report authors are grateful to the funding agencies for their support.
A large number of peer reviewers contributed their valuable time and ideas to the regional ESI study. Elena Strukova, Caroline van den Berg, Anjali Archarya, and Tracey Hart reviewed the methodology study before its implementation. The Indonesia study was reviewed by Foort Bustraan and Nona Pooroe Utomo (USAID / Environmental Services Program), and also benefi ted from peer reviews of other country reports as well as the synthesis report. Peer reviewers of the synthesis draft report were (World Bank staff unless otherwise stated) Eddy Perez, Anjali Acharya, Pete Kolsky, Elena Strukova (consultant), Bjorn Larsen (consultant), and Peter Feldman (Plan International). Peer reviewers of the Cambodia country draft report were Hilda Winarta (UNICEF), Jan Lam (SNV), Chea Samnang (Ministry of Rural Development), Ruud Corsel (Niras-Scanagri, Vietnam), and Oun Syvibola (Plan International). Peer reviewers of the Philippines country draft report were Jema Sy and Andy Robinson (consultant). Peer reviewers of the Vietnam country draft report were Samuel Leibermann, Doan Hong Quang, Pham Khanh Toan (Ministry of Construction), Nguyen Viet Anh (University of Civil Engineering), Nguyen Kim Thai (University of Civil Engineering), Nguyen Van Thuan (Australian Agency for International Development), and John Collett (Plan International).
Reference for citation: Economic impacts of sanitation in Indonesia. Napitupulu L and Hutton G. World Bank, Water and Sanitation Program. 2008.
References for other reports• Economic impacts of sanitation in Southeast Asia. Hutton G, Rodriguez UE, Napitupulu L, Thang P, Kov P. World
Bank, Water and Sanitation Program. 2008.
• Economic impacts of sanitation in Cambodia. Kov P, Sok H, Roth S, Chhoeun K, Hutton G. World Bank, Water and Sanitation Program. 2008.
• Economic impacts of sanitation in the Philippines. Rodriguez UE, Jamora N, Hutton G. World Bank, Water and Sanitation Program. 2008.
• Economic impacts of sanitation in Vietnam. Thang P, Tuan H, Hutton G. World Bank, Water and Sanitation Program. 2008.
CONTENTS
7Economic Impacts of Sanitation in Indonesia
A five-country study conducted in Cambodia, Indonesia, Lao PDR, the Philippines, and Vietnam under the Economics of Sanitation Initiative (ESI)
Table of Contents
Executive Summary 1
Foreword 4
Abbreviations 5
Acknowledgments 6
Table of Contents 7
1. Introduction 13
2. Methods 17
2.1 Study approach 18
2.2 Scope of sanitation 18
2.3 Impacts evaluated 18
2.4 Impact mitigation 20
3. Results 21
3.1 Summary of economic impacts of poor sanitation 22
3.2 Health impacts 24
3.2.1 Burden of disease 24
3.2.2 Health care costs 25
3.2.3 Health-related productivity costs 26
3.2.4 Costs of premature death 27
3.2.5 Summary of health-related costs 28
3.3 Water resource impacts 29
3.3.1 Water pollution from poor sanitation 29
3.3.2 Water quality indicators 30
3.3.3 Drinking water 32
3.3.4 Other domestic uses of water 34
3.3.5 Fish production 35
3.3.6 Summary of water-related costs 35
3.4 Environment 36
3.4.1 Aesthetics 36
3.4.2 Land quality 37
3.5 Other welfare impacts 37
3.5.1 Access time 37
3.5.2 Intangible aspects 38
3.5.3 Impact on life decisions and behavior 39
CONTENTS
8Economic Impacts of Sanitation in IndonesiaA five-country study conducted in Cambodia, Indonesia, Lao PDR, the Philippines, and Vietnam under the Economics of Sanitation Initiative (ESI)
3.6 Tourism impacts 40
3.7 Sanitation Markets 41
4. Recommendations 43
Annexes 45
Annex A: Algorithms 46
A1. Aggregating equations 46
A2. Health costs related to poor sanitation and hygiene 46
A3. Water-related costs associated with poor sanitation and hygiene 47
A4. Land costs 47
A5. User preference costs algorithm 47
A6. Tourism losses 48
A7. Variable defi nition summary 48
Annex B: National Data Inputs and Results 51
Annex C: Provincial Data Inputs and Results 57
CONTENTS
9Economic Impacts of Sanitation in Indonesia
A five-country study conducted in Cambodia, Indonesia, Lao PDR, the Philippines, and Vietnam under the Economics of Sanitation Initiative (ESI)
Tables
Table 1. Aspects of sanitation included in the present sanitation impact study 18
Table 2. Financial and economic costs of poor sanitation measured in the study 20
Table 3. Features of sanitation interventions for assessing economic gains 20
Table 4. Financial and economic losses due to poor sanitation, by impact type 22
Table 5. Estimated number of annual cases and deaths attributed to poor sanitation, 2006 25
Table 6. Unit health care costs used in the study (IDR, 2006) 25
Table 7. Total health care costs by disease (IDR billion) 26
Table 8. Total productivity costs (IDR billion) 27
Table 9. Total costs of premature death (IDR billion) 27
Table 10. Proportion of rural, urban and total households with untreated sewage discharged
to water bodies 29
Table 11. Total release of domestic human waste to water bodies 30
Table 12. Quality of major rivers based on national standards, 2005 31
Table 13. Access to various drinking water sources 32
Table 14. Households purchasing or accessing free drinking water, by source 33
Table 15. Drinking water access costs (IDR billion) 34
Table 16. Water access costs for other domestic uses (IDR billion) 35
Table 17. Summary of total costs due to polluted water sources (IDR billion) 36
Table 18. Households exposed to sub-standard practices of waste disposal 36
Table 19. Economic loss due to degraded and unavailable land 37
Table 20. Toilet access, by geographical location sub-type (by region) 38
Table 21. Time used and costs of accessing shared latrine or open defecation site 38
Table 22. Sanitation input market values, construction (IDR billion) 41
Table 23. Sanitation input market values, hygiene products and improved treatment 41
Table A1. Subscripts used in algorithms 48
Table A2. Variables used in algorithms 48
Table A3. Parameters used in algorithms 50
Table B1. Comparison of sanitation coverage (%) measured in national surveys in Indonesia 51
Table B2. Impacts of poor sanitation not quantifi ed in this study 51
Table B3. Diseases linked to poor sanitation and hygiene, and primary transmission
routes and vehicles 52
Table B4. Outpatients seeking treatment by provider type, all diseases 53
Table B5. Disease treatment cost studies 54
Table B6. Total health-related costs (IDR billion) 56
Table B7. Selected drinking water quality standards in Indonesia 56
Table C1. Population size by province and region in Indonesia, 2006 57
Table C2. Sanitation coverage by province and rural/urban grouping 58
CONTENTS
10Economic Impacts of Sanitation in IndonesiaA five-country study conducted in Cambodia, Indonesia, Lao PDR, the Philippines, and Vietnam under the Economics of Sanitation Initiative (ESI)
Table C3. Annual incidence of diarrheal disease for children under fi ve years, by province 60
Table C4. Treatment seeking behavior by province and rural/urban grouping 61
Table C5. Comparison of alternative sources of time value 64
Table C6. Value of human life using human capital approach (IDR million) 65
Table C7. Main rivers in Indonesia 66
Table C8. Main lakes in Indonesia 67
Table C9. Proportion of untreated sewage discharged to water bodies 68
Table C10. Total release of domestic polluting substances to water bodies 71
Table C11. Industrial pollution load in Jakarta, 2004 72
Table C12. Contribution of domestic sources to overall water pollution (% of BOD) 73
Table C13. Selected river quality indicators, 2003 74
Table C14. Main sources of household drinking water 76
Table C15. Fish catch value, actual catch and estimated loss due to poor sanitation 79
Table C16. Population experiencing sub-optimal latrine access time, by province 80
Table C17. Economic loss due to degraded and unavailable land 82
Table C18. Population exposed to sub-standard practices of waste disposal 84
Table C19. Time used accessing latrines 86
Table C20. Economic impact of lower foreign tourist numbers, 2006 88
CONTENTS
11Economic Impacts of Sanitation in Indonesia
A five-country study conducted in Cambodia, Indonesia, Lao PDR, the Philippines, and Vietnam under the Economics of Sanitation Initiative (ESI)
Figures
Figure A. Economic and fi nancial impacts of poor sanitation (IDR trillion) 2
Figure B. Economic gains resulting from improvement in sanitation (IDR billion) 2
Figure 1. Sanitation coverage in Indonesia (%) 14
Figure 2. Improved sanitation coverage by province, year 2004 15
Figure 3. Percentage of mothers citing they wash their hands with soap before or
after fi ve critical activities, by province 15
Figure 4. Primary impacts and resulting economic impacts associated with
improved sanitation options (“disposal of human excreta”) 19
Figure 5. Financial and economic losses due to poor sanitation, by impact type (IDR trillion) 23
Figure 6. Economic gains from universal coverage of improved sanitation and
hygiene, by impact type (IDR billion) 23
Figure 7. Health-related costs of poor sanitation and hygiene (IDR billion) 28
Figure 8. Contribution of various costs to total cost, by disease 28
Figure 9. Classroom condition, 2005-06 39
CONTENTS
12Economic Impacts of Sanitation in IndonesiaA five-country study conducted in Cambodia, Indonesia, Lao PDR, the Philippines, and Vietnam under the Economics of Sanitation Initiative (ESI)
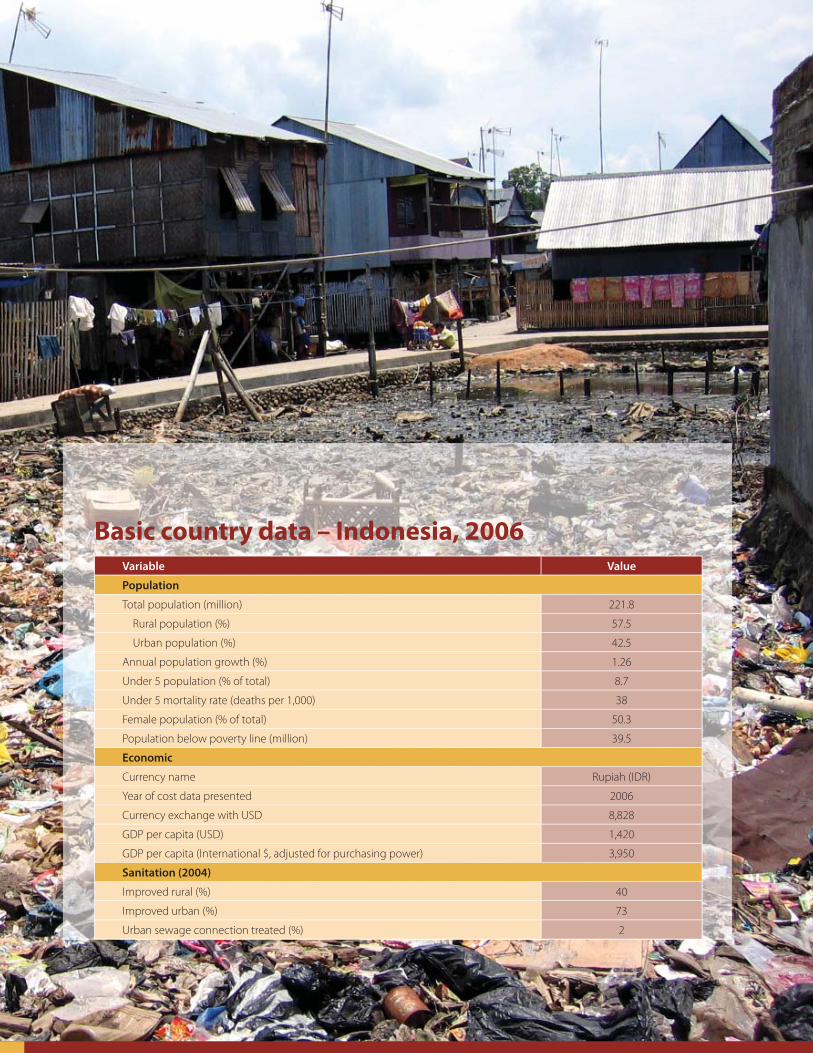
Basic country data – Indonesia, 2006Variable Value
Population
Total population (million) 221.8
Rural population (%) 57.5
Urban population (%) 42.5
Annual population growth (%) 1.26
Under 5 population (% of total) 8.7
Under 5 mortality rate (deaths per 1,000) 38
Female population (% of total) 50.3
Population below poverty line (million) 39.5
Economic
Currency name Rupiah (IDR)
Year of cost data presented 2006
Currency exchange with USD 8,828
GDP per capita (USD) 1,420
GDP per capita (International $, adjusted for purchasing power) 3,950
Sanitation (2004)
Improved rural (%) 40
Improved urban (%) 73
Urban sewage connection treated (%) 2
Research Report August 2008
1Introduction
INTRODUCTION
14Economic Impacts of Sanitation in IndonesiaA five-country study conducted in Cambodia, Indonesia, Lao PDR, the Philippines, and Vietnam under the Economics of Sanitation Initiative (ESI)
Sanitation is a global concern. One of the targets of the United Nations Millennium Development Goals (MDG) is to halve – between 1990 and 2015 – the proportion of people without access to improved sanitation. Compared with other countries in Southeast Asia, in 2004 Indonesia was below average in establishing sanitation access, at 55% compared with an average of 67% for all countries in Southeast Asia1.
Forty-fi ve percent (45%) of the Indonesian population without improved sanitation corresponds to one hundred million Indonesians without improved sanitation, that is, without an easily accessible, private and safe place to urinate and defecate. According to the UNICEF/WHO Joint Monitoring Programme, progress over the 14-year period between 1990 and 2004 has been slow in Indonesia, especially in rural areas where coverage increased 3 percentage points from 37% to 40% in a 14-year period, compared with an 8 percentage point increase in urban areas. While the 9 percentage point increase in 15 years is an impressive feat in a country of Indonesia’s population size and geographical spread, progress is slower than in other countries in the region of similar economic development, such as Vietnam, which recorded a 25 percentage point increase, Thailand (19 percentage point increase) and the Philippines (15 percentage point increase). Figure 1 compares trends with national target fi gures for rural (lower lines), urban (upper lines) and total sanitation coverage, up to 2015.
Figure 1. Sanitation coverage in Indonesia (%)
0
10
20
30
40
50
60
70
80
90
1990 2004 2015
% s
anita
tion
cove
rage
Rural target
Rural trend
Urban target
Urban trend
Total target
Total trend
Source: http://www.wssinfo.org/
Eff orts to increase sanitation coverage must also compete with population growth in Indonesia, which stands at an estimated 1.3% per annum. At this rate, an additional 2.8 million Indonesians will require improved sanitation facilities every year from now until 2015, thus adding to the 100 million people currently without improved sanitation. Forecasts at current rate of progress suggest that Indonesia will fall short of the MDG target of 73% by 10 percentage points, equivalent to 25 million people2. The Government of Indonesia (GOI) recognizes that in terms of providing adequate water supply and sanitation facilities, it is facing a “…losing battle in keeping up with the population increase”3. Furthermore, signifi cant rural-urban and inter-provincial disparities exist, which sanitation improvement eff orts must address. Figure 2 shows regional variations in coverage, ranging from 34% in West Sulawesi to 88% in Jakarta (see Annex Table C1 for population fi gures and Annex Table C2 for coverage ratios by province and rural/urban breakdown).
1 According to the UNICEF/WHO Joint Monitoring Programme, national coverage stood at 55% in 2004. Not all national surveys in Indonesia give the same fi gures for improved sanitation coverage. Annex Table A1 shows the sanitation coverage from four national surveys conducted between 2002 and 2006.
2 Universal Sanitation in East Asia. Mission Impossible? Water and Sanitation Program, United Nations Children’s Fund, World Health Organization. 2007.
3 National Policy: development of community-based water supply and environmental sanitation. Bappenas, Kimpraswil, Ministry of Health, Ministry of Home Aff airs, Ministry of Finance. 2003.
INTRODUCTION
15Economic Impacts of Sanitation in Indonesia
A five-country study conducted in Cambodia, Indonesia, Lao PDR, the Philippines, and Vietnam under the Economics of Sanitation Initiative (ESI)
Figure 2. Improved sanitation coverage by province, year 2004
70
60
Above national average (>55%)
Below national average (<55%)
0
10
20
30
40
50
80
90
100 % sanitation coverage
Hygiene practices in Indonesia are another concern. A survey conducted in six provinces in 2005 found that less than 15% of mothers cite washing hands with soap before or after fi ve critical activities (see Figure 3). Given that poor hygiene is a major risk factor for a range of infectious diseases that have a particularly large impact on children, the low rates of improved hygiene practices are a major cause for concern.
Figure 3. Percentage of mothers citing they wash their hands with soap before or after fi ve critical activities, by province
0
2
4
6
8
10
12
14
Before preparing
food
Before feeding
child
Before eating Before cleaning
child's bottom
After defecation
%
NAD
NS
B
Jkt
WJ
EJ
Key: NAD: Nanggroe Aceh Darussalam; NS: North Sumatra; B: Banten; Jkt: Jakarta; WJ: West Java; EJ: East Java. Source: USAID BHS Baseline Survey4
4 University of Indonesia Center for Health Research. Survei rumah tangga pelayanan kesehatan dasar di 30 kabupaten di 6 provinsi di Indonesia 2005. Final report to USAID - Indonesia Health Services Program: Jakarta. 2006.
INTRODUCTION
16Economic Impacts of Sanitation in IndonesiaA five-country study conducted in Cambodia, Indonesia, Lao PDR, the Philippines, and Vietnam under the Economics of Sanitation Initiative (ESI)
That sanitation is low on the list of political priorities is refl ected in the low level of investment in this sub-sector in Indonesia, which is estimated at IDR 200 per household, or roughly 0.5% of the investment needed to meet the MDG target. As well as lack of top-down investment in the sector, opportunities for attracting private sector engagement in the fi nancing and provision of sanitation services have not been adequately exploited, especially the potential for contribution by small-scale entrepreneurs. To date, most sanitation investment has been by household self-provision. Furthermore, starting in 1990, and notably with the onset of decentralization in 1999, the mandate for provision of water and sanitation services was passed to local governments, where technical capacity to provide water and sanitation services has been inadequate.
Hence a number of pre-conditions and actions are needed to raise the profi le of sanitation in government as well as in household spending. One major constraint to further investment in sanitation is a lack of knowledge of the eff ects of inaction, and conversely, the role improved water supply and sanitation services plays in the development process. Therefore, evidence is needed to support advocacy for increased investment in sanitation; evidence that does not focus exclusively on a single impact such as health impact, but on the full range of impacts that also include water and environmental quality, population preferences, and the various knock-on economic impacts of poor sanitation. Indeed, economic evidence can be a powerful advocacy tool, at the higher level, in motivating a range of players who infl uence key government decisions and sectoral resource allocations; and at the lower level, in motivating households to make the decision to invest their limited funds in an improved latrine or toilet.
Therefore, the aim of this study is to provide decision makers in Indonesia with better evidence on the negative economic impacts of poor sanitation and hygiene, to provide sanitation stakeholders with a better basis for arguing for increased investment and for more rational policy making in the sub-sector. The study also seeks to generate tentative estimates of the impacts that can be mitigated by investing in improved sanitation and hygiene.
Research Report August 2008
Methods2
METHODS
18Economic Impacts of Sanitation in IndonesiaA five-country study conducted in Cambodia, Indonesia, Lao PDR, the Philippines, and Vietnam under the Economics of Sanitation Initiative (ESI)
2.1 Study approach
This study in Indonesia employs a standardized peer-reviewed methodology5, which was also implemented in four other countries: Cambodia, Lao PDR, the Philippines and Vietnam. The primary aim of the study is to provide national estimates of the economic impact of poor sanitation and hygiene. Results for selected impacts are also presented by provincial level, rural/urban breakdown and specifi c population sub-groups such as women and children.
The study uses a modeling approach and draws almost exclusively on routine data sources such as national surveys as well as published studies. It presents the impacts in physical units and converts these into monetary equivalents using conventional economic valuation techniques. Results on economic impact are presented for a single year – 2006 – in Indonesian rupiah (IDR) and United States Dollars (USD). For those impacts where quantifi cation in economic terms is not feasible, impacts are examined and reported descriptively. A complete listing of the equations used in calculating costs is provided in Annex A. Annex B shows the data inputs and results at national level, while Annex C shows the data inputs and results at provincial level.
2.2 Scope of sanitation
The term ‘sanitation’ is used to describe many diff erent aspects of hygiene and the disposal or recycling of waste. In the international arena, the sanitation indicator adopted as part of the Millennium Development Goals (target number 10 on water supply and sanitation) focuses on the availability of a private latrine and the safe disposal of human excreta. Despite the focus of the MDG target on human excreta, the importance of other aspects of sanitation is recognized. The management of human excreta, animal excreta, solid waste, agricultural waste, toxic waste, wastewater, food, and associated hygiene practices are all included in a broader defi nition of sanitation. However, not all of these could be assessed in the present study. Table 1 provides an overview of which aspects of sanitation were included, with the main focus being on the human excreta aspect.
Table 1. Aspects of sanitation included in the present sanitation impact study
Included Excluded
• Practices related to human excreta
• Quality, safety, and proximity of latrine system
• Disposal or treatment of waste and impact on the (inhabited) outdoor environment
• Hygiene practices (hand washing with soap)
• Practices related to disposal or treatment of gray water
• Practices related to disposal or treatment of household solid waste
• Drainage and general fl ood control measures
• Industrial effl uents, toxic waste, and medical waste
• Agricultural waste
• Broader environmental sanitation
• Vector control
• Broader food safety
• Practices related to use or disposal of animal excreta
2.3 Impacts evaluated
Poor sanitation has many actual and potential negative eff ects. Conversely, improved sanitation has a large number of potential economic impacts, as shown in Figure 4. The impacts of poor (and improved) sanitation are related to fi ve main features: (1) latrine location, (2) latrine system, (3) hygiene practice related to human excreta management, (4) excreta isolation, conveyance and treatment or disposal, and (5) excreta re-use (recycling).
5 The full methodology is described in the synthesis report “Economic impacts of sanitation in Southeast Asia”. Water and Sanitation Program. 2008.
METHODS
19Economic Impacts of Sanitation in Indonesia
A five-country study conducted in Cambodia, Indonesia, Lao PDR, the Philippines, and Vietnam under the Economics of Sanitation Initiative (ESI)
Figure 4. Primary impacts and resulting economic impacts associated with improved sanitation options (“disposal of human excreta”)
Closer latrine access &
improved latrine -population ratio
Improved latrine system
Improved hygiene practices
Improved isolation,
conveyance, &treatment of
human excreta
Re -use of human excreta
Less use of public latrines
Less open defecation
Less latrine access time
1
Improved health status due to less exposure to
pathogens
Improved quality of ground and surface water
Improved quality of land and external living area
More fertilizer available
Saved entry fee costs
Improved aesthetics 2
School participation
Better living standards
HRQL improvement 3
Labor productivity
Saved health care costs
House price rises
Value of saved lives
Saved water treatment
Domestic uses of water
Cottage industry income
Tourist revenue
Foreign direct investment
Fish production
Agricultural production
Improved aesthetics 2
Fuel cost savings
Education, production
More fuel available (cooking, lighting)
IMPROVEMENT PRIMARY IMPACT ECONOMIC IMPACT
1 Comfort, convenience, security, privacy; 2 Visual eff ects, smells; 3 HRQL: health-related quality of life
Based on this initial assessment of a long list of sanitation impacts, a shortened list was selected for evaluation in this present study. These are
• Health impacts• Water resource impacts• External environment impacts• Other welfare impacts• Tourism impacts• Excreta re-use
Table 2 shows the fi nancial and economic costs quantifi ed in this study. Note that some impacts such as fi sh and tourism losses have multiple causes, and hence a fraction of overall losses are attributed to poor sanitation. Economic losses include additional expenditures, income, productivity or time losses, and the value of premature death associated with poor sanitation. Financial costs are distinguished from the broader economic costs, focusing on direct out-of-pocket expenses or income losses. Non-pecuniary welfare impacts were assessed but not quantifi ed in monetary units; these along with other non-quantifi ed impacts are listed in Annex Table A3.
METHODS
20Economic Impacts of Sanitation in IndonesiaA five-country study conducted in Cambodia, Indonesia, Lao PDR, the Philippines, and Vietnam under the Economics of Sanitation Initiative (ESI)
Table 2. Financial and economic costs of poor sanitation measured in the study
Impact categorySub-impacts evaluated
Financial costs attributable to poor sanitation
Economic costs attributable to poor sanitation
1. Health Health care costs
Marginal health-seeking costs, including patient transport, medication cost in public sector, and private sector tariff s
Full costs of health seeking, including full health care and patient transport costs
Productivity costs
Income loss due to lost adult working days due to sickness
Welfare loss due to adult and child sickness time
Premature mortality
Short-term household income loss due to adult death (1 year)
Discounted lifetime income losses for adult & child death
2. Water resources
Drinking water costs
Water treatment and distribution Financial + Time spent hauling water from less polluted water sources, or fuel for boiling water
Domestic water uses
Additional expenditure sourcing water from non-polluted sources
Financial + Time spent hauling water from less polluted water sources
Fish losses - Lost sales value due to reduction in fi sh catch3. External
environment Land quality - Economic value of land made unusable by
poor sanitation4. Other welfare Time loss - Welfare loss due to adult & child travel/
waiting time for defecation5. Tourism Tourism costs - Revenue loss from low hotel occupancy rates
2.4 Impact mitigation
From a policy viewpoint, it is important to know how much of the estimated losses resulting from poor sanitation can be averted by implementing improved sanitation options. This study estimates the potential benefi ts of the fi ve features of sanitation improvements shown in Figure 4, plus improved sanitation for tourists, as shown in Table 3. Therefore the study provides an initial estimate of the likely gains from improving these features. These estimates are by nature fairly crude and generalized, and will be supplemented by more precise estimates of the full costs and benefi ts of sanitation improvements from fi eld settings in Indonesia, available from a forthcoming study.
Table 3. Features of sanitation interventions for assessing economic gainsIntervention Detail Gains evaluatedLatrine access Toilets closer and more accessible (private rather than
shared or public)Save latrine access time
Making toilets cleaner and safer
Improved position or type of toilet seat or pan, structure, collection system, ventilation, and waste evacuation
Avert health impacts (32% reduction); and generates market value in sanitation products
Hygiene practices (hand washing with soap)
Availability of water for anal cleansing, safe disposal of materials for anal cleansing, hand washing with soap, toilet cleaning
Avert health impacts (45% reduction); and generates market value in hygienic products
Isolation of human waste from water resources
Improved septic tank functioning and emptying, fl ood-proof, treatment, and drainage system
Avert costs of accessing clean water for drinking and other household uses, and avert losses in fi sh production
Reuse of human waste Composting of feces for biogas production Value of replaced fuelSanitary conditions for tourists
Culturally appropriate improved tourist toilet facilities (hotels, restaurants, tourist attractions) and general sanitary conditions of tourist leisure facilities (e.g. water for swimming, environmental sanitation)
Avert tourist losses

Research Report August 2008
Results3
RESULTS
22Economic Impacts of Sanitation in IndonesiaA five-country study conducted in Cambodia, Indonesia, Lao PDR, the Philippines, and Vietnam under the Economics of Sanitation Initiative (ESI)
3.1 Summary of economic impacts of poor sanitation
The overall economic losses from poor sanitation and hygiene amount to IDR 56 trillion (USD 6.3 billion) per year (see Table 4). This sum is equivalent to 2.3 % of GDP in 2005, amounting to approximately IDR 252,000 (USD 28.60) per person per year. To give an indication of the relative impact on the Indonesian economy, where the average price level is 36 percent of that of the United States (when prices are compared at market exchange rates), the impact in international dollars is ID 17.8 billion.
Table 4. Financial and economic losses due to poor sanitation, by impact type
Impact Financial losses Economic losses
Value (IDR billion)
Per capita (IDR
thousand)%
Value (IDR billion)
Per capita (IDR
thousand)%
Health costs 2,719 12.4 25.3 29,512 133.3 52.7
Health care costs 1,236 5.3 11.5 1,642 7.1 2.9
Productivity costs 1,033 4.4 9.6 3,090 14.1 5.5
Premature death costs 441 1.8 4.1 24,780 112.1 44.3
Water costs 8,016 36.2 74.7 13,348 60.0 23.9
Drinking water 7,089 31.8 66.0 11,379 51.2 20.3
Domestic water uses 936 4.4 8.7 1,156 5.3 2.1
Fish production - - - 812 3.5 1.5
Environment - - - 847 3.5 1.5
Land use - - - 847 3.5 1.5
Tourism - - - 1,465 7.1 2.6
Tourist loss - - - 1,465 7.1 2.6
Other welfare - - - 10,770 48.6 19.3
Time use - - - 10,770 48.6 19.3
TOTAL 10,735 48.6 100.0 55,952 252.5 100.0
Out of the IDR 56 trillion annual economic losses, health impacts account for 53% (IDR 29.5 trillion) and water impacts 24% (IDR 13.3 trillion). The remaining 23% of economic cost is attributed to access time, tourism and loss of land use (see Figure 5). These fi gures exclude a whole range of other impacts which were not quantifi ed in this study (see Annex Table B2). At IDR 275,000 (USD 31.10) annually in urban areas, per capita costs of poor sanitation and hygiene were estimated to be higher than in rural areas at IDR 224,000 (USD 25.40); however, signifi cantly more people still do not have access to improved sanitation in rural areas. Financial costs – refl ecting estimates of actual expenditures or income losses due to poor sanitation and hygiene – amount to IDR 10.6 trillion (USD 1.2 billion) annually, or 19% of economic losses – made up of water and health impacts.

RESULTS
23Economic Impacts of Sanitation in Indonesia
A five-country study conducted in Cambodia, Indonesia, Lao PDR, the Philippines, and Vietnam under the Economics of Sanitation Initiative (ESI)
Figure 5. Financial and economic losses due to poor sanitation, by impact type (IDR trillion)
29.5
13.3
0.8 1.5
10.8
56.0
2.7
8.010.7
0
10
20
30
40
50
60
Health Water Environment Tourism Otherwelfare
TOTAL
Econ
omic
loss
es (I
DR
trill
ion)
Financial losses
Economic losses
By improving sanitation and hygiene, the majority of negative impacts can be averted (see Figure 6). Closer latrines reduce time losses valued at IDR 10.6 trillion (USD 1.2 billion), while improved toilet systems and hygiene practices bring health benefi ts worth at least IDR 13.2 trillion (USD 1.5 billion). Water resource protection measures due to improved management of human excreta also lead to potential savings of IDR 13.2 trillion (USD 1.5 billion), mainly by reducing the costs associated with access to safe drinking water. Investment in improved sanitation and the re-use of human excreta can lead to sanitation markets of at least IDR 5.3 trillion (USD 600 million) per annum. Improved sanitation for tourist locations can lead to annual economic gains of at least IDR 1.5 trillion (USD 166 million).
Figure 6. Economic gains from universal coverage of improved sanitation and hygiene, by impact type (IDR billion)
0
2000
4000
6000
8000
10000
12000
14000
16000
Latrine time access
Toilet system and hygiene
practices
Water resource protection
Solid waste management
Waste re-use Improved tourist
facilities
Sanitation & hygiene input
markets
Econ
omic
gai
ns (
IDR
bill
ion)
RESULTS
24Economic Impacts of Sanitation in IndonesiaA five-country study conducted in Cambodia, Indonesia, Lao PDR, the Philippines, and Vietnam under the Economics of Sanitation Initiative (ESI)
In conclusion, protecting water resources, averting health impacts and reducing access time are the three major potential benefi ts of a sanitation program, as quantifi ed in this study. Positive impacts on tourism, employment from sanitation programs, and waste re-use are also potentially important benefi ts from sanitation programs. Non-quantifi ed intangible benefi ts such as comfort, privacy and security, especially for women and the elderly, are also likely to bring major welfare improvements for populations receiving improved sanitation. However, further fi eld studies collecting primary information are needed to actually show these benefi ts in an Indonesian context.
3.2 Health impacts
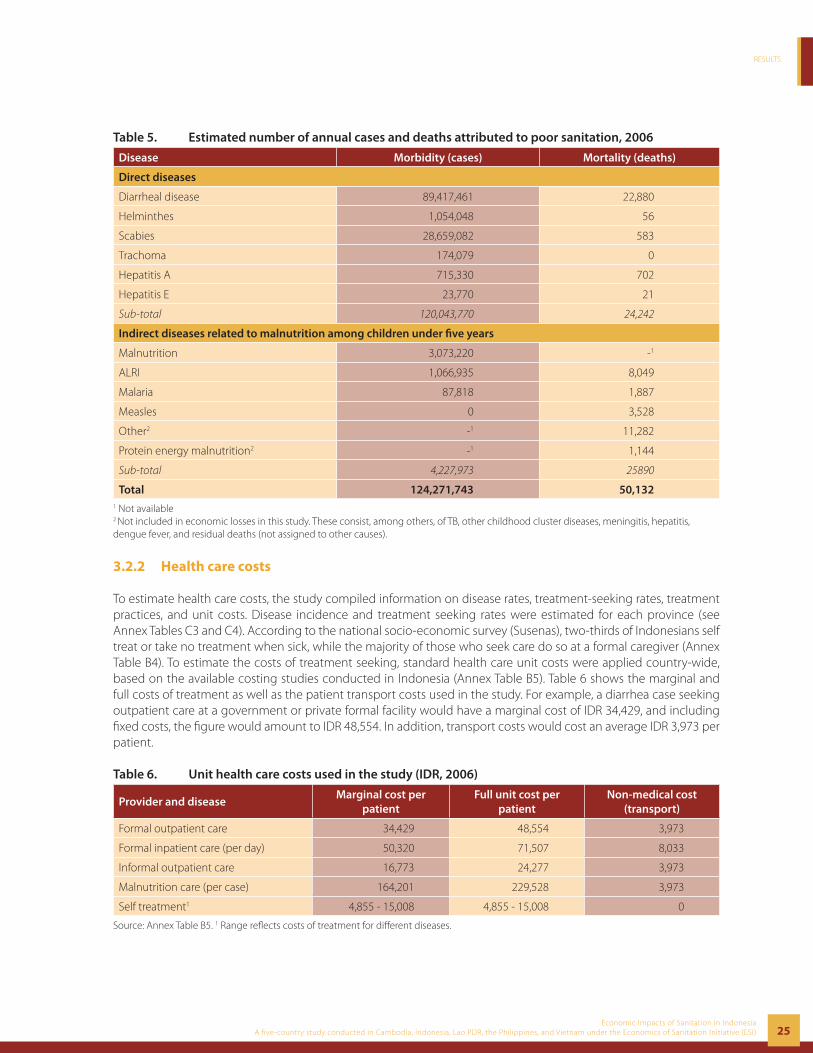
3.2.1 Burden of disease
The fi nancial and economic health costs assessed in this study include (1) spending on health care, (2) loss of income or production associated with disease, and (3) the value associated with premature loss of life.
Poor sanitation and hygiene cause signifi cant burden of disease in Indonesia through illness and premature death. Given the large number of diseases and health eff ects due to poor sanitation and hygiene (see Annex Table B3), this study selected key health impacts based on their epidemiological and economic importance, and on the availability of data from national statistics and research studies. Table 5 shows the estimated number of episodes and deaths attributed to poor sanitation for the selected diseases: diarrheal diseases, helminthes, scabies, trachoma, hepatitis A, hepatitis E, malnutrition and diseases related to malnutrition. Eighty-nine million cases of diarrhea were attributed to poor sanitation and hygiene, estimated using data from the national DHS, which collected diarrheal incidence rates for the under fi ve population (2.5 cases per child per year). Twenty-
eight million cases of scabies are estimated to be attributed to poor hygiene practices. In addition, from the national health information system, three million malnourished children, one million cases of helminthes, and a further one million disease cases related to malnutrition, are attributed to poor sanitation and hygiene. However, these fi gures – especially those from routine government sources – are likely to be heavily underestimated, due to the majority of disease cases not seeking health care from a public service provider in Indonesia. Other studies suggest signifi cantly higher rates of disease than those reported by government systems. For example, in East Asia helminthes are cited to have prevalence rates of 36% (roundworm), 28% (whipworm) and 26% (hookworm)6, which would lead to signifi cantly more than one million cases. Three million malnourished children may also be a signifi cant underestimate, in a country where it is estimated that 28% of children under fi ve – or 5.4 million – are severely or moderately underweight.
The total number of deaths attributed to poor sanitation and hygiene exceeds fi fty thousand, of which 24,000 are accounted for by direct diseases (mainly diarrhea) and 26,000 by indirect diseases related to malnutrition. These latter deaths include only children under fi ve and therefore underestimate the total deaths in all age groups.
6 Hotez P, Bundy D, Beegle K, et al. Helminth Infections: Soil-Transmitted Helminth Infections and Schistosomiasis. Chapter 24 in Disease Control Priorities in Developing Countries. 2006. Jamison D, Breman J, Measham A, Alleyne G, Claeson M, Evans D, Jha P, Mills A and Musgrove P, Editors: 2nd Edition. New York: Oxford University Press.
RESULTS
25Economic Impacts of Sanitation in Indonesia
A five-country study conducted in Cambodia, Indonesia, Lao PDR, the Philippines, and Vietnam under the Economics of Sanitation Initiative (ESI)
Table 5. Estimated number of annual cases and deaths attributed to poor sanitation, 2006
Disease Morbidity (cases) Mortality (deaths)
Direct diseases
Diarrheal disease 89,417,461 22,880
Helminthes 1,054,048 56
Scabies 28,659,082 583
Trachoma 174,079 0
Hepatitis A 715,330 702
Hepatitis E 23,770 21
Sub-total 120,043,770 24,242
Indirect diseases related to malnutrition among children under fi ve years
Malnutrition 3,073,220 -1
ALRI 1,066,935 8,049
Malaria 87,818 1,887
Measles 0 3,528
Other2 -1 11,282
Protein energy malnutrition2 -1 1,144
Sub-total 4,227,973 25890
Total 124,271,743 50,1321 Not available2 Not included in economic losses in this study. These consist, among others, of TB, other childhood cluster diseases, meningitis, hepatitis, dengue fever, and residual deaths (not assigned to other causes).
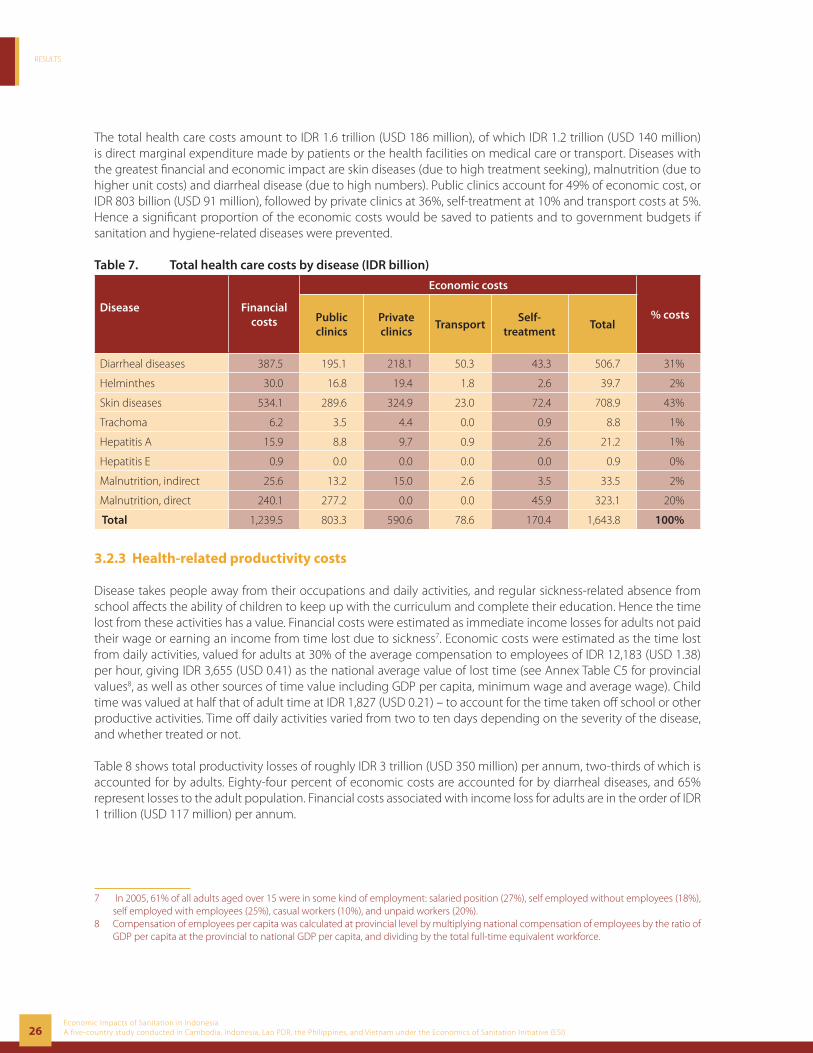
3.2.2 Health care costs
To estimate health care costs, the study compiled information on disease rates, treatment-seeking rates, treatment practices, and unit costs. Disease incidence and treatment seeking rates were estimated for each province (see Annex Tables C3 and C4). According to the national socio-economic survey (Susenas), two-thirds of Indonesians self treat or take no treatment when sick, while the majority of those who seek care do so at a formal caregiver (Annex Table B4). To estimate the costs of treatment seeking, standard health care unit costs were applied country-wide, based on the available costing studies conducted in Indonesia (Annex Table B5). Table 6 shows the marginal and full costs of treatment as well as the patient transport costs used in the study. For example, a diarrhea case seeking outpatient care at a government or private formal facility would have a marginal cost of IDR 34,429, and including fi xed costs, the fi gure would amount to IDR 48,554. In addition, transport costs would cost an average IDR 3,973 per patient.
Table 6. Unit health care costs used in the study (IDR, 2006)
Provider and diseaseMarginal cost per
patientFull unit cost per
patientNon-medical cost
(transport)
Formal outpatient care 34,429 48,554 3,973
Formal inpatient care (per day) 50,320 71,507 8,033
Informal outpatient care 16,773 24,277 3,973
Malnutrition care (per case) 164,201 229,528 3,973
Self treatment1 4,855 - 15,008 4,855 - 15,008 0
Source: Annex Table B5. 1 Range refl ects costs of treatment for diff erent diseases.
RESULTS
26Economic Impacts of Sanitation in IndonesiaA five-country study conducted in Cambodia, Indonesia, Lao PDR, the Philippines, and Vietnam under the Economics of Sanitation Initiative (ESI)
The total health care costs amount to IDR 1.6 trillion (USD 186 million), of which IDR 1.2 trillion (USD 140 million) is direct marginal expenditure made by patients or the health facilities on medical care or transport. Diseases with the greatest fi nancial and economic impact are skin diseases (due to high treatment seeking), malnutrition (due to higher unit costs) and diarrheal disease (due to high numbers). Public clinics account for 49% of economic cost, or IDR 803 billion (USD 91 million), followed by private clinics at 36%, self-treatment at 10% and transport costs at 5%. Hence a signifi cant proportion of the economic costs would be saved to patients and to government budgets if sanitation and hygiene-related diseases were prevented.
Table 7. Total health care costs by disease (IDR billion)
Disease
Financial costs
Economic costs
% costsPublic clinics
Private clinics
TransportSelf-
treatmentTotal
Diarrheal diseases 387.5 195.1 218.1 50.3 43.3 506.7 31%
Helminthes 30.0 16.8 19.4 1.8 2.6 39.7 2%
Skin diseases 534.1 289.6 324.9 23.0 72.4 708.9 43%
Trachoma 6.2 3.5 4.4 0.0 0.9 8.8 1%
Hepatitis A 15.9 8.8 9.7 0.9 2.6 21.2 1%
Hepatitis E 0.9 0.0 0.0 0.0 0.0 0.9 0%
Malnutrition, indirect 25.6 13.2 15.0 2.6 3.5 33.5 2%
Malnutrition, direct 240.1 277.2 0.0 0.0 45.9 323.1 20%
Total 1,239.5 803.3 590.6 78.6 170.4 1,643.8 100%
3.2.3 Health-related productivity costs
Disease takes people away from their occupations and daily activities, and regular sickness-related absence from school aff ects the ability of children to keep up with the curriculum and complete their education. Hence the time lost from these activities has a value. Financial costs were estimated as immediate income losses for adults not paid their wage or earning an income from time lost due to sickness7. Economic costs were estimated as the time lost from daily activities, valued for adults at 30% of the average compensation to employees of IDR 12,183 (USD 1.38) per hour, giving IDR 3,655 (USD 0.41) as the national average value of lost time (see Annex Table C5 for provincial values8, as well as other sources of time value including GDP per capita, minimum wage and average wage). Child time was valued at half that of adult time at IDR 1,827 (USD 0.21) – to account for the time taken off school or other productive activities. Time off daily activities varied from two to ten days depending on the severity of the disease, and whether treated or not.
Table 8 shows total productivity losses of roughly IDR 3 trillion (USD 350 million) per annum, two-thirds of which is accounted for by adults. Eighty-four percent of economic costs are accounted for by diarrheal diseases, and 65% represent losses to the adult population. Financial costs associated with income loss for adults are in the order of IDR 1 trillion (USD 117 million) per annum.
7 In 2005, 61% of all adults aged over 15 were in some kind of employment: salaried position (27%), self employed without employees (18%), self employed with employees (25%), casual workers (10%), and unpaid workers (20%).
8 Compensation of employees per capita was calculated at provincial level by multiplying national compensation of employees by the ratio of GDP per capita at the provincial to national GDP per capita, and dividing by the total full-time equivalent workforce.

RESULTS
27Economic Impacts of Sanitation in Indonesia
A five-country study conducted in Cambodia, Indonesia, Lao PDR, the Philippines, and Vietnam under the Economics of Sanitation Initiative (ESI)
Table 8. Total productivity costs (IDR billion)
Disease Financial costs Economic costs, by age group
0-4 5-14 15+ Total Diarrheal diseases 823.7 704.5 286.0 1,606.7 2,597.2 Helminthes 7.1 0.9 0.9 14.1 15.9 Skin diseases 192.5 15.0 33.5 374.3 422.9 Trachoma 1.8 0.0 0.0 4.4 4.4 Hepatitis A 9.7 0.9 1.8 18.5 21.2 Hepatitis E 0.0 0.0 0.0 0.9 0.9 Malnutrition, indirect 0.0 30.0 0.0 0.0 30.0 Total 1,035.5 752.1 322.2 2,019.0 3,093.3
3.2.4 Costs of premature death
Premature death aff ects society in a number of ways. The most tangible economic impact is the loss of a member of the workforce, which has implications for economic outputs and wages generated now and in the future. One method used in cost-benefi t analysis is to approximate the value of human life using the estimated future discounted income stream from a productive person, termed the ‘human capital approach’. Given that this technique gives more conservative (lower) estimates of the value of human life compared with alternative methods commonly applied, such as value-of-a-statistical-life (VOSL), the human capital approach was used in this study. As an approximate average wage, or value of time, the average annual compensation to employees of IDR 24.5 million (USD 2,775) was applied. This gives an equivalent value of life of IDR 540 million (USD 61,278) for those dying as productive adults (those over 15 years of age, with a median age of 40 years old); IDR 1 billion (USD 115,387) for those dying between the ages of 5 and 14 (median age of 10 years old); and IDR 860 million (USD 97,760) for the death of a child under fi ve (median age of 2.5 years old).
These values refl ect an economic cost for a premature death. To estimate the fi nancial cost of premature death – to refl ect short-term direct income loss – it is conservatively assumed that a household loses the equivalent of one year of income, or IDR 24.5 million (USD 2,775). These fi gures all refl ect national average. Provincial value of life fi gures are provided in Annex Table C6. In sensitivity analysis, the VOSL method is used. Due to the absence of studies on VOSL in Indonesia, an average VOSL of USD 2 million is transferred from OECD country studies. The transfer is made at an income elasticity of 0.6, and adjusted by the diff erence in GDP per capita between these countries and Indonesia. The resulting economic value for premature death valued using VOSL is IDR 2.1 billion (USD 240,341).
Table 9 presents the total costs of premature death. Of a total economic cost of IDR 25 trillion, the majority (95%) is attributed to deaths in the 0-4 year old age group – but this proportion is higher because deaths in this age group have been more comprehensively assessed. Financial costs total IDR 440 billion (USD 50 million). Economic and fi nancial costs would be higher if the ‘other’ category of indirect deaths had been included (see footnote to Table 5).
Table 9. Total costs of premature death (IDR billion)
Disease Financial costsEconomic costs, by age group
0-4 5-14 15+ Total
Diarrheal diseases 432.6 13,807.0 582.6 485.5 14,875.2 Helminthes 0.0 0.0 0.0 0.0 0.0 Skin diseases 8.8 26.5 61.8 105.9 194.2 Trachoma 0.0 0.0 0.0 0.0 0.0 Hepatitis A 0.0 8.8 26.5 44.1 79.5 Hepatitis E 0.0 0.0 0.0 0.0 8.8 Malnutrition, indirect 0.0 9,613.7 0.0 0.0 9,613.7 Total 440.2 23,464.8 670.9 644.4 24,780.2
RESULTS
28Economic Impacts of Sanitation in IndonesiaA five-country study conducted in Cambodia, Indonesia, Lao PDR, the Philippines, and Vietnam under the Economics of Sanitation Initiative (ESI)
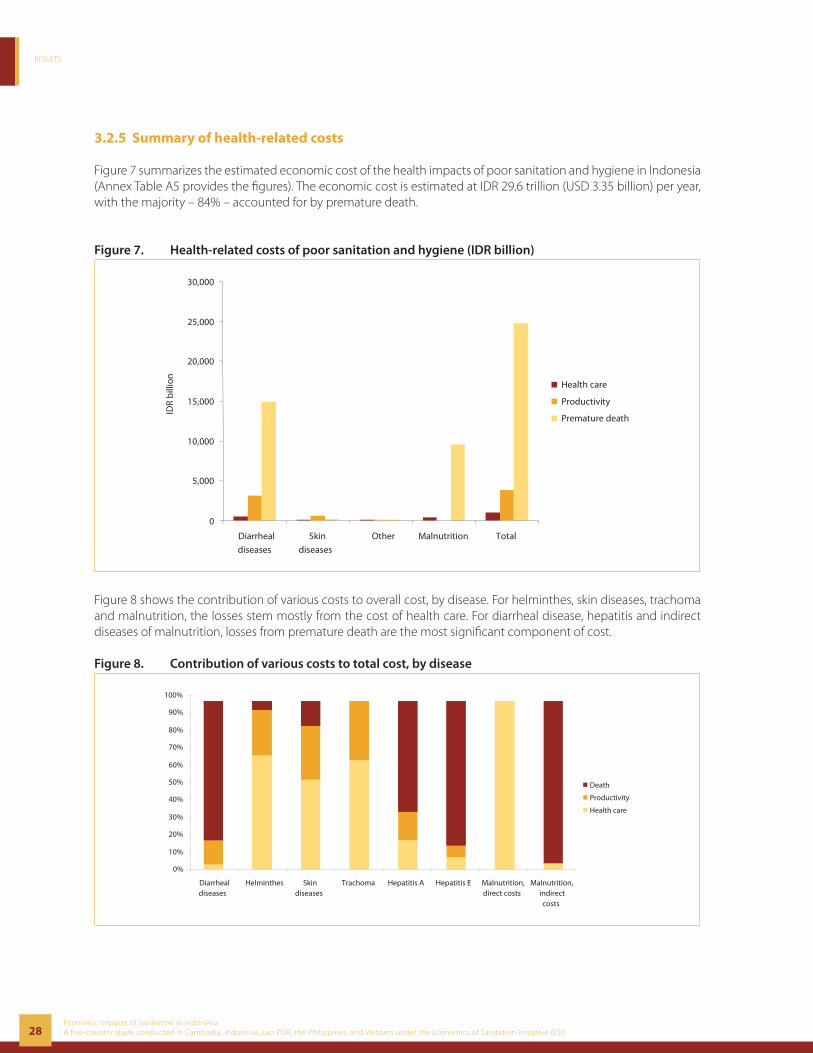
3.2.5 Summary of health-related costs
Figure 7 summarizes the estimated economic cost of the health impacts of poor sanitation and hygiene in Indonesia (Annex Table A5 provides the fi gures). The economic cost is estimated at IDR 29.6 trillion (USD 3.35 billion) per year, with the majority – 84% – accounted for by premature death.
Figure 7. Health-related costs of poor sanitation and hygiene (IDR billion)
0
5,000
10,000
15,000
20,000
25,000
30,000
Diarrheal
diseases Skin
diseases Other Malnutrition Total
Health care
Productivity
Premature death
IDR
bill
ion
Figure 8 shows the contribution of various costs to overall cost, by disease. For helminthes, skin diseases, trachoma and malnutrition, the losses stem mostly from the cost of health care. For diarrheal disease, hepatitis and indirect diseases of malnutrition, losses from premature death are the most signifi cant component of cost.
Figure 8. Contribution of various costs to total cost, by disease
0%
10%
20%
30%
40%
50%
60%
70%
80%
90%
100%
Diarrhealdiseases
Helminthes Skindiseases
Trachoma Hepatitis A Hepatitis E Malnutrition,direct costs
Malnutrition,indirectcosts
Death
Productivity
Health care

RESULTS
29Economic Impacts of Sanitation in Indonesia
A five-country study conducted in Cambodia, Indonesia, Lao PDR, the Philippines, and Vietnam under the Economics of Sanitation Initiative (ESI)
3.3 Water resource impacts
Indonesia is well-endowed with water resources, with an average surface water volume of 15,500 m3 per person per year. Major rivers include the Kali Brantas and Bengawan Solo rivers in East Java, the Cenranae river in South Sulawesi, and the Barito river in Central Kalimantan (see Annex Table C7). Major lakes include Air Siku and Kolong Kac in South Sumatra and Palaguna lake in South Sulawesi (see Annex Table C8). However, water availability is highly variable between regions and seasons, with some rivers drying up during the dry season. On Java, the average available surface water is one tenth the national average due to high population density.
The impact of pollution on the economic value of water resources is determined by three main factors: the extent of water resources, the release of polluting substances in water resources, and the actual or potential uses of water. At the national level, currently about 93% of freshwater resources are withdrawn for irrigation, 6% for domestic activities and 1% for industrial use9. For some of these activities, such as for drinking, good quality water is important; while for other uses, such as for agricultural and some industrial uses, water quality standards are not so strict.
3.3.1 Water pollution from poor sanitation
Domestic sources contribute signifi cantly to water pollution in Indonesia, where the majority of households do not have sewage or wastewater safely disposed of or treated. However, the presence of other sources of water pollution means that overall economic impact of polluted water cannot be attributed to poor sanitation alone. Pollutants that aff ect water-related economic activity originate from households, industry, agriculture (fertilizers, pesticides, animal waste), erosion, and salinity intrusion from coastal areas.
Water pollution from domestic sources can be estimated from the annual release or eventual seepage of untreated feces, urine, and gray water into inland water bodies. Table 10 shows the proportion of the total population with sanitation options that discharge directly or indirectly to ground or surface water. The total effl uent of human excreta to water bodies is then estimated by combining population size by province (Annex Table C1), access to diff erent types of sanitation facilities (Annex Table C2), the proportion of sewage released into water bodies (Table 10, or Annex Table C9 for provincial breakdown), and average human waste production per year10.
Table 10. Proportion of rural, urban and total households with untreated sewage discharged to water bodies
LocationSewage discharged to
water bodyOpen defecation in water courses1
Septic tank effl uents to
groundwater2
Pit latrine effl uents to
groundwater3
Total
Rural 27.6 10.7 6.1 8.9 53.2
Urban 28.6 3.1 15.6 4.9 52.2
Total 28.0 7.4 10.2 7.2 52.8 1 One-quarter of total open defecation2 50% of septic tanks3 50% of unimproved pit latrines
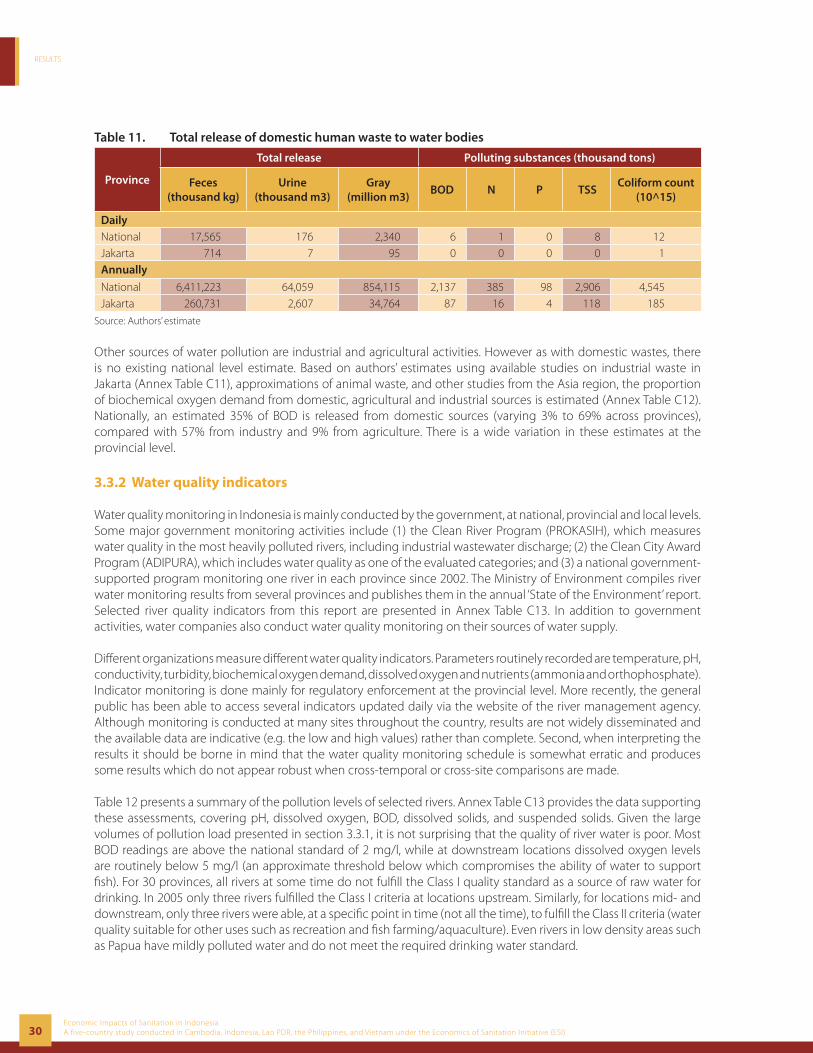
Based on the above data and assumptions, the total release of polluting substances to inland water bodies in Indonesia is estimated at 6.4 million tones of feces annually, 64 million m3 of urine, and 854 million m3 of gray water (Table 11). This translates as approximately 2.1 million tones of biochemical oxygen demand and 385,000 tons of nitrogen compounds per year. A provincial distribution is shown in Annex Table C10. In Jakarta alone, roughly 0.3 million tons of feces and 2 million m3 of urine are estimated to be released in into inland water bodies.
9 Water pricing and valuation in Indonesia: case study of the Brantas River Basin. C Rodgers and P Hellegers. International Food Policy Research Institute Discussion Paper 141.Washington, DC. 2005.
10 Equal to 0.15 kg of feces, 1.5 liters of urine and 200 liter of gray water per person per day.
RESULTS
30Economic Impacts of Sanitation in IndonesiaA five-country study conducted in Cambodia, Indonesia, Lao PDR, the Philippines, and Vietnam under the Economics of Sanitation Initiative (ESI)
Table 11. Total release of domestic human waste to water bodies
Province
Total release Polluting substances (thousand tons)
Feces (thousand kg)
Urine (thousand m3)
Gray (million m3)
BOD N P TSS Coliform count
(10^15)
DailyNational 17,565 176 2,340 6 1 0 8 12 Jakarta 714 7 95 0 0 0 0 1 Annually
National 6,411,223 64,059 854,115 2,137 385 98 2,906 4,545 Jakarta 260,731 2,607 34,764 87 16 4 118 185
Source: Authors’ estimate
Other sources of water pollution are industrial and agricultural activities. However as with domestic wastes, there is no existing national level estimate. Based on authors’ estimates using available studies on industrial waste in Jakarta (Annex Table C11), approximations of animal waste, and other studies from the Asia region, the proportion of biochemical oxygen demand from domestic, agricultural and industrial sources is estimated (Annex Table C12). Nationally, an estimated 35% of BOD is released from domestic sources (varying 3% to 69% across provinces), compared with 57% from industry and 9% from agriculture. There is a wide variation in these estimates at the provincial level.
3.3.2 Water quality indicators
Water quality monitoring in Indonesia is mainly conducted by the government, at national, provincial and local levels. Some major government monitoring activities include (1) the Clean River Program (PROKASIH), which measures water quality in the most heavily polluted rivers, including industrial wastewater discharge; (2) the Clean City Award Program (ADIPURA), which includes water quality as one of the evaluated categories; and (3) a national government-supported program monitoring one river in each province since 2002. The Ministry of Environment compiles river water monitoring results from several provinces and publishes them in the annual ‘State of the Environment’ report. Selected river quality indicators from this report are presented in Annex Table C13. In addition to government activities, water companies also conduct water quality monitoring on their sources of water supply.
Diff erent organizations measure diff erent water quality indicators. Parameters routinely recorded are temperature, pH, conductivity, turbidity, biochemical oxygen demand, dissolved oxygen and nutrients (ammonia and orthophosphate). Indicator monitoring is done mainly for regulatory enforcement at the provincial level. More recently, the general public has been able to access several indicators updated daily via the website of the river management agency. Although monitoring is conducted at many sites throughout the country, results are not widely disseminated and the available data are indicative (e.g. the low and high values) rather than complete. Second, when interpreting the results it should be borne in mind that the water quality monitoring schedule is somewhat erratic and produces some results which do not appear robust when cross-temporal or cross-site comparisons are made.
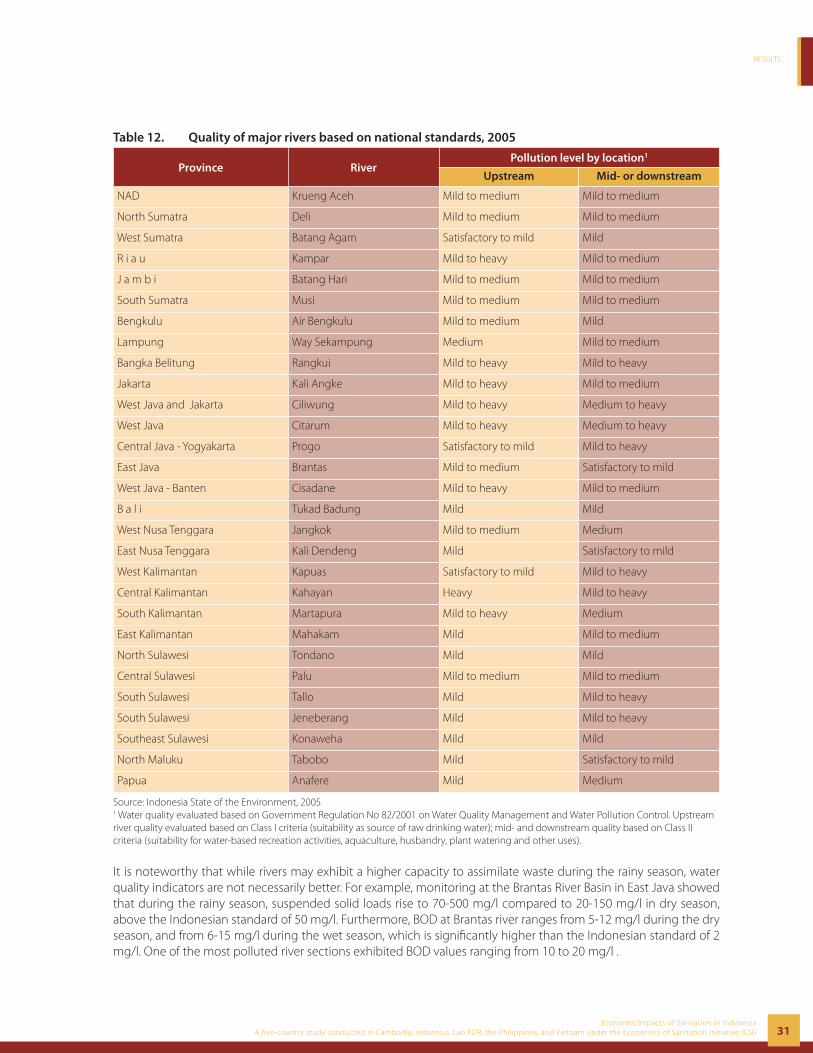
Table 12 presents a summary of the pollution levels of selected rivers. Annex Table C13 provides the data supporting these assessments, covering pH, dissolved oxygen, BOD, dissolved solids, and suspended solids. Given the large volumes of pollution load presented in section 3.3.1, it is not surprising that the quality of river water is poor. Most BOD readings are above the national standard of 2 mg/l, while at downstream locations dissolved oxygen levels are routinely below 5 mg/l (an approximate threshold below which compromises the ability of water to support fi sh). For 30 provinces, all rivers at some time do not fulfi ll the Class I quality standard as a source of raw water for drinking. In 2005 only three rivers fulfi lled the Class I criteria at locations upstream. Similarly, for locations mid- and downstream, only three rivers were able, at a specifi c point in time (not all the time), to fulfi ll the Class II criteria (water quality suitable for other uses such as recreation and fi sh farming/aquaculture). Even rivers in low density areas such as Papua have mildly polluted water and do not meet the required drinking water standard.
RESULTS
31Economic Impacts of Sanitation in Indonesia
A five-country study conducted in Cambodia, Indonesia, Lao PDR, the Philippines, and Vietnam under the Economics of Sanitation Initiative (ESI)
Table 12. Quality of major rivers based on national standards, 2005
Province RiverPollution level by location1
Upstream Mid- or downstream
NAD Krueng Aceh Mild to medium Mild to medium
North Sumatra Deli Mild to medium Mild to medium
West Sumatra Batang Agam Satisfactory to mild Mild
R i a u Kampar Mild to heavy Mild to medium
J a m b i Batang Hari Mild to medium Mild to medium
South Sumatra Musi Mild to medium Mild to medium
Bengkulu Air Bengkulu Mild to medium Mild
Lampung Way Sekampung Medium Mild to medium
Bangka Belitung Rangkui Mild to heavy Mild to heavy
Jakarta Kali Angke Mild to heavy Mild to medium
West Java and Jakarta Ciliwung Mild to heavy Medium to heavy
West Java Citarum Mild to heavy Medium to heavy
Central Java - Yogyakarta Progo Satisfactory to mild Mild to heavy
East Java Brantas Mild to medium Satisfactory to mild
West Java - Banten Cisadane Mild to heavy Mild to medium
B a l i Tukad Badung Mild Mild
West Nusa Tenggara Jangkok Mild to medium Medium
East Nusa Tenggara Kali Dendeng Mild Satisfactory to mild
West Kalimantan Kapuas Satisfactory to mild Mild to heavy
Central Kalimantan Kahayan Heavy Mild to heavy
South Kalimantan Martapura Mild to heavy Medium
East Kalimantan Mahakam Mild Mild to medium
North Sulawesi Tondano Mild Mild
Central Sulawesi Palu Mild to medium Mild to medium
South Sulawesi Tallo Mild Mild to heavy
South Sulawesi Jeneberang Mild Mild to heavy
Southeast Sulawesi Konaweha Mild Mild
North Maluku Tabobo Mild Satisfactory to mild
Papua Anafere Mild Medium
Source: Indonesia State of the Environment, 20051 Water quality evaluated based on Government Regulation No 82/2001 on Water Quality Management and Water Pollution Control. Upstream river quality evaluated based on Class I criteria (suitability as source of raw drinking water); mid- and downstream quality based on Class II criteria (suitability for water-based recreation activities, aquaculture, husbandry, plant watering and other uses).
It is noteworthy that while rivers may exhibit a higher capacity to assimilate waste during the rainy season, water quality indicators are not necessarily better. For example, monitoring at the Brantas River Basin in East Java showed that during the rainy season, suspended solid loads rise to 70-500 mg/l compared to 20-150 mg/l in dry season, above the Indonesian standard of 50 mg/l. Furthermore, BOD at Brantas river ranges from 5-12 mg/l during the dry season, and from 6-15 mg/l during the wet season, which is signifi cantly higher than the Indonesian standard of 2 mg/l. One of the most polluted river sections exhibited BOD values ranging from 10 to 20 mg/l .
RESULTS
32Economic Impacts of Sanitation in IndonesiaA five-country study conducted in Cambodia, Indonesia, Lao PDR, the Philippines, and Vietnam under the Economics of Sanitation Initiative (ESI)
3.3.3 Drinking water
Due to the many pollutants released into water in Indonesia, leading to poor quality surface water, few surface water sources are safe to drink from. This leads to households switching to water sources that are less convenient to access, more costly to access, or less safe, or all three. Annex Table B7 shows selected drinking water quality standards in Indonesia.
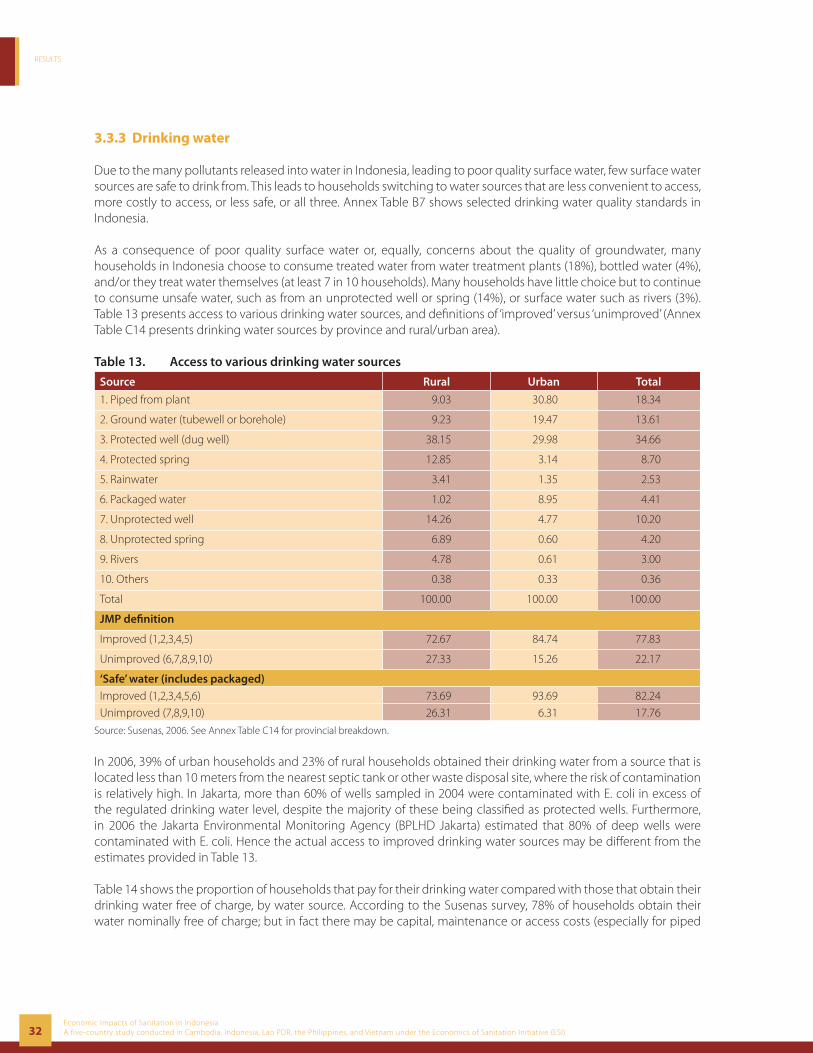
As a consequence of poor quality surface water or, equally, concerns about the quality of groundwater, many households in Indonesia choose to consume treated water from water treatment plants (18%), bottled water (4%), and/or they treat water themselves (at least 7 in 10 households). Many households have little choice but to continue to consume unsafe water, such as from an unprotected well or spring (14%), or surface water such as rivers (3%). Table 13 presents access to various drinking water sources, and defi nitions of ‘improved’ versus ‘unimproved’ (Annex Table C14 presents drinking water sources by province and rural/urban area).
Table 13. Access to various drinking water sources
Source Rural Urban Total
1. Piped from plant 9.03 30.80 18.34
2. Ground water (tubewell or borehole) 9.23 19.47 13.61
3. Protected well (dug well) 38.15 29.98 34.66
4. Protected spring 12.85 3.14 8.70
5. Rainwater 3.41 1.35 2.53
6. Packaged water 1.02 8.95 4.41
7. Unprotected well 14.26 4.77 10.20
8. Unprotected spring 6.89 0.60 4.20
9. Rivers 4.78 0.61 3.00
10. Others 0.38 0.33 0.36
Total 100.00 100.00 100.00
JMP defi nition
Improved (1,2,3,4,5) 72.67 84.74 77.83
Unimproved (6,7,8,9,10) 27.33 15.26 22.17
‘Safe’ water (includes packaged)Improved (1,2,3,4,5,6) 73.69 93.69 82.24
Unimproved (7,8,9,10) 26.31 6.31 17.76
Source: Susenas, 2006. See Annex Table C14 for provincial breakdown.
In 2006, 39% of urban households and 23% of rural households obtained their drinking water from a source that is located less than 10 meters from the nearest septic tank or other waste disposal site, where the risk of contamination is relatively high. In Jakarta, more than 60% of wells sampled in 2004 were contaminated with E. coli in excess of the regulated drinking water level, despite the majority of these being classifi ed as protected wells. Furthermore, in 2006 the Jakarta Environmental Monitoring Agency (BPLHD Jakarta) estimated that 80% of deep wells were contaminated with E. coli. Hence the actual access to improved drinking water sources may be diff erent from the estimates provided in Table 13.
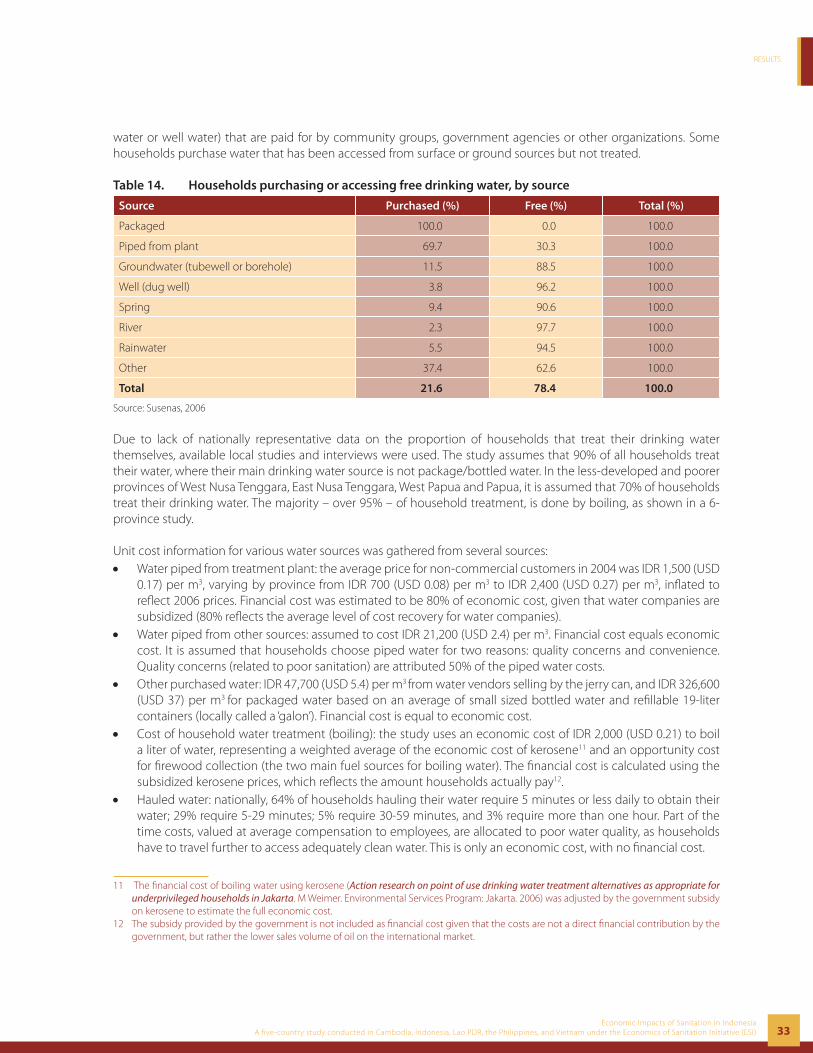
Table 14 shows the proportion of households that pay for their drinking water compared with those that obtain their drinking water free of charge, by water source. According to the Susenas survey, 78% of households obtain their water nominally free of charge; but in fact there may be capital, maintenance or access costs (especially for piped
RESULTS
33Economic Impacts of Sanitation in Indonesia
A five-country study conducted in Cambodia, Indonesia, Lao PDR, the Philippines, and Vietnam under the Economics of Sanitation Initiative (ESI)
water or well water) that are paid for by community groups, government agencies or other organizations. Some households purchase water that has been accessed from surface or ground sources but not treated.
Table 14. Households purchasing or accessing free drinking water, by source
Source Purchased (%) Free (%) Total (%)
Packaged 100.0 0.0 100.0
Piped from plant 69.7 30.3 100.0
Groundwater (tubewell or borehole) 11.5 88.5 100.0
Well (dug well) 3.8 96.2 100.0
Spring 9.4 90.6 100.0
River 2.3 97.7 100.0
Rainwater 5.5 94.5 100.0
Other 37.4 62.6 100.0
Total 21.6 78.4 100.0
Source: Susenas, 2006
Due to lack of nationally representative data on the proportion of households that treat their drinking water themselves, available local studies and interviews were used. The study assumes that 90% of all households treat their water, where their main drinking water source is not package/bottled water. In the less-developed and poorer provinces of West Nusa Tenggara, East Nusa Tenggara, West Papua and Papua, it is assumed that 70% of households treat their drinking water. The majority – over 95% – of household treatment, is done by boiling, as shown in a 6-province study.
Unit cost information for various water sources was gathered from several sources:• Water piped from treatment plant: the average price for non-commercial customers in 2004 was IDR 1,500 (USD
0.17) per m3, varying by province from IDR 700 (USD 0.08) per m3 to IDR 2,400 (USD 0.27) per m3, infl ated to refl ect 2006 prices. Financial cost was estimated to be 80% of economic cost, given that water companies are subsidized (80% refl ects the average level of cost recovery for water companies).
• Water piped from other sources: assumed to cost IDR 21,200 (USD 2.4) per m3. Financial cost equals economic cost. It is assumed that households choose piped water for two reasons: quality concerns and convenience. Quality concerns (related to poor sanitation) are attributed 50% of the piped water costs.
• Other purchased water: IDR 47,700 (USD 5.4) per m3 from water vendors selling by the jerry can, and IDR 326,600 (USD 37) per m3 for packaged water based on an average of small sized bottled water and refi llable 19-liter containers (locally called a ‘galon’). Financial cost is equal to economic cost.
• Cost of household water treatment (boiling): the study uses an economic cost of IDR 2,000 (USD 0.21) to boil a liter of water, representing a weighted average of the economic cost of kerosene11 and an opportunity cost for fi rewood collection (the two main fuel sources for boiling water). The fi nancial cost is calculated using the subsidized kerosene prices, which refl ects the amount households actually pay12.
• Hauled water: nationally, 64% of households hauling their water require 5 minutes or less daily to obtain their water; 29% require 5-29 minutes; 5% require 30-59 minutes, and 3% require more than one hour. Part of the time costs, valued at average compensation to employees, are allocated to poor water quality, as households have to travel further to access adequately clean water. This is only an economic cost, with no fi nancial cost.
11 The fi nancial cost of boiling water using kerosene (Action research on point of use drinking water treatment alternatives as appropriate for underprivileged households in Jakarta. M Weimer. Environmental Services Program: Jakarta. 2006) was adjusted by the government subsidy on kerosene to estimate the full economic cost.
12 The subsidy provided by the government is not included as fi nancial cost given that the costs are not a direct fi nancial contribution by the government, but rather the lower sales volume of oil on the international market.
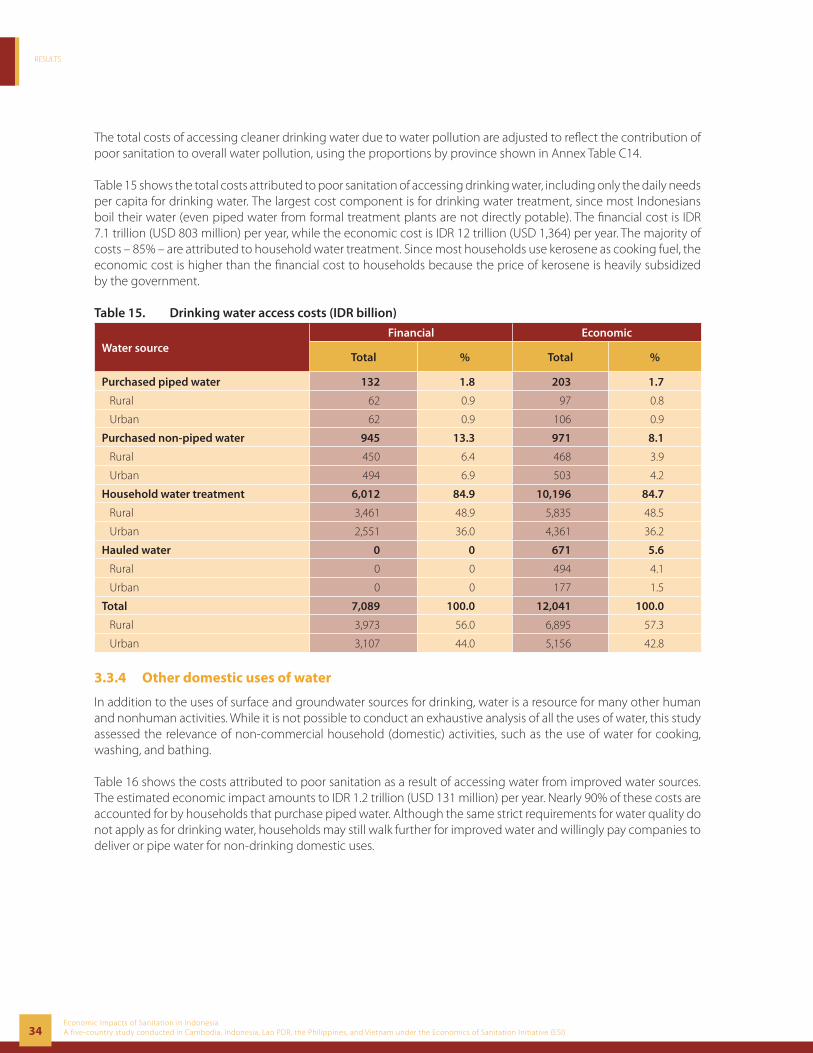
RESULTS
34Economic Impacts of Sanitation in IndonesiaA five-country study conducted in Cambodia, Indonesia, Lao PDR, the Philippines, and Vietnam under the Economics of Sanitation Initiative (ESI)
The total costs of accessing cleaner drinking water due to water pollution are adjusted to refl ect the contribution of poor sanitation to overall water pollution, using the proportions by province shown in Annex Table C14.
Table 15 shows the total costs attributed to poor sanitation of accessing drinking water, including only the daily needs per capita for drinking water. The largest cost component is for drinking water treatment, since most Indonesians boil their water (even piped water from formal treatment plants are not directly potable). The fi nancial cost is IDR 7.1 trillion (USD 803 million) per year, while the economic cost is IDR 12 trillion (USD 1,364) per year. The majority of costs – 85% – are attributed to household water treatment. Since most households use kerosene as cooking fuel, the economic cost is higher than the fi nancial cost to households because the price of kerosene is heavily subsidized by the government.
Table 15. Drinking water access costs (IDR billion)
Water sourceFinancial Economic
Total % Total %
Purchased piped water 132 1.8 203 1.7
Rural 62 0.9 97 0.8
Urban 62 0.9 106 0.9
Purchased non-piped water 945 13.3 971 8.1
Rural 450 6.4 468 3.9
Urban 494 6.9 503 4.2
Household water treatment 6,012 84.9 10,196 84.7
Rural 3,461 48.9 5,835 48.5
Urban 2,551 36.0 4,361 36.2
Hauled water 0 0 671 5.6
Rural 0 0 494 4.1
Urban 0 0 177 1.5
Total 7,089 100.0 12,041 100.0
Rural 3,973 56.0 6,895 57.3
Urban 3,107 44.0 5,156 42.8
3.3.4 Other domestic uses of water
In addition to the uses of surface and groundwater sources for drinking, water is a resource for many other human and nonhuman activities. While it is not possible to conduct an exhaustive analysis of all the uses of water, this study assessed the relevance of non-commercial household (domestic) activities, such as the use of water for cooking, washing, and bathing.
Table 16 shows the costs attributed to poor sanitation as a result of accessing water from improved water sources. The estimated economic impact amounts to IDR 1.2 trillion (USD 131 million) per year. Nearly 90% of these costs are accounted for by households that purchase piped water. Although the same strict requirements for water quality do not apply as for drinking water, households may still walk further for improved water and willingly pay companies to deliver or pipe water for non-drinking domestic uses.
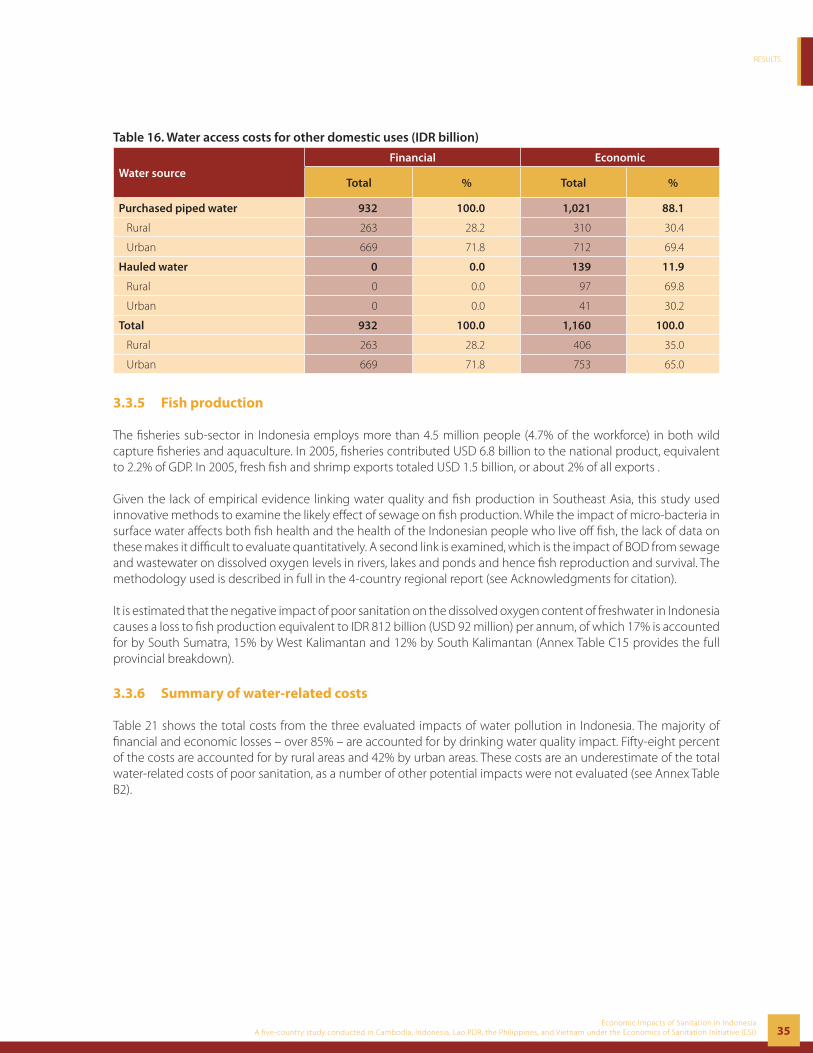
RESULTS
35Economic Impacts of Sanitation in Indonesia
A five-country study conducted in Cambodia, Indonesia, Lao PDR, the Philippines, and Vietnam under the Economics of Sanitation Initiative (ESI)
Table 16. Water access costs for other domestic uses (IDR billion)
Water sourceFinancial Economic
Total % Total %
Purchased piped water 932 100.0 1,021 88.1
Rural 263 28.2 310 30.4
Urban 669 71.8 712 69.4
Hauled water 0 0.0 139 11.9
Rural 0 0.0 97 69.8
Urban 0 0.0 41 30.2
Total 932 100.0 1,160 100.0
Rural 263 28.2 406 35.0
Urban 669 71.8 753 65.0
3.3.5 Fish production
The fi sheries sub-sector in Indonesia employs more than 4.5 million people (4.7% of the workforce) in both wild capture fi sheries and aquaculture. In 2005, fi sheries contributed USD 6.8 billion to the national product, equivalent to 2.2% of GDP. In 2005, fresh fi sh and shrimp exports totaled USD 1.5 billion, or about 2% of all exports .
Given the lack of empirical evidence linking water quality and fi sh production in Southeast Asia, this study used innovative methods to examine the likely eff ect of sewage on fi sh production. While the impact of micro-bacteria in surface water aff ects both fi sh health and the health of the Indonesian people who live off fi sh, the lack of data on these makes it diffi cult to evaluate quantitatively. A second link is examined, which is the impact of BOD from sewage and wastewater on dissolved oxygen levels in rivers, lakes and ponds and hence fi sh reproduction and survival. The methodology used is described in full in the 4-country regional report (see Acknowledgments for citation).
It is estimated that the negative impact of poor sanitation on the dissolved oxygen content of freshwater in Indonesia causes a loss to fi sh production equivalent to IDR 812 billion (USD 92 million) per annum, of which 17% is accounted for by South Sumatra, 15% by West Kalimantan and 12% by South Kalimantan (Annex Table C15 provides the full provincial breakdown).
3.3.6 Summary of water-related costs
Table 21 shows the total costs from the three evaluated impacts of water pollution in Indonesia. The majority of fi nancial and economic losses – over 85% – are accounted for by drinking water quality impact. Fifty-eight percent of the costs are accounted for by rural areas and 42% by urban areas. These costs are an underestimate of the total water-related costs of poor sanitation, as a number of other potential impacts were not evaluated (see Annex Table B2).
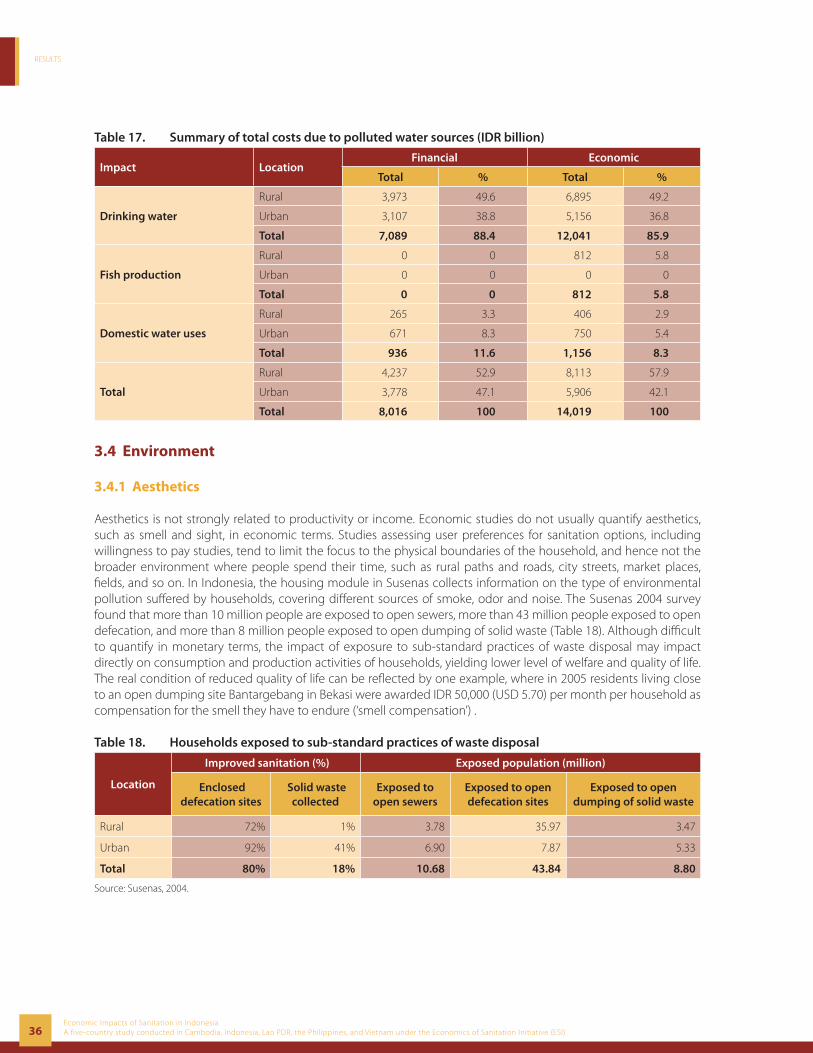
RESULTS
36Economic Impacts of Sanitation in IndonesiaA five-country study conducted in Cambodia, Indonesia, Lao PDR, the Philippines, and Vietnam under the Economics of Sanitation Initiative (ESI)
Table 17. Summary of total costs due to polluted water sources (IDR billion)
Impact LocationFinancial Economic
Total % Total %
Drinking water
Rural 3,973 49.6 6,895 49.2
Urban 3,107 38.8 5,156 36.8
Total 7,089 88.4 12,041 85.9
Fish production
Rural 0 0 812 5.8
Urban 0 0 0 0
Total 0 0 812 5.8
Domestic water uses
Rural 265 3.3 406 2.9
Urban 671 8.3 750 5.4
Total 936 11.6 1,156 8.3
Total
Rural 4,237 52.9 8,113 57.9
Urban 3,778 47.1 5,906 42.1
Total 8,016 100 14,019 100
3.4 Environment
3.4.1 Aesthetics
Aesthetics is not strongly related to productivity or income. Economic studies do not usually quantify aesthetics, such as smell and sight, in economic terms. Studies assessing user preferences for sanitation options, including willingness to pay studies, tend to limit the focus to the physical boundaries of the household, and hence not the broader environment where people spend their time, such as rural paths and roads, city streets, market places, fi elds, and so on. In Indonesia, the housing module in Susenas collects information on the type of environmental pollution suff ered by households, covering diff erent sources of smoke, odor and noise. The Susenas 2004 survey found that more than 10 million people are exposed to open sewers, more than 43 million people exposed to open defecation, and more than 8 million people exposed to open dumping of solid waste (Table 18). Although diffi cult to quantify in monetary terms, the impact of exposure to sub-standard practices of waste disposal may impact directly on consumption and production activities of households, yielding lower level of welfare and quality of life. The real condition of reduced quality of life can be refl ected by one example, where in 2005 residents living close to an open dumping site Bantargebang in Bekasi were awarded IDR 50,000 (USD 5.70) per month per household as compensation for the smell they have to endure (‘smell compensation’) .
Table 18. Households exposed to sub-standard practices of waste disposal
Location
Improved sanitation (%) Exposed population (million)
Enclosed defecation sites
Solid waste collected
Exposed to open sewers
Exposed to open defecation sites
Exposed to open dumping of solid waste
Rural 72% 1% 3.78 35.97 3.47
Urban 92% 41% 6.90 7.87 5.33
Total 80% 18% 10.68 43.84 8.80
Source: Susenas, 2004.
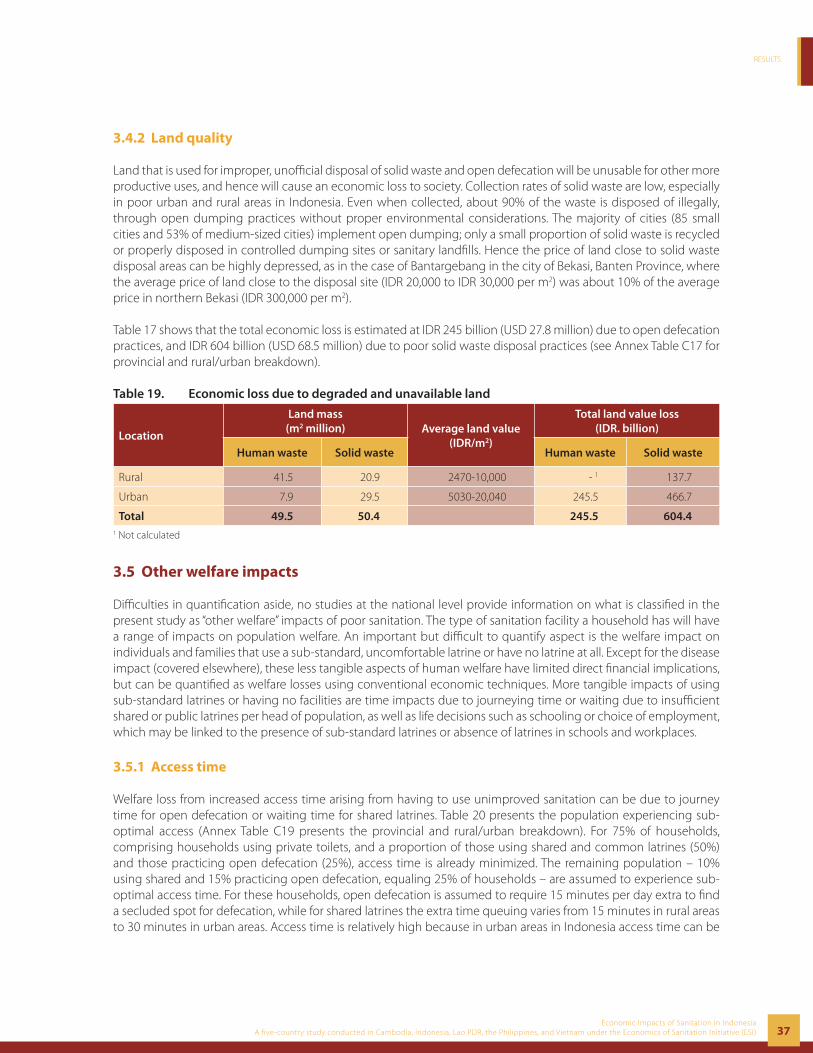
RESULTS
37Economic Impacts of Sanitation in Indonesia
A five-country study conducted in Cambodia, Indonesia, Lao PDR, the Philippines, and Vietnam under the Economics of Sanitation Initiative (ESI)
3.4.2 Land quality
Land that is used for improper, unoffi cial disposal of solid waste and open defecation will be unusable for other more productive uses, and hence will cause an economic loss to society. Collection rates of solid waste are low, especially in poor urban and rural areas in Indonesia. Even when collected, about 90% of the waste is disposed of illegally, through open dumping practices without proper environmental considerations. The majority of cities (85 small cities and 53% of medium-sized cities) implement open dumping; only a small proportion of solid waste is recycled or properly disposed in controlled dumping sites or sanitary landfi lls. Hence the price of land close to solid waste disposal areas can be highly depressed, as in the case of Bantargebang in the city of Bekasi, Banten Province, where the average price of land close to the disposal site (IDR 20,000 to IDR 30,000 per m2) was about 10% of the average price in northern Bekasi (IDR 300,000 per m2).
Table 17 shows that the total economic loss is estimated at IDR 245 billion (USD 27.8 million) due to open defecation practices, and IDR 604 billion (USD 68.5 million) due to poor solid waste disposal practices (see Annex Table C17 for provincial and rural/urban breakdown).
Table 19. Economic loss due to degraded and unavailable land
Location
Land mass (m2 million) Average land value
(IDR/m2)
Total land value loss (IDR. billion)
Human waste Solid waste Human waste Solid waste
Rural 41.5 20.9 2470-10,000 - 1 137.7
Urban 7.9 29.5 5030-20,040 245.5 466.7
Total 49.5 50.4 245.5 604.41 Not calculated
3.5 Other welfare impacts
Diffi culties in quantifi cation aside, no studies at the national level provide information on what is classifi ed in the present study as “other welfare” impacts of poor sanitation. The type of sanitation facility a household has will have a range of impacts on population welfare. An important but diffi cult to quantify aspect is the welfare impact on individuals and families that use a sub-standard, uncomfortable latrine or have no latrine at all. Except for the disease impact (covered elsewhere), these less tangible aspects of human welfare have limited direct fi nancial implications, but can be quantifi ed as welfare losses using conventional economic techniques. More tangible impacts of using sub-standard latrines or having no facilities are time impacts due to journeying time or waiting due to insuffi cient shared or public latrines per head of population, as well as life decisions such as schooling or choice of employment, which may be linked to the presence of sub-standard latrines or absence of latrines in schools and workplaces.
3.5.1 Access time
Welfare loss from increased access time arising from having to use unimproved sanitation can be due to journey time for open defecation or waiting time for shared latrines. Table 20 presents the population experiencing sub-optimal access (Annex Table C19 presents the provincial and rural/urban breakdown). For 75% of households, comprising households using private toilets, and a proportion of those using shared and common latrines (50%) and those practicing open defecation (25%), access time is already minimized. The remaining population – 10% using shared and 15% practicing open defecation, equaling 25% of households – are assumed to experience sub-optimal access time. For these households, open defecation is assumed to require 15 minutes per day extra to fi nd a secluded spot for defecation, while for shared latrines the extra time queuing varies from 15 minutes in rural areas to 30 minutes in urban areas. Access time is relatively high because in urban areas in Indonesia access time can be
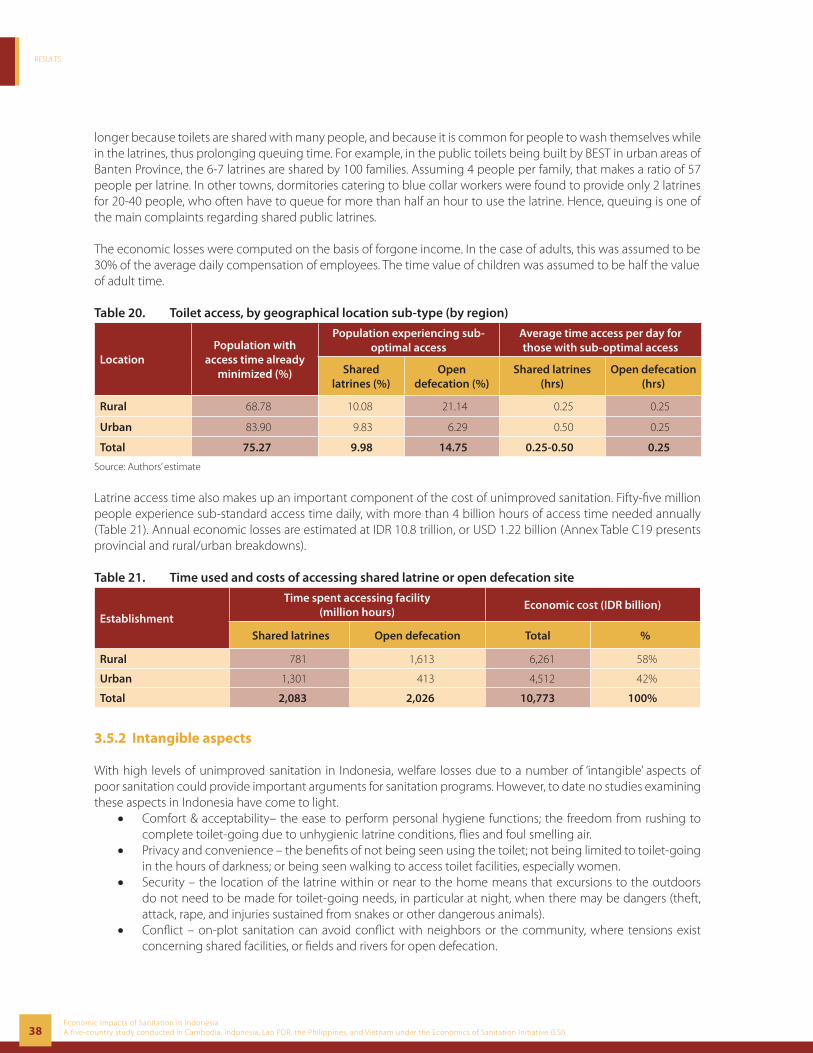
RESULTS
38Economic Impacts of Sanitation in IndonesiaA five-country study conducted in Cambodia, Indonesia, Lao PDR, the Philippines, and Vietnam under the Economics of Sanitation Initiative (ESI)
longer because toilets are shared with many people, and because it is common for people to wash themselves while in the latrines, thus prolonging queuing time. For example, in the public toilets being built by BEST in urban areas of Banten Province, the 6-7 latrines are shared by 100 families. Assuming 4 people per family, that makes a ratio of 57 people per latrine. In other towns, dormitories catering to blue collar workers were found to provide only 2 latrines for 20-40 people, who often have to queue for more than half an hour to use the latrine. Hence, queuing is one of the main complaints regarding shared public latrines.
The economic losses were computed on the basis of forgone income. In the case of adults, this was assumed to be 30% of the average daily compensation of employees. The time value of children was assumed to be half the value of adult time.
Table 20. Toilet access, by geographical location sub-type (by region)
LocationPopulation with
access time already minimized (%)
Population experiencing sub-optimal access
Average time access per day for those with sub-optimal access
Shared latrines (%)
Open defecation (%)
Shared latrines (hrs)
Open defecation (hrs)
Rural 68.78 10.08 21.14 0.25 0.25
Urban 83.90 9.83 6.29 0.50 0.25
Total 75.27 9.98 14.75 0.25-0.50 0.25
Source: Authors’ estimate
Latrine access time also makes up an important component of the cost of unimproved sanitation. Fifty-fi ve million people experience sub-standard access time daily, with more than 4 billion hours of access time needed annually (Table 21). Annual economic losses are estimated at IDR 10.8 trillion, or USD 1.22 billion (Annex Table C19 presents provincial and rural/urban breakdowns).
Table 21. Time used and costs of accessing shared latrine or open defecation site
Establishment
Time spent accessing facility(million hours)
Economic cost (IDR billion)
Shared latrines Open defecation Total %
Rural 781 1,613 6,261 58%
Urban 1,301 413 4,512 42%
Total 2,083 2,026 10,773 100%
3.5.2 Intangible aspects
With high levels of unimproved sanitation in Indonesia, welfare losses due to a number of ‘intangible’ aspects of poor sanitation could provide important arguments for sanitation programs. However, to date no studies examining these aspects in Indonesia have come to light.
• Comfort & acceptability– the ease to perform personal hygiene functions; the freedom from rushing to complete toilet-going due to unhygienic latrine conditions, fl ies and foul smelling air.
• Privacy and convenience – the benefi ts of not being seen using the toilet; not being limited to toilet-going in the hours of darkness; or being seen walking to access toilet facilities, especially women.
• Security – the location of the latrine within or near to the home means that excursions to the outdoors do not need to be made for toilet-going needs, in particular at night, when there may be dangers (theft, attack, rape, and injuries sustained from snakes or other dangerous animals).
• Confl ict – on-plot sanitation can avoid confl ict with neighbors or the community, where tensions exist concerning shared facilities, or fi elds and rivers for open defecation.
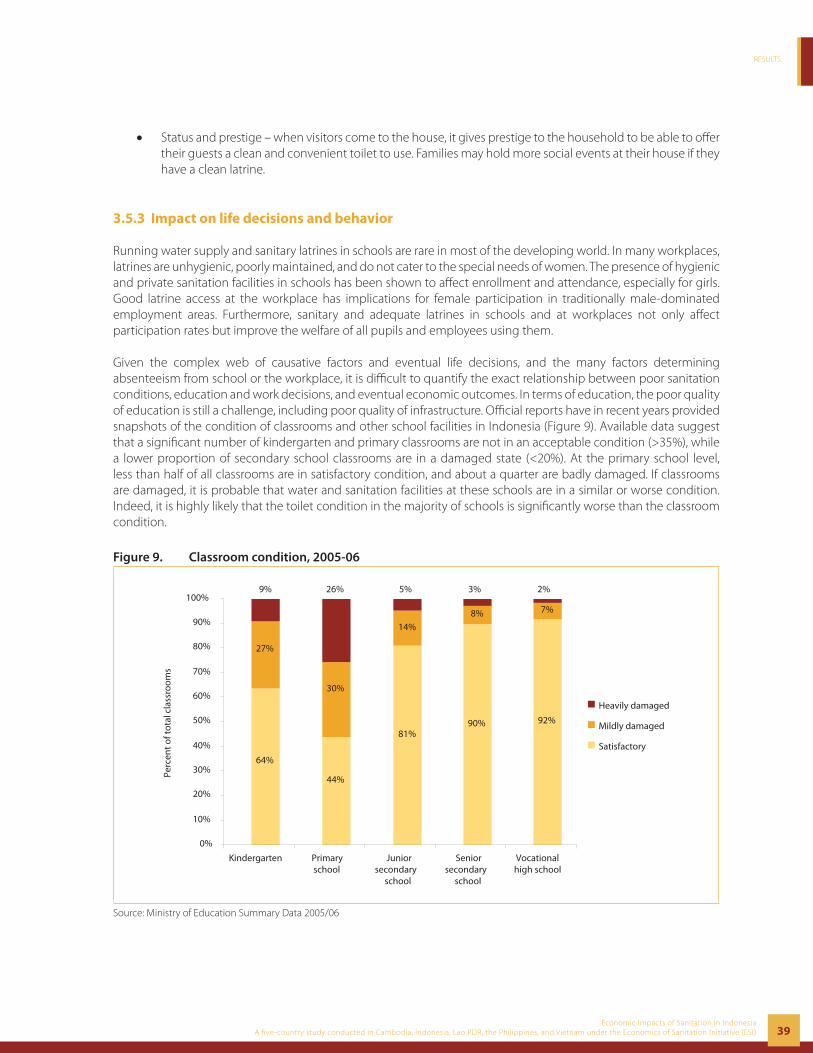
RESULTS
39Economic Impacts of Sanitation in Indonesia
A five-country study conducted in Cambodia, Indonesia, Lao PDR, the Philippines, and Vietnam under the Economics of Sanitation Initiative (ESI)
• Status and prestige – when visitors come to the house, it gives prestige to the household to be able to off er their guests a clean and convenient toilet to use. Families may hold more social events at their house if they have a clean latrine.
3.5.3 Impact on life decisions and behavior
Running water supply and sanitary latrines in schools are rare in most of the developing world. In many workplaces, latrines are unhygienic, poorly maintained, and do not cater to the special needs of women. The presence of hygienic and private sanitation facilities in schools has been shown to aff ect enrollment and attendance, especially for girls. Good latrine access at the workplace has implications for female participation in traditionally male-dominated employment areas. Furthermore, sanitary and adequate latrines in schools and at workplaces not only aff ect participation rates but improve the welfare of all pupils and employees using them.
Given the complex web of causative factors and eventual life decisions, and the many factors determining absenteeism from school or the workplace, it is diffi cult to quantify the exact relationship between poor sanitation conditions, education and work decisions, and eventual economic outcomes. In terms of education, the poor quality of education is still a challenge, including poor quality of infrastructure. Offi cial reports have in recent years provided snapshots of the condition of classrooms and other school facilities in Indonesia (Figure 9). Available data suggest that a signifi cant number of kindergarten and primary classrooms are not in an acceptable condition (>35%), while a lower proportion of secondary school classrooms are in a damaged state (<20%). At the primary school level, less than half of all classrooms are in satisfactory condition, and about a quarter are badly damaged. If classrooms are damaged, it is probable that water and sanitation facilities at these schools are in a similar or worse condition. Indeed, it is highly likely that the toilet condition in the majority of schools is signifi cantly worse than the classroom condition.
Figure 9. Classroom condition, 2005-06
64%
27%
9%
44%
30%
26%
81%
14%
5%
90%
8%
3%
92%
7%
2%
0%
10%
20%
30%
40%
50%
60%
70%
80%
90%
100%
Perc
ent o
f tot
al c
lass
room
s
Kindergarten Primaryschool
Juniorsecondary
school
Seniorsecondary
school
Vocationalhigh school
Heavily damaged
Mildly damaged
Satisfactory
Source: Ministry of Education Summary Data 2005/06
RESULTS
40Economic Impacts of Sanitation in IndonesiaA five-country study conducted in Cambodia, Indonesia, Lao PDR, the Philippines, and Vietnam under the Economics of Sanitation Initiative (ESI)
There are no data on toilet or clean water access at schools in Indonesia. Some anecdotal information is available, such as the report of consultants on the Indonesia School Improvement Grants Program (SIGP) who, visiting potential grantee schools in Pandeglang (West Java), observed that in almost all schools, toilets and washrooms were out of order. Those which were still working were inadequate in number to cater for the number of students using them. On average there were 2 toilets per school. Lack of clean water access was also observed, with students at many schools being forced to use streams or fi sh ponds near the school for toilet needs, posing particular problems during the rainy season.
In spite of poor classroom conditions, however, offi cial statistics show primary school enrollment rates in Indonesia to be relatively high, with no diff erence in enrollment between boys and girls (93% for both girls and boys in 2005). A higher proportion of boys complete primary school, however, and there is higher drop out rate for girls than for boys. On the other hand, despite relatively better quality of classrooms and facilities, enrolment rates at junior (65%) and senior secondary (42%) school are signifi cantly lower than at primary school. This drop-out can be attributed to various contributing factors; but note that, at these older ages, toilet availability and condition become relatively more important for children, especially girls.
A survey in 1999 indicated sickness, having to work/earn money, having to help with household chores, and having been punished as the main reasons for missing schools days. The reasons for dropping out or not attending school include parents’ low income, student laziness, having to work, having had enough education, and the school being too far away. The condition of school facilities was not cited among the main reasons for missing school days or dropping out of school, although poor water and sanitation is unlikely to have been provided as a response option in school surveys.
Lack of data is also encountered in terms of work participation, and this study did not explore this issue further.
3.6 Tourism impacts
Tourism is a key sector in Indonesia, providing IDR 39.7 trillion (USD 4.5 billion) in revenue in 2006, an important source of local government tax income, as well as jobs for 6.1 million Indonesians (7% of total jobs). In 2006, almost 5 million foreign visitors traveled to Indonesia, 57% for holidays, 38% for business, and 5% for other purposes. The tourist industry is expected to grow by 3.6% in 2007, increasing to 6.4% per annum from 2008 to 2015.
The number of tourists choosing Indonesia for their holidays is related, among other things, to the general sanitary conditions of the country, such as the quality of water resources; quality of outdoor environment (smell, sightliness); food safety (hygiene in food preparation); general availability of toilets off ering comfort and privacy in hotels, restaurants, and bus stations; and the related health risks of all the above. Better sanitary conditions will attract ‘high-value’ tourists, that is, those who are willing to pay more for their holiday. Currently, foreign tourists spend on average IDR 882,800 (USD 100) per day, and stay on average 9 days, giving an average revenue per tourist visit of IDR 7.9 million (USD 900).
Economic losses are refl ected by the gap between current tourist revenues and the tourist revenues that would be possible at signifi cantly higher tourist visit numbers, such as those experienced by neighboring countries with higher visit rates. The current hotel occupancy rate of 45% is low, and is assumed, therefore, in the mid-term, to grow to 80%. The analysis conservatively assumes constant hotel capacity over the same time period. Assuming that 5% of these revenue gains are attributable to improved sanitation, present poor sanitation conditions are estimated to contribute IDR 1,465 billion (USD 166 million) in losses annually (Annex Table C20 provides provincial breakdown).
RESULTS
41Economic Impacts of Sanitation in Indonesia
A five-country study conducted in Cambodia, Indonesia, Lao PDR, the Philippines, and Vietnam under the Economics of Sanitation Initiative (ESI)
3.7 Sanitation Markets
In addition to averted losses, improved sanitation and hygiene means a shift in demand for hygiene-related products such as latrines, soap and toilet paper. Improved toilet systems leads to an increase in demand for construction materials, and improved treatment and disposal leads to increased demand for sludge removal services.
Table 22 shows the potential market size for sanitation inputs for the construction of latrines. The analysis assumes sanitation improvement in some 2.1 million rural households and 170,000 urban households annually to meet the MDG target in 2015, with the majority constructing latrines with septic tanks (soak pits). Using these assumptions, the value of demand for materials is worth at least IDR 2.4 trillion (USD 274 million) annually.
Table 22. Sanitation input market values, construction (IDR billion)
Areas receiving improvement
Simple pit latrine
VIP Septic tank Simple EcoSan
Piped sewer connection
Total
Coverage received (% of total)
Rural households (of 2.1 million/year)
20% 10% 60% 5% 5% 100%
Urban households(of 170,000/year)
5% 10% 75% 5% 5% 100%
Value (IDR billion)
Rural 155.4 173.0 1,277.4 21.2 21.2 1,650.8
Urban 15.9 60.9 678.0 7.9 7.9 768.0
Total 171.3 233.9 1,955.4 29.1 29.1 2,418.9
Improvement in hygiene means an increase in the use of hygienic products, including soap and toilet paper. An increase of 40% in the use of soap by rural households and 20% by urban households results in an increase in demand for soap worth IDR 630 billion (USD 71 million) annually (Table 23). A 25% increase in households using toilet paper could yield an additional IDR 313 billion (USD 24 million) demand for toilet paper annually. Proper handling of pits and septic tanks requires sludge to be removed at least every two years; leading to market growth of IDR 2 trillion (USD 227 million) per year in sludge removal services.
Table 23. Sanitation input market values, hygiene products and improved treatment
Areas receiving improvement Soap Toilet paper Sludge removal Total
Coverage
% rural households 40% 0% 25% 65%
% urban households 20% 25% 25% 75%
Value (IDR billion)
Rural 459.1 0.0 538.5 997.6
Urban 167.7 211.9 1,465.4 1,853.9
Total 626.8 211.9 2,004.0 2,842.6
In addition to expanding the market for sanitation inputs, improved sanitation includes re-use of waste. The reuse of human waste for fertilizer or biogas production cannot be assumed to be population-wide, given cultural attitudes towards handling and re-use of human waste, and low practical feasibility in many locations. Success often depends on local perceptions of the expected returns on re-using of human waste, whether it be for biogas or fertilizer. The
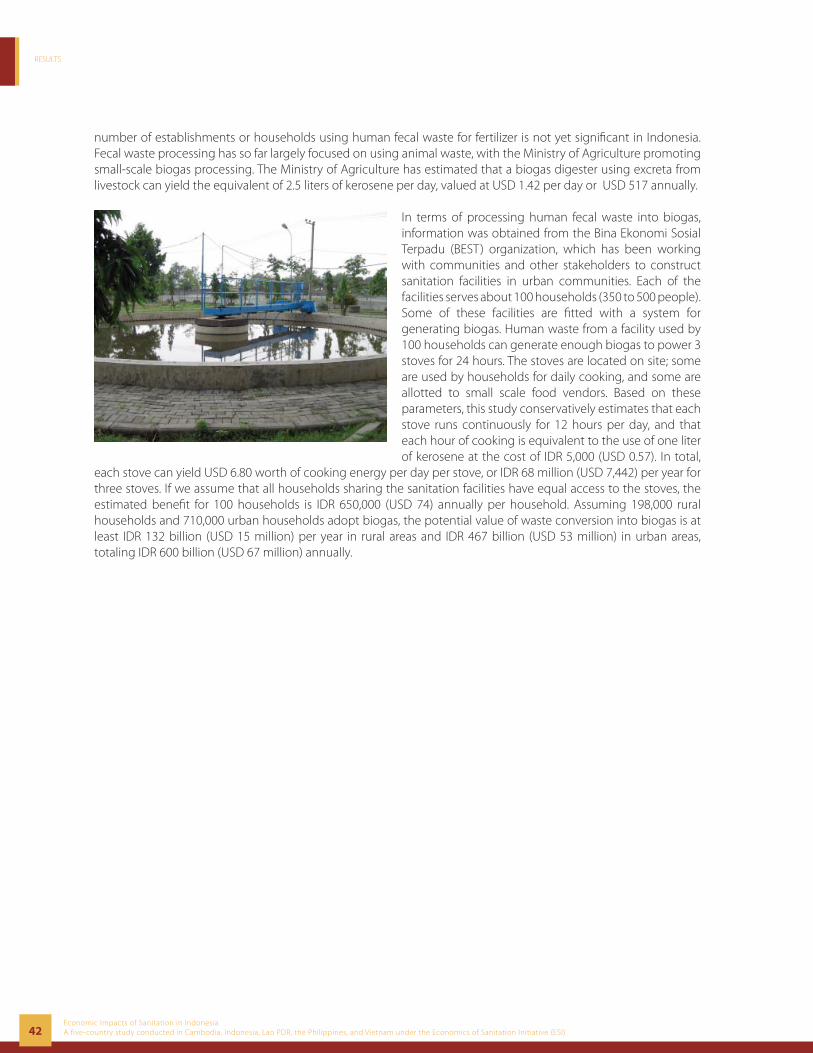
RESULTS
42Economic Impacts of Sanitation in IndonesiaA five-country study conducted in Cambodia, Indonesia, Lao PDR, the Philippines, and Vietnam under the Economics of Sanitation Initiative (ESI)
number of establishments or households using human fecal waste for fertilizer is not yet signifi cant in Indonesia. Fecal waste processing has so far largely focused on using animal waste, with the Ministry of Agriculture promoting small-scale biogas processing. The Ministry of Agriculture has estimated that a biogas digester using excreta from livestock can yield the equivalent of 2.5 liters of kerosene per day, valued at USD 1.42 per day or USD 517 annually.
In terms of processing human fecal waste into biogas, information was obtained from the Bina Ekonomi Sosial Terpadu (BEST) organization, which has been working with communities and other stakeholders to construct sanitation facilities in urban communities. Each of the facilities serves about 100 households (350 to 500 people). Some of these facilities are fi tted with a system for generating biogas. Human waste from a facility used by 100 households can generate enough biogas to power 3 stoves for 24 hours. The stoves are located on site; some are used by households for daily cooking, and some are allotted to small scale food vendors. Based on these parameters, this study conservatively estimates that each stove runs continuously for 12 hours per day, and that each hour of cooking is equivalent to the use of one liter of kerosene at the cost of IDR 5,000 (USD 0.57). In total,
each stove can yield USD 6.80 worth of cooking energy per day per stove, or IDR 68 million (USD 7,442) per year for three stoves. If we assume that all households sharing the sanitation facilities have equal access to the stoves, the estimated benefi t for 100 households is IDR 650,000 (USD 74) annually per household. Assuming 198,000 rural households and 710,000 urban households adopt biogas, the potential value of waste conversion into biogas is at least IDR 132 billion (USD 15 million) per year in rural areas and IDR 467 billion (USD 53 million) in urban areas, totaling IDR 600 billion (USD 67 million) annually.

RECOMMENDATIONS
43Economic Impacts of Sanitation in Indonesia
A five-country study conducted in Cambodia, Indonesia, Lao PDR, the Philippines, and Vietnam under the Economics of Sanitation Initiative (ESI)
Recommendations4
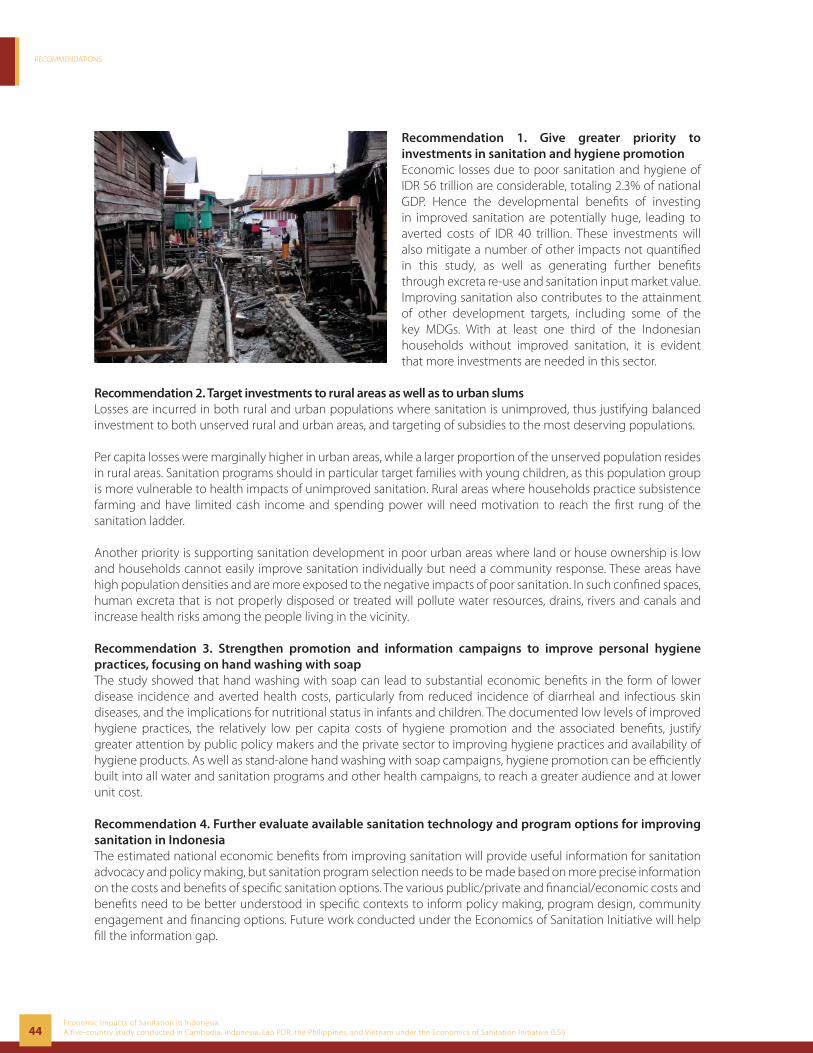
RECOMMENDATIONS
44Economic Impacts of Sanitation in IndonesiaA five-country study conducted in Cambodia, Indonesia, Lao PDR, the Philippines, and Vietnam under the Economics of Sanitation Initiative (ESI)
Recommendation 1. Give greater priority to investments in sanitation and hygiene promotionEconomic losses due to poor sanitation and hygiene of IDR 56 trillion are considerable, totaling 2.3% of national GDP. Hence the developmental benefi ts of investing in improved sanitation are potentially huge, leading to averted costs of IDR 40 trillion. These investments will also mitigate a number of other impacts not quantifi ed in this study, as well as generating further benefi ts through excreta re-use and sanitation input market value. Improving sanitation also contributes to the attainment of other development targets, including some of the key MDGs. With at least one third of the Indonesian households without improved sanitation, it is evident that more investments are needed in this sector.
Recommendation 2. Target investments to rural areas as well as to urban slumsLosses are incurred in both rural and urban populations where sanitation is unimproved, thus justifying balanced investment to both unserved rural and urban areas, and targeting of subsidies to the most deserving populations.
Per capita losses were marginally higher in urban areas, while a larger proportion of the unserved population resides in rural areas. Sanitation programs should in particular target families with young children, as this population group is more vulnerable to health impacts of unimproved sanitation. Rural areas where households practice subsistence farming and have limited cash income and spending power will need motivation to reach the fi rst rung of the sanitation ladder.
Another priority is supporting sanitation development in poor urban areas where land or house ownership is low and households cannot easily improve sanitation individually but need a community response. These areas have high population densities and are more exposed to the negative impacts of poor sanitation. In such confi ned spaces, human excreta that is not properly disposed or treated will pollute water resources, drains, rivers and canals and increase health risks among the people living in the vicinity.
Recommendation 3. Strengthen promotion and information campaigns to improve personal hygiene practices, focusing on hand washing with soapThe study showed that hand washing with soap can lead to substantial economic benefi ts in the form of lower disease incidence and averted health costs, particularly from reduced incidence of diarrheal and infectious skin diseases, and the implications for nutritional status in infants and children. The documented low levels of improved hygiene practices, the relatively low per capita costs of hygiene promotion and the associated benefi ts, justify greater attention by public policy makers and the private sector to improving hygiene practices and availability of hygiene products. As well as stand-alone hand washing with soap campaigns, hygiene promotion can be effi ciently built into all water and sanitation programs and other health campaigns, to reach a greater audience and at lower unit cost.
Recommendation 4. Further evaluate available sanitation technology and program options for improving sanitation in IndonesiaThe estimated national economic benefi ts from improving sanitation will provide useful information for sanitation advocacy and policy making, but sanitation program selection needs to be made based on more precise information on the costs and benefi ts of specifi c sanitation options. The various public/private and fi nancial/economic costs and benefi ts need to be better understood in specifi c contexts to inform policy making, program design, community engagement and fi nancing options. Future work conducted under the Economics of Sanitation Initiative will help fi ll the information gap.
ANNEXES
45Economic Impacts of Sanitation in Indonesia
A five-country study conducted in Cambodia, Indonesia, Lao PDR, the Philippines, and Vietnam under the Economics of Sanitation Initiative (ESI)
Annexes

ANNEXES
46Economic Impacts of Sanitation in IndonesiaA five-country study conducted in Cambodia, Indonesia, Lao PDR, the Philippines, and Vietnam under the Economics of Sanitation Initiative (ESI)
Annex A: Algorithms
A1. Aggregating equations
Total costs of sanitation and hygiene
C = CH + CW + CL + CU + CT (1)
Health-related costs of poor sanitation and hygiene
CH = CH_HC + CH_P + CH_D (2)
Water-related costs of poor sanitation and hygiene
CW = CW_Drink + CW_Domestic + CW_Fish (3)
User preference losses of poor sanitation and hygiene
CU = CU_T + CU_AS + CU_AW (4)
Tourism losses from poor sanitation
CT = CT_RL (5)
A2. Health costs related to poor sanitation and hygiene
Total health care costs
_ _ ii
CH HC CH HC= ∑ (6)
Health care cost per disease
_ i i i ih ih ihh
CH HC pop v phealthα β χ= ⋅ ⋅ ⋅ ⋅ ⋅∑ (7)
Total productivity costs
_ _ ii
CH P CH P= ∑ (8)
Productivity cost of disease type i
_ i i i iCH P pop dh ptimeα β= ⋅ ⋅ ⋅ ⋅ (9)
Total cost of premature death
_ _ ii
CH D CH D= ∑ (10)
Cost of premature death per disease
_ i ia ia aa
CH D death pdeathγ= ⋅ ⋅∑ (11)
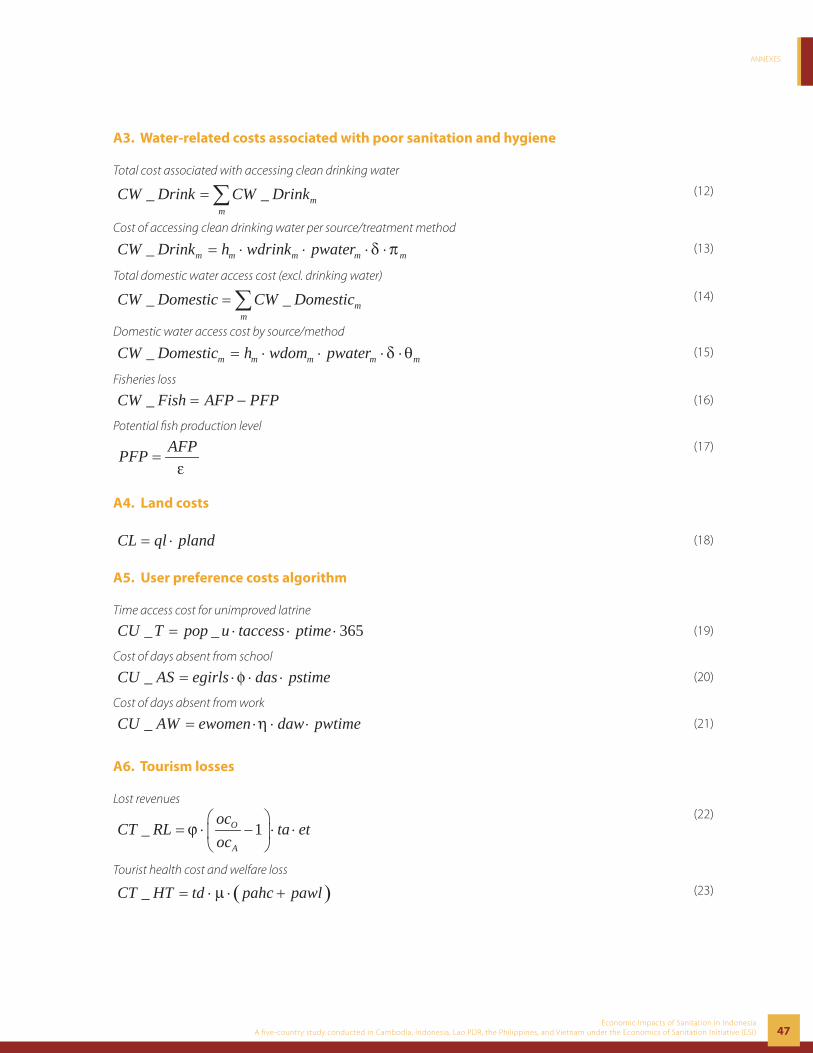
ANNEXES
47Economic Impacts of Sanitation in Indonesia
A five-country study conducted in Cambodia, Indonesia, Lao PDR, the Philippines, and Vietnam under the Economics of Sanitation Initiative (ESI)
A3. Water-related costs associated with poor sanitation and hygiene
Total cost associated with accessing clean drinking water
_ _ mm
CW Drink CW Drink= ∑ (12)
Cost of accessing clean drinking water per source/treatment method
_ m m m m mCW Drink h wdrink pwater δ π= ⋅ ⋅ ⋅ ⋅ (13)
Total domestic water access cost (excl. drinking water)
_ _ mm
CW Domestic CW Domestic= ∑ (14)
Domestic water access cost by source/method
_ m m m m mCW Domestic h wdom pwater δ θ= ⋅ ⋅ ⋅ ⋅ (15)
Fisheries loss
_CW Fish AFP PFP= − (16)
Potential fi sh production level
AFPPFPε
= (17)
A4. Land costs
CL ql pland= ⋅ (18)
A5. User preference costs algorithm
Time access cost for unimproved latrine
_ _ 365CU T pop u taccess ptime= ⋅ ⋅ ⋅ (19)
Cost of days absent from school
_CU AS egirls das pstimeφ= ⋅ ⋅ ⋅ (20)
Cost of days absent from work
_CU AW ewomen daw pwtimeη= ⋅ ⋅ ⋅ (21)
A6. Tourism losses
Lost revenues
_ 1O
A
ocCT RL ta et
ocϕ
⎛ ⎞= ⋅ − ⋅ ⋅⎜ ⎟
⎝ ⎠
(22)
Tourist health cost and welfare loss
( )_CT HT td pahc pawlµ= ⋅ ⋅ + (23)
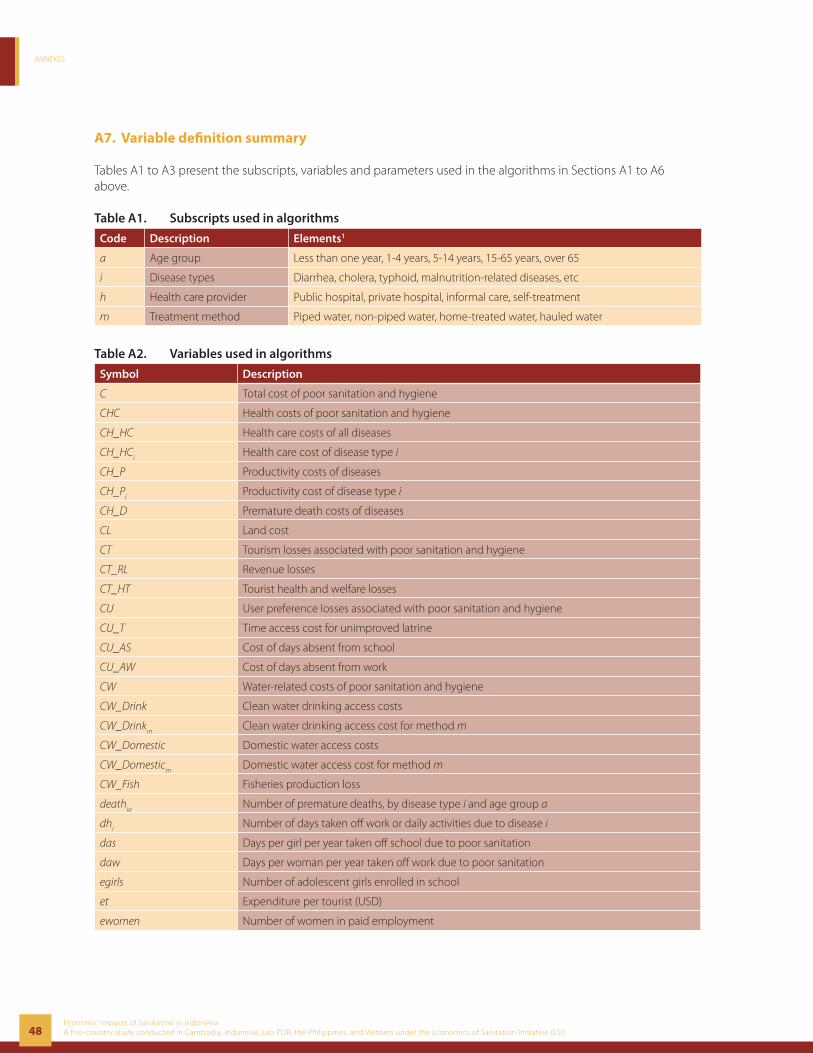
ANNEXES
48Economic Impacts of Sanitation in IndonesiaA five-country study conducted in Cambodia, Indonesia, Lao PDR, the Philippines, and Vietnam under the Economics of Sanitation Initiative (ESI)
A7. Variable defi nition summary
Tables A1 to A3 present the subscripts, variables and parameters used in the algorithms in Sections A1 to A6 above.
Table A1. Subscripts used in algorithms
Code Description Elements1
a Age group Less than one year, 1-4 years, 5-14 years, 15-65 years, over 65
i Disease types Diarrhea, cholera, typhoid, malnutrition-related diseases, etc
h Health care provider Public hospital, private hospital, informal care, self-treatment
m Treatment method Piped water, non-piped water, home-treated water, hauled water
Table A2. Variables used in algorithms
Symbol Description
C Total cost of poor sanitation and hygiene
CHC Health costs of poor sanitation and hygiene
CH_HC Health care costs of all diseases
CH_HCi
Health care cost of disease type i
CH_P Productivity costs of diseases
CH_Pi
Productivity cost of disease type i
CH_D Premature death costs of diseases
CL Land cost
CT Tourism losses associated with poor sanitation and hygiene
CT_RL Revenue losses
CT_HT Tourist health and welfare losses
CU User preference losses associated with poor sanitation and hygiene
CU_T Time access cost for unimproved latrine
CU_AS Cost of days absent from school
CU_AW Cost of days absent from work
CW Water-related costs of poor sanitation and hygiene
CW_Drink Clean water drinking access costs
CW_Drinkm
Clean water drinking access cost for method m
CW_Domestic Domestic water access costs
CW_Domesticm
Domestic water access cost for method m
CW_Fish Fisheries production loss
deathia
Number of premature deaths, by disease type i and age group a
dhi
Number of days taken off work or daily activities due to disease i
das Days per girl per year taken off school due to poor sanitation
daw Days per woman per year taken off work due to poor sanitation
egirls Number of adolescent girls enrolled in school
et Expenditure per tourist (USD)
ewomen Number of women in paid employment
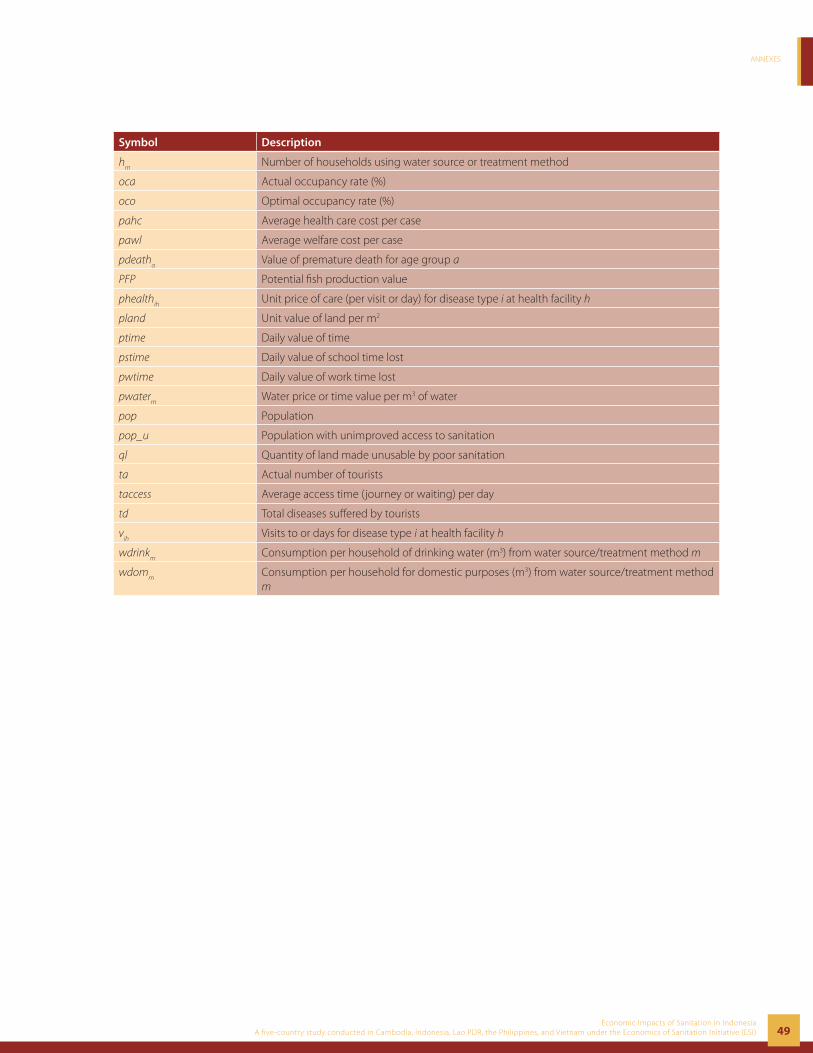
ANNEXES
49Economic Impacts of Sanitation in Indonesia
A five-country study conducted in Cambodia, Indonesia, Lao PDR, the Philippines, and Vietnam under the Economics of Sanitation Initiative (ESI)
Symbol Description
hm
Number of households using water source or treatment method
oca Actual occupancy rate (%)
oco Optimal occupancy rate (%)
pahc Average health care cost per case
pawl Average welfare cost per case
pdeatha
Value of premature death for age group a
PFP Potential fi sh production value
phealthih
Unit price of care (per visit or day) for disease type i at health facility h
pland Unit value of land per m2
ptime Daily value of time
pstime Daily value of school time lost
pwtime Daily value of work time lost
pwaterm
Water price or time value per m3 of water
pop Population
pop_u Population with unimproved access to sanitation
ql Quantity of land made unusable by poor sanitation
ta Actual number of tourists
taccess Average access time (journey or waiting) per day
td Total diseases suff ered by tourists
vih
Visits to or days for disease type i at health facility h
wdrinkm
Consumption per household of drinking water (m3) from water source/treatment method m
wdomm
Consumption per household for domestic purposes (m3) from water source/treatment method m

ANNEXES
50Economic Impacts of Sanitation in IndonesiaA five-country study conducted in Cambodia, Indonesia, Lao PDR, the Philippines, and Vietnam under the Economics of Sanitation Initiative (ESI)
Table A3. Parameters used in algorithms
Symbol Description
iα Incidence rate per person of disease type i
iβProportion of episodes attributed to poor sanitation for disease type i
ihχ Proportion of cases seeking care for disease type i and provider h
iaγ Proportion of deaths attributable to poor sanitation, by disease type i and age group a
δ Attributable water pollution to poor sanitation
ε Ratio of the fi sh production at the current DO level to fi sh production at the optimal DO level
φ Proportion of schools with inadequate sanitation facilities
η Proportion of work places with inadequate sanitation facilities
µ Proportion of diseases related to poor sanitation
mπImportance of averting drinking polluted water in relation to overall benefi ts of piped water supply; where
1mπ = for m ≠ piped water
mθImportance of averting using polluted water in domestic activities in relation to overall benefi ts of piped
water supply; where 1mθ = for m ≠ piped water
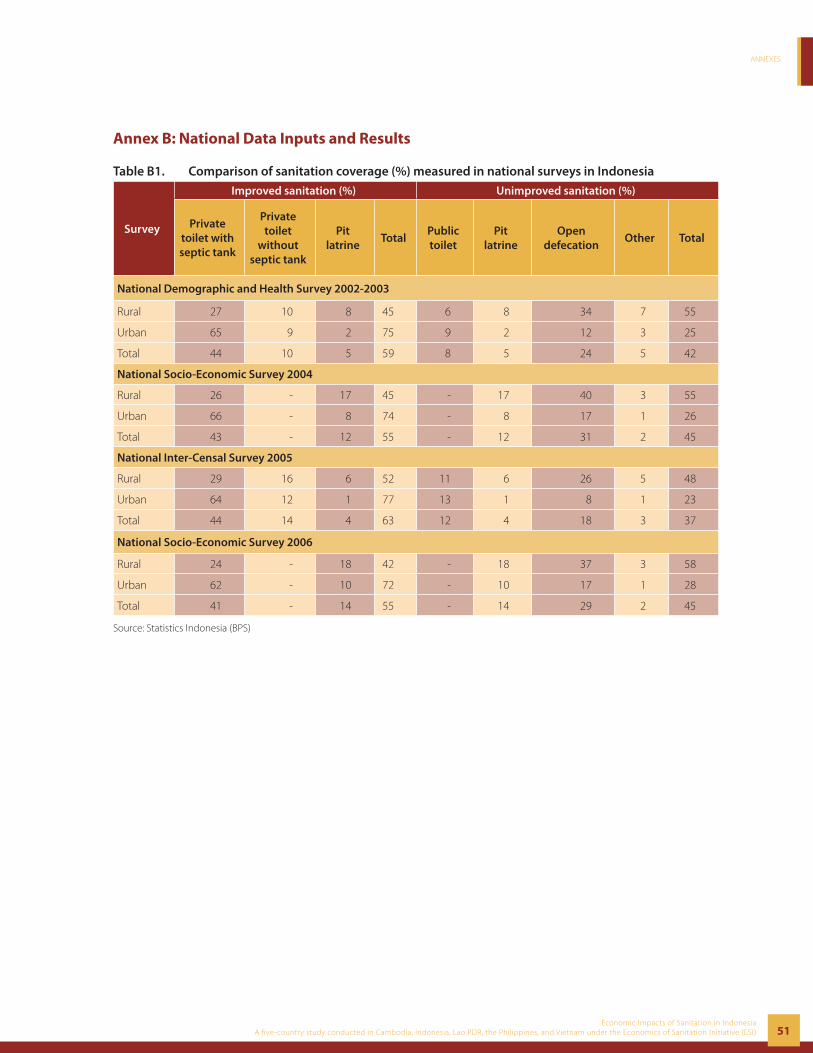
ANNEXES
51Economic Impacts of Sanitation in Indonesia
A five-country study conducted in Cambodia, Indonesia, Lao PDR, the Philippines, and Vietnam under the Economics of Sanitation Initiative (ESI)
Annex B: National Data Inputs and Results
Table B1. Comparison of sanitation coverage (%) measured in national surveys in Indonesia
Survey
Improved sanitation (%) Unimproved sanitation (%)
Private toilet with septic tank
Private toilet
without septic tank
Pit latrine
TotalPublic toilet
Pit latrine
Open defecation
Other Total
National Demographic and Health Survey 2002-2003
Rural 27 10 8 45 6 8 34 7 55
Urban 65 9 2 75 9 2 12 3 25
Total 44 10 5 59 8 5 24 5 42
National Socio-Economic Survey 2004
Rural 26 - 17 45 - 17 40 3 55
Urban 66 - 8 74 - 8 17 1 26
Total 43 - 12 55 - 12 31 2 45
National Inter-Censal Survey 2005
Rural 29 16 6 52 11 6 26 5 48
Urban 64 12 1 77 13 1 8 1 23
Total 44 14 4 63 12 4 18 3 37
National Socio-Economic Survey 2006
Rural 24 - 18 42 - 18 37 3 58
Urban 62 - 10 72 - 10 17 1 28
Total 41 - 14 55 - 14 29 2 45
Source: Statistics Indonesia (BPS)
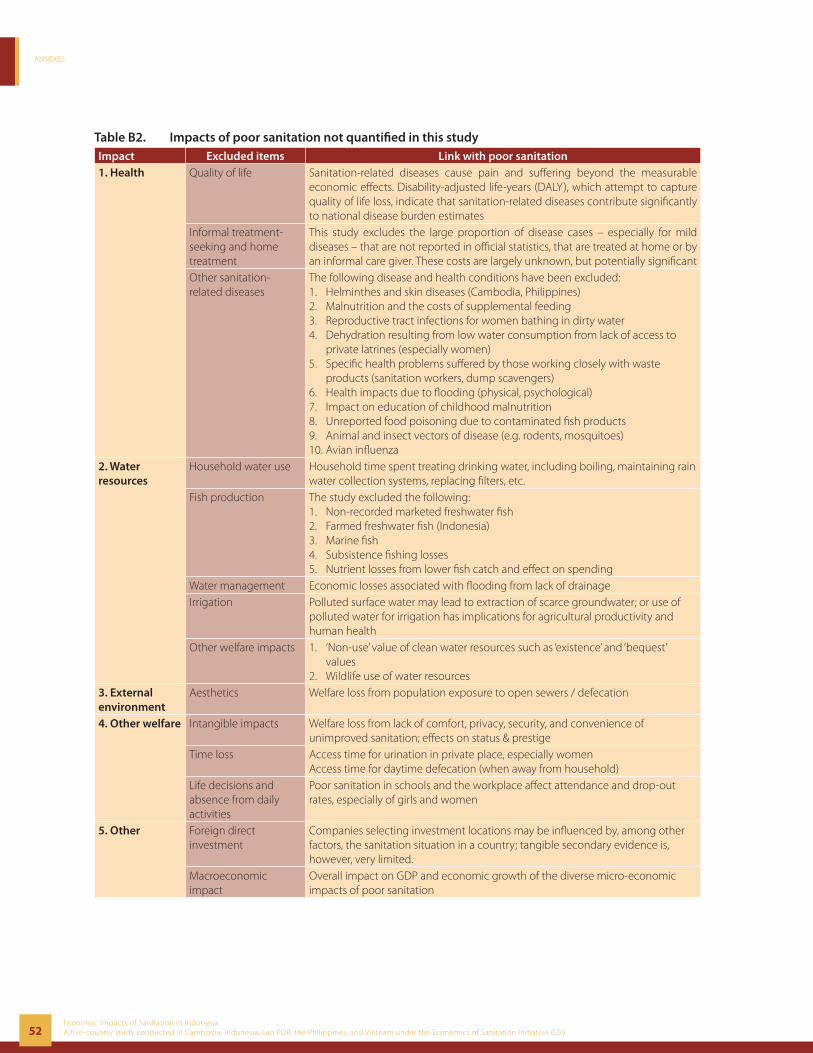
ANNEXES
52Economic Impacts of Sanitation in IndonesiaA five-country study conducted in Cambodia, Indonesia, Lao PDR, the Philippines, and Vietnam under the Economics of Sanitation Initiative (ESI)
Table B2. Impacts of poor sanitation not quantifi ed in this studyImpact Excluded items Link with poor sanitation1. Health Quality of life Sanitation-related diseases cause pain and suff ering beyond the measurable
economic eff ects. Disability-adjusted life-years (DALY), which attempt to capture quality of life loss, indicate that sanitation-related diseases contribute signifi cantly to national disease burden estimates
Informal treatment-seeking and home treatment
This study excludes the large proportion of disease cases – especially for mild diseases – that are not reported in offi cial statistics, that are treated at home or by an informal care giver. These costs are largely unknown, but potentially signifi cant
Other sanitation-related diseases
The following disease and health conditions have been excluded:1. Helminthes and skin diseases (Cambodia, Philippines)2. Malnutrition and the costs of supplemental feeding3. Reproductive tract infections for women bathing in dirty water4. Dehydration resulting from low water consumption from lack of access to
private latrines (especially women)5. Specifi c health problems suff ered by those working closely with waste
products (sanitation workers, dump scavengers)6. Health impacts due to fl ooding (physical, psychological)7. Impact on education of childhood malnutrition8. Unreported food poisoning due to contaminated fi sh products9. Animal and insect vectors of disease (e.g. rodents, mosquitoes)10. Avian infl uenza
2. Water resources
Household water use Household time spent treating drinking water, including boiling, maintaining rain water collection systems, replacing fi lters, etc.
Fish production The study excluded the following:1. Non-recorded marketed freshwater fi sh2. Farmed freshwater fi sh (Indonesia)3. Marine fi sh 4. Subsistence fi shing losses 5. Nutrient losses from lower fi sh catch and eff ect on spending
Water management Economic losses associated with fl ooding from lack of drainageIrrigation Polluted surface water may lead to extraction of scarce groundwater; or use of
polluted water for irrigation has implications for agricultural productivity and human health
Other welfare impacts 1. ‘Non-use’ value of clean water resources such as ‘existence’ and ‘bequest’ values
2. Wildlife use of water resources3. External environment
Aesthetics Welfare loss from population exposure to open sewers / defecation
4. Other welfare Intangible impacts Welfare loss from lack of comfort, privacy, security, and convenience of unimproved sanitation; eff ects on status & prestige
Time loss Access time for urination in private place, especially womenAccess time for daytime defecation (when away from household)
Life decisions and absence from daily activities
Poor sanitation in schools and the workplace aff ect attendance and drop-out rates, especially of girls and women
5. Other Foreign direct investment
Companies selecting investment locations may be infl uenced by, among other factors, the sanitation situation in a country; tangible secondary evidence is, however, very limited.
Macroeconomic impact
Overall impact on GDP and economic growth of the diverse micro-economic impacts of poor sanitation
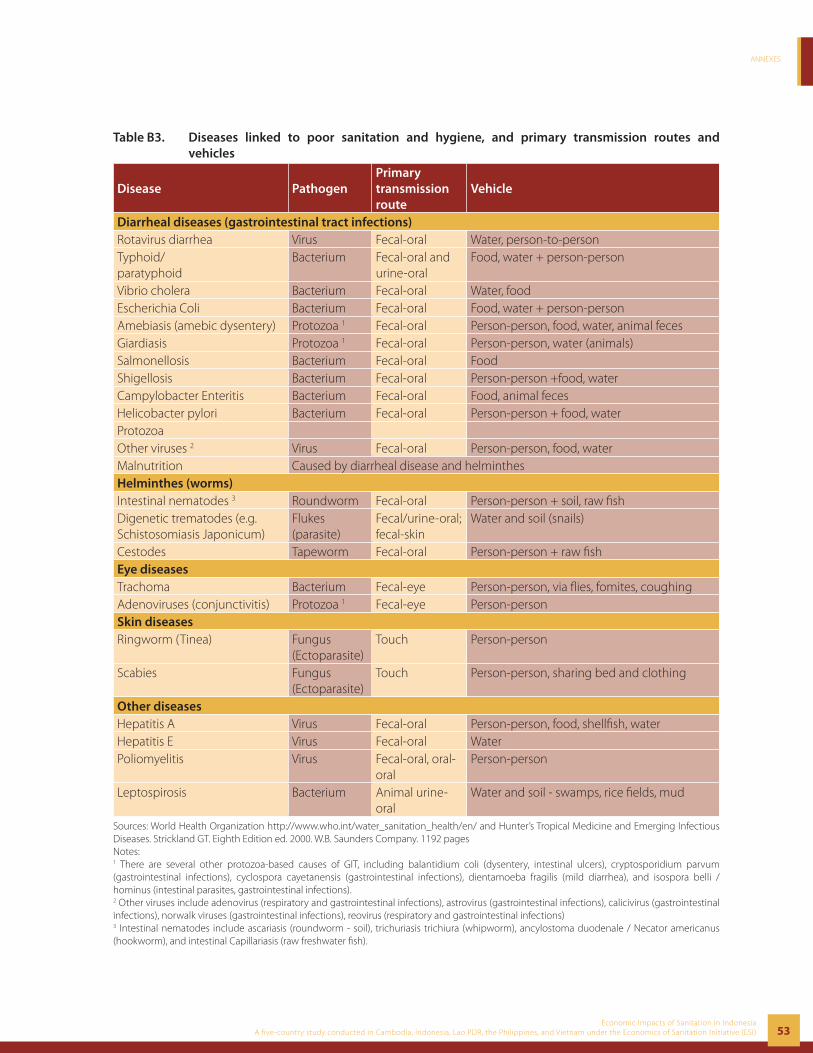
ANNEXES
53Economic Impacts of Sanitation in Indonesia
A five-country study conducted in Cambodia, Indonesia, Lao PDR, the Philippines, and Vietnam under the Economics of Sanitation Initiative (ESI)
Table B3. Diseases linked to poor sanitation and hygiene, and primary transmission routes and vehicles
Disease PathogenPrimary transmission route
Vehicle
Diarrheal diseases (gastrointestinal tract infections)Rotavirus diarrhea Virus Fecal-oral Water, person-to-personTyphoid/paratyphoid
Bacterium Fecal-oral and urine-oral
Food, water + person-person
Vibrio cholera Bacterium Fecal-oral Water, foodEscherichia Coli Bacterium Fecal-oral Food, water + person-personAmebiasis (amebic dysentery) Protozoa 1 Fecal-oral Person-person, food, water, animal fecesGiardiasis Protozoa 1 Fecal-oral Person-person, water (animals)Salmonellosis Bacterium Fecal-oral FoodShigellosis Bacterium Fecal-oral Person-person +food, waterCampylobacter Enteritis Bacterium Fecal-oral Food, animal fecesHelicobacter pylori Bacterium Fecal-oral Person-person + food, waterProtozoaOther viruses 2 Virus Fecal-oral Person-person, food, waterMalnutrition Caused by diarrheal disease and helminthesHelminthes (worms)Intestinal nematodes 3 Roundworm Fecal-oral Person-person + soil, raw fi shDigenetic trematodes (e.g. Schistosomiasis Japonicum)
Flukes (parasite)
Fecal/urine-oral; fecal-skin
Water and soil (snails)
Cestodes Tapeworm Fecal-oral Person-person + raw fi shEye diseasesTrachoma Bacterium Fecal-eye Person-person, via fl ies, fomites, coughingAdenoviruses (conjunctivitis) Protozoa 1 Fecal-eye Person-person Skin diseasesRingworm (Tinea) Fungus
(Ectoparasite)Touch Person-person
Scabies Fungus (Ectoparasite)
Touch Person-person, sharing bed and clothing
Other diseasesHepatitis A Virus Fecal-oral Person-person, food, shellfi sh, waterHepatitis E Virus Fecal-oral WaterPoliomyelitis Virus Fecal-oral, oral-
oralPerson-person
Leptospirosis Bacterium Animal urine-oral
Water and soil - swamps, rice fi elds, mud
Sources: World Health Organization http://www.who.int/water_sanitation_health/en/ and Hunter’s Tropical Medicine and Emerging Infectious Diseases. Strickland GT. Eighth Edition ed. 2000. W.B. Saunders Company. 1192 pagesNotes:1 There are several other protozoa-based causes of GIT, including balantidium coli (dysentery, intestinal ulcers), cryptosporidium parvum (gastrointestinal infections), cyclospora cayetanensis (gastrointestinal infections), dientamoeba fragilis (mild diarrhea), and isospora belli / hominus (intestinal parasites, gastrointestinal infections).2 Other viruses include adenovirus (respiratory and gastrointestinal infections), astrovirus (gastrointestinal infections), calicivirus (gastrointestinal infections), norwalk viruses (gastrointestinal infections), reovirus (respiratory and gastrointestinal infections)3 Intestinal nematodes include ascariasis (roundworm - soil), trichuriasis trichiura (whipworm), ancylostoma duodenale / Necator americanus (hookworm), and intestinal Capillariasis (raw freshwater fi sh).

ANNEXES
54Economic Impacts of Sanitation in IndonesiaA five-country study conducted in Cambodia, Indonesia, Lao PDR, the Philippines, and Vietnam under the Economics of Sanitation Initiative (ESI)
Table B4. Outpatients seeking treatment by provider type, all diseases
LocationPublic
hospitalPrivate
hospitalPrivate practice
Govern-ment health
center
Para-medic
Tradit-ional
healerMid-wife Other Total
Rural 6.2 2.5 17.1 42.7 23.6 2.3 0.7 4.8 100.0
Urban 10.1 6.5 30.8 34.6 11.9 1.8 0.5 3.8 100.0
Total 8.0 4.3 23.1 39.2 18.5 2.1 0.6 4.3 100.0
Source: Susenas 2006
Table B5. Disease treatment cost studies
Study (study year)Health service level or type
Currency Unit costs
Low Mid High
Diarrheal diseasesSimanjuntak et al (2001) Outpatient visits, North Jakarta
Primary (public) IDR 4,414 17,656 USD 0.50 2.00
Primary (private) IDR 8,828 88,280 USD 1.00 10.00
Karyana (2003) Outpatient visits, Tugu Selatan Primary (public health center)
Informal health care
IDR 5,000 USD 0.57
Self treatment IDR 250 1,620 10,000 USD 0.03 0.18 1.13
Transport cost IDR 500 3,000 8,000 USD 0.06 0.34 0.91 IDR 24,060 36,375 56,970 USD 2.73 4.12 6.45
Soeharno (2001) Outpatient visits Sidoarjo, East Java Primary (public health center)
Medicine IDR 25,116 43,933 76,752 USD 2.85 4.98 8.69
ORS, 2 days IDR 593 1,281 USD 0.07 0.15
ORS, 5 days IDR 1,443 USD 0.16
Antibiotics IDR 1,463 USD 0.17
Supomo (2001) Outpatient visits Sidoarjo, Central Java Primary (public health center)
Patient cost diarrhea
IDR 644 1,085 USD 0.07 0.12
Patient cost pneumonia
IDR 527 802 USD 0.06 0.09
Full treatment cost diarrhea
IDR 5,661 38,208 USD 0.64 4.33
Full treatment cost pneumonia
IDR 5,275 35,354 USD 0.60 4.00
Surahman (2001) Inpatient cost (private hospital)
Total out of pocket cost
IDR 4,204,852 USD 476.31
Sofyan (2004) Outpatient cost, Serang, Banten Primary (public health center)
IDR 8,516 15,315 USD 0.96 1.73
Ermawati, 2005 (2004) Inpatient cost, Tangerang, Banten (public hospital)
Severe (with complications)
IDR 827,195 1,288,158 1,827,038 USD 93.70 145.92 206.96
Non-severe (with/out complications)
IDR 454,401 454,401 800,344
USD 51.47 51.47 90.66
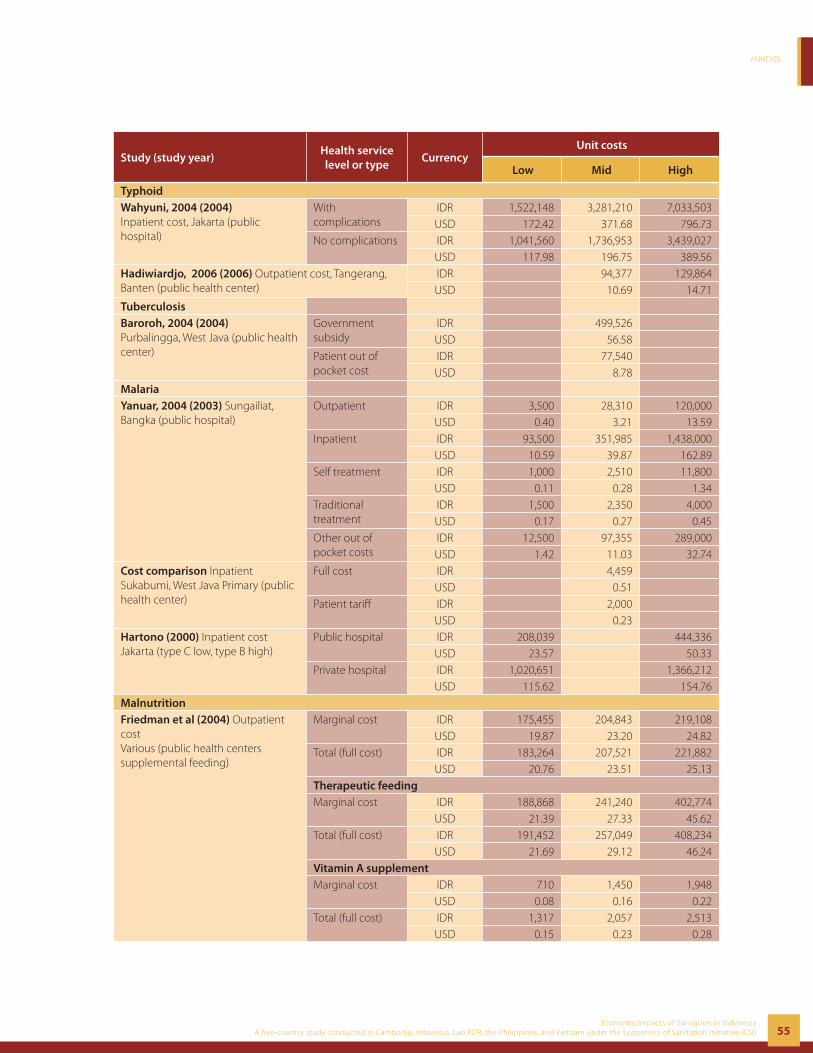
ANNEXES
55Economic Impacts of Sanitation in Indonesia
A five-country study conducted in Cambodia, Indonesia, Lao PDR, the Philippines, and Vietnam under the Economics of Sanitation Initiative (ESI)
Study (study year)Health service level or type
Currency Unit costs
Low Mid High
TyphoidWahyuni, 2004 (2004) Inpatient cost, Jakarta (public hospital)
With complications
IDR 1,522,148 3,281,210 7,033,503 USD 172.42 371.68 796.73
No complications IDR 1,041,560 1,736,953 3,439,027 USD 117.98 196.75 389.56
Hadiwiardjo, 2006 (2006) Outpatient cost, Tangerang, Banten (public health center)
IDR 94,377 129,864 USD 10.69 14.71
TuberculosisBaroroh, 2004 (2004) Purbalingga, West Java (public health center)
Government subsidy
IDR 499,526 USD 56.58
Patient out of pocket cost
IDR 77,540 USD 8.78
MalariaYanuar, 2004 (2003) Sungailiat, Bangka (public hospital)
Outpatient IDR 3,500 28,310 120,000 USD 0.40 3.21 13.59
Inpatient IDR 93,500 351,985 1,438,000 USD 10.59 39.87 162.89
Self treatment IDR 1,000 2,510 11,800 USD 0.11 0.28 1.34
Traditional treatment
IDR 1,500 2,350 4,000 USD 0.17 0.27 0.45
Other out of pocket costs
IDR 12,500 97,355 289,000 USD 1.42 11.03 32.74
Cost comparison Inpatient Sukabumi, West Java Primary (public health center)
Full cost IDR 4,459 USD 0.51
Patient tariff IDR 2,000 USD 0.23
Hartono (2000) Inpatient costJakarta (type C low, type B high)
Public hospital IDR 208,039 444,336 USD 23.57 50.33
Private hospital IDR 1,020,651 1,366,212 USD 115.62 154.76
MalnutritionFriedman et al (2004) Outpatient costVarious (public health centers supplemental feeding)
Marginal cost IDR 175,455 204,843 219,108 USD 19.87 23.20 24.82
Total (full cost) IDR 183,264 207,521 221,882 USD 20.76 23.51 25.13
Therapeutic feedingMarginal cost IDR 188,868 241,240 402,774
USD 21.39 27.33 45.62 Total (full cost) IDR 191,452 257,049 408,234
USD 21.69 29.12 46.24 Vitamin A supplementMarginal cost IDR 710 1,450 1,948
USD 0.08 0.16 0.22 Total (full cost) IDR 1,317 2,057 2,513
USD 0.15 0.23 0.28
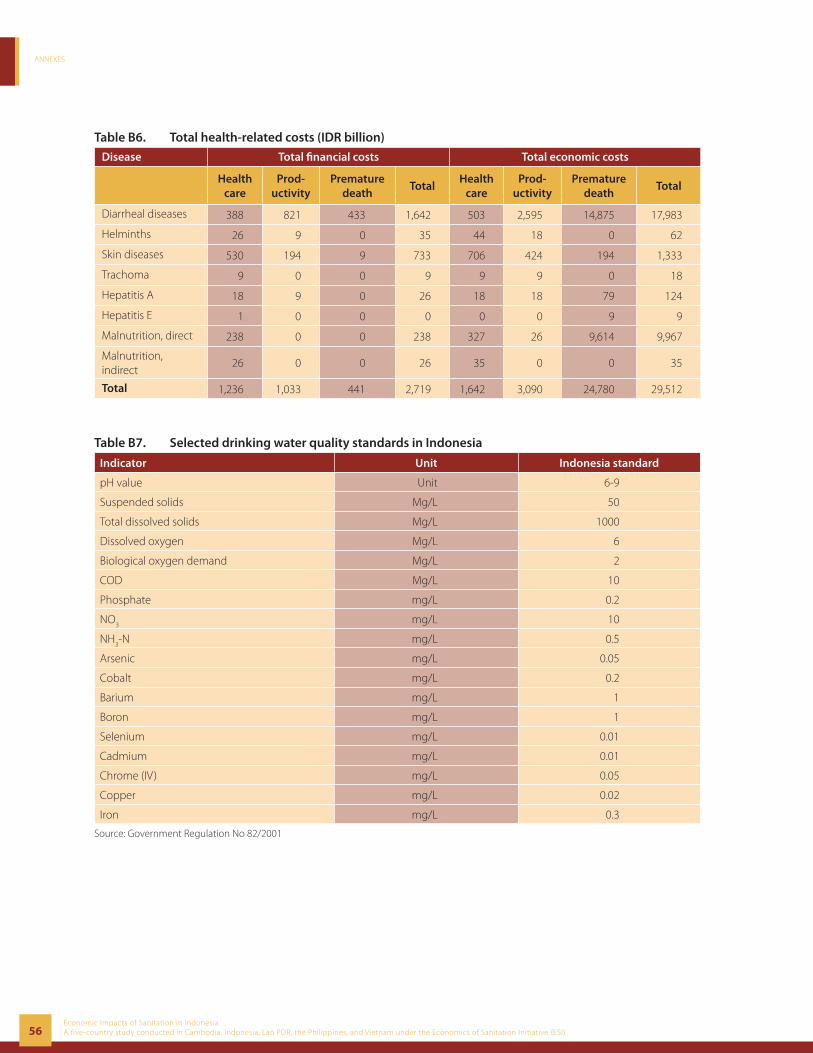
ANNEXES
56Economic Impacts of Sanitation in IndonesiaA five-country study conducted in Cambodia, Indonesia, Lao PDR, the Philippines, and Vietnam under the Economics of Sanitation Initiative (ESI)
Table B6. Total health-related costs (IDR billion)
Disease Total fi nancial costs Total economic costs
Health care
Prod-uctivity
Premature death
TotalHealth
careProd-
uctivityPremature
deathTotal
Diarrheal diseases 388 821 433 1,642 503 2,595 14,875 17,983
Helminths 26 9 0 35 44 18 0 62
Skin diseases 530 194 9 733 706 424 194 1,333
Trachoma 9 0 0 9 9 9 0 18
Hepatitis A 18 9 0 26 18 18 79 124
Hepatitis E 1 0 0 0 0 0 9 9
Malnutrition, direct 238 0 0 238 327 26 9,614 9,967
Malnutrition, indirect
26 0 0 26 35 0 0 35
Total 1,236 1,033 441 2,719 1,642 3,090 24,780 29,512
Table B7. Selected drinking water quality standards in Indonesia
Indicator Unit Indonesia standard
pH value Unit 6-9
Suspended solids Mg/L 50
Total dissolved solids Mg/L 1000
Dissolved oxygen Mg/L 6
Biological oxygen demand Mg/L 2
COD Mg/L 10
Phosphate mg/L 0.2
NO3
mg/L 10
NH3-N mg/L 0.5
Arsenic mg/L 0.05
Cobalt mg/L 0.2
Barium mg/L 1
Boron mg/L 1
Selenium mg/L 0.01
Cadmium mg/L 0.01
Chrome (IV) mg/L 0.05
Copper mg/L 0.02
Iron mg/L 0.3
Source: Government Regulation No 82/2001
ANNEXES
57Economic Impacts of Sanitation in Indonesia
A five-country study conducted in Cambodia, Indonesia, Lao PDR, the Philippines, and Vietnam under the Economics of Sanitation Initiative (ESI)
Annex C: Provincial Data Inputs and Results
Table C1. Population size by province and region in Indonesia, 2006
Province Population Households
Rural Urban Total Average size
(2005)Total
SumatraNAD 3,028,642 1,023,912 4,052,553 3.8 1,055,058 North Sumatra 6,832,531 5,786,468 12,618,998 4.3 2,962,612 West Sumatra 3,247,684 1,386,478 4,634,161 4.0 1,151,036 R i a u 3,021,262 1,743,415 4,764,677 3.9 1,236,319 J a m b i 1,954,587 729,883 2,684,470 3.9 693,092 South Sumatra 4,588,790 2,314,275 6,903,065 3.9 1,763,500 Bengkulu 1,122,646 446,148 1,568,794 3.8 411,678 Lampung 5,701,178 1,513,202 7,214,380 3.9 1,832,252 Bangka Belitung 635,011 440,270 1,075,281 4.0 265,636 Riau Archipelago 275,917 1,062,546 1,338,463 3.9 347,299 Java-BaliJakarta 0 8,966,706 8,966,706 3.5 2,529,972 West Java 19,203,877 20,443,459 39,647,335 3.3 12,029,882 Central Java 19,132,359 12,999,103 32,131,462 3.7 8,705,992 Yogyakarta 1,385,132 2,004,996 3,390,128 3.2 1,052,353 East Java 21,656,344 14,950,066 36,606,411 3.5 10,602,134 Banten 4,359,731 4,867,719 9,227,450 3.7 2,481,957 B a l i 1,692,353 1,740,619 3,432,972 3.7 921,483 Nusa TenggaraWest Nusa Tenggara 2,731,237 1,489,160 4,220,397 3.3 1,262,645 East Nusa Tenggara 3,677,128 679,875 4,357,003 4.6 942,879 KalimantanWest Kalimantan 2,966,742 1,092,898 4,059,639 4.1 980,675 Central Kalimantan 1,369,853 557,111 1,926,964 3.6 541,895 South Kalimantan 2,072,930 1,274,374 3,347,305 3.6 918,978 East Kalimantan 1,279,230 1,658,451 2,937,680 3.7 783,433 SulawesiNorth Sulawesi 1,350,493 804,897 2,155,390 3.4 632,735 Central Sulawesi 1,856,156 463,240 2,319,396 4.0 582,941 South Sulawesi 5,295,299 2,286,499 7,581,797 4.1 1,829,339 Southeast Sulawesi 1,566,367 436,311 2,002,678 4.1 488,319 Gorontalo 696,586 245,232 941,818 3.4 274,752 West Sulawesi 783,258 195,477 978,736 4.1 236,150 Maluku and PapuaMaluku 906,338 365,226 1,271,564 5.0 256,632 North Maluku 678,544 220,098 898,642 5.5 163,528 West Papua 485,518 171,448 656,965 3.6 184,936 Papua 1,416,045 500,039 1,916,084 3.6 539,379 National 126,969,767 94,859,597 221,829,364 3.7 60,661,472
Source: Authors’ projection for 2006, based on 2005 Intercensal Survey (Statistics Indonesia), adjusted by average population growth 2000-2005 by province from Indonesia Yearly Statistics (Statistics Indonesia) 2005/2006.
ANNEXES
58Economic Impacts of Sanitation in IndonesiaA five-country study conducted in Cambodia, Indonesia, Lao PDR, the Philippines, and Vietnam under the Economics of Sanitation Initiative (ESI)
Table C2. Sanitation coverage by province and rural/urban grouping
Province Location
Improved sanitation % Unimproved sanitation %
All %Septic tank
Pit latrine
TotalWater body
garden, fi eld, beach
Pit latrine
Other Total
NAD Rural 24.8 15.5 40.3 39.4 15.5 4.7 59.7 100.0Urban 68.5 9.4 78.0 11.6 9.4 1.0 22.1 100.0Total 34.3 14.2 48.5 33.4 14.2 3.9 51.5 100.0
North Sumatra Rural 28.5 18.9 47.4 27.4 18.9 6.2 52.6 100.0Urban 71.5 9.3 80.8 7.5 9.3 2.4 19.2 100.0Total 47.2 14.7 62.0 18.8 14.7 4.5 38.0 100.0
West Sumatra Rural 19.7 8.7 28.4 59.6 8.7 3.3 71.6 100.0Urban 63.7 7.2 70.9 20.0 7.2 1.9 29.1 100.0Total 33.4 8.2 41.6 47.3 8.2 2.9 58.4 100.0
R i a u Rural 1.1 35.5 36.6 24.1 35.5 3.8 63.4 100.0Urban 70.9 11.7 82.6 5.5 11.7 0.2 17.4 100.0Total 36.0 23.6 59.6 14.8 23.6 2.0 40.4 100.0
J a m b i Rural 19.5 16.6 36.1 45.1 16.6 2.2 63.9 100.0Urban 65.4 8.6 74.1 16.2 8.6 1.1 25.9 100.0Total 32.0 14.5 46.4 37.2 14.5 1.9 53.6 100.0
South Sumatra Rural 18.0 20.7 38.7 38.9 20.7 1.8 61.3 100.0Urban 64.9 12.3 77.2 9.8 12.3 0.7 22.8 100.0Total 33.2 18.0 51.1 29.5 18.0 1.4 48.9 100.0
Bengkulu Rural 16.4 22.0 38.4 36.4 22.0 3.2 61.6 100.0Urban 56.2 16.1 72.3 5.2 16.1 6.3 27.7 100.0Total 27.1 20.4 47.5 28.0 20.4 4.1 52.5 100.0
Lampung Rural 20.6 31.2 51.7 16.0 31.2 1.1 48.3 100.0Urban 56.6 15.0 71.6 11.5 15.0 1.9 28.4 100.0Total 28.1 27.8 55.9 15.1 27.8 1.3 44.1 100.0
Bangka Belitung
Rural 37.1 8.7 45.9 37.6 8.7 7.9 54.2 100.0Urban 65.4 10.4 75.8 10.5 10.4 3.4 24.2 100.0Total 48.6 9.4 58.0 26.6 9.4 6.1 42.0 100.0
Riau Archipelago
Rural 16.2 9.1 25.3 62.0 9.1 3.6 74.7 100.0Urban 53.8 16.1 69.9 13.4 16.1 0.5 30.1 100.0Total 46.4 14.8 61.2 23.0 14.8 1.1 38.8 100.0
Jakarta Total 82.3 5.7 88.0 5.9 5.7 0.3 12.0 100.0West Java Rural 28.1 11.2 39.2 47.9 11.2 1.7 60.8 100.0
Urban 56.6 7.4 64.0 27.2 7.4 1.4 36.0 100.0Total 42.6 9.2 51.8 37.4 9.2 1.6 48.2 100.0
Central Java Rural 30.2 17.5 47.7 33.4 17.5 1.4 52.3 100.0Urban 61.9 7.4 69.2 22.7 7.4 0.8 30.8 100.0Total 43.1 13.4 56.5 29.0 13.4 1.1 43.5 100.0
Yogyakarta Rural 32.3 29.9 62.1 6.4 29.9 1.6 37.9 100.0Urban 79.5 5.1 84.6 8.4 5.1 1.9 15.4 100.0Total 60.4 15.1 75.5 7.6 15.1 1.8 24.5 100.0
East Java Rural 22.7 21.5 44.2 33.1 21.5 1.2 55.8 100.0Urban 56.8 12.7 69.5 17.2 12.7 0.6 30.5 100.0Total 36.8 17.8 54.6 26.6 17.8 1.0 45.4 100.0
ANNEXES
59Economic Impacts of Sanitation in Indonesia
A five-country study conducted in Cambodia, Indonesia, Lao PDR, the Philippines, and Vietnam under the Economics of Sanitation Initiative (ESI)
Province Location
Improved sanitation % Unimproved sanitation %
All %Septic tank
Pit latrine
TotalWater body
garden, fi eld, beach
Pit latrine
Other Total
Banten Rural 22.7 11.2 33.9 52.5 11.2 2.4 66.1 100.0Urban 65.8 11.1 76.9 11.5 11.1 0.5 23.1 100.0Total 46.8 11.1 57.9 29.7 11.1 1.3 42.1 100.0
B a l i Rural 48.6 9.5 58.1 28.6 9.5 3.8 41.9 100.0Urban 76.9 7.2 84.1 7.8 7.2 1.0 15.9 100.0Total 63.8 8.2 72.0 17.5 8.2 2.3 28.0 100.0
West Nusa Tenggara
Rural 17.1 10.5 27.6 58.3 10.5 3.7 72.4 100.0Urban 31.2 14.7 45.9 37.1 14.7 2.3 54.1 100.0Total 22.2 12.0 34.2 50.6 12.0 3.2 65.8 100.0
East Nusa Tenggara
Rural 7.8 28.3 36.1 24.1 28.3 11.6 63.9 100.0Urban 34.3 29.4 63.7 5.9 29.4 1.0 36.3 100.0Total 11.9 28.5 40.4 21.2 28.5 9.9 59.6 100.0
West Kalimantan
Rural 15.3 18.4 33.7 43.1 18.4 4.9 66.3 100.0Urban 64.8 11.6 76.4 10.3 11.6 1.8 23.6 100.0Total 28.3 16.6 44.9 34.4 16.6 4.0 55.1 100.0
Central Kalimantan
Rural 8.4 16.1 24.4 58.5 16.1 1.1 75.6 100.0Urban 43.3 18.3 61.6 19.9 18.3 0.3 38.5 100.0Total 18.6 16.7 35.3 47.1 16.7 0.9 64.7 100.0
South Kalimantan
Rural 16.6 20.5 37.1 41.6 20.5 0.8 62.9 100.0Urban 42.1 19.6 61.8 17.8 19.6 0.8 38.2 100.0Total 26.1 20.2 46.3 32.8 20.2 0.8 53.7 100.0
East Kalimantan
Rural 25.9 22.5 48.3 27.2 22.5 2.0 51.7 100.0Urban 61.7 13.3 74.9 11.7 13.3 0.2 25.1 100.0Total 45.3 17.5 62.8 18.8 17.5 1.0 37.2 100.0
North Sulawesi Rural 41.7 18.1 59.8 19.0 18.1 3.0 40.2 100.0Urban 54.0 20.1 74.1 4.2 20.1 1.7 25.9 100.0Total 46.4 18.9 65.3 13.4 18.9 2.5 34.8 100.0
Central Sulawesi
Rural 23.5 12.5 36.0 43.6 12.5 7.9 64.0 100.0Urban 67.4 10.4 77.8 10.1 10.4 1.7 22.2 100.0Total 32.3 12.1 44.4 36.9 12.1 6.6 55.6 100.0
South Sulawesi Rural 29.9 16.0 45.9 36.1 16.0 2.0 54.1 100.0Urban 71.2 8.9 80.1 10.0 8.9 1.1 19.9 100.0Total 43.0 13.7 56.8 27.8 13.7 1.7 43.3 100.0
Southeast Sulawesi
Rural 22.5 20.0 42.5 33.8 20.0 3.7 57.5 100.0Urban 62.2 13.1 75.3 10.9 13.1 0.8 24.7 100.0Total 31.2 18.5 49.7 28.8 18.5 3.0 50.3 100.0
Gorontalo Rural 16.8 12.4 29.2 52.2 12.4 6.2 70.8 100.0Urban 44.4 17.9 62.4 17.4 17.9 2.4 37.6 100.0Total 24.3 13.9 38.1 42.8 13.9 5.2 61.9 100.0
West Sulawesi Rural 16.5 13.7 30.1 53.1 13.7 3.1 69.9 100.0Urban 42.4 13.2 55.6 30.5 13.2 0.7 44.4 100.0Total 20.3 13.6 33.9 49.8 13.6 2.8 66.1 100.0
Maluku Rural 15.7 12.0 27.7 54.9 12.0 5.3 72.3 100.0Urban 63.2 9.5 72.7 17.4 9.5 0.5 27.4 100.0Total 29.3 11.3 40.7 44.1 11.3 3.9 59.4 100.0

ANNEXES
60Economic Impacts of Sanitation in IndonesiaA five-country study conducted in Cambodia, Indonesia, Lao PDR, the Philippines, and Vietnam under the Economics of Sanitation Initiative (ESI)
Province Location
Improved sanitation % Unimproved sanitation %
All %Septic tank
Pit latrine
TotalWater body
garden, fi eld, beach
Pit latrine
Other Total
North Maluku Rural 29.3 10.1 39.4 47.1 10.1 3.4 60.6 100.0Urban 69.5 7.9 77.4 13.9 7.9 0.8 22.6 100.0Total 39.2 9.6 48.8 39.0 9.6 2.7 51.2 100.0
West Papua Rural 16.9 10.1 27.0 59.8 10.1 3.3 73.1 100.0Urban 66.0 5.6 71.6 21.5 5.6 1.2 28.4 100.0Total 33.8 8.6 42.4 46.5 8.6 2.6 57.6 100.0
Papua Rural 10.7 16.8 27.6 37.4 16.8 18.3 72.4 100.0Urban 56.9 16.0 72.9 10.3 16.0 0.9 27.1 100.0Total 21.5 16.6 38.1 31.1 16.6 14.2 61.9 100.0
Indonesia Total
Rural 24.4 17.8 42.2 37.3 17.8 2.8 57.9 100.0Urban 62.3 9.7 72.0 17.2 9.7 1.0 28.0 100.0Total 40.7 14.3 55.0 28.7 14.3 2.0 45.0 100.0
Source: Susenas 2006
Table C3. Annual incidence of diarrheal disease for children under fi ve years, by province
Province Diarrheal incidence Province Diarrheal incidence
Nanggroe Aceh Darussalam 2.3232 West Nusa Tenggara 2.8512
North Sumatra 2.5978 East Nusa Tenggara 2.7245
West Sumatra 3.0202 West Kalimantan 1.7530
R i a u 1.2883 Central Kalimantan 0.5069
J a m b i 1.7107 South Kalimantan 2.0909
South Sumatra 0.6970 East Kalimantan 2.3443
Bengkulu 1.7318 North Sulawesi 2.0064
Lampung 1.9430 Central Sulawesi 1.3517
Bangka Belitung 1.9853 South Sulawesi 3.2736
Riau Archipelago 1.2883 Southeast Sulawesi 1.9008
Jakarta 1.6474 Gorontalo 2.5766
West Java 3.1891 West Sulawesi 3.2736
Central Java 1.6685 Maluku 2.3232
Yogyakarta 1.0982 North Maluku 2.3232
East Java 2.0698 West Papua 2.3232
Banten 2.6400 Papua 2.3232
B a l i 2.5133 National 2.3232
Source: Indonesia Demographic and Health Survey 2002-3

ANNEXES
61Economic Impacts of Sanitation in Indonesia
A five-country study conducted in Cambodia, Indonesia, Lao PDR, the Philippines, and Vietnam under the Economics of Sanitation Initiative (ESI)
Table C4. Treatment seeking behavior by province and rural/urban grouping
Province Location% Seeking outpatient treatment
% Self treatment
TotalFormal provider
Informal provider
Total
NAD Rural 29 9 38 62 100Urban 33 8 41 59 100Total 30 9 38 62 100
North Sumatra Rural 17 11 27 73 100Urban 25 7 32 68 100Total 21 9 29 71 100
West Sumatra Rural 22 16 38 62 100Urban 32 12 43 57 100Total 24 15 39 61 100
R i a u Rural 14 4 18 82 100Urban 28 3 30 70 100Total 19 3 22 78 100
J a m b i Rural 19 3 22 78 100Urban 38 6 44 56 100Total 25 4 29 71 100
South Sumatra Rural 20 6 26 74 100
Urban 29 2 31 69 100
Total 23 5 28 72 100
Bengkulu Rural 18 8 26 74 100
Urban 30 7 36 64 100
Total 21 8 29 71 100
Lampung Rural 17 12 29 71 100
Urban 24 9 34 66 100
Total 19 11 30 70 100
Bangka Belitung Rural 22 7 27 73 100
Urban 32 8 40 60 100
Total 25 7 32 68 100
Riau Archipelago Rural 31 6 37 63 100
Urban 29 5 33 67 100
Total 29 5 34 66 100
Jakarta Total 36 3 39 61 100
West Java Rural 26 13 33 67 100
Urban 39 11 40 60 100
Total 32 12 36 64 100
Central Java Rural 24 14 38 62 100
Urban 33 8 41 59 100
Total 28 11 39 61 100
ANNEXES
62Economic Impacts of Sanitation in IndonesiaA five-country study conducted in Cambodia, Indonesia, Lao PDR, the Philippines, and Vietnam under the Economics of Sanitation Initiative (ESI)
Province Location% Seeking outpatient treatment
% Self treatment
TotalFormal provider
Informal provider
Total
Yogyakarta Rural 32 8 40 60 100
Urban 32 4 36 64 100
Total 32 6 38 62 100
East Java Rural 19 13 33 67 100
Urban 27 9 36 64 100
Total 23 11 34 66 100
Banten Rural 17 6 23 77 100
Urban 26 4 30 70 100
Total 22 5 27 73 100
B a l i Rural 36 14 50 50 100
Urban 38 6 44 56 100
Total 37 10 47 53 100
West Nusa Tenggara
Rural 27 10 36 64 100
Urban 27 7 34 66 100
Total 27 9 35 65 100
East Nusa Tenggara
Rural 37 8 45 55 100
Urban 45 2 48 52 100
Total 38 7 46 54 100
West Kalimantan Rural 20 8 28 72 100
Urban 24 6 30 70 100
Total 22 7 29 71 100
Central Kalimantan
Rural 20 4 24 76 100
Urban 24 7 30 70 100
Total 21 5 26 74 100
South Kalimantan Rural 17 10 27 73 100
Urban 22 5 27 73 100
Total 19 8 27 73 100
East Kalimantan Rural 28 8 30 70 100
Urban 34 4 37 63 100
Total 31 6 34 66 100
North Sulawesi Rural 25 7 31 69 100
Urban 31 3 34 66 100
Total 27 5 32 68 100
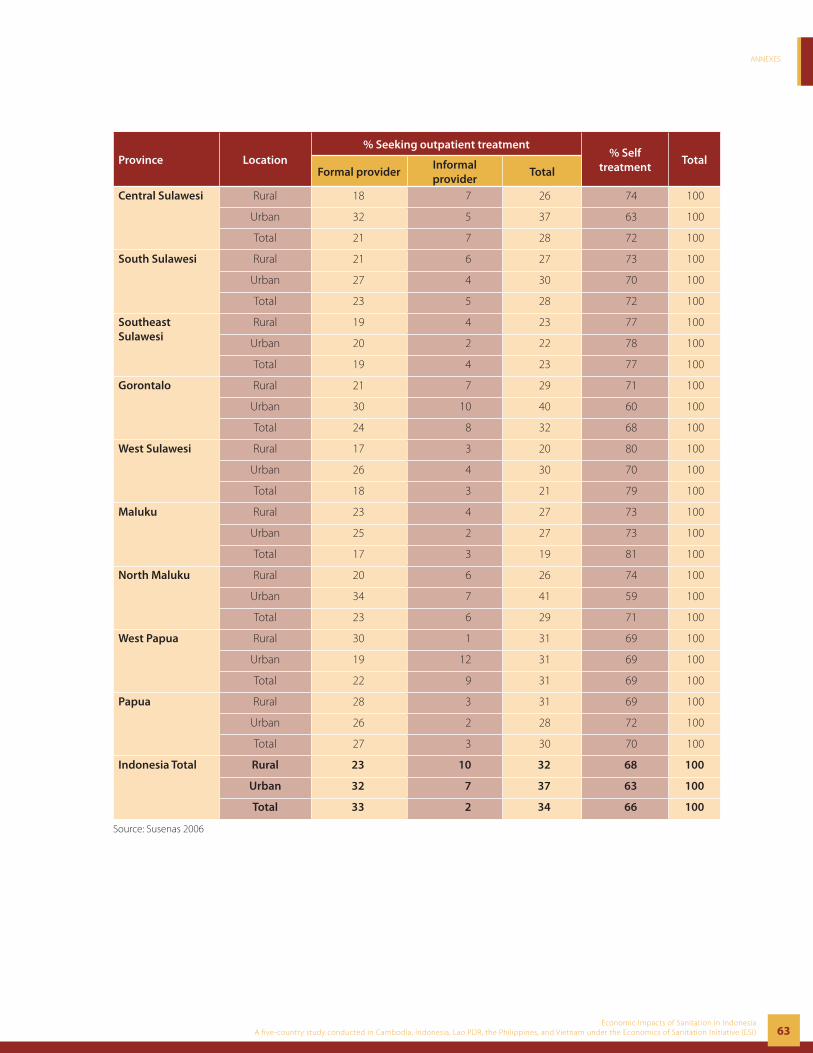
ANNEXES
63Economic Impacts of Sanitation in Indonesia
A five-country study conducted in Cambodia, Indonesia, Lao PDR, the Philippines, and Vietnam under the Economics of Sanitation Initiative (ESI)
Province Location% Seeking outpatient treatment
% Self treatment
TotalFormal provider
Informal provider
Total
Central Sulawesi Rural 18 7 26 74 100
Urban 32 5 37 63 100
Total 21 7 28 72 100
South Sulawesi Rural 21 6 27 73 100
Urban 27 4 30 70 100
Total 23 5 28 72 100
Southeast Sulawesi
Rural 19 4 23 77 100
Urban 20 2 22 78 100
Total 19 4 23 77 100
Gorontalo Rural 21 7 29 71 100
Urban 30 10 40 60 100
Total 24 8 32 68 100
West Sulawesi Rural 17 3 20 80 100
Urban 26 4 30 70 100
Total 18 3 21 79 100
Maluku Rural 23 4 27 73 100
Urban 25 2 27 73 100
Total 17 3 19 81 100
North Maluku Rural 20 6 26 74 100
Urban 34 7 41 59 100
Total 23 6 29 71 100
West Papua Rural 30 1 31 69 100
Urban 19 12 31 69 100
Total 22 9 31 69 100
Papua Rural 28 3 31 69 100
Urban 26 2 28 72 100
Total 27 3 30 70 100
Indonesia Total Rural 23 10 32 68 100
Urban 32 7 37 63 100
Total 33 2 34 66 100
Source: Susenas 2006
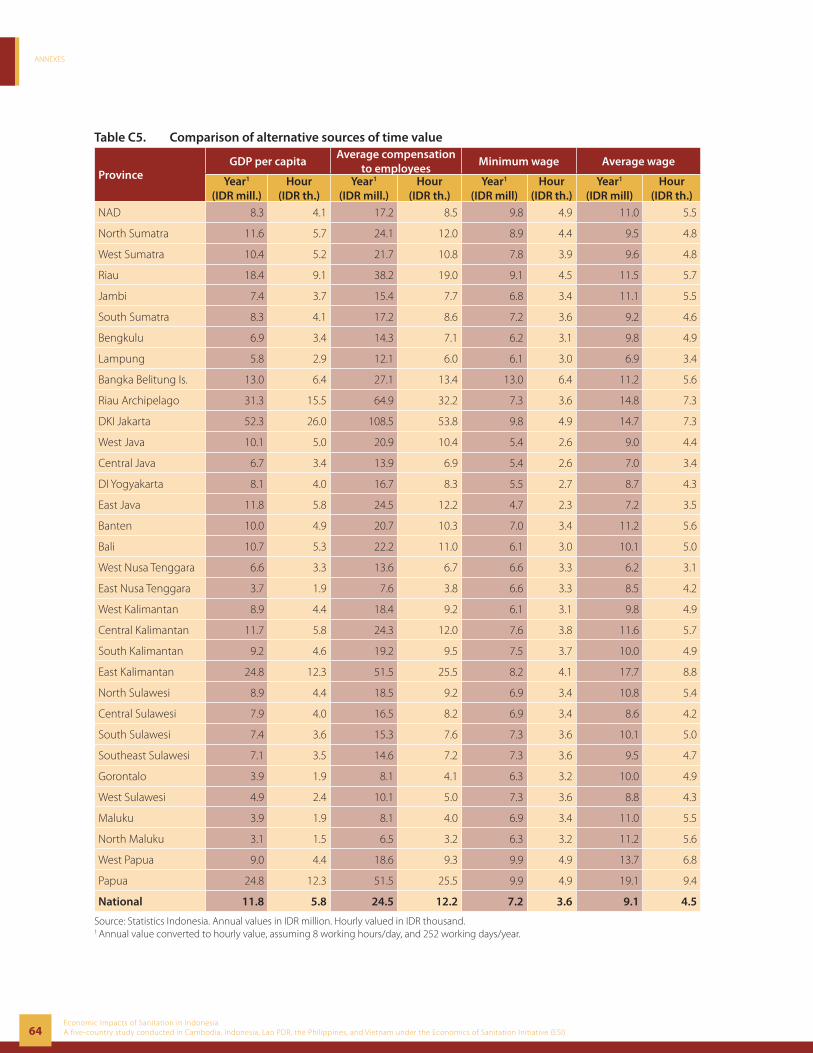
ANNEXES
64Economic Impacts of Sanitation in IndonesiaA five-country study conducted in Cambodia, Indonesia, Lao PDR, the Philippines, and Vietnam under the Economics of Sanitation Initiative (ESI)
Table C5. Comparison of alternative sources of time value
ProvinceGDP per capita
Average compensationto employees
Minimum wage Average wage
Year1 (IDR mill.)
Hour (IDR th.)
Year1 (IDR mill.)
Hour (IDR th.)
Year1 (IDR mill)
Hour (IDR th.)
Year1 (IDR mill)
Hour (IDR th.)
NAD 8.3 4.1 17.2 8.5 9.8 4.9 11.0 5.5
North Sumatra 11.6 5.7 24.1 12.0 8.9 4.4 9.5 4.8
West Sumatra 10.4 5.2 21.7 10.8 7.8 3.9 9.6 4.8
Riau 18.4 9.1 38.2 19.0 9.1 4.5 11.5 5.7
Jambi 7.4 3.7 15.4 7.7 6.8 3.4 11.1 5.5
South Sumatra 8.3 4.1 17.2 8.6 7.2 3.6 9.2 4.6
Bengkulu 6.9 3.4 14.3 7.1 6.2 3.1 9.8 4.9
Lampung 5.8 2.9 12.1 6.0 6.1 3.0 6.9 3.4
Bangka Belitung Is. 13.0 6.4 27.1 13.4 13.0 6.4 11.2 5.6
Riau Archipelago 31.3 15.5 64.9 32.2 7.3 3.6 14.8 7.3
DKI Jakarta 52.3 26.0 108.5 53.8 9.8 4.9 14.7 7.3
West Java 10.1 5.0 20.9 10.4 5.4 2.6 9.0 4.4
Central Java 6.7 3.4 13.9 6.9 5.4 2.6 7.0 3.4
DI Yogyakarta 8.1 4.0 16.7 8.3 5.5 2.7 8.7 4.3
East Java 11.8 5.8 24.5 12.2 4.7 2.3 7.2 3.5
Banten 10.0 4.9 20.7 10.3 7.0 3.4 11.2 5.6
Bali 10.7 5.3 22.2 11.0 6.1 3.0 10.1 5.0
West Nusa Tenggara 6.6 3.3 13.6 6.7 6.6 3.3 6.2 3.1
East Nusa Tenggara 3.7 1.9 7.6 3.8 6.6 3.3 8.5 4.2
West Kalimantan 8.9 4.4 18.4 9.2 6.1 3.1 9.8 4.9
Central Kalimantan 11.7 5.8 24.3 12.0 7.6 3.8 11.6 5.7
South Kalimantan 9.2 4.6 19.2 9.5 7.5 3.7 10.0 4.9
East Kalimantan 24.8 12.3 51.5 25.5 8.2 4.1 17.7 8.8
North Sulawesi 8.9 4.4 18.5 9.2 6.9 3.4 10.8 5.4
Central Sulawesi 7.9 4.0 16.5 8.2 6.9 3.4 8.6 4.2
South Sulawesi 7.4 3.6 15.3 7.6 7.3 3.6 10.1 5.0
Southeast Sulawesi 7.1 3.5 14.6 7.2 7.3 3.6 9.5 4.7
Gorontalo 3.9 1.9 8.1 4.1 6.3 3.2 10.0 4.9
West Sulawesi 4.9 2.4 10.1 5.0 7.3 3.6 8.8 4.3
Maluku 3.9 1.9 8.1 4.0 6.9 3.4 11.0 5.5
North Maluku 3.1 1.5 6.5 3.2 6.3 3.2 11.2 5.6
West Papua 9.0 4.4 18.6 9.3 9.9 4.9 13.7 6.8
Papua 24.8 12.3 51.5 25.5 9.9 4.9 19.1 9.4
National 11.8 5.8 24.5 12.2 7.2 3.6 9.1 4.5
Source: Statistics Indonesia. Annual values in IDR million. Hourly valued in IDR thousand. 1 Annual value converted to hourly value, assuming 8 working hours/day, and 252 working days/year.
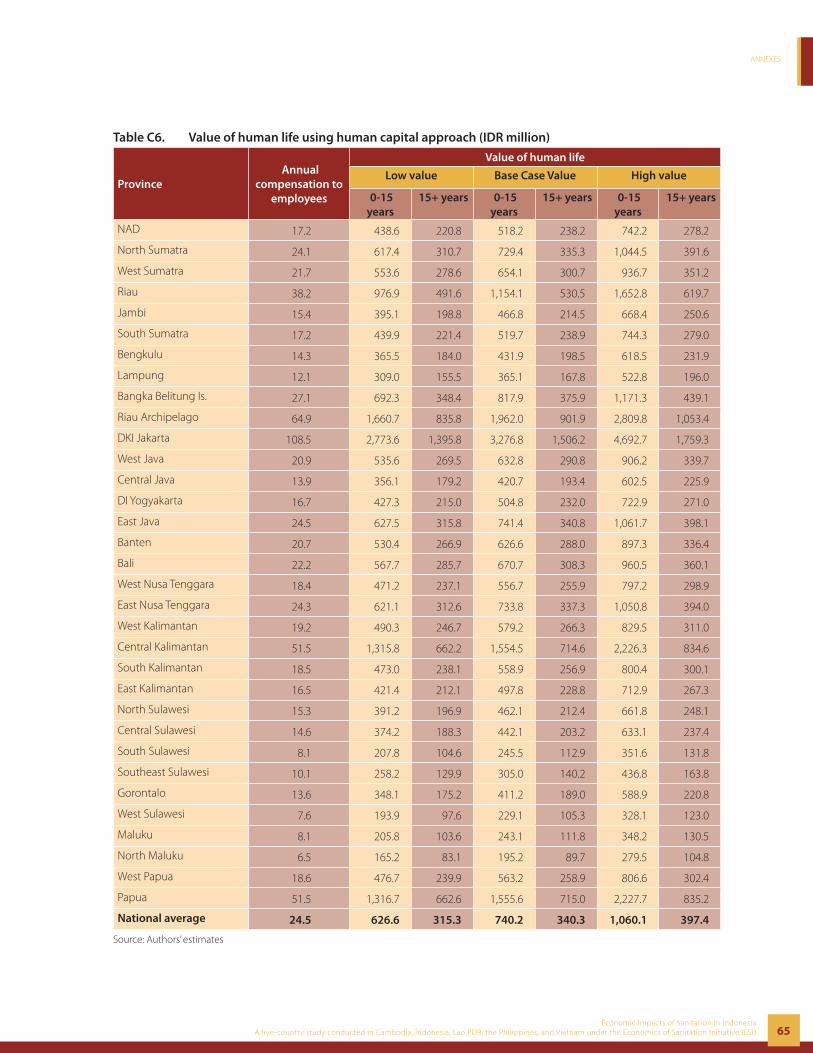
ANNEXES
65Economic Impacts of Sanitation in Indonesia
A five-country study conducted in Cambodia, Indonesia, Lao PDR, the Philippines, and Vietnam under the Economics of Sanitation Initiative (ESI)
Table C6. Value of human life using human capital approach (IDR million)
Province Annual
compensation to employees
Value of human life
Low value Base Case Value High value
0-15 years
15+ years 0-15 years
15+ years 0-15 years
15+ years
NAD 17.2 438.6 220.8 518.2 238.2 742.2 278.2
North Sumatra 24.1 617.4 310.7 729.4 335.3 1,044.5 391.6
West Sumatra 21.7 553.6 278.6 654.1 300.7 936.7 351.2
Riau 38.2 976.9 491.6 1,154.1 530.5 1,652.8 619.7
Jambi 15.4 395.1 198.8 466.8 214.5 668.4 250.6
South Sumatra 17.2 439.9 221.4 519.7 238.9 744.3 279.0
Bengkulu 14.3 365.5 184.0 431.9 198.5 618.5 231.9
Lampung 12.1 309.0 155.5 365.1 167.8 522.8 196.0
Bangka Belitung Is. 27.1 692.3 348.4 817.9 375.9 1,171.3 439.1
Riau Archipelago 64.9 1,660.7 835.8 1,962.0 901.9 2,809.8 1,053.4
DKI Jakarta 108.5 2,773.6 1,395.8 3,276.8 1,506.2 4,692.7 1,759.3
West Java 20.9 535.6 269.5 632.8 290.8 906.2 339.7
Central Java 13.9 356.1 179.2 420.7 193.4 602.5 225.9
DI Yogyakarta 16.7 427.3 215.0 504.8 232.0 722.9 271.0
East Java 24.5 627.5 315.8 741.4 340.8 1,061.7 398.1
Banten 20.7 530.4 266.9 626.6 288.0 897.3 336.4
Bali 22.2 567.7 285.7 670.7 308.3 960.5 360.1
West Nusa Tenggara 18.4 471.2 237.1 556.7 255.9 797.2 298.9
East Nusa Tenggara 24.3 621.1 312.6 733.8 337.3 1,050.8 394.0
West Kalimantan 19.2 490.3 246.7 579.2 266.3 829.5 311.0
Central Kalimantan 51.5 1,315.8 662.2 1,554.5 714.6 2,226.3 834.6
South Kalimantan 18.5 473.0 238.1 558.9 256.9 800.4 300.1
East Kalimantan 16.5 421.4 212.1 497.8 228.8 712.9 267.3
North Sulawesi 15.3 391.2 196.9 462.1 212.4 661.8 248.1
Central Sulawesi 14.6 374.2 188.3 442.1 203.2 633.1 237.4
South Sulawesi 8.1 207.8 104.6 245.5 112.9 351.6 131.8
Southeast Sulawesi 10.1 258.2 129.9 305.0 140.2 436.8 163.8
Gorontalo 13.6 348.1 175.2 411.2 189.0 588.9 220.8
West Sulawesi 7.6 193.9 97.6 229.1 105.3 328.1 123.0
Maluku 8.1 205.8 103.6 243.1 111.8 348.2 130.5
North Maluku 6.5 165.2 83.1 195.2 89.7 279.5 104.8
West Papua 18.6 476.7 239.9 563.2 258.9 806.6 302.4
Papua 51.5 1,316.7 662.6 1,555.6 715.0 2,227.7 835.2
National average 24.5 626.6 315.3 740.2 340.3 1,060.1 397.4
Source: Authors’ estimates

ANNEXES
66Economic Impacts of Sanitation in IndonesiaA five-country study conducted in Cambodia, Indonesia, Lao PDR, the Philippines, and Vietnam under the Economics of Sanitation Initiative (ESI)
Table C7. Main rivers in Indonesia
Province River River basin area (km2)Flow (m3/second)
Maximum Minimum
North Sumatra Asahan 4,669 481 15
Gambus 1,013 299 30
West Sumatra Batang Hari 4,952 4,800 35
Batang Kuantan 2,215 808 3
Batang Pasaman 1,395 1,446 27
Lampung W. Tulang Bawang 3,427 862 5
W. Sekampung 1,696 1,276 3
W Seputih 1,648 302 0
Kali Pemali 1,111 701 -
Yogyakarta Kali Progo 3,388 2,500 0
East Java Bengawan Solo 62,986 13,497 14
Kali Brantas 70,167 34,507 72
Banten Ciujung 4,549 4,183 20
Cisadane 1,146 350 -
West Nusa Tenggara Parado 1,499 441
Tiu Kulit 1,047 308
East Nusa Tenggara Babak 587 274
Meninting 440 169
Central Kalimantan Barito 32,067 5,663 63
Kahayan 14,175 2,267 101
Katingan 11,929 3,902 51
Central Sulawesi Tambalako 1,353 976 1
Buol 1,413 421 31
South Sulawesi Cenranae 11,866 6,963 30
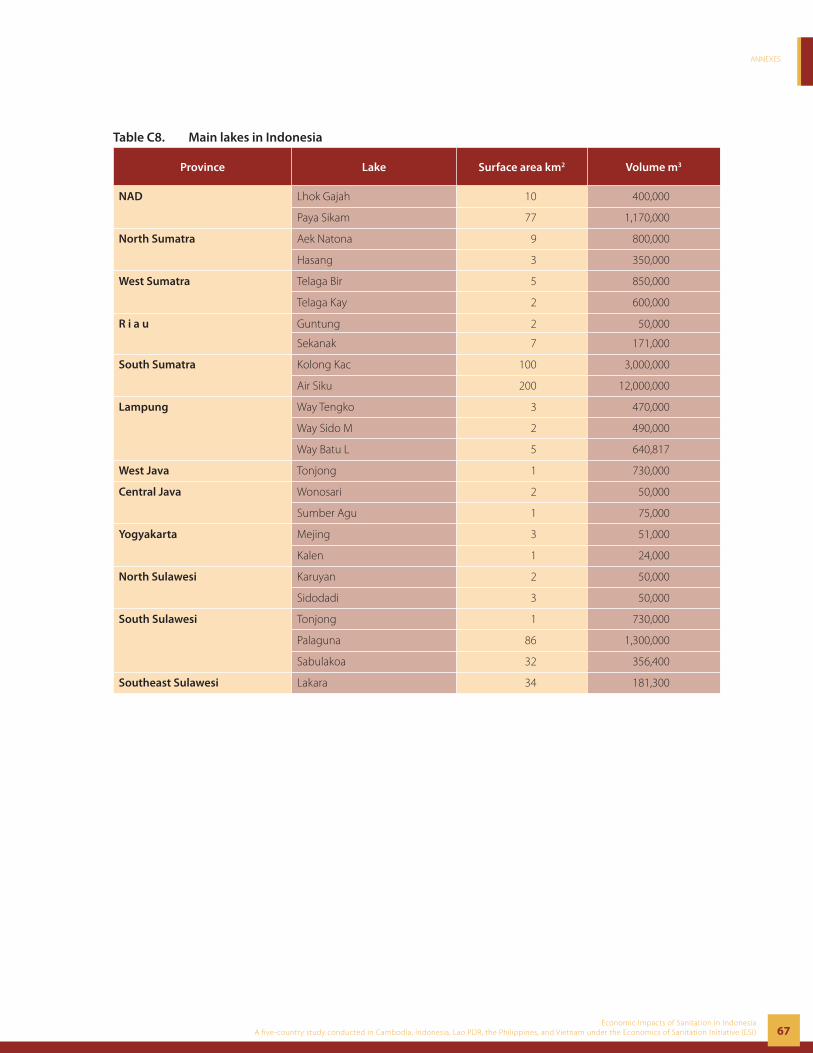
ANNEXES
67Economic Impacts of Sanitation in Indonesia
A five-country study conducted in Cambodia, Indonesia, Lao PDR, the Philippines, and Vietnam under the Economics of Sanitation Initiative (ESI)
Table C8. Main lakes in Indonesia
Province Lake Surface area km2 Volume m3
NAD Lhok Gajah 10 400,000
Paya Sikam 77 1,170,000
North Sumatra Aek Natona 9 800,000
Hasang 3 350,000
West Sumatra Telaga Bir 5 850,000
Telaga Kay 2 600,000
R i a u Guntung 2 50,000
Sekanak 7 171,000
South Sumatra Kolong Kac 100 3,000,000
Air Siku 200 12,000,000
Lampung Way Tengko 3 470,000
Way Sido M 2 490,000
Way Batu L 5 640,817
West Java Tonjong 1 730,000
Central Java Wonosari 2 50,000
Sumber Agu 1 75,000
Yogyakarta Mejing 3 51,000
Kalen 1 24,000
North Sulawesi Karuyan 2 50,000
Sidodadi 3 50,000
South Sulawesi Tonjong 1 730,000
Palaguna 86 1,300,000
Sabulakoa 32 356,400
Southeast Sulawesi Lakara 34 181,300
ANNEXES
68Economic Impacts of Sanitation in IndonesiaA five-country study conducted in Cambodia, Indonesia, Lao PDR, the Philippines, and Vietnam under the Economics of Sanitation Initiative (ESI)
Table C9. Proportion of untreated sewage discharged to water bodies1
Province Location % sewage discharged directly into water body
% open defecation
in water courses
Septic tanks not managed properly
Leaking pit latrine Total
Total %
% to groundwater
Total %
% to groundwater
NAD Rural 31.49 11.79 12.40 6.20 15.54 7.77 57.25
Urban 22.91 3.95 34.27 17.14 9.41 4.71 48.69
Total 29.63 10.09 17.14 8.57 14.21 7.10 55.39
North Sumatra Rural 24.68 11.16 14.26 7.13 18.93 9.47 52.43
Urban 23.71 3.19 35.75 17.88 9.32 4.66 49.43
Total 24.26 7.69 23.62 11.81 14.75 7.37 51.13
West Sumatra Rural 41.73 14.74 9.86 4.93 8.67 4.33 65.73
Urban 26.74 6.51 31.87 15.94 7.18 3.59 52.77
Total 37.08 12.19 16.69 8.34 8.20 4.10 61.72
R i a u Rural 16.96 7.47 0.54 0.27 35.52 17.76 42.46
Urban 21.77 0.96 35.47 17.74 11.67 5.83 46.29
Total 19.36 4.22 18.01 9.00 23.59 11.80 44.38
J a m b i Rural 43.84 5.25 9.76 4.88 16.62 8.31 62.27
Urban 28.93 2.92 32.72 16.36 8.63 4.32 52.52
Total 39.80 4.61 15.98 7.99 14.46 7.23 59.63
South Sumatra Rural 37.75 4.59 9.01 4.51 20.66 10.33 57.17
Urban 23.55 1.92 32.46 16.23 12.30 6.15 47.85
Total 33.16 3.72 16.59 8.30 17.96 8.98 54.15
Bengkulu Rural 29.58 8.69 8.20 4.10 22.00 11.00 53.36
Urban 16.56 7.68 28.08 14.04 16.15 8.07 46.35
Total 26.07 8.42 13.56 6.78 20.42 10.21 51.48
Lampung Rural 15.14 4.09 10.29 5.14 31.18 15.59 39.96
Urban 22.75 3.32 28.30 14.15 15.03 7.52 47.73
Total 16.73 3.92 14.05 7.02 27.81 13.90 41.58
Bangka Belitung
Rural 12.59 25.02 18.57 9.29 8.71 4.36 51.24
Urban 19.14 7.21 32.72 16.36 10.36 5.18 47.89
Total 15.24 17.80 24.31 12.15 9.38 4.69 49.88
Riau Archipelago
Rural 46.37 13.47 8.12 4.06 9.06 4.53 68.43
Urban 23.92 1.98 26.89 13.45 16.15 8.07 47.41
Total 28.32 4.23 23.22 11.61 14.76 7.38 51.53
Jakarta Total 4.14 2.08 41.15 41.15 5.75 5.75 53.11
West Java Rural 34.63 15.38 28.05 14.03 11.17 5.58 69.61
Urban 34.90 4.61 28.32 14.16 7.39 3.69 57.36
Total 31.32 9.90 21.30 10.65 9.24 4.62 56.49
ANNEXES
69Economic Impacts of Sanitation in Indonesia
A five-country study conducted in Cambodia, Indonesia, Lao PDR, the Philippines, and Vietnam under the Economics of Sanitation Initiative (ESI)
Province Location % sewage discharged directly into water body
% open defecation
in water courses
Septic tanks not managed properly
Leaking pit latrine Total
Total %
% to groundwater
Total %
% to groundwater
Central Java Rural 30.52 6.62 15.09 7.55 17.51 8.76 53.44
Urban 34.03 2.81 30.95 15.47 7.35 3.68 55.99
Total 31.95 5.06 21.55 10.78 13.37 6.69 54.47
Yogyakarta Rural 12.41 2.62 16.14 8.07 29.86 14.93 38.02
Urban 25.50 3.32 39.73 19.87 5.10 2.55 51.23
Total 20.21 3.05 30.19 15.10 15.11 7.56 45.90
East Java Rural 30.03 5.61 11.35 5.67 21.49 10.74 52.05
Urban 29.51 1.59 28.41 14.20 12.67 6.34 51.64
Total 29.82 3.95 18.40 9.20 17.84 8.92 51.89
Banten Rural 21.35 20.85 11.36 5.68 11.18 5.59 53.47
Urban 19.39 4.76 32.92 16.46 11.09 5.55 46.15
Total 20.25 11.88 23.38 11.69 11.13 5.57 49.38
B a l i Rural 20.15 14.11 24.31 12.16 9.48 4.74 51.14
Urban 23.04 2.94 38.46 19.23 7.18 3.59 48.80
Total 21.69 8.13 31.89 15.94 8.25 4.12 49.88
West Nusa Tenggara
Rural 33.01 18.44 8.55 4.28 10.47 5.24 60.96
Urban 36.62 6.44 15.60 7.80 14.72 7.36 58.21
Total 34.31 14.10 11.10 5.55 12.01 6.01 59.96
East Nusa Tenggara
Rural 3.02 23.06 3.89 1.94 28.31 14.15 42.17
Urban 9.60 3.46 17.15 8.57 29.39 14.69 36.33
Total 4.05 19.99 5.96 2.98 28.47 14.24 41.25
West Kalimantan
Rural 31.39 12.61 7.64 3.82 18.40 9.20 57.01
Urban 22.40 3.81 32.38 16.19 11.61 5.80 48.20
Total 29.02 10.29 14.16 7.08 16.61 8.31 54.69
Central Kalimantan
Rural 57.91 2.42 4.18 2.09 16.05 8.03 70.44
Urban 28.97 1.15 21.64 10.82 18.28 9.14 50.07
Total 49.41 2.04 9.31 4.65 16.71 8.35 64.46
South Kalimantan
Rural 41.99 2.70 8.30 4.15 20.49 10.25 59.08
Urban 27.10 1.42 21.07 10.54 19.63 9.82 48.86
Total 36.45 2.22 13.05 6.53 20.17 10.09 55.27
East Kalimantan Rural 28.66 4.50 12.94 6.47 22.47 11.24 50.86
Urban 25.40 1.01 30.83 15.41 13.25 6.63 48.45
Total 26.89 2.60 22.67 11.34 17.46 8.73 49.54

ANNEXES
70Economic Impacts of Sanitation in IndonesiaA five-country study conducted in Cambodia, Indonesia, Lao PDR, the Philippines, and Vietnam under the Economics of Sanitation Initiative (ESI)
Province Location % sewage discharged directly into water body
% open defecation
in water courses
Septic tanks not managed properly
Leaking pit latrine Total
Total %
% to groundwater
Total %
% to groundwater
North Sulawesi Rural 24.38 5.58 20.84 10.42 18.12 9.06 49.44
Urban 15.43 2.81 27.02 13.51 20.06 10.03 41.77
Total 20.97 4.53 23.20 11.60 18.86 9.43 46.52
Central Sulawesi
Rural 29.77 17.71 11.75 5.87 12.52 6.26 59.61
Urban 24.13 3.09 33.70 16.85 10.42 5.21 49.28
Total 28.64 14.78 16.16 8.08 12.10 6.05 57.54
South Sulawesi Rural 17.10 15.27 14.95 7.47 16.00 8.00 47.84
Urban 22.72 3.58 35.58 17.79 8.92 4.46 48.54
Total 18.89 11.56 21.51 10.75 13.75 6.87 48.07
Southeast Sulawesi
Rural 14.20 16.26 11.24 5.62 20.05 10.02 46.10
Urban 20.76 3.59 31.08 15.54 13.11 6.56 46.44
Total 15.64 13.49 15.59 7.80 18.53 9.26 46.18
Gorontalo Rural 24.81 22.03 8.41 4.21 12.38 6.19 57.23
Urban 18.77 7.20 22.22 11.11 17.94 8.97 46.04
Total 23.18 18.03 12.14 6.07 13.88 6.94 54.21
West Sulawesi Rural 28.39 17.52 8.23 4.11 13.69 6.84 56.87
Urban 24.73 8.91 21.20 10.60 13.19 6.60 50.83
Total 27.85 16.25 10.13 5.07 13.61 6.81 55.96
Maluku Rural 20.14 24.68 7.85 3.93 12.04 6.02 54.75
Urban 22.79 5.65 31.58 15.79 9.51 4.76 48.98
Total 20.90 19.21 14.67 7.34 11.31 5.66 53.09
North Maluku Rural 17.78 21.72 14.66 7.33 10.09 5.04 51.87
Urban 18.34 7.25 34.75 17.37 7.91 3.96 46.92
Total 17.92 18.15 19.62 9.81 9.55 4.78 50.65
West Papua Rural 32.74 18.87 8.45 4.22 10.06 5.03 60.86
Urban 25.32 7.58 33.02 16.51 5.61 2.81 52.21
Total 30.12 14.95 16.88 8.44 8.62 4.31 57.81
Papua Rural 12.89 31.85 5.37 2.69 16.82 8.41 55.82
Urban 17.49 4.40 28.47 14.23 15.96 7.98 44.10
Total 13.96 25.47 10.74 5.37 16.62 8.31 53.10
Indonesia Total
Rural 27.57 10.67 12.19 6.09 17.80 8.90 53.23
Urban 28.58 3.12 31.15 15.57 9.75 4.87 52.15
Total 27.99 7.43 20.34 10.17 14.34 7.17 52.75
Source: Authors’ estimates. 1 All fi gures presented as % of entire rural, urban or total population
ANNEXES
71Economic Impacts of Sanitation in Indonesia
A five-country study conducted in Cambodia, Indonesia, Lao PDR, the Philippines, and Vietnam under the Economics of Sanitation Initiative (ESI)
Table C10. Total release of domestic polluting substances to water bodies
Province
Total release per day Polluting substances (tons per year)
Feces (‘000 kg)
Urine (m3)Gray
(million m3)
BOD N P TSS Coliform
count(1015)
NAD 336.7 3,367 44.9 40,964 7,374 1,884 55,711 90,763
North Sumatra 967.8 9,678 129.0 117,745 21,194 5,416 160,133 240,818
West Sumatra 429.0 4,290 57.2 52,195 9,395 2,401 70,985 128,857
R i a u 317.1 3,171 42.3 38,586 6,946 1,775 52,478 68,496
J a m b i 240.1 2,401 32.0 29,212 5,258 1,344 39,729 69,680
South Sumatra 560.7 5,606 74.8 68,212 12,278 3,138 92,769 147,745
Bengkulu 121.1 1,211 16.2 14,738 2,653 678 20,044 30,350
Lampung 449.9 4,499 60.0 54,742 9,854 2,518 74,449 91,048
Bangka Belitung 80.5 805 10.7 9,789 1,762 450 13,313 19,533
Riau Archipelago 103.5 1,035 13.8 12,588 2,266 579 17,119 25,949
Jakarta 714.3 7,143 95.2 86,910 15,644 3,998 118,198 184,646
West Java 3359.5 33,595 447.9 408,741 73,573 18,802 555,888 923,661
Central Java 2625.1 26,251 350.0 319,382 57,489 14,692 434,360 695,859
Yogyakarta 233.4 2,334 31.1 28,398 5,112 1,306 38,622 52,143
East Java 2849.0 28,490 379.9 346,627 62,393 15,945 471,412 719,443
Banten 683.5 6,835 91.1 83,156 14,968 3,825 113,093 164,263
B a l i 256.9 2,569 34.2 31,252 5,625 1,438 42,503 62,362
West Nusa Tenggara 379.6 3,796 50.6 46,183 8,313 2,124 62,808 110,773
East Nusa Tenggara 269.6 2,696 35.9 32,800 5,904 1,509 44,608 54,124
West Kalimantan 333.0 3,330 44.4 40,519 7,293 1,864 55,106 88,646
Central Kalimantan 186.3 1,863 24.8 22,668 4,080 1,043 30,828 58,449
South Kalimantan 277.5 2,775 37.0 33,764 6,077 1,553 45,918 74,650
East Kalimantan 218.3 2,183 29.1 26,561 4,781 1,222 36,123 52,640
North Sulawesi 150.4 1,504 20.1 18,299 3,294 842 24,887 34,053
Central Sulawesi 200.2 2,002 26.7 24,355 4,384 1,120 33,123 56,057
South Sulawesi 546.7 5,467 72.9 66,517 11,973 3,060 90,463 127,915
Southeast Sulawesi 138.7 1,387 18.5 16,877 3,038 776 22,953 31,177
Gorontalo 76.6 766 10.2 9,317 1,677 429 12,672 20,204
West Sulawesi 82.2 822 11.0 9,996 1,799 460 13,594 22,376
Maluku 101.3 1,013 13.5 12,320 2,218 567 16,755 26,165
North Maluku 68.3 683 9.1 8,307 1,495 382 11,297 16,831
West Papua 55.8 558 7.4 6,784 1,221 312 9,227 15,690
Papua 152.6 1,526 20.3 18,569 3,342 854 25,254 39,446
Indonesia Total 17565 175,503 2340.0 2,135,288 384,352 98,223 2,903,992 4,505,582
Source: Authors’ estimates

ANNEXES
72Economic Impacts of Sanitation in IndonesiaA five-country study conducted in Cambodia, Indonesia, Lao PDR, the Philippines, and Vietnam under the Economics of Sanitation Initiative (ESI)
Table C11. Industrial pollution load in Jakarta, 2004
Industry sub-sectorVolume of waste
Polluting substances
BOD N TSS
m3 % tons % tons % tons %
Agro industry 20 0.0 2,776 0.3 121 61.1 3,072 0.3
Food processing 158,742 5.1 473,839 49.7 38 19.2 51,012 5.6
Drinks 320 0.0 142 0.0 0 0.0 86 0.0
Textile 564,310 18.0 380,025 39.9 0 0.0 215,879 23.5
Leather 26 0.0 45 0.0 8 4.0 69 0.0
Wood processing 439 0.0 64,200 6.7 26 13.1 118 0.0
Basic chemicals 12,533 0.4 22,038 2.3 5 2.5 12,650 1.4
Non-metallic mineral processing
2,065,500 65.7 0 0.0 0 0.0 31,500 3.4
Basic metals 52,200 1.7 0 0.0 0 0.0 1,543 0.2
Metal processing 16,775 0.5 5,887 0.6 0 0.0 2,532 0.3
Electricity and gas 270,900 8.6 4,620 0.5 0 0.0 600,600 65.3
Total 3,141,765 100.00 953,572 100.00 198 100.00 919,061 100.00
Source: Ministry of Environment. Status Lingkungan Hidup Indonesia 2005. Jakarta, 2006.

ANNEXES
73Economic Impacts of Sanitation in Indonesia
A five-country study conducted in Cambodia, Indonesia, Lao PDR, the Philippines, and Vietnam under the Economics of Sanitation Initiative (ESI)
Table C12. Contribution of domestic sources to overall water pollution (% of BOD)Province Industry Agriculture Domestic Total
BOD (‘000 tons)
%BOD (‘000
tons)%
BOD (‘000 tons)
%BOD (‘000
tons)%
NAD 156 73 16 8 41 19 213 100
North Sumatra 477 73 59 9 118 18 654 100
West Sumatra 73 51 18 12 52 37 142 100
R i a u 378 88 12 3 39 9 429 100
J a m b i 36 49 9 11 29 39 74 100
South Sumatra 218 70 26 8 68 22 312 100
Bengkulu 6 24 3 15 15 62 24 100
Lampung 72 47 26 17 55 36 152 100
Bangka Belitung 43 80 1 2 10 18 54 100
Riau Archipelago 358 94 12 3 13 3 382 100
Jakarta 954 92 0 0 87 8 1,041 100
West Java 2,077 75 276 10 409 15 2,762 100
Central Java 1,006 72 67 5 319 23 1,393 100
Yogyakarta 53 55 16 16 28 29 97 100
East Java 1,608 76 149 7 347 16 2,103 100
Banten 589 86 12 2 83 12 684 100
B a l i 42 51 8 10 31 38 82 100
West Nusa Tenggara 12 18 9 13 46 69 67 100
East Nusa Tenggara 4 8 8 19 33 73 45 100
West Kalimantan 94 63 15 10 41 27 149 100
Central Kalimantan 26 48 5 10 23 42 54 100
South Kalimantan 63 54 21 17 34 29 118 100
East Kalimantan 781 95 17 2 27 3 825 100
North Sulawesi 23 53 3 6 18 41 44 100
Central Sulawesi 18 39 3 8 24 54 46 100
South Sulawesi 52 40 11 8 67 51 129 100
Southeast Sulawesi 10 31 6 17 17 52 33 100
Gorontalo 4 26 1 8 9 66 14 100
West Sulawesi 52 72 11 15 10 14 73 100
Maluku 3 17 1 7 12 75 16 100
North Maluku 6 38 1 5 8 57 15 100
West Irian Jaya 20 73 1 2 7 25 27 100
Papua 10 35 1 2 19 63 29 100
Indonesia Total 9,321 76 821 7 2,137 17 2,279 100
Source: Authors’ estimates
ANNEXES
74Economic Impacts of Sanitation in IndonesiaA five-country study conducted in Cambodia, Indonesia, Lao PDR, the Philippines, and Vietnam under the Economics of Sanitation Initiative (ESI)
Table C13. Selected river quality indicators, 2003Province
RiverLocation Batch pH DO (mg/l) BOD (mg/l) TSS (mg/l) TDS (mg/l) DO (2005)
NAD Krueng Tamiang
Up-stream
I 7.0 6.7 0.6 - 250.0 6.2 - 9
II 7.2 7.0 0.7 - 500.0
Down-stream
I 6.0 6.0 3.3 - 580.0
II 6.5 6.6 2.5 - 1700.0
North Sumatra Deli
Up-stream
I 8.7 5.7 3.2 36.0 - 0.7 - 7.7
II 7.3 8.4 4.1 36.0 -
Down-stream
I 6.6 2.4 6.5 20.0 -
II 6.8 2.4 7.7 104.0 -
West Sumatra Batang Agam
5.2 - 7
Riau Kampar
1.2 - 7.8
Jambi Batang Hari
Up-stream
I 7.5 5.7 4.0 206.0 59.0 3 - 6.5
II 6.9 5.9 1.0 72.0 76.0
Down-stream
I 5.8 5.3 1.4 4.0 74.0
II 6.0 5.7 4.0 76.0 104.0
South Sumatra Musi
Up-stream
I 6.1 3.2 8.0 24.0 - 1.8 - 7.9
II 7.4 3.2 1.7 33.7 -
Down-stream
I 6.0 4.2 8.7 25.0 -
II 8.0 3.0 1.8 32.2 -
Bengkulu Air Bengkulu
Up-stream
I 6.8 4.1 1.0 24.2 30.0 1.1 - 3.8
II 6.6 2.9 20.0 95.2 90.0
Down-stream
I - - - - -
II 6.0 3.8 3.4 156.0 20.0
Lampung Way Sekampung
1.9 - 4
Bangka-Belitung Rangkui
Up-stream
I 5.9 1.6 12.0 - 68.2 1.6 - 7.5
II 5.7 7.4 4.5 - 87.4
Down-stream
I 6.8 2.1 6.0 - 11.4
II 8.0 8.8 5.2 - 15.7
Jakarta Ciliwung
Up-stream
I 7.6 2.7 0.8 7.0 - 0 - 5.8
II 7.5 4.1 5.1 10.0 -
Down-stream
I 7.0 0.4 20.8 30.0 -
II 7.3 2.1 47.1 59.0 -
West Java Citarum
Up-stream
I 9.5 0.8 34.0 98.0 667.0 0 - 5.9
II 7.2 3.9 8.2 800.0 170.0
Down-stream
I 7.4 3.1 12.0 75.0 310.0
II 7.1 2.6 17.2 3220.0 134.0
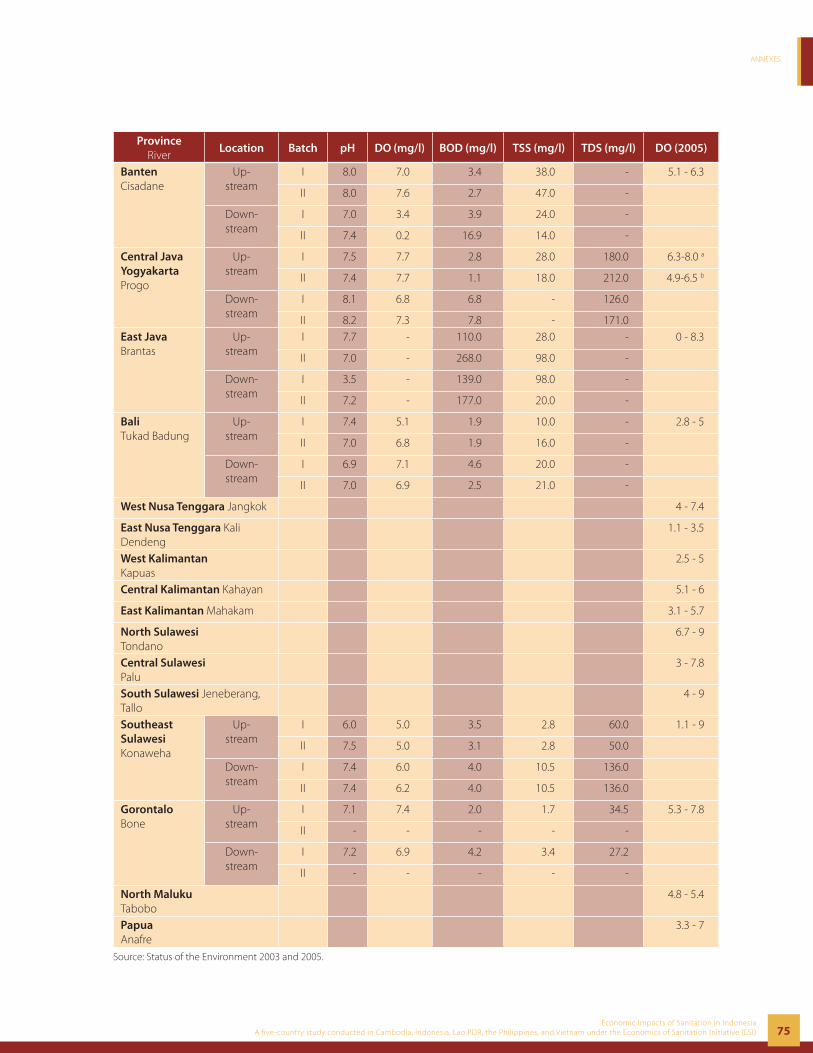
ANNEXES
75Economic Impacts of Sanitation in Indonesia
A five-country study conducted in Cambodia, Indonesia, Lao PDR, the Philippines, and Vietnam under the Economics of Sanitation Initiative (ESI)
ProvinceRiver
Location Batch pH DO (mg/l) BOD (mg/l) TSS (mg/l) TDS (mg/l) DO (2005)
Banten Cisadane
Up-stream
I 8.0 7.0 3.4 38.0 - 5.1 - 6.3
II 8.0 7.6 2.7 47.0 -
Down-stream
I 7.0 3.4 3.9 24.0 -
II 7.4 0.2 16.9 14.0 -
Central Java Yogyakarta Progo
Up-stream
I 7.5 7.7 2.8 28.0 180.0 6.3-8.0 a
II 7.4 7.7 1.1 18.0 212.0 4.9-6.5 b
Down-stream
I 8.1 6.8 6.8 - 126.0
II 8.2 7.3 7.8 - 171.0East Java Brantas
Up-stream
I 7.7 - 110.0 28.0 - 0 - 8.3
II 7.0 - 268.0 98.0 -
Down-stream
I 3.5 - 139.0 98.0 -
II 7.2 - 177.0 20.0 -
Bali Tukad Badung
Up-stream
I 7.4 5.1 1.9 10.0 - 2.8 - 5
II 7.0 6.8 1.9 16.0 -
Down-stream
I 6.9 7.1 4.6 20.0 -
II 7.0 6.9 2.5 21.0 -
West Nusa Tenggara Jangkok 4 - 7.4
East Nusa Tenggara Kali Dendeng
1.1 - 3.5
West Kalimantan Kapuas
2.5 - 5
Central Kalimantan Kahayan 5.1 - 6
East Kalimantan Mahakam 3.1 - 5.7
North Sulawesi Tondano
6.7 - 9
Central Sulawesi Palu
3 - 7.8
South Sulawesi Jeneberang, Tallo
4 - 9
Southeast Sulawesi Konaweha
Up-stream
I 6.0 5.0 3.5 2.8 60.0 1.1 - 9
II 7.5 5.0 3.1 2.8 50.0
Down-stream
I 7.4 6.0 4.0 10.5 136.0
II 7.4 6.2 4.0 10.5 136.0
Gorontalo Bone
Up-stream
I 7.1 7.4 2.0 1.7 34.5 5.3 - 7.8
II - - - - -
Down-stream
I 7.2 6.9 4.2 3.4 27.2
II - - - - -
North Maluku Tabobo
4.8 - 5.4
Papua Anafre
3.3 - 7
Source: Status of the Environment 2003 and 2005.
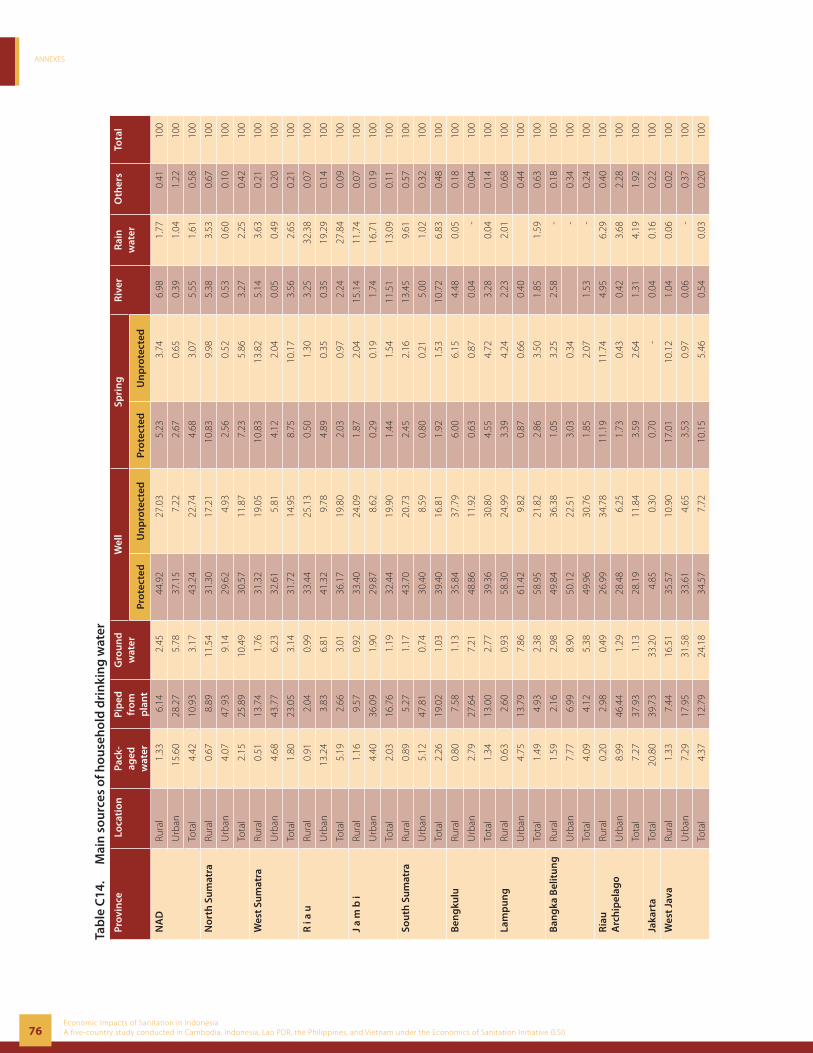
ANNEXES
76Economic Impacts of Sanitation in IndonesiaA five-country study conducted in Cambodia, Indonesia, Lao PDR, the Philippines, and Vietnam under the Economics of Sanitation Initiative (ESI)
Tab
le C
14.
Mai
n s
ourc
es o
f hou
seh
old
dri
nki
ng
wat
erPr
ovin
ce L
ocat
ion
Pack
-ag
ed
wat
er
Pip
ed
from
p
lan
t
Gro
und
w
ater
Wel
lSp
rin
gR
iver
Rai
nw
ater
Oth
ers
Tota
l
Prot
ecte
dU
np
rote
cted
Pr
otec
ted
Un
pro
tect
ed
NA
DRu
ral
1.33
6.14
2.45
4
4.92
2
7.03
5.
23
3.74
6.
98
1.77
0.
41
100
Urb
an15
.60
28.2
75.
78
37.
15
7.22
2.
67
0.65
0.
39
1.04
1.
22
100
Tota
l4.
4210
.93
3.17
4
3.24
2
2.74
4.
68
3.07
5.
55
1.61
0.
58
100
Nor
th S
umat
raRu
ral
0.67
8.89
11.
54
31.
30
17.
21
10.
83
9.98
5.
38
3.53
0.
67
100
Urb
an4.
0747
.93
9.14
2
9.62
4.
93
2.56
0.
52
0.53
0.
60
0.10
10
0
Tota
l2.
1525
.89
10.
49
30.
57
11.
87
7.23
5.
86
3.27
2.
25
0.42
10
0
Wes
t Sum
atra
Rura
l0.
5113
.74
1.76
3
1.32
1
9.05
1
0.83
1
3.82
5.
14
3.63
0.
21
100
Urb
an4.
6843
.77
6.23
3
2.61
5.
81
4.12
2.
04
0.05
0.
49
0.20
10
0
Tota
l1.
8023
.05
3.14
3
1.72
1
4.95
8.
75
10.
17
3.56
2.
65
0.21
10
0
R i a
uRu
ral
0.91
2.04
0.99
3
3.44
2
5.13
0.
50
1.30
3.
25
32.
38
0.07
10
0
Urb
an13
.24
3.83
6.81
4
1.32
9.
78
4.89
0.
35
0.35
1
9.29
0.
14
100
Tota
l5.
192.
663.
01
36.
17
19.
80
2.03
0.
97
2.24
2
7.84
0.
09
100
J a
m b
iRu
ral
1.16
9.57
0.92
3
3.40
2
4.09
1.
87
2.04
1
5.14
1
1.74
0.
07
100
Urb
an4.
4036
.09
1.90
2
9.87
8.
62
0.29
0.
19
1.74
1
6.71
0.
19
100
Tota
l2.
0316
.76
1.19
3
2.44
1
9.90
1.
44
1.54
1
1.51
1
3.09
0.
11
100
Sout
h S
umat
raRu
ral
0.89
5.27
1.17
4
3.70
2
0.73
2.
45
2.16
1
3.45
9.
61
0.57
10
0
Urb
an5.
1247
.81
0.74
3
0.40
8.
59
0.80
0.
21
5.00
1.
02
0.32
10
0
Tota
l2.
2619
.02
1.03
3
9.40
1
6.81
1.
92
1.53
1
0.72
6.
83
0.48
10
0
Ben
gku
luRu
ral
0.80
7.58
1.13
3
5.84
3
7.79
6.
00
6.15
4.
48
0.05
0.
18
100
Urb
an2.
7927
.64
7.21
4
8.86
1
1.92
0.
63
0.87
0.
04
- 0.
04
100
Tota
l1.
3413
.00
2.77
3
9.36
3
0.80
4.
55
4.72
3.
28
0.04
0.
14
100
Lam
pun
gRu
ral
0.63
2.60
0.93
5
8.30
2
4.99
3.
39
4.24
2.
23
2.01
0.
68
100
Urb
an4.
7513
.79
7.86
6
1.42
9.
82
0.87
0.
66
0.40
0.
44
100
Tota
l1.
494.
932.
38
58.
95
21.
82
2.86
3.
50
1.85
1.
59
0.63
10
0
Ban
gka
Bel
itun
gRu
ral
1.59
2.16
2.98
4
9.84
3
6.38
1.
05
3.25
2.
58
- 0.
18
100
Urb
an7.
776.
998.
90
50.
12
22.
51
3.03
0.
34
- 0.
34
100
Tota
l4.
094.
125.
38
49.
96
30.
76
1.85
2.
07
1.53
-
0.24
10
0
Ria
u A
rch
ipel
ago
Rura
l0.
202.
980.
49
26.
99
34.
78
11.
19
11.
74
4.95
6.
29
0.40
10
0
Urb
an8.
9946
.44
1.29
2
8.48
6.
25
1.73
0.
43
0.42
3.
68
2.28
10
0
Tota
l7.
2737
.93
1.13
2
8.19
1
1.84
3.
59
2.64
1.
31
4.19
1.
92
100
Jaka
rta
Tota
l20
.80
39.7
3 3
3.20
4.
85
0.30
0.
70
-
0.04
0.
16
0.22
10
0
Wes
t Jav
aRu
ral
1.33
7.44
16.
51
35.
57
10.
90
17.
01
10.
12
1.04
0.
06
0.02
10
0
Urb
an7.
2917
.95
31.
58
33.
61
4.65
3.
53
0.97
0.
06
- 0.
37
100
Tota
l4.
3712
.79
24.
18
34.
57
7.72
1
0.15
5.
46
0.54
0.
03
0.20
10
0
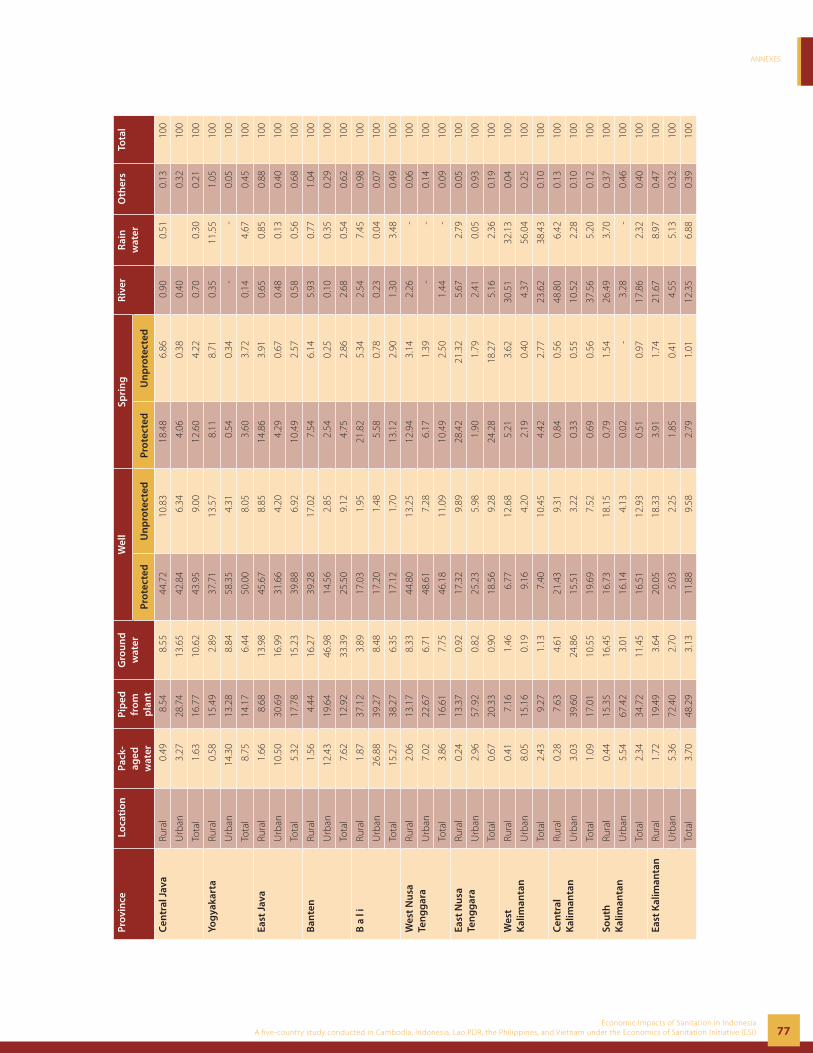
ANNEXES
77Economic Impacts of Sanitation in Indonesia
A five-country study conducted in Cambodia, Indonesia, Lao PDR, the Philippines, and Vietnam under the Economics of Sanitation Initiative (ESI)
Prov
ince
Loc
atio
nPa
ck-
aged
w
ater
Pip
ed
from
p
lan
t
Gro
und
w
ater
Wel
lSp
rin
gR
iver
Rai
nw
ater
Oth
ers
Tota
l
Prot
ecte
dU
np
rote
cted
Pr
otec
ted
Un
pro
tect
ed
Cen
tral
Jav
aRu
ral
0.49
8.54
8.55
4
4.72
1
0.83
1
8.48
6.
86
0.90
0.
51
0.13
10
0
Urb
an3.
2728
.74
13.
65
42.
84
6.34
4.
06
0.38
0.
40
0.32
10
0
Tota
l1.
6316
.77
10.
62
43.
95
9.00
1
2.60
4.
22
0.70
0.
30
0.21
10
0
Yog
yaka
rta
Rura
l0.
5815
.49
2.89
3
7.71
1
3.57
8.
11
8.71
0.
35
11.
55
1.05
10
0
Urb
an14
.30
13.2
88.
84
58.
35
4.31
0.
54
0.34
-
-
0.05
10
0
Tota
l8.
7514
.17
6.44
5
0.00
8.
05
3.60
3.
72
0.14
4.
67
0.45
10
0
East
Jav
aRu
ral
1.66
8.68
13.
98
45.
67
8.85
1
4.86
3.
91
0.65
0.
85
0.88
10
0
Urb
an10
.50
30.6
9 1
6.99
3
1.66
4.
20
4.29
0.
67
0.48
0.
13
0.40
10
0
Tota
l5.
3217
.78
15.
23
39.
88
6.92
1
0.49
2.
57
0.58
0.
56
0.68
10
0
Ban
ten
Rura
l1.
564.
44 1
6.27
3
9.28
1
7.02
7.
54
6.14
5.
93
0.77
1.
04
100
Urb
an12
.43
19.6
4 4
6.98
1
4.56
2.
85
2.54
0.
25
0.10
0.
35
0.29
10
0
Tota
l7.
6212
.92
33.
39
25.
50
9.12
4.
75
2.86
2.
68
0.54
0.
62
100
B a
l i
Rura
l1.
8737
.12
3.89
1
7.03
1.
95
21.
82
5.34
2.
54
7.45
0.
98
100
Urb
an26
.88
39.2
78.
48
17.
20
1.48
5.
58
0.78
0.
23
0.04
0.
07
100
Tota
l15
.27
38.2
76.
35
17.
12
1.70
1
3.12
2.
90
1.30
3.
48
0.49
10
0
Wes
t Nus
a Te
ng
gar
aRu
ral
2.06
13.1
78.
33
44.
80
13.
25
12.
94
3.14
2.
26
- 0.
06
100
Urb
an7.
0222
.67
6.71
4
8.61
7.
28
6.17
1.
39
-
- 0.
14
100
Tota
l3.
8616
.61
7.75
4
6.18
1
1.09
1
0.49
2.
50
1.44
-
0.09
10
0
East
Nus
a Te
ng
gar
aRu
ral
0.24
13.3
70.
92
17.
32
9.89
2
8.42
2
1.32
5.
67
2.79
0.
05
100
Urb
an2.
9657
.92
0.82
2
5.23
5.
98
1.90
1.
79
2.41
0.
05
0.93
10
0
Tota
l0.
6720
.33
0.90
1
8.56
9.
28
24.
28
18.
27
5.16
2.
36
0.19
10
0
Wes
t K
alim
anta
nRu
ral
0.41
7.16
1.46
6.
77
12.
68
5.21
3.
62
30.
51
32.
13
0.04
10
0
Urb
an8.
0515
.16
0.19
9.
16
4.20
2.
19
0.40
4.
37
56.
04
0.25
10
0
Tota
l2.
439.
271.
13
7.40
1
0.45
4.
42
2.77
2
3.62
3
8.43
0.
10
100
Cen
tral
K
alim
anta
nRu
ral
0.28
7.63
4.61
2
1.43
9.
31
0.84
0.
56
48.
80
6.42
0.
13
100
Urb
an3.
0339
.60
24.
86
15.
51
3.22
0.
33
0.55
1
0.52
2.
28
0.10
10
0
Tota
l1.
0917
.01
10.
55
19.
69
7.52
0.
69
0.56
3
7.56
5.
20
0.12
10
0
Sout
h
Kal
iman
tan
Ru
ral
0.44
15.3
5 1
6.45
1
6.73
1
8.15
0.
79
1.54
2
6.49
3.
70
0.37
10
0
Urb
an5.
5467
.42
3.01
1
6.14
4.
13
0.02
-
3.
28
- 0.
46
100
Tota
l2.
3434
.72
11.
45
16.
51
12.
93
0.51
0.
97
17.
86
2.32
0.
40
100
East
Kal
iman
tan
Rura
l1.
7219
.49
3.64
2
0.05
1
8.33
3.
91
1.74
2
1.67
8.
97
0.47
10
0
Urb
an5.
3672
.40
2.70
5.
03
2.25
1.
85
0.41
4.
55
5.13
0.
32
100
Tota
l3.
7048
.29
3.13
1
1.88
9.
58
2.79
1.
01
12.
35
6.88
0.
39
100

ANNEXES
78Economic Impacts of Sanitation in IndonesiaA five-country study conducted in Cambodia, Indonesia, Lao PDR, the Philippines, and Vietnam under the Economics of Sanitation Initiative (ESI)
Prov
ince
Loc
atio
nPa
ck-
aged
w
ater
Pip
ed
from
p
lan
t
Gro
und
w
ater
Wel
lSp
rin
gR
iver
Rai
nw
ater
Oth
ers
Tota
l
Prot
ecte
dU
np
rote
cted
Pr
otec
ted
Un
pro
tect
ed
Nor
th S
ulaw
esi
Rura
l1.
4522
.57
1.78
4
0.35
8.
50
19.
32
3.96
0.
28
1.75
0.
03
100
Urb
an6.
7038
.70
10.
84
31.
65
6.98
3.
85
0.68
0.
47
- 0.
13
100
Tota
l3.
4528
.72
5.24
3
7.03
7.
92
13.
43
2.71
0.
35
1.09
0.
07
100
Cen
tral
Sul
awes
iRu
ral
0.50
12.4
1 1
0.02
2
9.91
1
5.00
1
8.83
4.
14
7.69
1.
41
0.11
10
0
Urb
an11
.64
40.8
6 2
8.01
8.
80
0.40
9.
18
0.41
0.
18
- 0.
52
100
Tota
l2.
7318
.12
13.
63
25.
67
12.
07
16.
89
3.39
6.
18
1.13
0.
19
100
Sout
h S
ulaw
esi
Rura
l0.
429.
78 1
1.78
3
6.87
1
9.61
1
1.60
6.
66
2.31
0.
86
0.13
10
0
Urb
an4.
1959
.23
7.19
2
0.98
5.
03
1.53
0.
75
0.97
0.
03
0.08
10
0
Tota
l1.
6225
.50
10.
32
31.
81
14.
97
8.40
4.
78
1.88
0.
59
0.11
10
0
Sout
hea
st
Sula
wes
iRu
ral
0.33
19.4
91.
64
36.
20
19.
60
12.
31
5.53
2.
44
2.14
0.
33
100
Urb
an2.
6558
.74
5.50
2
0.66
6.
29
4.93
0.
83
0.29
0.
03
0.08
10
0
Tota
l0.
8428
.09
2.49
3
2.79
1
6.68
1
0.69
4.
50
1.97
1.
68
0.27
10
0
Gor
onta
loRu
ral
0.75
9.33
0.71
5
3.55
2
0.10
5.
51
1.59
7.
38
0.11
0.
96
100
Urb
an1.
0734
.12
4.76
5
2.43
7.
12
0.49
-
-
-
- 10
0
Tota
l0.
8416
.02
1.81
5
3.25
1
6.60
4.
15
1.16
5.
39
0.08
0.
70
100
Wes
t Sul
awes
iRu
ral
0.37
8.32
2.95
3
0.90
1
7.02
1
1.75
1
5.67
1
0.87
1.
70
0.45
10
0
Urb
an3.
3738
.73
9.70
3
4.90
5.
95
5.70
0.
14
1.51
10
0
Tota
l0.
8112
.80
3.94
3
1.49
1
5.39
1
0.86
1
3.37
9.
29
1.45
0.
60
100
Mal
uku
Rura
l0.
0514
.43
1.14
3
9.42
1
3.93
2
3.12
5.
75
1.60
0.
42
0.13
10
0
Urb
an1.
8946
.98
4.74
2
5.03
6.
46
6.86
0.
36
1.43
4.
85
1.39
10
0
Tota
l0.
5823
.79
2.17
3
5.28
1
1.78
1
8.45
4.
20
1.55
1.
70
0.49
10
0
Nor
th M
aluk
uRu
ral
0.36
9.02
0.96
4
2.52
2
9.38
6.
80
4.69
3.
66
2.56
0.
05
100
Urb
an0.
8463
.65
1.65
1
7.35
1
1.55
0.
76
-
-
4.20
-
100
Tota
l0.
4822
.50
1.13
3
6.31
2
4.98
5.
31
3.53
2.
76
2.97
0.
04
100
Wes
t Pap
uaRu
ral
0.44
11.0
01.
09
10.
84
10.
40
7.96
2
7.13
1
8.67
1
2.30
0.
17
100
Urb
an13
.27
45.8
22.
44
11.
33
14.
26
2.05
1.
86
1.60
7.
38
- 10
0
Tota
l4.
8923
.09
1.56
1
1.01
1
1.74
5.
91
18.
36
12.
75
10.
59
0.11
10
0
Pap
uaRu
ral
1.80
5.17
0.61
7.
22
9.73
1
0.31
3
5.30
1
7.28
1
2.43
0.
14
100
Urb
an8.
6742
.48
9.21
1
9.37
5.
75
6.08
0.
34
0.25
7.
37
0.48
10
0
Tota
l3.
4013
.84
2.61
1
0.04
8.
80
9.32
2
7.18
1
3.33
1
1.26
0.
22
100
Ind
ones
ia T
otal
Rura
l1.
029.
039.
23
38.
15
14.
26
12.
85
6.89
4.
78
3.41
0.
38
100
Urb
an8.
9530
.80
19.
47
29.
98
4.77
3.
14
0.60
0.
61
1.35
0.
33
100
Tota
l4.
4118
.34
13.6
134
.66
10.2
08.
704.
203.
002.
530.
3610
0
Sour
ce: S
usen
as 2
006
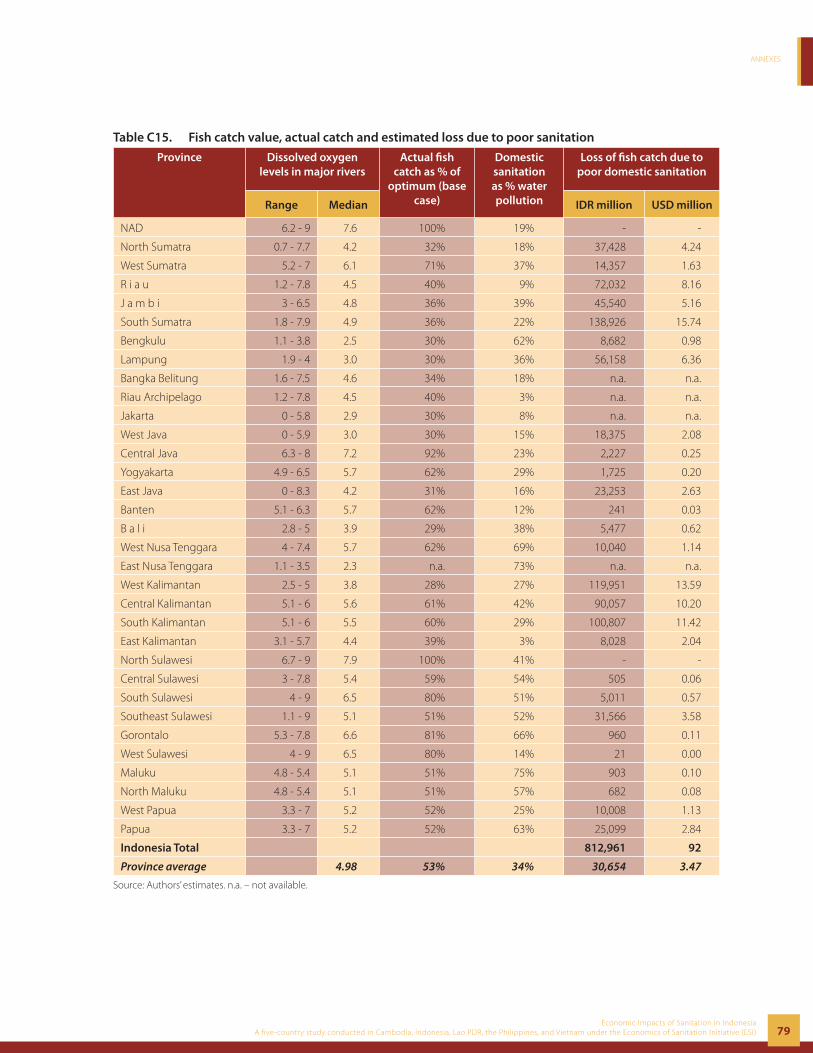
ANNEXES
79Economic Impacts of Sanitation in Indonesia
A five-country study conducted in Cambodia, Indonesia, Lao PDR, the Philippines, and Vietnam under the Economics of Sanitation Initiative (ESI)
Table C15. Fish catch value, actual catch and estimated loss due to poor sanitation
Province Dissolved oxygen levels in major rivers
Actual fi sh catch as % of
optimum (base case)
Domestic sanitation as % water pollution
Loss of fi sh catch due to poor domestic sanitation
Range Median IDR million USD million
NAD 6.2 - 9 7.6 100% 19% - -
North Sumatra 0.7 - 7.7 4.2 32% 18% 37,428 4.24
West Sumatra 5.2 - 7 6.1 71% 37% 14,357 1.63
R i a u 1.2 - 7.8 4.5 40% 9% 72,032 8.16
J a m b i 3 - 6.5 4.8 36% 39% 45,540 5.16
South Sumatra 1.8 - 7.9 4.9 36% 22% 138,926 15.74
Bengkulu 1.1 - 3.8 2.5 30% 62% 8,682 0.98
Lampung 1.9 - 4 3.0 30% 36% 56,158 6.36
Bangka Belitung 1.6 - 7.5 4.6 34% 18% n.a. n.a.
Riau Archipelago 1.2 - 7.8 4.5 40% 3% n.a. n.a.
Jakarta 0 - 5.8 2.9 30% 8% n.a. n.a.
West Java 0 - 5.9 3.0 30% 15% 18,375 2.08
Central Java 6.3 - 8 7.2 92% 23% 2,227 0.25
Yogyakarta 4.9 - 6.5 5.7 62% 29% 1,725 0.20
East Java 0 - 8.3 4.2 31% 16% 23,253 2.63
Banten 5.1 - 6.3 5.7 62% 12% 241 0.03
B a l i 2.8 - 5 3.9 29% 38% 5,477 0.62
West Nusa Tenggara 4 - 7.4 5.7 62% 69% 10,040 1.14
East Nusa Tenggara 1.1 - 3.5 2.3 n.a. 73% n.a. n.a.
West Kalimantan 2.5 - 5 3.8 28% 27% 119,951 13.59
Central Kalimantan 5.1 - 6 5.6 61% 42% 90,057 10.20
South Kalimantan 5.1 - 6 5.5 60% 29% 100,807 11.42
East Kalimantan 3.1 - 5.7 4.4 39% 3% 8,028 2.04
North Sulawesi 6.7 - 9 7.9 100% 41% - -
Central Sulawesi 3 - 7.8 5.4 59% 54% 505 0.06
South Sulawesi 4 - 9 6.5 80% 51% 5,011 0.57
Southeast Sulawesi 1.1 - 9 5.1 51% 52% 31,566 3.58
Gorontalo 5.3 - 7.8 6.6 81% 66% 960 0.11
West Sulawesi 4 - 9 6.5 80% 14% 21 0.00
Maluku 4.8 - 5.4 5.1 51% 75% 903 0.10
North Maluku 4.8 - 5.4 5.1 51% 57% 682 0.08
West Papua 3.3 - 7 5.2 52% 25% 10,008 1.13
Papua 3.3 - 7 5.2 52% 63% 25,099 2.84
Indonesia Total 812,961 92
Province average 4.98 53% 34% 30,654 3.47
Source: Authors’ estimates. n.a. – not available.
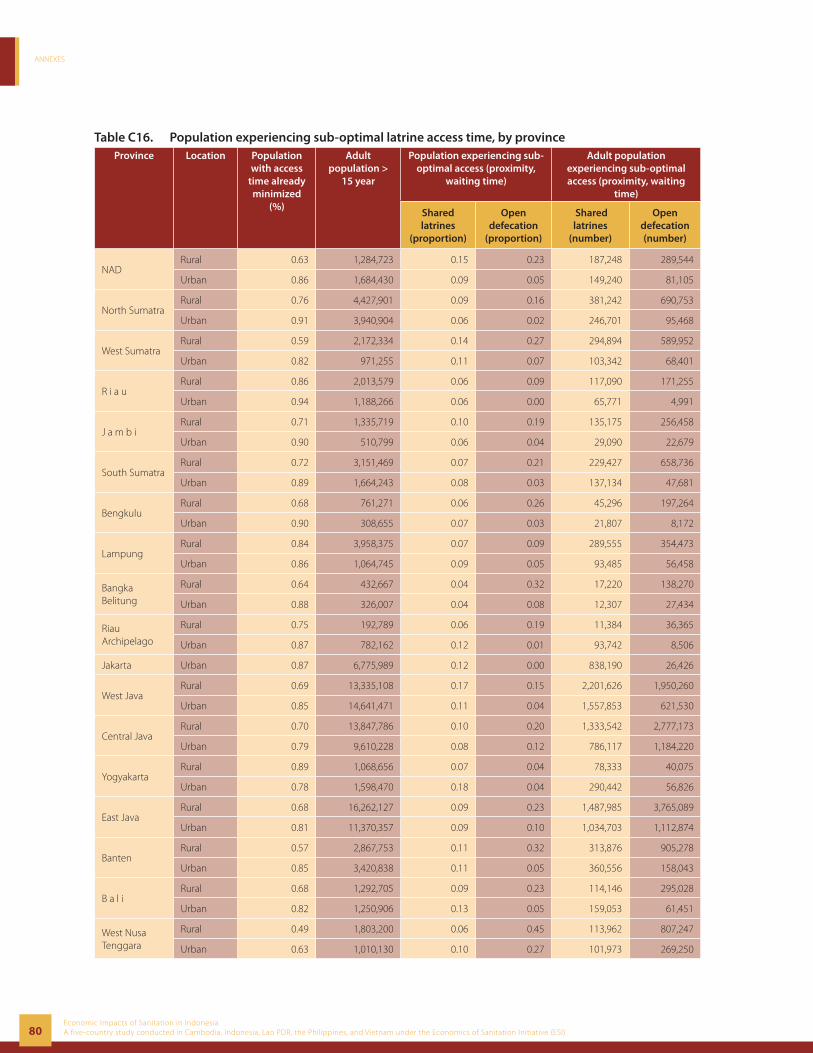
ANNEXES
80Economic Impacts of Sanitation in IndonesiaA five-country study conducted in Cambodia, Indonesia, Lao PDR, the Philippines, and Vietnam under the Economics of Sanitation Initiative (ESI)
Table C16. Population experiencing sub-optimal latrine access time, by provinceProvince Location Population
with access time already minimized
(%)
Adult population >
15 year
Population experiencing sub-optimal access (proximity,
waiting time)
Adult population experiencing sub-optimal access (proximity, waiting
time)
Shared latrines
(proportion)
Open defecation
(proportion)
Shared latrines
(number)
Open defecation (number)
NADRural 0.63 1,284,723 0.15 0.23 187,248 289,544
Urban 0.86 1,684,430 0.09 0.05 149,240 81,105
North SumatraRural 0.76 4,427,901 0.09 0.16 381,242 690,753
Urban 0.91 3,940,904 0.06 0.02 246,701 95,468
West SumatraRural 0.59 2,172,334 0.14 0.27 294,894 589,952
Urban 0.82 971,255 0.11 0.07 103,342 68,401
R i a uRural 0.86 2,013,579 0.06 0.09 117,090 171,255
Urban 0.94 1,188,266 0.06 0.00 65,771 4,991
J a m b iRural 0.71 1,335,719 0.10 0.19 135,175 256,458
Urban 0.90 510,799 0.06 0.04 29,090 22,679
South SumatraRural 0.72 3,151,469 0.07 0.21 229,427 658,736
Urban 0.89 1,664,243 0.08 0.03 137,134 47,681
BengkuluRural 0.68 761,271 0.06 0.26 45,296 197,264
Urban 0.90 308,655 0.07 0.03 21,807 8,172
LampungRural 0.84 3,958,375 0.07 0.09 289,555 354,473
Urban 0.86 1,064,745 0.09 0.05 93,485 56,458
Bangka Belitung
Rural 0.64 432,667 0.04 0.32 17,220 138,270
Urban 0.88 326,007 0.04 0.08 12,307 27,434
Riau Archipelago
Rural 0.75 192,789 0.06 0.19 11,384 36,365
Urban 0.87 782,162 0.12 0.01 93,742 8,506
Jakarta Urban 0.87 6,775,989 0.12 0.00 838,190 26,426
West JavaRural 0.69 13,335,108 0.17 0.15 2,201,626 1,950,260
Urban 0.85 14,641,471 0.11 0.04 1,557,853 621,530
Central JavaRural 0.70 13,847,786 0.10 0.20 1,333,542 2,777,173
Urban 0.79 9,610,228 0.08 0.12 786,117 1,184,220
YogyakartaRural 0.89 1,068,656 0.07 0.04 78,333 40,075
Urban 0.78 1,598,470 0.18 0.04 290,442 56,826
East JavaRural 0.68 16,262,127 0.09 0.23 1,487,985 3,765,089
Urban 0.81 11,370,357 0.09 0.10 1,034,703 1,112,874
BantenRural 0.57 2,867,753 0.11 0.32 313,876 905,278
Urban 0.85 3,420,838 0.11 0.05 360,556 158,043
B a l iRural 0.68 1,292,705 0.09 0.23 114,146 295,028
Urban 0.82 1,250,906 0.13 0.05 159,053 61,451
West Nusa Tenggara
Rural 0.49 1,803,200 0.06 0.45 113,962 807,247
Urban 0.63 1,010,130 0.10 0.27 101,973 269,250
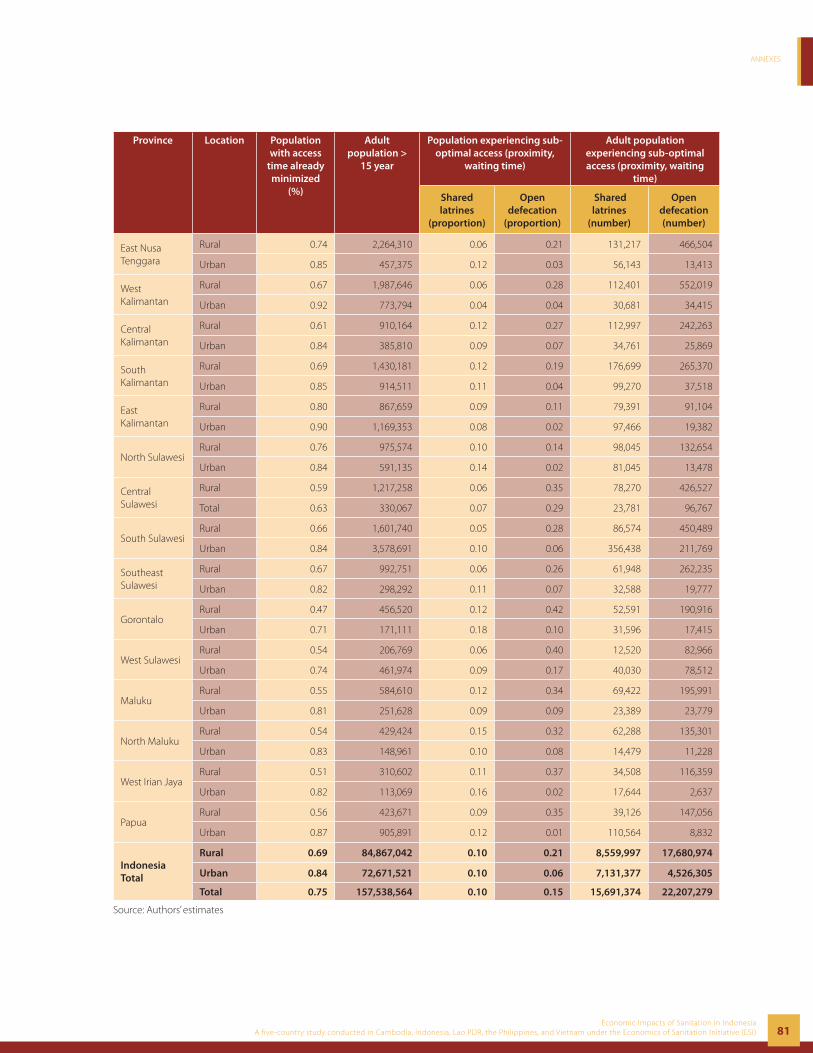
ANNEXES
81Economic Impacts of Sanitation in Indonesia
A five-country study conducted in Cambodia, Indonesia, Lao PDR, the Philippines, and Vietnam under the Economics of Sanitation Initiative (ESI)
Province Location Population with access
time already minimized
(%)
Adult population >
15 year
Population experiencing sub-optimal access (proximity,
waiting time)
Adult population experiencing sub-optimal access (proximity, waiting
time)
Shared latrines
(proportion)
Open defecation
(proportion)
Shared latrines
(number)
Open defecation (number)
East Nusa Tenggara
Rural 0.74 2,264,310 0.06 0.21 131,217 466,504
Urban 0.85 457,375 0.12 0.03 56,143 13,413
West Kalimantan
Rural 0.67 1,987,646 0.06 0.28 112,401 552,019
Urban 0.92 773,794 0.04 0.04 30,681 34,415
Central Kalimantan
Rural 0.61 910,164 0.12 0.27 112,997 242,263
Urban 0.84 385,810 0.09 0.07 34,761 25,869
South Kalimantan
Rural 0.69 1,430,181 0.12 0.19 176,699 265,370
Urban 0.85 914,511 0.11 0.04 99,270 37,518
East Kalimantan
Rural 0.80 867,659 0.09 0.11 79,391 91,104
Urban 0.90 1,169,353 0.08 0.02 97,466 19,382
North SulawesiRural 0.76 975,574 0.10 0.14 98,045 132,654
Urban 0.84 591,135 0.14 0.02 81,045 13,478
Central Sulawesi
Rural 0.59 1,217,258 0.06 0.35 78,270 426,527
Total 0.63 330,067 0.07 0.29 23,781 96,767
South SulawesiRural 0.66 1,601,740 0.05 0.28 86,574 450,489
Urban 0.84 3,578,691 0.10 0.06 356,438 211,769
Southeast Sulawesi
Rural 0.67 992,751 0.06 0.26 61,948 262,235
Urban 0.82 298,292 0.11 0.07 32,588 19,777
GorontaloRural 0.47 456,520 0.12 0.42 52,591 190,916
Urban 0.71 171,111 0.18 0.10 31,596 17,415
West SulawesiRural 0.54 206,769 0.06 0.40 12,520 82,966
Urban 0.74 461,974 0.09 0.17 40,030 78,512
MalukuRural 0.55 584,610 0.12 0.34 69,422 195,991
Urban 0.81 251,628 0.09 0.09 23,389 23,779
North MalukuRural 0.54 429,424 0.15 0.32 62,288 135,301
Urban 0.83 148,961 0.10 0.08 14,479 11,228
West Irian JayaRural 0.51 310,602 0.11 0.37 34,508 116,359
Urban 0.82 113,069 0.16 0.02 17,644 2,637
PapuaRural 0.56 423,671 0.09 0.35 39,126 147,056
Urban 0.87 905,891 0.12 0.01 110,564 8,832
Indonesia Total
Rural 0.69 84,867,042 0.10 0.21 8,559,997 17,680,974
Urban 0.84 72,671,521 0.10 0.06 7,131,377 4,526,305
Total 0.75 157,538,564 0.10 0.15 15,691,374 22,207,279
Source: Authors’ estimates
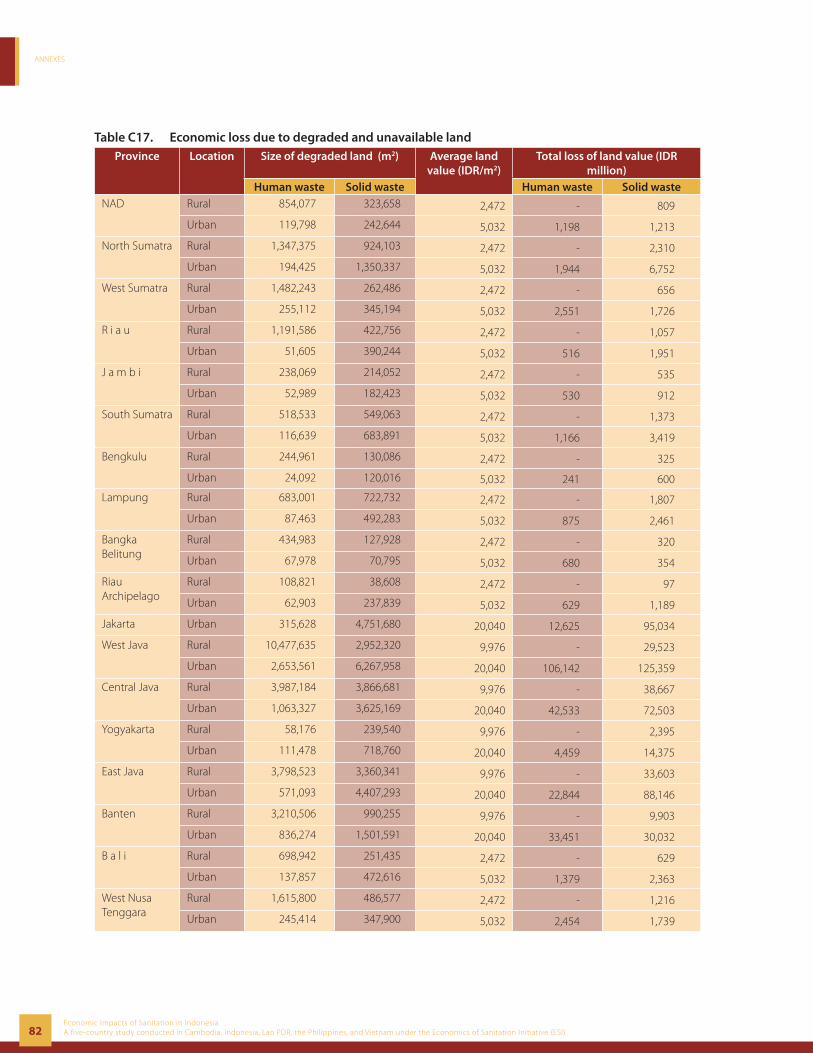
ANNEXES
82Economic Impacts of Sanitation in IndonesiaA five-country study conducted in Cambodia, Indonesia, Lao PDR, the Philippines, and Vietnam under the Economics of Sanitation Initiative (ESI)
Table C17. Economic loss due to degraded and unavailable landProvince Location Size of degraded land (m2) Average land
value (IDR/m2)Total loss of land value (IDR
million)Human waste Solid waste Human waste Solid waste
NAD Rural 854,077 323,658 2,472 - 809
Urban 119,798 242,644 5,032 1,198 1,213
North Sumatra Rural 1,347,375 924,103 2,472 - 2,310
Urban 194,425 1,350,337 5,032 1,944 6,752
West Sumatra Rural 1,482,243 262,486 2,472 - 656
Urban 255,112 345,194 5,032 2,551 1,726
R i a u Rural 1,191,586 422,756 2,472 - 1,057
Urban 51,605 390,244 5,032 516 1,951
J a m b i Rural 238,069 214,052 2,472 - 535
Urban 52,989 182,423 5,032 530 912
South Sumatra Rural 518,533 549,063 2,472 - 1,373
Urban 116,639 683,891 5,032 1,166 3,419
Bengkulu Rural 244,961 130,086 2,472 - 325
Urban 24,092 120,016 5,032 241 600
Lampung Rural 683,001 722,732 2,472 - 1,807
Urban 87,463 492,283 5,032 875 2,461
Bangka Belitung
Rural 434,983 127,928 2,472 - 320
Urban 67,978 70,795 5,032 680 354
Riau Archipelago
Rural 108,821 38,608 2,472 - 97
Urban 62,903 237,839 5,032 629 1,189
Jakarta Urban 315,628 4,751,680 20,040 12,625 95,034
West Java Rural 10,477,635 2,952,320 9,976 - 29,523
Urban 2,653,561 6,267,958 20,040 106,142 125,359
Central Java Rural 3,987,184 3,866,681 9,976 - 38,667
Urban 1,063,327 3,625,169 20,040 42,533 72,503
Yogyakarta Rural 58,176 239,540 9,976 - 2,395
Urban 111,478 718,760 20,040 4,459 14,375
East Java Rural 3,798,523 3,360,341 9,976 - 33,603
Urban 571,093 4,407,293 20,040 22,844 88,146
Banten Rural 3,210,506 990,255 9,976 - 9,903
Urban 836,274 1,501,591 20,040 33,451 30,032
B a l i Rural 698,942 251,435 2,472 - 629
Urban 137,857 472,616 5,032 1,379 2,363
West Nusa Tenggara
Rural 1,615,800 486,577 2,472 - 1,216
Urban 245,414 347,900 5,032 2,454 1,739
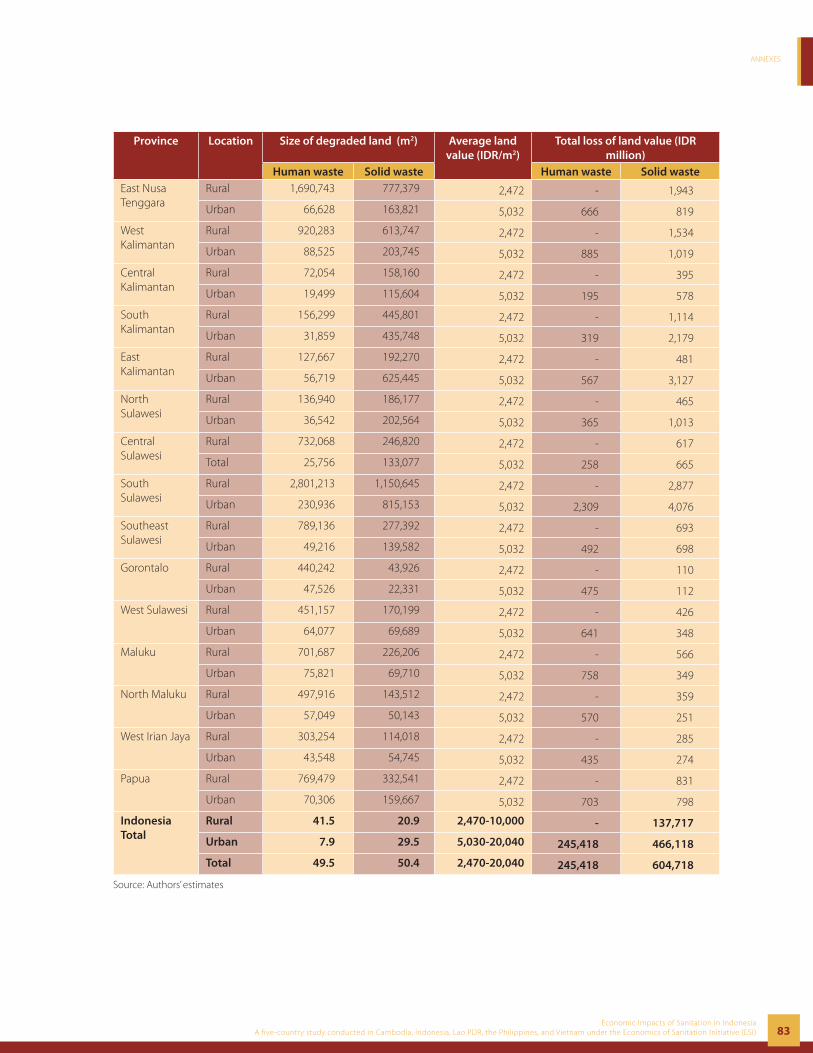
ANNEXES
83Economic Impacts of Sanitation in Indonesia
A five-country study conducted in Cambodia, Indonesia, Lao PDR, the Philippines, and Vietnam under the Economics of Sanitation Initiative (ESI)
Province Location Size of degraded land (m2) Average land value (IDR/m2)
Total loss of land value (IDR million)
Human waste Solid waste Human waste Solid wasteEast Nusa Tenggara
Rural 1,690,743 777,379 2,472 - 1,943
Urban 66,628 163,821 5,032 666 819
West Kalimantan
Rural 920,283 613,747 2,472 - 1,534
Urban 88,525 203,745 5,032 885 1,019
Central Kalimantan
Rural 72,054 158,160 2,472 - 395
Urban 19,499 115,604 5,032 195 578
South Kalimantan
Rural 156,299 445,801 2,472 - 1,114
Urban 31,859 435,748 5,032 319 2,179
East Kalimantan
Rural 127,667 192,270 2,472 - 481
Urban 56,719 625,445 5,032 567 3,127
North Sulawesi
Rural 136,940 186,177 2,472 - 465
Urban 36,542 202,564 5,032 365 1,013
Central Sulawesi
Rural 732,068 246,820 2,472 - 617
Total 25,756 133,077 5,032 258 665
South Sulawesi
Rural 2,801,213 1,150,645 2,472 - 2,877
Urban 230,936 815,153 5,032 2,309 4,076
Southeast Sulawesi
Rural 789,136 277,392 2,472 - 693
Urban 49,216 139,582 5,032 492 698
Gorontalo Rural 440,242 43,926 2,472 - 110
Urban 47,526 22,331 5,032 475 112
West Sulawesi Rural 451,157 170,199 2,472 - 426
Urban 64,077 69,689 5,032 641 348
Maluku Rural 701,687 226,206 2,472 - 566
Urban 75,821 69,710 5,032 758 349
North Maluku Rural 497,916 143,512 2,472 - 359
Urban 57,049 50,143 5,032 570 251
West Irian Jaya Rural 303,254 114,018 2,472 - 285
Urban 43,548 54,745 5,032 435 274
Papua Rural 769,479 332,541 2,472 - 831
Urban 70,306 159,667 5,032 703 798
Indonesia Total
Rural 41.5 20.9 2,470-10,000 - 137,717
Urban 7.9 29.5 5,030-20,040 245,418 466,118
Total 49.5 50.4 2,470-20,040 245,418 604,718
Source: Authors’ estimates

ANNEXES
84Economic Impacts of Sanitation in IndonesiaA five-country study conducted in Cambodia, Indonesia, Lao PDR, the Philippines, and Vietnam under the Economics of Sanitation Initiative (ESI)
Table C18. Population exposed to sub-standard practices of waste disposalProvince Location Improved sanitation
(proportion) Exposed population
(numbers) Enclosed
defecation sites
Solid waste collected
Exposed to open sewers
Exposed to open defecation sites
Exposed to open dumping of solid
wasteNAD Rural 0.70 0.01 163,850 910,107 114,786
Urban 0.94 0.29 113,552 65,735 18,328
North Sumatra Rural 0.79 0.01 362,807 1,421,166 296,532
Urban 0.97 0.34 576,911 186,903 462,339
West Sumatra Rural 0.64 0.01 53,262 1,175,986 85,414
Urban 0.91 0.37 64,887 130,190 28,839
R i a u Rural 0.89 0.00 67,072 342,611 107,859
Urban 0.99 0.35 233,095 9,763 177,480
J a m b i Rural 0.74 0.01 203,668 500,374 162,817
Urban 0.94 0.32 117,292 43,209 106,417
South Sumatra Rural 0.72 0.02 96,823 1,278,896 69,750
Urban 0.96 0.38 232,122 88,405 170,562
Bengkulu Rural 0.65 0.01 3,143 387,874 3,143
Urban 0.96 0.43 26,501 15,749 23,735
Lampung Rural 0.88 0.02 117,444 680,721 45,039
Urban 0.93 0.41 100,477 106,983 29,507
Bangka Belitung
Rural 0.57 0.01 8,509 270,578 15,558
Urban 0.89 0.11 35,045 49,398 38,832
Riau Archipelago
Rural 0.75 0.00 6,125 69,393 9,850
Urban 0.99 0.35 142,062 15,407 108,167
Jakarta Urban 0.99 0.83 1,072,418 46,627 892,187
West Java Rural 0.81 0.02 589,559 3,744,756 553,072
Urban 0.94 0.43 1,318,603 1,157,100 1,063,060
Central Java Rural 0.73 0.01 403,693 5,115,993 210,456
Urban 0.84 0.25 513,465 2,135,753 323,678
Yogyakarta Rural 0.95 0.01 21,193 69,257 40,723
Urban 0.95 0.47 127,718 95,037 135,538
East Java Rural 0.69 0.01 322,680 6,685,314 547,906
Urban 0.87 0.40 663,783 1,950,984 675,743
Banten Rural 0.58 0.03 127,740 1,835,011 127,740
Urban 0.94 0.38 454,645 299,851 337,820
B a l i Rural 0.70 0.06 6,431 514,983 6,431
Urban 0.93 0.38 56,744 114,011 53,611
West Nusa Tenggara
Rural 0.40 - 58,995 1,630,275 126,456
Urban 0.64 0.14 125,238 529,247 93,073
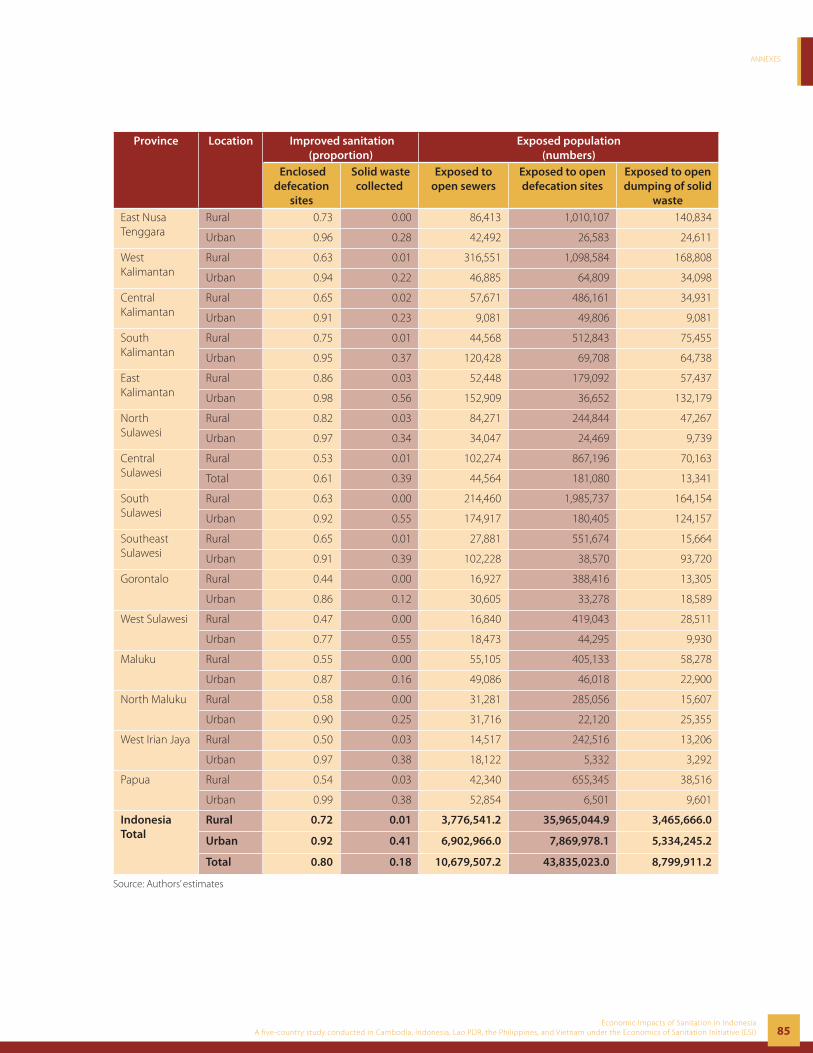
ANNEXES
85Economic Impacts of Sanitation in Indonesia
A five-country study conducted in Cambodia, Indonesia, Lao PDR, the Philippines, and Vietnam under the Economics of Sanitation Initiative (ESI)
Province Location Improved sanitation (proportion)
Exposed population (numbers)
Enclosed defecation
sites
Solid waste collected
Exposed to open sewers
Exposed to open defecation sites
Exposed to open dumping of solid
wasteEast Nusa Tenggara
Rural 0.73 0.00 86,413 1,010,107 140,834
Urban 0.96 0.28 42,492 26,583 24,611
West Kalimantan
Rural 0.63 0.01 316,551 1,098,584 168,808
Urban 0.94 0.22 46,885 64,809 34,098
Central Kalimantan
Rural 0.65 0.02 57,671 486,161 34,931
Urban 0.91 0.23 9,081 49,806 9,081
South Kalimantan
Rural 0.75 0.01 44,568 512,843 75,455
Urban 0.95 0.37 120,428 69,708 64,738
East Kalimantan
Rural 0.86 0.03 52,448 179,092 57,437
Urban 0.98 0.56 152,909 36,652 132,179
North Sulawesi
Rural 0.82 0.03 84,271 244,844 47,267
Urban 0.97 0.34 34,047 24,469 9,739
Central Sulawesi
Rural 0.53 0.01 102,274 867,196 70,163
Total 0.61 0.39 44,564 181,080 13,341
South Sulawesi
Rural 0.63 0.00 214,460 1,985,737 164,154
Urban 0.92 0.55 174,917 180,405 124,157
Southeast Sulawesi
Rural 0.65 0.01 27,881 551,674 15,664
Urban 0.91 0.39 102,228 38,570 93,720
Gorontalo Rural 0.44 0.00 16,927 388,416 13,305
Urban 0.86 0.12 30,605 33,278 18,589
West Sulawesi Rural 0.47 0.00 16,840 419,043 28,511
Urban 0.77 0.55 18,473 44,295 9,930
Maluku Rural 0.55 0.00 55,105 405,133 58,278
Urban 0.87 0.16 49,086 46,018 22,900
North Maluku Rural 0.58 0.00 31,281 285,056 15,607
Urban 0.90 0.25 31,716 22,120 25,355
West Irian Jaya Rural 0.50 0.03 14,517 242,516 13,206
Urban 0.97 0.38 18,122 5,332 3,292
Papua Rural 0.54 0.03 42,340 655,345 38,516
Urban 0.99 0.38 52,854 6,501 9,601
Indonesia Total
Rural 0.72 0.01 3,776,541.2 35,965,044.9 3,465,666.0
Urban 0.92 0.41 6,902,966.0 7,869,978.1 5,334,245.2
Total 0.80 0.18 10,679,507.2 43,835,023.0 8,799,911.2
Source: Authors’ estimates
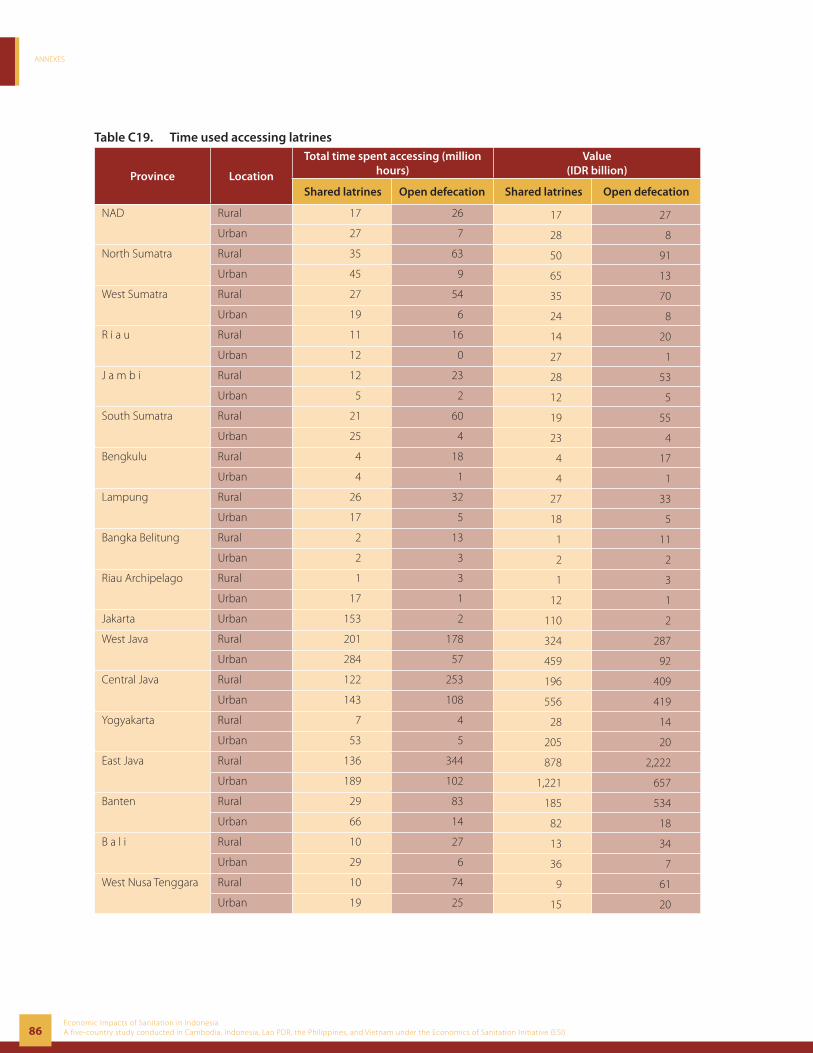
ANNEXES
86Economic Impacts of Sanitation in IndonesiaA five-country study conducted in Cambodia, Indonesia, Lao PDR, the Philippines, and Vietnam under the Economics of Sanitation Initiative (ESI)
Table C19. Time used accessing latrines
Province Location
Total time spent accessing (million hours)
Value (IDR billion)
Shared latrines Open defecation Shared latrines Open defecation
NAD Rural 17 26 17 27
Urban 27 7 28 8
North Sumatra Rural 35 63 50 91
Urban 45 9 65 13
West Sumatra Rural 27 54 35 70
Urban 19 6 24 8
R i a u Rural 11 16 14 20
Urban 12 0 27 1
J a m b i Rural 12 23 28 53
Urban 5 2 12 5
South Sumatra Rural 21 60 19 55
Urban 25 4 23 4
Bengkulu Rural 4 18 4 17
Urban 4 1 4 1
Lampung Rural 26 32 27 33
Urban 17 5 18 5
Bangka Belitung Rural 2 13 1 11
Urban 2 3 2 2
Riau Archipelago Rural 1 3 1 3
Urban 17 1 12 1
Jakarta Urban 153 2 110 2
West Java Rural 201 178 324 287
Urban 284 57 459 92
Central Java Rural 122 253 196 409
Urban 143 108 556 419
Yogyakarta Rural 7 4 28 14
Urban 53 5 205 20
East Java Rural 136 344 878 2,222
Urban 189 102 1,221 657
Banten Rural 29 83 185 534
Urban 66 14 82 18
B a l i Rural 10 27 13 34
Urban 29 6 36 7
West Nusa Tenggara Rural 10 74 9 61
Urban 19 25 15 20

ANNEXES
87Economic Impacts of Sanitation in Indonesia
A five-country study conducted in Cambodia, Indonesia, Lao PDR, the Philippines, and Vietnam under the Economics of Sanitation Initiative (ESI)
Province Location
Total time spent accessing (million hours)
Value (IDR billion)
Shared latrines Open defecation Shared latrines Open defecation
East Nusa Tenggara Rural 12 43 10 35
Urban 10 1 10 1
West Kalimantan Rural 10 50 10 50
Urban 6 3 6 3
Central Kalimantan Rural 10 22 15 32
Urban 6 2 9 3
South Kalimantan Rural 16 24 24 35
Urban 18 3 22 4
East Kalimantan Rural 7 8 9 10
Urban 18 2 22 2
North Sulawesi Rural 9 12 12 16
Urban 15 1 20 2
Central Sulawesi Rural 7 39 9 52
Total 4 9 4 7
South Sulawesi Rural 8 41 6 33
Urban 65 19 53 16
Southeast Sulawesi Rural 6 24 3 11
Urban 6 2 3 1
Gorontalo Rural 5 17 2 8
Urban 6 2 6 2
West Sulawesi Rural 1 8 1 8
Urban 7 7 8 8
Maluku Rural 6 18 9 26
Urban 4 2 6 3
North Maluku Rural 6 12 8 18
Urban 3 1 3 1
West Irian Jaya Rural 3 11 4 12
Urban 3 0 4 0
Papua Rural 4 13 11 41
Urban 20 1 62 2
Indonesia Total Rural 781 1,613 1,963 4,330
Urban 1,302 413 3,137 1,337
Total 2,083 2,026 5,102 5,667
Source: Authors’ estimates

ANNEXES
88Economic Impacts of Sanitation in IndonesiaA five-country study conducted in Cambodia, Indonesia, Lao PDR, the Philippines, and Vietnam under the Economics of Sanitation Initiative (ESI)
Table C20. Economic impact of lower foreign tourist numbers, 2006Province Current tourism
value1 (IDR billion)Current hotel
occupancy rate (%)Future potential value2
(IDR billion)Annual economic loss3
(IDR billion)NAD 6 48.7 10 0
North Sumatra 657 37.4 1,405 37
West Sumatra 158 40.2 315 8
R i a u 188 42.1 358 8
J a m b i 14 34.8 32 1
South Sumatra 34 36.7 74 2
Bengkulu 2 21.8 7 0
Lampung 22 45.6 39 1
Bangka Belitung 8 38.1 17 0
Riau Archipelago 5,673 42.1 10,780 255
Jakarta 5,938 51.1 9,299 168
West Java 1,160 37.8 2,458 65
Central Java 519 43.2 961 22
Yogyakarta 621 45.6 1,089 23
East Java 1,228 48.3 2,035 40
Banten 435 33.3 1,046 31
B a l i 20,574 47.8 34,434 693
West Nusa Tenggara 916 32.5 2,251 67
East Nusa Tenggara 98 43.9 179 4
West Kalimantan 172 40.5 341 8
Central Kalimantan 6 42.7 11 0
South Kalimantan 44 47.0 75 2
East Kalimantan 232 54.5 341 5
North Sulawesi 148 51.9 228 4
Central Sulawesi 14 52.9 21 0
South Sulawesi 293 38.2 613 16
Southeast Sulawesi 6 43.6 11 0
Gorontalo 4 51.9 6 0
West Sulawesi 2 38.2 4 0
Maluku 28 48.1 47 1
North Maluku 2 48.1 3 0
West Papua 8 23.5 27 1
Papua 54 34.8 124 4
Indonesia Total 39,267 45.0 68,643 1,4651 Ministry of Culture and Tourism. Statistical report on visitor arrivals to Indonesia 2006. Jakarta: Data and Information Center. 2007.2 Calculated as the revenue from tourists, assuming 80% occupancy of existing (foreign) tourist hotels.3 Calculated as the gap between current and potential value, multiplied by 5% attribution to sanitation.

ANNEXES
89Economic Impacts of Sanitation in Indonesia
A five-country study conducted in Cambodia, Indonesia, Lao PDR, the Philippines, and Vietnam under the Economics of Sanitation Initiative (ESI)

Economic Impacts of Sanitation in IndonesiaA five-country study conducted in Cambodia, Indonesia, Lao PDR, the Philippines, and Vietnam under the Economics of Sanitation Initiative (ESI)
Research Report August 2008