
Economic impact on Europe of the Nord Stream 2 project · Economic impact on Europe of the Nord...
32
September, 2017 Analysis of effects on job creation and GDP Economic impact on Europe of the Nord Stream 2 project
Transcript of Economic impact on Europe of the Nord Stream 2 project · Economic impact on Europe of the Nord...
September, 2017
Analysis of effects on job creation and GDP
Economic impact on Europe of the Nord Stream 2 project

Content
Authors:
Michael KrusePartner Energy & Utilities, [email protected]
Annette BerkhahnSenior Advisor Energy & Utilities, [email protected]
Acknowledgement for their support and valuable input: Melanie Nimianu, Business Analyst Energy & Utilities, Vienna; Stephen Rogers, Partner Energy & Utilities, London.
Executive summary 4
1. Introduction 8
2. Statisticaloverviewofexpectedeconomicbenefits 9
3. The Nord Stream 2 project 10
4. Planned activities by stage for Nord Stream 2 14
5. Predicted economic impact by country affected 16
6. Descriptions of local activities by country 27
Conclusions 30

3
Disclaimer
This report was commissioned by Nord Stream 2 AG on terms specifically limiting the liability of Arthur D. Little. Our conclusions are the results of the exercise of our best professional judgment, based in part on materials and information provided to us by Nord Stream 2 AG and others. Use of this report by any third party for whatever purpose should not, and does not, absolve such third party from using due diligence in verifying the report’s contents.
Any use which a third party makes of this document, or any reliance on it, or decisions to be made based on it, are the responsibility of such third party. The views and opinions expressed in this report are purely those of Arthur D. Little and do not necessarily reflect the opinion of Nord Stream 2 AG. Arthur D. Little accepts no duty of care or liability of any kind whatsoever to any such third party, and no responsibility for damages, if any, suffered by any third party as a result of decisions made, or not made, or actions taken, or not taken, based on this document.

4
Executive summary
Introduction
n In July 2017 Nord Stream 2 commissioned Arthur D. Little to evaluate the economic impact of the activities and investments related to the Nord Stream 2 project on those countries that are either directly involved in the project, or have contributed with materials or services. Operations were not in scope of the assessment.
n The objective is to perform an independent assessment and provide a transparent and fair description of economic benefits in terms of job creation and GDP impact of a major European infrastructure investment such as Nord Stream 2.
n The scope only covers investments in the pipeline itself, based on the investments made up to July 2017. Wider economic implications of the availability of this new infrastructure to the European energy market were not considered in this study.
Conclusion
The overall results show that the total economic benefit created as of July 2017 for the European Union, which is receiving 59% of total investments, is over €5.15 bn, creating around 31,000 full-time equivalents, over a period of five years and adding €2.26 bn in GDP.
n The project has a wide range of effects on many different countries and economic sectors.
n As can be expected, the most pronounced effects are seen in:
i. Countries where major project-related construction activities take place (RU, DE, FI, SE);
ii. Countries traditionally associated with the offshore oil and gas industry that host the majority of service providers (NL, UK, NO, IT);
iii. At the headquarters of major international service providers.
n The analysis of full-time equivalents created by the project is in line with expectations from other, similar large-scale infrastructure projects.
n The analysis in this study is limited by the boundaries of the Nord Stream 2 project, but further, related economic effects are likely, for example, in connecting infrastructure.

5
n Additional economic benefits are likely to arise from the presence of competitively priced gas in the European economy and lower decarbonization costs as a result of lower gas prices competing with oil and coal. This could be the subject of separate studies further on.
n The impact varies between countries because of:
a) Types of jobs created (white collar or blue collar);
b) Economic structure of the country;
c) Differences in labor cost.
n A difference in the cost of labor would mean that an equally sized investment would have a larger impact in a country with lower wage and salary levels. An investment in engineering services will create more value than an investment in materials. An investment in a country with a large network of sectors contributing will be more effective than one in a country that needs to import required goods or services from elsewhere.
n The impact of the investment is significant for the European Union as a whole, as well as for individual member states.
1
Table 1: Total impact of the Nord Stream 2 project based on committed funds of €4,400 million1
Source: Nord Stream 2, Arthur D. Little (Current project investment based on current commitments)
Country CAPEX (in million €) % of total Total output
(in million €) Value added to GDP
(in million €) Jobs created
(in FTEs)
Austria 142 € 3% 282 € 126 € 1,840
Denmark 34 € <1% 70 € 35 € 600
Finland 201 € 5% 426 € 216 € 2,630
Germany 1,123 € 26% 2,190 € 909 € 13,090
Italy 78 € 2% 155 € 72 € 1,030
Netherlands 719 € 16% 1,457 € 603 € 8,630
Sweden 153 € 3% 308 € 160 € 1,760
UK 100 € 2% 200 € 97 € 1,180
Other EU2 39 € <1% 72 € 38 € 500
Total EU 2,589 € 59% 5,160 € 2,256 € 31,260
Russia 1,330 € 30% 2,226 € 798 € 51,230
Switzerland 374 € 9% 756 € 378 € 5,920
Other Non-EU3 107 € 2% 216 € 108 € 1,690
Total 4,400 € 100% 8,358 € 3,540 € 90,100
1 FTE = Full-Time Equivalents, a task that would take one person one year to complete, based on standard working hours per industry of 35+ hours per week adjusted by country specific holidays, etc.
2 Other EU includes: Belgium, Estonia, France, Hungary, Latvia, Lithuania, Spain3 Other Non-EU includes: Brazil, Malaysia, Norway, Tunisia

6
List of Tables
Table 1: Total impact of the Nord Stream 2 project based on committed funds of €4,400 million 5
Table 2: Executed and planned activities by calendar year, Nord Stream 15
Table3: Approachofmultiplierselection 19
Table 4: Selection of major contracts under tender or not yet opened, Nord Stream 2 20
Table 5: Overall impact on the Finnish economy 21
Table 6: Overall impact on the German economy 22
Table 7: Overall impact on the Dutch economy 23
Table 8: Overall impact on the Swedish economy 24
Table9: OverallimpactontheRussianeconomy 25
Table 10: Total impact of the Nord Stream 2 Project based on committed funds of €4,400 million 26

7
List of Figures
Figure 1: Nord Stream 2 impact on the EU and other countries based on committed fundsof€4,400million(StatusJuly2017) 9
Figure 2: Total impact (direct, indirect and induced) of the Nord Stream 2 project based oncommittedfundsof€4,400million 9
Figure 3: The Nord Stream 2 pipeline project – routing and landfalls 10
Figure4: GasconsumptioninEU28until2050,EUReferenceScenario2016 11
Figure5: InternalgasextractionintheEU–Commission’sReferenceScenario2016 12
Figure 6: Gas Balance of EU 28 and Switzerland 2010–2050 12
Figure 7: Sources available to close import gap (2010–2050) 13
Figure 8: Utilization of Nord Stream, pipes 1 & 2 (Total gas transported until July 2017 – 170 bcm) 13
Figure9: Projectplan,NordStream2 14
Figure 10: Main suppliers by country and type, Nord Stream 16
Figure 11: The input-output model captures the economic multiplier effect of direct investments in the economy by estimating effects in related sectors 17
Figure 12: Via indirect and induced effects, the analysis captures impact on GDP 18
Figure13:PlannedCAPEXexpenditure,excludingfinancingcost 19
Figure 14: Nord Stream 2 impact on the EU and other countries based on committed funds of €4,400 million (Status July 2017) 20

8
1. Introduction
The Nord Stream 2 project aims to provide the means for safe and secure supplies of natural gas to the European gas market. The EU market, covering 28 countries, is characterized by decreasing indigenous production, an increasing requirement for gas to support the transition to sustainable energy supplies, and increased competition between different sources of natural gas. The Nord Stream 2 pipelines will complement two existing pipelines through the Baltic Sea, and add 55 bcm of design capacity. The total investment, including financing costs of the pipeline, is expected to amount to €9.5 billion. These funds will cover materials for the pipeline itself and its landfall facilities, as well as the services necessary for completing the planning, permitting, construction and commissioning of the pipeline. In selecting suppliers and contractors, Nord Stream 2 has chosen the most cost efficient options for services and materials, while meeting strict quality criteria. This means that investments will be spread over many different countries.
So far, there is little detailed information on how an investment of this magnitude will affect specific sectors and countries in Europe. For this reason, Nord Stream 2 has commissioned Arthur D. Little to undertake a broad, independent assessment of these topics. This study will cover the direct, indirect and induced effects on the European economy and those of the directly involved countries of the actual investments in the pipeline.
In addition, the true economic, competitive and emissions-related impact of the project on the wider European economy could benefit from additional analysis.
In this the study, Arthur D. Little has mapped the investments as of July 2017 in the Nord Stream 2 project. Arthur D. Little has analyzed the sources of origin and value chains involved in providing the major contributions to the project. In doing so, the aim is to provide a clear and transparent picture of all the economic activities required for building and operating the pipeline. The investment was thus broken down into value streams flowing to different countries and areas of the respective economies, in order to understand how and why each involved country contributed to and benefits from the project.
Once that picture had emerged, an economic modeling tool to analyze the wider economic implications, involving both employment and wealth, was applied to the countries involved.
This analysis is based on the accepted theory that any economic activity creates ripples of value creation through its:
n Direct effects (activities related directly to the investment itself, such as construction, provision of materials, etc.)
n Indirect effects (all activities serving the directly involved parties – subcontractors, raw material providers, etc.)
n Induced effects (all induced household spending of the recipients of wages and salaries related to the project, including those of subcontractors, raw-material providers, and service providers.
To undertake this analysis, Arthur D. Little has, for the major affected economies, used a widely recognized, commercially available economic modeling tool (IMPLAN), which allows estimation of direct, indirect and induced effects in terms of value creation and job creation. This tool has been in use by US government departments, institutions and academia for decades (first developed by the USDA in 1976). Originally covering the US alone, it now contains databases for most countries and economies of the world. It allows the user to model the effects of a single economic event on the economic system of a contained region, such as a country.
For the remaining countries, the impact has been approximated by using general multipliers based on countries with similar or at least comparable economies. (Please see below under “Predicted economic impact by country affected”.).
The basic data regarding the investment of the project has been provided by Nord Stream 2 AG. Arthur D. Little has, for this purpose, had as much insight into Nord Stream 2 procurement and accounting data as can reasonably be expected, given commercial confidentiality considerations. Nord Stream 2 procurement officers and others have worked diligently on the team to create as transparent and complete a picture as is possible at this stage of the project, when all funds have not yet been contractually committed. A full assessment of the total economic impact will be undertaken after the project has been completed and all data is available. In assessing the plausibility of the results, the report’s findings were subjected to the scrutiny of a wide panel of Arthur D. Little economists, pipeline engineers and industry experts.

9
The two figures below provide an overview of the results of the analysis undertaken, clearly showing that Russia is the largest single country benefiting from the investment in Nord Stream 2, followed by Germany. It also shows that many different
countries, within the EU as well as outside of it, are recipients of investment capital. The second figure shows the direct investments of the first graph complemented by indirect and induced effects, adding up to the total benefit received.
2. Statistical overview of expected economic benefits
1
Figure 1: Nord Stream 2 impact on the EU and other countries based on committed funds of €4,400 million (Status July 2017)4
Source: Nord Stream 2, Arthur D. Little (Current project investment based on current commitments)
107
39
34
78
100
142
153
201
374
719
1,123
1,330
Other EU
Other Non-EU
Switzerland
Netherlands
Sweden
Denmark
Austria
Italy
UK
Finland
Germany
Russia EUR Millions
1
Figure 2: Total impact (direct, indirect and induced) of the Nord Stream 2 project based on committed funds of €4,400 million
Source: Nord Stream 2, Arthur D.Little (Current project investment based on current commitments), IMPLAN
Germany
Netherlands
2,226
2,190
Russia
1,457
155
Other Non-EU
282
72
Denmark
308
200
Sweden
Other EU
756
Austria
426
UK
70
Italy
216
Switzerland
Finland
Induced effect Indirect effect Direct effect
EUR Millions
4 Other EU includes: Belgium, Estonia, France, Hungary, Latvia, Lithuania, Spain. Other Non-EU includes: Brazil, Malaysia, Norway, Tunisia, US

10
3. The Nord Stream 2 project
Historical context
The first Nord Stream pipeline originates from two predecessor projects, Nordic Gas Grid and North Transgas, which were studied during the 1990s by two different consortia of potential investors. Both had the ambition to create a new route for Russian gas to the European gas market, in addition to those already present. In addition to the offshore route, an onshore connection through Sweden was also investigated. Project promoters hoped to connect the different Baltic and Scandinavian markets, which were, at that point ,relatively isolated, in order to improve security of supply.
Opposition in Sweden to large-scale infrastructure for natural gas transport, and the withdrawal of most potential Swedish and Finnish investors, eventually persuaded the main shareholder to take over the North Transgas project and concentrate on a direct route from Russia to Germany. Thus, Nord Stream was born.
Within the EU, the situation has changed since the 1990s with the addition of more interconnectors and LNG import terminals, and increased reverse-flow capacities to allow supplies of gas from west to east. The isolation of the Scandinavian, Baltic and Eastern gas markets has thus been remedied. At the same time, the German decision following the Fukushima accident to close down nuclear capacity, combined with climate concerns pressing for a phase-out of carbon, have, with the help of major support programs for renewable energy, notably transformed the market and created new challenges. In addition, market liberalization within the EU has progressed and led to the creation of a competitive gas market, with gas flowing more freely across borders based on pricing signals.
The context for considering new capacity is thus very different from when Nord Stream was first conceived, and the current European market is facing a different outlook.
1
Figure 3: The Nord Stream 2 pipeline project – routing and landfalls
Source: Nord Stream 2, 2016

11
1
Figure 4: Gas consumption in EU 28 until 2050, EU Reference Scenario 2016
Source: Prognos AG on “Current Status and Perspectives of the European Gas Balance”, 2016
6 000
3 000
0
5 000
2 000
1 000
4 000
7 000
5 119
2015 2020
4 973 5 010
2010 2000
5 781
2005
5 764
4 893
2045
5 104
2050 2040
5 089
2035 2030
4 798
2025
5 006 4 905
Households, commercial, industry, transport Total domestic demand Power and heat TWh gcv
Market context5
Demand
After a period of significant decline since the financial crisis of 2007/8, European gas demand has not yet been able to fully recover. At its peak in 2010, total gas demand amounted to some 5,781 TWh gcv, and in 2015 had fallen to 5,010 TWh gcv. From this level, gas demand is expected in the EU reference scenario 2016 for EU 28 to remain stagnant, falling to 4,893 TWh gcv in 2050. A significant portion of this demand will be increased use in transformation to base load power and heat, replacing coal-fired and nuclear capacity and complementing growing amounts of renewable energy. The use of gas in direct applications, such as for heat generation in households and industry, is expected to fall as energy efficiency measures are applied. Switzerland, too, is expected to experience low, if any, demand growth.
Indigenous production and gas balance
Indigenous production of natural gas in the EU is expected to fall significantly, due to depleting reserves in the major producing countries such as the Netherlands, the UK, Germany, Denmark, Italy and Romania. The Netherlands, so far an important source of gas for many European countries, has had to cap its production because of seismic concerns. Denmark, too, is facing a significant fall in production volumes, as its major gas-producing field, Tyra, has had to reduce output for geological reasons. Recently (March 2017), it was announced that Tyra would be redeveloped by raising the production platform so that full production could resume in the future. Production at the
field will be closed down temporarily for redevelopment works between late 2019 and 2022.
The only areas where production might increase are in Poland (shale gas) and Cyprus. All in all, indigenous production is expected to fall by almost two-thirds, from 1,530 TWh gcv in 2015 to 689 TWh gcv by 2050. This means that Europe will need to import more gas from external sources despite the expected slow growth in gas demand, replacing these indigenous supplies. Increased energy efficiency is expected to play a significant role in reducing gas demand. Biogas, too, can make up for smaller volumes. Still, there will be a significant shortfall of gas, to which must also be added the import volumes of Ukraine, which, due to the commercial disputes with Russia, has stopped imports from that country altogether. Ukraine thus takes all of its imported supply from the west at the moment.
Traditional major suppliers such as Norway and Algeria will continue to provide gas to Europe, but are limited in expanding their capacity. This means that they, too, will not be able to make up for the reduction in indigenous supplies.
New sources of supply
To meet this growing shortfall of gas, a number of sources are available. In addition, new infrastructure has been taken into operation in the past few years, or is under construction, that could help to bring new gas to market. For example, new LNG terminals have been brought on line in Poland as well as in Lithuania, shortly to be connected to Poland and the European gas network via the planned GIPL pipe. There are also pipeline projects in advanced stages of planning or that have started
5 The content of this section builds on the results of a study carried out in 2016 out by Prognos for Nord Stream 2, entitled “Current Status and Perspectives of the European Gas Balance”, supplemented by observations, analysis and comments by Arthur D. Little.

12
1
Figure 5: Internal gas extraction in the EU – Commission’s Reference Scenario 2016
Source: Prognos AG on “Current Status and Perspectives of the European Gas Balance”, 2016
1530
1376
1196
1015
822 767 742 689
0
200
400
600
800
1000
1200
1400
1600
1800
2015 2020 2025 2030 2035 2040 2045 2050
NL UK DK IT DE ROM Other countries EU TotalTWh gcv
1
Figure 6: Gas Balance of EU 28 and Switzerland 2010–2050
Source: Prognos AG on “Current Status and Perspectives of the European Gas Balance”, 2016
5818
5048 5014 5050 4846 4971 5153 5167 4953
3630 3570 3778 3998 3972 4219 4440 4478 4316
0
1000
2000
3000
4000
5000
6000
7000
2010 2015 2020 2025 2030 2035 2040 2045 2050
Domestic production Total demand Import gap
construction in southern Europe, such as GALSI (Algeria to Italy via Sardinia), Turkstream (Russia via the Black Sea and Turkey to Italy) and TAP/TANAP (Caspian region via Turkey and Greece to Italy). All these southern pipelines will have large capacities to bring gas to southern Europe and beyond.
New sources of supply include some 100 bcm of spare production capacity available in Russia, and large, untapped quantities in the Caspian region. In addition, there will be a surplus of LNG in the next decade, from sources in the US, Russia, Australia and the Middle East.
Need for more capacity
It is important in this context when considering how to meet Europe’s need for more gas, to distinguish between the gas volumes available and the infrastructure required to bring them to market. A new pipeline or an LNG import terminal with spare capacity is essential, but not sufficient. Purchase agreements between gas sellers and gas buyers are also required. Nord Stream 2 adds capacity to import Russian gas, and increases the means to compete, for example, with additional LNG imports, but does not impact the share of Russian gas in the supply mix, as such. That decision will be market-based.

13
The purpose of the Nord Stream 2 project, is first of all to provide a safe means for additional exports of Russian gas to Europe, but also to complement aging capacity through the Ukraine to Western Europe, which may not always be technically available.
Activities so far
The first Nord Stream pipeline has been in operation since 2011/12. Since then, the pipeline has shipped in total some 183 bcm to Europe. Utilization has increased steadily, in line with normal build-up. In 2016, average utilization of the pipe was 80%
of design capacity. Nord Stream’s twin pipelines have been operating safely without incidents or major interruptions.
The idea for a third and fourth pipeline was conceived in 2012. Safety concerns at the time over deliveries through the existing infrastructure to Western Europe naturally contributed to the rationale. But the need to replace diminishing supplies from traditional sources were the main basis for the concept. In the following chapter, project activities, chronology of events and future plans will be described in more detail.
1
Figure 8: Utilization of Nord Stream, pipes 1 & 2 (Total gas transported until July 2017 – 170 bcm)6
Source: Nord Stream AG
81
2014 2013
43
2015 2016 2012 (Nov-Dec)
65
80 71
2011
17
33
2017 (Jan-Jul)
Percent
1
Figure 7: Sources available to close import gap (2010–2050)
Source: Prognos AG on “Current Status and Perspectives of the European Gas Balance”, 2016
48 92 105 138 164 170 158349
442
2045 2040 2035 2050 2025
394
2030 2020 2015 2010
376 346
427 439 418
397
Russia Stat diff/Ukraine LNG North Africa TBC Caspian Import need Norway
Remains to be contracted: potential sources include LNG and Russia
6 Year 2011: Based on 27.5 bcm per year; all other yearly figures based on 55 bcm. Year 2017: Based on 167.4 mcm per day
14
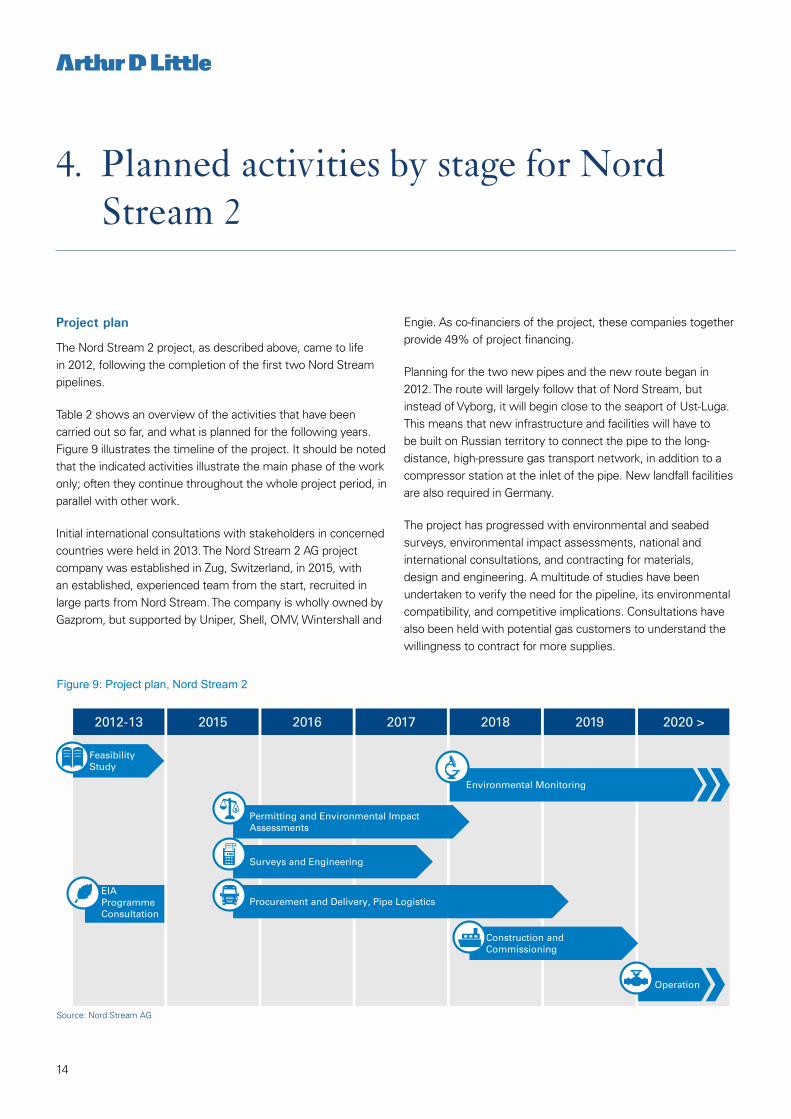
Project plan
The Nord Stream 2 project, as described above, came to life in 2012, following the completion of the first two Nord Stream pipelines.
Table 2 shows an overview of the activities that have been carried out so far, and what is planned for the following years. Figure 9 illustrates the timeline of the project. It should be noted that the indicated activities illustrate the main phase of the work only; often they continue throughout the whole project period, in parallel with other work.
Initial international consultations with stakeholders in concerned countries were held in 2013. The Nord Stream 2 AG project company was established in Zug, Switzerland, in 2015, with an established, experienced team from the start, recruited in large parts from Nord Stream. The company is wholly owned by Gazprom, but supported by Uniper, Shell, OMV, Wintershall and
Engie. As co-financiers of the project, these companies together provide 49% of project financing.
Planning for the two new pipes and the new route began in 2012. The route will largely follow that of Nord Stream, but instead of Vyborg, it will begin close to the seaport of Ust-Luga. This means that new infrastructure and facilities will have to be built on Russian territory to connect the pipe to the long-distance, high-pressure gas transport network, in addition to a compressor station at the inlet of the pipe. New landfall facilities are also required in Germany.
The project has progressed with environmental and seabed surveys, environmental impact assessments, national and international consultations, and contracting for materials, design and engineering. A multitude of studies have been undertaken to verify the need for the pipeline, its environmental compatibility, and competitive implications. Consultations have also been held with potential gas customers to understand the willingness to contract for more supplies.
1
Figure 9: Project plan, Nord Stream 2
Source: Nord Stream AG
2020 > 2015 2016 2017 2018 2019 2012-13
Construction and Commissioning
Feasibility Study
Operation
EIA Programme Consultation
Environmental Monitoring
Surveys and Engineering
Procurement and Delivery, Pipe Logistics
Permitting and Environmental Impact Assessments
4. Planned activities by stage for Nord Stream 2

15
Year Activities
2011 n Commissioning of Nord Stream pipe 1
2012
n Commissioning of Nord Stream pipe 2 n Feasibility study on constructing an additional pipeline through the Baltic Sea. n Five Parties of Origin notified about the Nord Stream Extension (Nord Stream 2)
2013
n Parties of Origin discuss Project Information Document and ESPOO convention procedures n Submission of the final Project Information Document to the Parties of Origin n Parties of Origin submit Project Information Document to the Affected Parties n Initial consultations with involved countries
– Finland – Sweden – Denmark – Russia – Germany – Other affected Baltic countries
2014 n Preparations for the project and permitting process continue n Pre-qualification of materials
2015
n Preparation of international consultations in alignment with Parties of Origin begins n Nord Stream 2 AG established in Zug, Switzerland n Basic engineering initiated, completed Q4 2016 n Contracts awarded for geophysical, routing and munitions-screening surveys n Survey work begins, continues in 2016 and 2017
2016
n Suppliers selected for the provision of steel pipe for the project n Coating and logistics tender awarded n Permitting process begins n Deliveries begin of pipe and other key materials n First pipes arrive at Kotka in September, and Mukran in October
2017
n Detailed engineering offshore and onshore begins n Pipe coating begins (Kotka and Mukran) n Over 47,000 km of surveys completed using 24 different vessels n Contracts awarded for pipelay, automation, electrical, near-shore dredging, stone supply and soil removal,
microtunnel, and pig trap area construction n ESPOO Report, Finnish EIA and permit applications in Sweden, Denmark and Germany submitted n Remaining applications follow
2018-19
n Early 2018: Expected receipt of permits to start construction n 2018: Construction works begin (planned), including
– Dredging – Rock placement – Munitions clearance – Pipelaying – Shorepulling – Cable and pipeline crossings – Backfilling – Above-water nearshore tie-in – Shore crossings – Shore constructions
2019 n Scheduled completion of construction and commissioning in Q4
2020 n Ready for first gas in both pipes in Q1
Table 2: Executed and planned activities by calendar year, Nord Stream
Source: Nord Stream 2, 2017

16
Learnings from the first Nord Stream project
An infrastructure project of the magnitude of Nord Stream 2 builds on the contributions from many different directions and sources. Nord Stream7 provides the best-possible example of the economic activity involved and the type of suppliers and service providers engaged. No one country has all the different disciplines, expertise, technological know-how, raw materials, manufacturing capabilities or equipment required to realize the vision of such a major capital investment. At the same time, activity will naturally mostly take place in countries where the work is to be carried out, or which have thriving industry sectors of similar focus (in this case – offshore oil & gas infrastructure construction – in Europe, this means countries such as Norway, the UK, Italy and the Netherlands.)
The project created employment opportunities and wealth in 12 different countries, most of them in Europe. Around 50 contractors were commissioned in the planning, testing and construction phase, and over 30 banks were involved in financing.
€100 million was spent alone on developing the necessary harbor infrastructure all over the Baltic Sea region.
The project had an overall investment cost of €7.4 billion (excluding financing costs).
The map below (Figure 10) provides an overview of the different countries that were involved in the project. The purpose of the analysis below, in similar fashion, is to create an overview of the planned investments for Nord Stream 2.
5. Predicted economic impact by country affected
7 The information in this paragraph is from Nord Stream AG on “Secure Energy for Europe – The Nord Stream Pipeline Project”, 2013.
1
Figure 10: Main suppliers by country and type, Nord Stream
Source: Nord Stream AG on “Secure Energy For Europe – The Nord Stream Pipeline Project”, 2013
UK
Netherlands
France
Germany
Norway
Denmark
Sweden
Finland
Italy
Russia
1
2
3 4
5 6
1
2
3 4
5
6
7
8
1
2
4
1
2
3
4
EUROPIPE OMK Sumitomo PetrolValves
Pipe and Materials
5
6
7 8
9
13
10
11
12
5 6 7 8 9
10
11
12
13
Construction Saipem Allseas Van Oord Boskalis/Tideway Rohde Nielsen
Technip Statoil Siemens IMPaC
Operations
Switzer-land
Environmental studies, quality management and safety
1 Marin Mätteknik (MMT) 2 Ramböll 3 DoF 4 PeterGaz 5 ERM 6 DNV 7 FOGA 8 SGS TÜV
Logistics 1 EUPEC
Port of Sassniz/Mukran Port of Kotka Port of Hanko Port of Slite Port of Karlskrona
2 3 4 5 6

17
Analyzing the economic benefits of the Nord Stream 2 project – methodology and approach
Any economic activity, such as setting up a business, making a capital investment or purchasing a service from established providers will create an impact on the local economy and business eco-system. In this case, the aim is to understand the effects of the investments made by Nord Stream 2 to build the two new pipelines through the Baltic Sea. To do this, Arthur D. Little applied a concept called Economic Impact Analysis.
Economic Impact Analysis examines the effect of an economic event on the economy in a specified area. It studies these effects in terms of wealth creation (total economic output and value added/GDP) and number of employment opportunities created, including the value of wages and salaries earned. In addition, it measures the value of government tax revenues. In this case, the focus will be on the value of GDP added and employment opportunities created (by using Full-Time Equivalents as a proxy).
Typically, the methodology measures the impact as the difference between two scenarios, one in which the event does occur and one in which it does not. It is a well-established and widely recognized methodology for quantification, for example, of the benefits of proposed policies, action programs or large-scale investments, public or private.
The analysis uses so-called input-output models to analyze the local economy. These are based on statistical data about the economy and how different sectors are connected with and interact with each other, including how they purchase products and services from one another. This information is used to determine so-called multipliers, which allow the estimation of the impact a specific event will have throughout the economy. Multipliers are applied to the economic event in question to simulate the ripple-effect it will have throughout the economy.
This is, perhaps, best illustrated by an example. Consider the construction of a one-family house. Building the house itself will create contracts for an architect, a construction company, and interior decorators. These will, in turn, employ professional staff and workers to build and furnish the house. These are the direct effects of the investment, the firms and people covered by the direct investment of the purchaser of the house.
They will also have to rely on others to supply the goods and services to the undertaking. Building materials and electrical and plumbing services may be provided by third parties under contract. In addition, office supplies and IT equipment are needed for administration and business services. Transport services have to be hired to bring materials to the construction site, and so on. These are the indirect effects of the investment.
The impact of the event does not stop there. Workers and staff are compensated in wages and salaries, which they use
1
Figure 11: The input-output model captures the economic multiplier effect of direct investments in the economy by estimating effects in related sectors
Source: Arthur D. Little
All activities related to the project itself:
construction, engineering, permitting,
surveys, etc.
Indirect Induced
Providers of raw materials and services to the direct contributors to the project
Household spending by direct and indirect
contributors to the project
Direct

18
for personal spending and upkeep. This is called the induced effect of the investment. They have to pay rent on their accommodation, buy food and clothing, and acquire leisure products and services and capital goods such as cars and washing machines. A euro paid for the investment in the house thus keeps multiplying in value as it is spent again and again throughout the interconnected network of the economy.
Because of the fact that multiple value chains are involved, where each step adds to the value of the original activity or is re-spent on new activities, the original investment thus creates a ripple effect. This effect, which occurs between different sectors of the economy, can be measured statistically, creating multipliers which, if applied to a single investment, can be used to simulate its impact on the rest of the economy.
To summarize and bring us back to Nord Stream 2, the study analyzed:
n Direct effects, which include all activities directly related to the event in question, in this case the investment in the Nord Stream 2 pipelines (planning, permitting, engineering, construction, etc.).
n Indirect effects, which include all suppliers of goods and services to the direct activities (raw materials, transportation, office supplies, etc.).
n Induced effects, which consist of the household spending that results from the salaries and wages earned in the first two categories.
In this study, a commercially available economic modeling tool (IMPLAN) was used to undertake parts of the analysis. It is provided by the IMPLAN company of Huntersville, North Carolina, US (www.implan.com). Originally, the model was developed by the US Department of Agriculture in the 1970s, and used to measure economic impact in forestry. Since then, it has been expanded and improved, and is now available to measure economic impact in sectors across the whole economy – not only for the US, but also across the world (currently covering the US, Canada, the EU and OECD, based on different statistical databases). It is used not only by government, research and academia, but also by financial institutes, consultancies and others interested in understanding the broader impact on the economy of a single economic event, for example, a change in economic policy, a major investment in a hospital, or a decision to close down a public facility such as an airport base.
The input to the model, in this case, consists of the value streams from the project to the different countries that provide
the products and services required to realize it. IMPLAN, then, based on underlying Eurostat8 data for each affected country, calculates direct, indirect and induced effects in terms of value added and employment created in each country.
Value added, in this context, refers to the additional value created at a particular stage of production. It is a measure of the overall importance of an industry and represents the industry’s share of gross domestic product (GDP). So, for example, in the context of Nord Stream 2 and the economic benefit created in a particular country, it describes how large a share of the total output value that is attributable to the activities performed in that country, and is thus available locally for new and other purposes, including consumption and investment. Value added consists of: employee compensation, proprietors’ income, income to capital owners from property, and indirect business taxes (including excise taxes, property taxes, fees, licenses, and sales taxes paid by businesses). Expressed differently, value added is equal to total output of the economic activity (direct, indirect and induced) less the value of imported goods and services that flow out of the economy
.
1
Figure 12: Via indirect and induced effects, the analysis captures impact on GDP
Source: Arthur D. Little
Total output GDP Direct investment
Direct effects
Indirect effects
Induced effects
Less: value of imported
goods & services
Value added by the
economy
Direct effects
Direct effects
Indirect effects
Induced effects
Series
The difference between countries can be illustrated by looking at two examples with similar investments but different outcomes. (See Table 1.) The investment in Austria is €142 million, generating a total output of €282 million (adding a value of €126 million, or +89%), i.e., a multiplier of 1.99. In Sweden, the investment is €153 million, generating a total output of €308 million (adding a value of €160 million, or +105%), i.e., a multiplier of 2.01. Why does the investment in Sweden generate a higher output than that in Austria? The answer lies in
8 With the exception of Russia, which is based on OECD data

19
the sectors involved – Austria mainly supplies materials (blue-collar jobs with lower compensation), and Sweden supplies engineering and consultancy services, for which higher salaries are paid. Also, Sweden supplies iron ore, mined in Sweden, whereas Austria has to import raw materials to produce line pipe. This explains why multipliers are not the same – they depend on the economic structure of the country and the sectors involved.
IMPLAN, in this case, was used for five of the main countries affected – Finland, Germany, the Netherlands, Russia, and Sweden. For other countries affected (Austria, Belgium, Denmark, France, Italy, Spain, the UK), Arthur D. Little has used a simplified approach, using multipliers derived from similar economies, based on the results of the IMPLAN model. (See Table 3.) This approach allows estimation of the overall effect on the EU economy, without going through detailed economic analysis for all countries affected, large and small.
1
Table 3: Approach of multiplier selection
Source: Arthur D. Little based on IMPLAN
Country Multiplier based on
Austria Germany
Belgium Netherlands
Denmark Netherlands
France Germany
Italy Germany
Spain Germany
United Kingdom Netherlands
For practical reasons, it was assumed that the investment took place over one year, in order to illustrate the total effect on the country economy. In reality, it is spread over five years, with activities taking place at different times during the project. Full- time equivalents should be understood as a temporary effect on the labor market created by the investment. For example – five full-time equivalents can provide one full-time job opportunity for five years.
That is not to say that full-time equivalents are not able to support the creation of permanent jobs.
Input data
The starting point of the analysis is the long-term business plan of Nord Stream 2 and the estimated and budgeted total CAPEX expenditures planned for the project as of July 2017
(total investment expenditure including financing cost and non-recoverable items is estimated at €9.5 billion).
1
Figure 13: Planned CAPEX expenditure, excluding financing cost
Source: Nord Stream 2, 2017
4.4
2.0
8.0
1.6
Open tenders Committed funds
Total CAPEX Remaining budget
EUR Billions
These consist of three categories, displayed in Figure 13.
The committed funds consist of the monies spent, contracts awarded and other already-committed outlays such as salaries for employed staff, environmental and feasibility studies. The information has been retrieved from Nord Stream 2 project accounting data and information submitted by contractors. Investments were split according to where the work had been or would be performed, based on what could be assumed from the destination of payment and the contractor’s country of residence, whether as main office or local subsidiary. Additionally, contracts including substantial amounts of funds stemming from earlier value-chain stages (such as raw materials), were split out among respective countries, based on assessments made by Nord Stream 2 controllers in cooperation with vendors. Thus, a base-line table of allocated actual impact values by type of activity and country of origin was established.
Open tenders relate to contracts that have been put out to tender, but have not yet been awarded to designated suppliers. For reasons of commercial confidentiality and to protect the fairness of the tendering process, no advance information regarding which vendor would be selected was given.
The remaining budget includes capital expenditure, contingency and project financing costs, which are still in the planning phase and will be put out to tender in the upcoming months and years.
The Economic Impact Analysis has been carried out for this report based on committed funds to date (July 2017). Table 4 indicates some of the major contracts that have not been awarded at the time of this report. At this point, it is not yet

20
known who the final contractors will be. A full accounting of the remaining effects is only feasible once the contract has been completed.
1
Table 4: Selection of major contracts under tender or not yet opened, Nord Stream 2
Source: Nord Stream 2, 2017
Type of services Purpose
Dredging Preparing seabed for pipelaying
Ploughing Preparing subsea trenches for pipelaying
Landfall Russia Dredging Seabed preparation
Landfall Russia Shallow Water Pipelaying Laying the pipe at landfall
Landfall Russia Construction and civil works
Construction of facilities and installations at landfall
Pre-commissioning Testing and preparing the pipeline for filling
Results of economic impact analysis
The committed funds to date have been allocated by country and type of activity, as indicated in Figure 12. The totals have been used to model the economic impact for a representative selection of the major EU countries affected – Finland, Germany, the Netherlands, Russia and Sweden. It should be noted that the effects are different depending on the economic/industrial structure of the country in question and the relative cost of labor. For example, within the EU, any investment will have a larger impact in Spain (which has a lower relative labor cost), than in Germany. Equally, the results in Russia can be expected
to be larger due to the differences in labor cost and economic structure.
1
Figure 14: Nord Stream 2 impact on the EU and other countries based on committed funds of €4,400 million (Status July 2017)9
Source: Nord Stream 2, Arthur D. Little (Current project investment based on current commitments)
201
153
34
107
39
78100
142
374
719
1,123
1,330
Other EU
Other Non-EU
Switzerland
Netherlands
Sweden
Denmark
Austria
Italy
UK
Finland
Germany
Russia
9 Other EU includes: Belgium, Estonia, France, Hungary, Latvia, Lithuania, Spain. Other Non-EU includes: Brazil, Malaysia, Norway, Tunisia

21
Finland
The direct impact on the Finnish economy of the currently committed CAPEX investments is over €200 million. This is equivalent to 5% of the total committed investment expenditure to date. This amount has been entered into the IMPLAN model to calculate the indirect and induced impact on the total economy.
The overall impact on the Finnish economy is equivalent to an economic output of almost €430 million, which is the same as adding more than €200 million to GDP and creating more than 2,600 full-time equivalents, spread over many different sectors (Table 5).
1
Table 5: Overall impact on the Finnish economy10
Source: Arthur D. Little calculations using the IMPLAN modelling system (Eurostat database)
Impact Type Jobs created (in FTEs)
Value Added to GDP (in million €)
Output (in million €)
Direct Effect 1,460 106 € 201 € Indirect Effect 660 55 € 117 €
Commercial services 350 24 € 46 € Communication and media 40 3 € 9 € Construction 10 1 € 2 € Finance, insurance, real estate, rental and leasing 20 5 € 9 € Manufacturing 60 5 € 18 € Public services 40 4 € 7 € Raw materials 20 1 € 5 € Transportation and warehousing 40 2 € 6 € Utilities 10 2 € 3 € Wholesale and retail trade 70 5 € 9 € Other - 3 € 3 €
Induced Effect 510 55 € 108 € Commercial services 90 5 € 10 € Communication and media 30 3 € 7 € Construction 20 1 € 4 € Finance, insurance, real estate, rental and leasing 30 17 € 26 € Manufacturing 50 4 € 15 € Public services 70 4 € 7 € Raw materials 40 2 € 7 € Transportation and warehousing 30 2 € 5 € Utilities 10 2 € 4 € Wholesale and retail trade 130 8 € 16 € Other 10 7 € 7 €
Total 2,630 216 € 426 €
10 FTEs = Full-Time Equivalents, a task that would take one person one year to complete, based on standard working hours per industry of 35+ hours per week adjusted by country specific holidays, etc.

22
Germany
The direct impact on the German economy of the currently committed CAPEX investments is more than €1,120 million. This is equivalent to 26% of the total committed investment expenditure to date. This amount has been entered into the IMPLAN model to calculate the indirect and induced impact on the total economy.
The investment does not cover the connecting infrastructure or the compressor stations required after landfall – these will be
undertaken by separate organizations and are not included in the Nord Stream 2 project. These additional investments will have further beneficial effects on the German economy that are not reflected in this calculation.
The overall impact on the German economy is equivalent to an economic output of almost €2,200 million, which is the same as adding more than €900 million to GDP and creating more than 13,000 full-time equivalents, spread over many different sectors (Table 6).
1
Table 6: Overall impact on the German economy11
Source: Arthur D. Little calculations using the IMPLAN modelling system (Eurostat database)
Impact Type Jobs created (in FTEs)
Value Added to GDP (in million €)
Output (in million €)
Direct Effect 6,190 384 € 1,123 € Indirect Effect 4,720 352 € 733 €
Commercial services 1,350 77 € 145 € Communication and media 220 17 € 33 € Construction 220 13 € 31 € Finance, insurance, real estate, rental and leasing 290 67 € 112 € Manufacturing 1,150 78 € 197 € Public services 460 22 € 31 € Raw materials 160 12 € 65 € Transportation and warehousing 200 11 € 29 € Utilities 50 11 € 24 € Wholesale and retail trade 620 27 € 49 € Other - 17 € 17 €
Induced Effect 2,180 173 € 334 € Commercial services 410 23 € 40 € Communication and media 90 9 € 19 € Construction 70 4 € 9 € Finance, insurance, real estate, rental and leasing 190 55 € 90 € Manufacturing 230 16 € 54 € Public services 290 15 € 22 € Raw materials 70 3 € 15 € Transportation and warehousing 100 5 € 15 € Utilities 40 6 € 14 € Wholesale and retail trade 560 22 € 41 € Other 130 15 € 15 €
Total 13,090 909 € 2,190 €
11 FTEs = Full-Time Equivalents, a task that would take one person one year to complete, based on standard working hours per industry of 35+ hours per week adjusted by country specific holidays, etc.

23
1
Table 7: Overall impact on the Dutch economy12
Source: Arthur D. Little calculations using the IMPLAN modelling system (Eurostat database)
Impact Type Jobs created (in FTEs)
Value Added to GDP (in million €)
Output (in million €)
Direct Effect 4,420 258 € 719 € Indirect Effect 2,910 219 € 478 €
Commercial services 550 25 € 52 € Communication and media 50 6 € 13 € Construction 1,100 76 € 213 € Finance, insurance, real estate, rental and leasing 90 22 € 36 € Manufacturing 20 15 € 46 € Public services 500 18 € 24 € Raw materials 10 3 € 9 € Transportation and warehousing 70 5 € 9 € Utilities <5 4 € 11 € Wholesale and retail trade 520 27 € 47 € Other - 18 € 18 €
Induced Effect 1,300 126 € 260 € Commercial services 320 16 € 32 € Communication and media 50 9 € 18 € Construction 50 4 € 10 € Finance, insurance, real estate, rental and leasing 140 38 € 78 € Manufacturing <5 5 € 23 € Public services 260 12 € 17 € Raw materials 20 2 € 9 € Transportation and warehousing 70 4 € 9 € Utilities <5 7 € 19 € Wholesale and retail trade 390 19 € 35 € Other - 10 € 10 €
Total 8,630 603 € 1,457 €
Netherlands
As shown in Table 7, the direct impact on the economy from the Netherlands of the currently committed CAPEX investments amounts to some €721 million. This is equivalent to 16% of the total of committed expenditure in July 2017. This amount has been entered into the IMPLAN model to calculate the indirect and induced impact on the total economy.
The overall impact on the Dutch economy is equivalent to an economic output of almost €1,500 million, which is the same as adding more than €600 million to GDP and creating more than 8,000 full-time equivalents, spread over many different sectors (Table 7).
12 FTEs = Full-Time Equivalents, a task that would take one person one year to complete, based on standard working hours per industry of 35+ hours per week adjusted by country specific holidays, etc.

24
Sweden
The direct impact on the Swedish economy of the currently committed CAPEX investments is over €150 million. This is equivalent to 3% of the total committed investment expenditure to date. This amount has been entered into the IMPLAN model to calculate the indirect and induced impact on the total economy.
The overall impact on the Swedish economy is equivalent to an economic output of more than €300 million, which is the same as adding more than €150 million to GDP and creating more than 1,700 full-time equivalents, spread over many different sectors (Table 8).
1
Table 8: Overall impact on the Swedish economy13
Source: Arthur D. Little calculations using the IMPLAN modelling system (Eurostat database)
Impact Type Jobs created (in FTEs)
Value Added to GDP (in million €)
Output (in million €)
Direct Effect 970 83 € 153 € Indirect Effect 500 45 € 91 €
Commercial services 180 13 € 25 € Communication and media 50 5 € 12 € Construction 20 1 € 4 € Finance, insurance, real estate, rental and leasing 40 8 € 15 € Manufacturing 30 2 € 7 € Public services 50 3 € 5 € Raw materials 10 2 € 2 € Transportation and warehousing 20 2 € 6 € Utilities 10 1 € 2 € Wholesale and retail trade 90 5 € 10 € Other - 3 € 3 €
Induced Effect 290 32 € 64 € Commercial services 50 3 € 7 € Communication and media 10 2 € 4 € Construction 20 1 € 3 € Finance, insurance, real estate, rental and leasing 30 8 € 16 € Manufacturing 30 2 € 8 € Public services 40 3 € 4 € Raw materials 10 1 € 3 € Transportation and warehousing 20 1 € 4 € Utilities 10 2 € 3 € Wholesale and retail trade 70 5 € 8 € Other <5 4 € 4 €
Total 1,760 160 € 308 €
13 FTEs = Full-Time Equivalents, a task that would take one person one year to complete, based on standard working hours per industry of 35+ hours per week adjusted by country specific holidays, etc.

25
1
Table 9: Overall impact on the Russian economy14
Source: Arthur D. Little calculations using the IMPLAN modelling system (OECD database)
Impact Type Jobs created (in FTEs)
Value Added to GDP (in million €)
Output (in million €)
Direct Effect 34,760 365 € 1,330 € Indirect Effect 8,250 247 € 567 €
Commercial services 300 9 € 16 € Communication and media 390 11 € 23 € Construction 350 7 € 17 € Finance, insurance, real estate, rental and leasing 760 43 € 65 € Manufacturing 3,070 35 € 129 € Public services 160 1 € 2 € Raw materials 1,360 39 € 123 € Transportation and warehousing 680 18 € 43 € Utilities 110 15 € 44 € Wholesale and retail trade 1,070 55 € 90 € Other - 14 € 15 €
Induced Effect 8,220 186 € 329 € Commercial services 640 12 € 22 € Communication and media 190 6 € 11 € Construction 90 2 € 5 € Finance, insurance, real estate, rental and leasing 350 26 € 38 € Manufacturing 720 11 € 42 € Public services 4,610 40 € 73 € Raw materials 760 13 € 26 € Transportation and warehousing 300 8 € 19 € Utilities 20 3 € 9 € Wholesale and retail trade 540 28 € 45 € Other - 37 € 39 €
Total 51,230 798 € 2,226 €
Russia
The direct impact on the Russian economy of the currently committed CAPEX investments is over €1,300 million, the largest single allocation, both relative and absolute, to any country so far. It is equivalent to 30% of the total committed investment expenditure to date. This amount has been entered into the IMPLAN model to calculate the indirect and induced impact on the total economy.
The investment does not cover the connecting infrastructure or the compressor stations required – these will be undertaken by separate organizations and are not included in the Nord Stream 2 project. They will have additional beneficial effects on the
Russian economy that are not reflected in this calculation. The overall impact on the Russian economy from Nord Stream 2 is equivalent to an economic output of more than €2,220 million, which is the same as adding almost €800 million to GDP and creating more than 50,000 full-time equivalents, spread over many different sectors (Table 9).
It should be noted that the multiplier impact on Russia is far higher than on EU countries, primarily due to the difference in labor cost. This means that every euro spent in investment will create three times more full-time equivalents in Russia than in, for example, Germany.
14 FTEs = Full-Time Equivalents, a task that would take one person one year to complete, based on standard working hours per industry of 35+ hours per week adjusted by country specific holidays, etc.

26
1
Table 10: Total impact of the Nord Stream 2 Project based on committed funds of €4,400 million15
Source: Nord Stream 2, Arthur D. Little (Current project investment based on current commitments)
Country CAPEX (in million €) % of total Total output
(in million €) Value added to GDP
(in million €) Jobs created
(in FTEs)
Austria 142 € 3% 282 € 126 € 1,840
Denmark 34 € <1% 70 € 35 € 600
Finland 201 € 5% 426 € 216 € 2,630
Germany 1,123 € 26% 2,190 € 909 € 13,090
Italy 78 € 2% 155 € 72 € 1,030
Netherlands 719 € 16% 1,457 € 603 € 8,630
Sweden 153 € 3% 308 € 160 € 1,760
UK 100 € 2% 200 € 97 € 1,180
Other EU16 39 € <1% 72 € 38 € 500
Total EU 2,589 € 59% 5,160 € 2,256 € 31,260
Russia 1,330 € 30% 2,226 € 798 € 51,230
Switzerland 374 € 9% 756 € 378 € 5,920
Other Non-EU17 107 € 2% 216 € 108 € 1,690
Total 4,400 € 100% 8,358 € 3,540 € 90,100
15 FTEs = Full-Time Equivalents, a task that would take one person one year to complete, based on standard working hours per industry of 35+ hours per week adjusted by country specific holidays, etc.
16 Other EU includes: Belgium, Estonia, France, Hungary, Latvia, Lithuania, Spai17 Other Non-EU includes: Brazil, Malaysia, Norway, Tunisia
Total results
Results for the remaining EU countries and the main five analyzed above have been summarized in the table below:
The total economic benefit created for the European Union, receiving 59% of investments, is thus over €5,150 million, creating around 31,000 thousand full-time equivalents over five years, and adding more than €2,250 million in GDP (Table 10).

27
Denmark
Economic impact of Nord Stream project
n Almost 20 companies involved.
n The three companies with the highest contract values were Ramböll, FOGA and Rohde Nielsen.
n Services included environmental impact assessment support, dredging services and PR-services.
Comparable planned activities for Nord Stream 2
n Among companies included are Ramböll, Energistyrelsen, DHI Group, Blue Water Shipping and GEO.
n Combined order value of contracts exceeds €60 million.
n Include environmental expertise from Ramböll A/S) and surveying expertise from GEO.
n Logistics partner WASCO will use Blue Water Shipping as a logistics company for transhipment of materials and pipes to the pipelaying vessels.
n Airport of Rønne is again being considered for use as heliport for the pipelaying vessels (yet to be confirmed).
Finland
Economic impact of the Nord Stream project18
n Activities carried out at three sites - Kotka, Hanko and Turku.
n Direct economic impact amounted to €174 million - €120 million in Kotka, and €20 million each for Helsinki and Turku.
n Set up of coating plant in Kotka provided employment for 220 people.
n Use of Hanko as marshalling yard/intermediate storage site for coated pipes.
n Use of Turku for maintenance of pipelaying vessel.
n Country total and breakdown provided by special study.
Comparable planned activities for Nord Stream 2
n The Nord Stream 2 project in Finland will largely have similar activities as the first project.
n Local providers will largely be the same (directly or via contractors).
n Length of pipes in the Finnish EEZ will also be similar (374 km).
n Will use the same (refurbished) pipe coating plant and port facilities at Kotka.
n More rock materials required - likely to be sourced locally - will be higher, due to required pipe and cable crossings, and seabed irregularities.
n More transport services and port calls will be required.
n The amount of line pipe to be transported by the Finnish railways will be much larger due to the fact that more pipes will be concrete weight coated in Kotka, and some already coated pipe will be delivered directly from a Russian coating plant to Hanko’s Koverhar.
n Port facilities in Hanko/Koverhar will be developed more rapidly than planned for by the Port of Hanko.
n Seabed surveys will be carried out throughout the project and also during operations, using for example the ports of Helsinki, Vuosaari and Hanko as bases of operations.
n The direct economic benefits in total for Finland and the local communities can thus be expected to be very similar or even higher.
France
Economic Impact of Nord Stream project
n Two companies were involved in the project, EUPEC and Technip.
n Eupec provided concrete and logistics services.
n Technip provided tie-in operations.
6. Descriptions of local activities by country
18 Information in this section from the report: “Financial impacts of the Nord Stream project for the cities of Kotka and Hanko”, by authors Kimmo Suojapelto and Mervi Nurminen of the North European Logistics Institute

28
Comparable planned activities for Nord Stream 2
n Some consulting services will be provided to the project by French companies.
Germany
Economic Impact of Nord Stream project
n Procurement of line pipe single largest investment – totalling more than €1.8 billion.
n A major part of the total amount of €750 million for coating and logistics was spent in Germany.
n Around €220 million were invested at the landfall facilities in Lubmin.
n Further funds were spent on offshore installations, environmental studies), and compensation measures and various other causes.
n Total value and complete breakdown not available.
Comparable planned activities for Nord Stream 2
n Cost for new landfall of Nord Stream 2 will be higher, since this time a microtunneling technique will be used.
n Mukran will be the logistics hub and marshalling yard in Germany. It will require more space and employ more people than the previous project.
n The landfall at Lubmin will have two main areas – the pig receiving terminal, and the gas receiving terminal.
n A multitude of different services procured from German suppliers, including environmental investigations, geotechnical studies, risk & safety assessments, IT systems and various administrative functions. Individually, these constitute smaller items, but in total, they amount to more than €30 million.
n Expected that the concrete coating, storage and shipping will employ around 200 people, both directly and indirectly, for a period of approximately two years. Wasco is responsible for all detailed personnel-related planning.
n Additional employment opportunities for personnel, services and equipment expected in Mukran via Wasco’s sub-contractors such as Kompass Port, STS, Voss, DB Schenker, Mukran Port, PestBau, SAW, WiProg, Kalmar Germany, Konecrane Rostock, HKL, and HWS Security.
Netherlands
Economic Impact of Nord Stream project
n Two companies were involved in the project, Van Oord and Boskalis.
n Van Oord installed landfall offshore facilities in Russia and Boskalis undertook seabed preparation and rock placement along the entire length of the pipeline route.
n A Dutch subsidiary of Swiss company AllSeas were responsible for some parts of the pipelaying.
n Total contract value and breakdown not available.
Comparable planned activities for Nord Stream 2
n Main contribution from the Netherlands to the Nord Stream 2 project will be via the 50/50 partnership between Dutch firms Van Oord and Boskalis for rock placement service.
n In addition, smaller contracts have been awarded within coatings and logistics to Dutchindo Holding and WASCO Coatings Europe.
n North Sea Offshore Wind is providing survey work.
n Allseas Nederland is providing a major part of the pipelaying/construction activities.
n Due to the wide spread employment of resources the direct economic benefits in total can thus be expected to be very similar or even higher.
Sweden
Economic Impact of Nord Stream project
n Largest impact on the Swedish economy through the order of iron ore from LKAB (for concrete weight coating of pipes).
n On the island of Gotland, the harbor at Slite was used for storage of pipes. Port charges of some €9 million were paid upfront to cover the required investments to restore and reinforce the port facilities. Usage of the port created some 20 employment opportunities in the area.
n The airport of Visby functioned as heliport for staff flying to and from the vessels employed in the pipelaying activities offshore, resulting in local costs of some €5.5 million.
n Karlskrona on the southern Swedish coast was used for storage of pipes and supplies to the pipelaying vessels. The port was compensated for this with some €6.5 million.
29
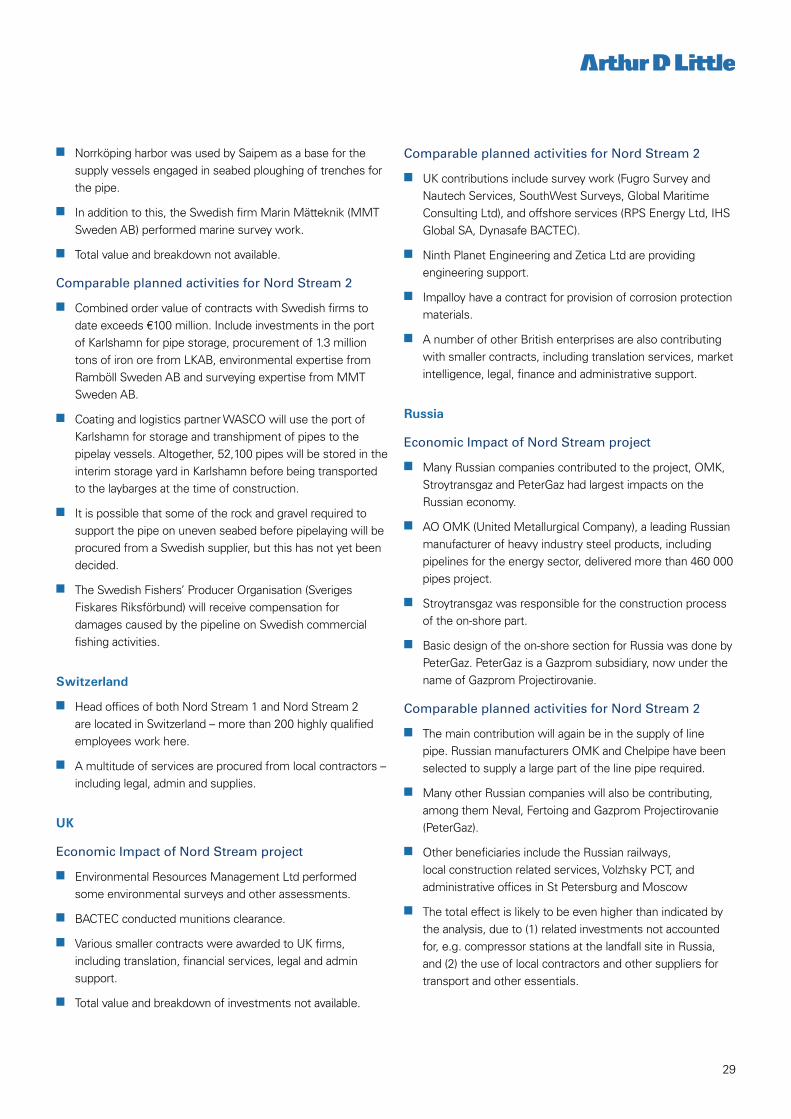
n Norrköping harbor was used by Saipem as a base for the supply vessels engaged in seabed ploughing of trenches for the pipe.
n In addition to this, the Swedish firm Marin Mätteknik (MMT Sweden AB) performed marine survey work.
n Total value and breakdown not available.
Comparable planned activities for Nord Stream 2
n Combined order value of contracts with Swedish firms to date exceeds €100 million. Include investments in the port of Karlshamn for pipe storage, procurement of 1.3 million tons of iron ore from LKAB, environmental expertise from Ramböll Sweden AB and surveying expertise from MMT Sweden AB.
n Coating and logistics partner WASCO will use the port of Karlshamn for storage and transhipment of pipes to the pipelay vessels. Altogether, 52,100 pipes will be stored in the interim storage yard in Karlshamn before being transported to the laybarges at the time of construction.
n It is possible that some of the rock and gravel required to support the pipe on uneven seabed before pipelaying will be procured from a Swedish supplier, but this has not yet been decided.
n The Swedish Fishers’ Producer Organisation (Sveriges Fiskares Riksförbund) will receive compensation for damages caused by the pipeline on Swedish commercial fishing activities.
Switzerland
n Head offices of both Nord Stream 1 and Nord Stream 2 are located in Switzerland – more than 200 highly qualified employees work here.
n A multitude of services are procured from local contractors – including legal, admin and supplies.
UK
Economic Impact of Nord Stream project
n Environmental Resources Management Ltd performed some environmental surveys and other assessments.
n BACTEC conducted munitions clearance.
n Various smaller contracts were awarded to UK firms, including translation, financial services, legal and admin support.
n Total value and breakdown of investments not available.
Comparable planned activities for Nord Stream 2
n UK contributions include survey work (Fugro Survey and Nautech Services, SouthWest Surveys, Global Maritime Consulting Ltd), and offshore services (RPS Energy Ltd, IHS Global SA, Dynasafe BACTEC).
n Ninth Planet Engineering and Zetica Ltd are providing engineering support.
n Impalloy have a contract for provision of corrosion protection materials.
n A number of other British enterprises are also contributing with smaller contracts, including translation services, market intelligence, legal, finance and administrative support.
Russia
Economic Impact of Nord Stream project
n Many Russian companies contributed to the project, OMK, Stroytransgaz and PeterGaz had largest impacts on the Russian economy.
n AO OMK (United Metallurgical Company), a leading Russian manufacturer of heavy industry steel products, including pipelines for the energy sector, delivered more than 460 000 pipes project.
n Stroytransgaz was responsible for the construction process of the on-shore part.
n Basic design of the on-shore section for Russia was done by PeterGaz. PeterGaz is a Gazprom subsidiary, now under the name of Gazprom Projectirovanie.
Comparable planned activities for Nord Stream 2
n The main contribution will again be in the supply of line pipe. Russian manufacturers OMK and Chelpipe have been selected to supply a large part of the line pipe required.
n Many other Russian companies will also be contributing, among them Neval, Fertoing and Gazprom Projectirovanie (PeterGaz).
n Other beneficiaries include the Russian railways, local construction related services, Volzhsky PCT, and administrative offices in St Petersburg and Moscow
n The total effect is likely to be even higher than indicated by the analysis, due to (1) related investments not accounted for, e.g. compressor stations at the landfall site in Russia, and (2) the use of local contractors and other suppliers for transport and other essentials.

30
Conclusions
n The results of the analysis show a wide range of effects of this large infrastructure investment, affecting many different countries and economic sectors.
n It clearly demonstrates that this is an international project impacting many more countries than those directly involved at the two landfalls of the pipeline.
n As can be reasonably expected, a large share of the effect is either
– in countries where major project related construction activities take place (RU, DE, FI, SE).
– or in countries traditionally associated with the offshore oil and gas industry that host the majority of service providers (NL, UK, NO, IT).
– or at the headquarters of major international service providers.
n The data also shows that raw materials and services are today sourced internationally from around the world, depending on price/quality considerations.
n The mid-way view also reflects what can be expected from the current stage of project development - a higher share of spending on what is required up-front to allow timely implementation - e.g. service contracts with specialized engineering firms, survey and environmental experts, materials, some specialized offshore installation and construction tasks.
n The following stages will likely see more specialized construction services, also for preparation of onshore and landfall facilities and installations.
n The analysis of full-time equivalents created by the project is in line with expectations from other similar large scale infrastructure projects. For example, as a comparison, building the Öresund bridge between Denmark and Sweden at the end of the 1990s cost €4 billion, and created direct jobs for more than 8,000 people, not counting indirect and induced working opportunities.
n Over 30,000 full-time equivalents created by Nord Stream 2 over 5 years in the EU can be compared to the number of inhabitants of the city of Zug in Switzerland, where Nord Stream 2 AG has its headquarters, or half the population of the Swedish island of Gotland in the Baltic Sea.
n These jobs provide some relief at a point in time when the oil and gas industry is experiencing cutbacks and lay-offs due to low oil prices – for example, in the UK alone, 60,000 jobs were lost in 2016 as a direct result of cost cutting and restructuring20.
n The analysis in this study is limited by the boundaries of the Nord Stream 2 project but further related economic effects are likely. Examples include the landfall facilities in Germany and Russia and investments to strengthen the German pipeline grid.
n In addition, further effects are to be expected once the full picture of investment allocation is known following project completion.
n Additional economic benefits are also likely to arise from the presence of additional competitively priced gas to the European economy and lower decarbonisation costs as a result of lower gas prices competing with oil and coal – these could be the subject of separate studies further on.
20 http://oilprice.com/Latest-Energy-News/World-News/UK-Oil-And-Gas-Shed-60000-Jobs-In-2016.html

Contacts
If you would like more information or to arrange an informal discussion on the issues raised here and how they affect your business, please contact:
AustriaMichael [email protected]
Belgium Kurt [email protected]
China Russell Pell [email protected]
Czech Republic Dean Brabec [email protected]
France Vincent [email protected]
GermanyMichael [email protected]
India Srini Srinivasan [email protected]
Italy Stefano [email protected]
JapanYotaro [email protected]
Korea Kevin [email protected]
Latin AmericaDaniel Monzón [email protected]
Middle East Jaap [email protected]
The Netherlands Martijn Eikelenboom [email protected]
Norway Diego [email protected]
Singapore Yuma [email protected]
SpainDavid [email protected]
Sweden Annette [email protected]
SwitzerlandMichael [email protected]
TurkeyCoskun [email protected]
UKStephen [email protected]
USA Rodolfo [email protected]

www.adl.com/NordStream2impact
Arthur D. Little
Arthur D. Little has been at the forefront of innovation since 1886. We are an acknowledged thought leader in linking strategy, innovation and transformation in technology-intensive and converging industries. We navigate our clients through changing business ecosystems to uncover new growth opportunities. We enable our clients to build innovation capabilities and transform their organizations.
Our consultants have strong practical industry experience combined with excellent knowledge of key trends and dynamics. Arthur D. Little is present in the most important business centers around the world. We are proud to serve most of the Fortune 1000 companies, in addition to other leading firms and public sector organizations.
For further information, please visit www.adl.com.
Copyright © Arthur D. Little 2017. All rights reserved.
Economic impact on Europe of the Nord Stream 2 project


