Economic Impact of a Clean Electricity Payment Program
28
Economic Impact of a Clean Electricity Payment Program The Impact on Jobs and Economic Activity of a National Clean Electricity Payment Program in the United States Pavel Darling Paul Hibbard Luke Daniels September 2021
Transcript of Economic Impact of a Clean Electricity Payment Program

Economic Impact of a Clean Electricity Payment Program The Impact on Jobs and Economic Activity of a National Clean Electricity Payment Program in the United States
Pavel Darling Paul Hibbard Luke Daniels
September 2021

Economic Impact of a Clean Electricity Payment Program – Analysis Group
PAGE 2
Acknowledgments
This report was prepared at the request of Natural Resources Defense Council (NRDC) and Evergreen Collaborative to review the potential economic impacts of implementing a Clean Electricity Payment Program in the United States. This is an independent report by Pavel Darling, Paul Hibbard, and Luke Daniels of Analysis Group. The authors would like to thank Jeff Monson and Dmitriy Kim for their assistance with research and analysis, and Starla Yeh, Arjun Krishnaswami, Amanda Levin, and Gabe Alvarez of NRDC and Leah Stokes and Sam Ricketts of Evergreen Collaborative for their feedback and guidance. However, the observations and conclusions in the report are those of the authors only, and do not necessarily reflect the views of NRDC and Evergreen Collaborative.
About the Authors
Pavel Darling is a Vice President at Analysis Group and an expert on energy matters, focusing on electricity and natural gas pricing, markets, and infrastructure. He has performed a wide range of economic and environmental assessments of new construction projects, retirements, and mergers. In these matters, has both provided and supported expert testimony, in litigation and before federal and state regulatory bodies. He also regularly conducts economic impact analyses across a variety of industries, including energy, environment, automotive, and real estate.
Paul Hibbard is a former Chairman of the Massachusetts Public Utilities Commission, has served as a member of the Massachusetts Energy Facilities Siting Board, and has testified before Congress, state legislatures, and federal and state regulatory agencies. Mr. Hibbard is now a Principal in Analysis Group’s Boston office, and has public and private sector experience in energy and environmental technologies, economics, market structures, and policy.
Luke Daniels is a Senior Analyst at Analysis Group, where he has performed economic assessments of energy and climate policies, in addition to electric system production cost modeling, and various modeling constructs examining the impacts of decarbonization in the electricity and natural gas industries.
Introduction to Analysis Group
Analysis Group is one of the largest international economics consulting firms, with more than 1,000 professionals across 14 offices in North America, Europe, and Asia. Since 1981, Analysis Group has provided expertise in economics, finance, health care analytics, and strategy to top law firms, Fortune Global 500 companies, government agencies, and other clients worldwide.
Analysis Group’s energy and environment practice area is distinguished by expertise in economics, finance, market modeling and analysis, regulatory issues, and public policy, as well as deep experience in environmental economics and energy infrastructure development. We have worked for a wide variety of clients, including (among others) energy producers, suppliers and consumers, utilities, regulatory commissions and other federal and state agencies, tribal governments, power-system operators, foundations, financial institutions, and start-up companies.

Economic Impact of a Clean Electricity Payment Program – Analysis Group
PAGE 3
Table of Contents I. Executive Summary ............................................................................................................... 4
A. Key Takeaways .......................................................................................................................... 6
II. Background and Purpose ..................................................................................................... 8 III. Analytic Method .................................................................................................................... 12
A. Overview ................................................................................................................................... 12
B. Differences between the CEPP and BAU Cases ....................................................................... 12
1. Capacity and associated capital costs ...................................................................................... 12
2. Fuel, operating, and maintenance costs ................................................................................... 15
3. Additional considerations ........................................................................................................... 16
4. Summary .................................................................................................................................... 16
C. Macroeconomic Model ............................................................................................................... 17
IV. Results and Observations ................................................................................................... 19
A. Results ....................................................................................................................................... 19
B. Observations .............................................................................................................................. 23
V. Appendix: CEPP Reference Case Assumptions .............................................................. 28

Economic Impact of a Clean Electricity Payment Program – Analysis Group
PAGE 4
I. Executive Summary Recent analyses have demonstrated the potential economic benefits of clean energy investments prompted through private investments and public policy programs. This report focuses on one recent budget proposal that would provide incentives for investment in new clean energy technologies across the U.S. – a national Clean Electricity Payment Program (CEPP). A CEPP would generate hundreds of billions in economic activity and create millions of jobs while helping the U.S. achieve energy and climate policy goals. Based on our analysis and as we describe in this report, policymakers can leverage the $150 billion CEPP allocation in the recent congressional budget resolution to produce nearly $1 trillion in value to the U.S. economy.
For the purpose of this study, we review the level of investment and changes in power system operations associated with implementation of a national CEPP over a ten-year period, including investments in and operation of eligible low-carbon resources, such as solar, wind, nuclear, hydro, geothermal, etc.1 We estimate the potential economic impact of this scenario using a macroeconomic model (IMPLAN), with the goal of estimating how CEPP implementation would affect economic value (i.e., GDP), as well as jobs, and federal, state and local tax revenues.
The CEPP scenario we rely on is designed to reflect a version of the measure currently being negotiated in Congress. It includes region-specific clean electricity trajectories that average out to 80% clean electricity across the country by 2030. The payments and penalties are calculated based on the clean electricity trajectory in each region, with payments calculated based on growth in clean electricity from the previous year and penalties applied on each megawatt-hour difference between the trajectory and the achieved clean electricity percentage. Qualifying resources include renewable energy, nuclear, low-emission fuel (e.g., synthetic gas), and carbon capture and sequestration. The CEPP scenario also includes 10-year clean energy tax incentives. The business-as-usual (BAU) scenario assumes no new federal or state policies beyond those in place before June 2020, and the underlying assumptions for the reference case are included in the Appendix.
The results of the analysis point to strong economic benefits associated with implementation of a CEPP in the U.S. Relative to the BAU scenario, implementation of the CEPP through 2031 would generate the following benefits:2
• An increase of 7.7 million jobs by 2031 (in job-years), with over 1.7 million jobs (in job-years) in 2030 alone; 3
• Over $907 billion dollars in economic value added to the U.S. economy; • Increased tax revenues to federal, state and local governments of over $154 billion.
1 For more information on CEPP, see https://collaborative.evergreenaction.com/policy-hub/100-clean. 2 Results are reported in terms of nominal dollars assuming a 2% annual inflation rate. The reported economic value added and tax revenue reflect the sum of nominal dollars from 2022 to 2031. 3 Results are reported through 2031, assuming that the CEPP would be enacted through the budget reconciliation process, limiting implementation to a ten-year period.

Economic Impact of a Clean Electricity Payment Program – Analysis Group
PAGE 5
The financial incentives in a CEPP would also increase investment in solar, wind, and other low-carbon resources by nearly 628 GW by 2031.
Figure ES-1 Figure ES-2 Economic value added4 Job-Years
Figure ES-3 Figure ES-4 Cumulative addition of resources through 2031 Cumulative regional generation (TWh) 2022-2031 Relative to BAU5 Relative to BAU
4 Value added is reported in nominal dollars. 5 Net negative additions are not shown.
$266$56
$557
$85
$823
$0$100$200$300$400$500$600$700$800$900
2022-2027 2028-2031
Valu
e A
dded
($ B
illio
n)
Direct Indirect & Induced
0.35
3.31
0.40
3.68
0.75
7.00
0.00
1.00
2.00
3.00
4.00
5.00
6.00
7.00
8.00
0
1
2
3
4
5
6
2022-2027 2028-2031Empl
oym
ent (
Mill
ion
Job-
Year
s)
Direct Indirect & Induced
327
43
251
0
100
200
300
400
500
600
700
By 2027 By 2031
Cum
ulat
ive
Cap
acity
Add
ition
s (G
W)
Solar Onshore Wind Other Offshore Wind
48
628
1,645
209
235180
341
1,138
248
909 162203
340
2,891

Economic Impact of a Clean Electricity Payment Program – Analysis Group
PAGE 6
A. Key Takeaways The following key takeaways emerged from our modeling of clean energy investments associated with a national CEPP:
A Clean Electricity Payment Program would deliver important and positive economic benefits to the U.S. by substantially growing the economy, creating millions of jobs, and generating revenues for state and local government. A CEPP would spur both immediate and continuous investments in new electric generating technologies as retail suppliers are incentivized to meet the CEPP performance goals. These investments would generate significant economic activity, create jobs across a wide range of skills and industries (e.g., construction, retail, manufacturing), and increase tax revenues for federal, state and local governments. The economic benefits arise from the direct investment of dollars to build and operate CEPP-eligible resources, and from additional economic activity generated indirectly and induced by the flow of these investment dollars through the economy. Economic value, job creation, and revenue expansion stemming from a CEPP would also serve as a foundation for future economic expansion.
These economic benefits are driven by a major buildout of clean energy resources in all regions of the country, dispersing direct, indirect and induced economic benefits across the country. The CEPP would spur the buildout of eligible resources widely across the U.S. The program would accelerate deployment of readily available resources, such as solar, storage, and on-shore wind, while also driving demand for newer, innovative technologies like offshore wind and low- or zero-emissions fuels. Figure ES-3 provides an overview of additional capacity constructed through 2031. In addition, the total development over the first approximately 10 years of the period would increase total cumulative generation from renewable resources by over 8,500 TWh, relative to BAU. Regional increases in clean electricity generation are shown in Figure ES-4. The CEPP would increase annual generation from renewables 400% by 2030 compared to 2020 levels, and 150% relative to BAU, with substantial investments made in all regions of the country.6
A CEPP would reduce energy and economic supply chain risk and provide an opportunity to create energy sector jobs in every region. Growth in CEPP-compliant technologies will lead to accelerated development of energy sources and technologies that rely primarily on domestic manufacturing and materials industries. This shift would reduce supply chain risks and reliance on concentrated supply sectors and yield economic activity driving energy supply and use across all regions of the country.
Significant renewable resource investments as projected under the CEPP evaluated in this study are aligned with the need to meet vital energy, environmental, and climate policy goals. While this report focuses on the economic impacts of CEPP-driven resource investments, a CEPP would also drive significant climate and public health benefits. Virtually every dollar of investment studied in this report increases the production and use of electricity without emissions of GHGs and other pollutants, and builds the electricity system infrastructure needed to continue progress towards the ultimate goal of a net-zero GHG economy. These changes
6 In 2020, renewable resources made up 20% of total U.S net generation from utility-scale generators, or about 800 TWh. See, “Electricity explained: Electricity generation, capacity, and sales in the United States,” EIA, accessed at: https://www.eia.gov/energyexplained/electricity/electricity-in-the-us-generation-capacity-and-sales.php.

Economic Impact of a Clean Electricity Payment Program – Analysis Group
PAGE 7
in energy supply would also generate improvements in air quality.7 CEPP investments would also facilitate decarbonization of the nation’s electricity systems at a time when it will need to absorb additional demand from electrification of the transportation and building sectors, and increasingly the industrial sector. A CEPP program would thus induce private investment in a way that maintains and grows economic productivity and jobs while helping states and the U.S. meet important energy, climate, and public health goals.
7 See, e.g., Krishnaswami, A. and Murrow, D., “80% Clean Power by 2030: Achievable with Massive Benefits,” NRDC, August 12, 2021, accessed at: https://www.nrdc.org/experts/arjun-krishnaswami/80-clean-power-2030-achievable-massive-benefits and Driscoll, C., et. al., “An 80x30 Clean Electricity Standard: Carbon, Costs, and Health Benefits,” Clean Energy Futures, July 12, 2021, accessed at: https://cleanenergyfutures.syr.edu/wp-content/uploads/2021/07/CEF-80x30-CES-Report_Final_July_15_21.pdf (hereafter “CES Report”). The CES Report found that achieving 80 percent clean electricity by 2030 could result in $100 to $211 billion in climate and public health benefits by 2030, and avoid more than 300,000 premature deaths between now and 2050.
Economic Impact of a Clean Electricity Payment Program – Analysis Group
PAGE 8
II. Background and Purpose The most recent report from the United Nations Intergovernmental Panel on Climate Change (IPCC), released this summer, confirmed with greater confidence that human-induced climate change is responsible for observed changes in extremes such as heatwaves, heavy precipitation, droughts, and tropical cyclones;8 that changes in climate change impacts would be more widespread at 2°C compared to 1.5°C global warming; and that even more widespread and/or pronounced impacts would occur at higher warming levels.9 Limiting human-induced global warming to a specific level requires limiting cumulative CO2 emissions, reaching at least net zero CO2 emissions, along with strong reductions in other greenhouse gas emissions by midcentury.10 In 2019, the IPCC issued a report demonstrating the potential for far greater impacts at 2°C compared to 1.5°C, and the likely need to limit global net CO2 to approximately 45 percent below 2010 levels by 2030, reaching net zero around 2050 in order to stay within 1.5°C global warming.11 Levels of warming above 1.5°C are widely viewed as likely crossing a threshold beyond which human civilization risks changes in the global climate with severe consequences for societies and economies, and where we are at increased risk of passing “tipping points.”12
Consistent with the need to avoid the worst climate risks, federal legislators have proposed, and many states have enacted, laws and policies to achieve economy-wide GHG emission reductions that require economy-wide reductions of GHGs by as much as 80 to 100 percent by 2050. President Biden has committed to cutting economy-wide emissions 50 to 52 percent from 2005 levels by 2030.13 These actions and proposals reflect legislators’ and policymakers’ focus on making progress towards decarbonization at levels and a pace consistent with the intent of parties to the Paris Agreement to avoid exceeding dangerous levels of warming.
Legislators and regulators have advanced a wide range of laws, policies and proposals to help achieve this decarbonization through a mix of emission reduction standards and investment incentives. Recent examples, including those proposed by the Biden Administration and considered in Congress, include (a) steady decarbonization of the power sector through the operation of a “Clean Electricity Payment Program” (CEPP); (b) public and private investment in low- and zero-carbon energy sources and associated infrastructure, including enhanced and extended federal tax incentives; (c) continued improved efficiency of energy supply and use; and (d)
8 IPCC, 2021: Summary for Policymakers. In: Climate Change 2021: The Physical Science Basis. Contribution of Working Group I to the Sixth Assessment Report of the Intergovernmental Panel on Climate Change [Masson-Delmotte, V., P. Zhai, A. Pirani, S. L. Connors, C. Péan, S. Berger, N. Caud, Y. Chen, L. Goldfarb, M. I. Gomis, M. Huang, K. Leitzell, E. Lonnoy, J.B.R. Matthews, T. K. Maycock, T. Waterfield, O. Yelekçi, R. Yu and B. Zhou (eds.)]. Cambridge University Press. In Press (hereafter “IPCC 2021), SPM-10. 9 IPCC 2021, SPM-32. 10 IPCC 2021, SPM-36. 11 IPCC, 2018: Summary for Policymakers. In: Global Warming of 1.5°C. An IPCC Special Report on the impacts of global warming of 1.5°C above pre-industrial levels and related global greenhouse gas emission pathways, in the context of strengthening the global response to the threat of climate change, sustainable development, and efforts to eradicate poverty [Masson-Delmotte, V., P. Zhai, H.-O. Pörtner, D. Roberts, J. Skea, P.R. Shukla, A. Pirani, W. Moufouma-Okia, C. Péan, R. Pidcock, S. Connors, J.B.R. Matthews, Y. Chen, X. Zhou, M.I. Gomis, E. Lonnoy, T. Maycock, M. Tignor, and T. Waterfield (eds.)]. In Press, pages 7 and 12. 12 Tipping points represent thresholds that, if exceeded, could lead to large and abrupt changes in the climate system, with potentially rapid and severe impacts on ecosystems, societies and economies. See, Lenton, T., et al., “Tipping elements in Earth’s climate system,” Proceedings of the National Academy of Sciences of the United States of America, February 7, 2008. 13 See White House Fact Sheet, “President Biden Sets 2030 Greenhouse Gas Pollution Reduction Target Aimed at Creating Good-Paying Union Jobs and Securing U.S. Leadership on Clean Energy Technologies”, April 22, 2021, accessed at: https://www.whitehouse.gov/briefing-room/statements-releases/2021/04/22/fact-sheet-president-biden-sets-2030-greenhouse-gas-pollution-reduction-target-aimed-at-creating-good-paying-union-jobs-and-securing-u-s-leadership-on-clean-energy-technologies/

Economic Impact of a Clean Electricity Payment Program – Analysis Group
PAGE 9
electrification of transportation and building sectors. These programs and proposals seek to address the climate challenge through a complementary mix of greenhouse gas (GHG) emission reduction standards and infrastructure investment, providing both a regulatory “push” and an incentive “pull” for needed investments in energy technology research, development, commercialization, and deployment.
In addition to cutting emissions to avoid climate impacts, these policy proposals have widespread economic implications. Recent analyses have evaluated the potential economic impacts associated with various decarbonization policy proposals and have demonstrated economic benefits from rapid investment in clean energy technologies through the infusion of public and private dollars as part of stimulus and/or infrastructure packages. These analyses have evaluated, in particular, the potential impact of energy infrastructure spending on economic value added, job growth, and tax revenues associated with clean energy investments at the federal and state level.14
In this report we evaluate in a similar manner the potential economic impacts associated with achieving decarbonization goals through the implementation of a Clean Electricity Payment Program. A CEPP would achieve steady reductions in GHG emissions from the electric sector over time through a system of federal investments and incentives for suppliers of electricity.15 A CEPP would be designed to achieve progressive increases in low- or zero-GHG emitting resources, reaching an average of 80 percent of the country’s electricity demand by 2030 and 85 percent reductions in carbon pollution below 2005 levels.16 The CEPP would be administered by the Department of Energy through a system of payments and fees to/from sellers of electricity, based on their clean energy content relative to annual clean energy performance goals. Implementation of a CEPP is viewed as key to decarbonizing the electric system at a time when it will be relied on to absorb increasing and changing demand due to electrification of the vehicle and building sectors. Eligible resources would include new or existing zero- or low-carbon technologies (e.g., solar, wind, hydro, geothermal, nuclear, carbon capture, hydrogen, etc.). The target of a CEPP would be the entities that sell electricity to ultimate consumers – competitive retail electricity suppliers, electric utilities, electric cooperatives, federal power administrations, and municipal light companies. Retail electricity suppliers would need to build, contract for, or purchase sufficient qualifying clean energy to achieve the performance standard, and would receive financial incentives for meeting the standard. The financial incentives, in turn, would be used to fund the new construction or continued operation of eligible clean energy resources, driving the increase in these resources over time. Since this budget measure may pass through budget reconciliation, the CEPP would likely operate (initially) from 2022-2031; thus this is the period of focus for our analysis.
A CEPP can amplify and accelerate early investment in low-carbon technologies and sustain and deepen such investments over time through progressively increasing requirements to purchase or generate electricity with low or zero carbon power sources. In this report we evaluate the potential impact of a these CEPP outcomes on
14 See, for example, Economic Impact of Stimulus Investment in Advanced Energy for America, Analysis Group, June 2021. Economic Impact of Stimulus Investment in Transportation Electrification, Analysis Group, June 2021. Analysis Group has also studied impacts at the state level for certain states. See also, Renewable Energy Benefits: Measuring the Economics, IRENA, 2016. 15 See, e.g., Clean Air Task Force, Clean Electricity Payment Program; A Budget-Based Alternative to a Federal Clean Electricity Standard, August 2021. 16 Krishnaswami, A. and Murrow, D., “80% Clean Power by 2030: Achievable with Massive Benefits,” NRDC, accessed at: https://www.nrdc.org/experts/arjun-krishnaswami/80-clean-power-2030-achievable-massive-benefits

Economic Impact of a Clean Electricity Payment Program – Analysis Group
PAGE 10
economic activity across the U.S.
The CEPP scenario we rely on is designed to reflect a version of the budgetary measure currently being negotiated in Congress. It includes region-specific clean electricity trajectories that average out to 80% clean electricity across the country by 2030.17 The payments and penalties are calculated based on the clean electricity trajectory in each region, with payments calculated based on growth in clean electricity from the previous year and penalties applied on each megawatt-hour difference between the trajectory and the achieved clean electricity percentage. Qualifying resources include renewable energy, nuclear, low-emission fuel (e.g., synthetic gas), and carbon capture and sequestration. The CEPP scenario also includes 10-year clean energy tax incentives. The BAU scenario assumes no new federal or state policies beyond those in place before June 2020, and the underlying assumptions for the reference case are included in the Appendix.
Our analysis – described in more detail in Section III – examines the impact of a CEPP on investments, retirements, and operational changes in the power sector in the U.S. through 2031, a time of increasing demand for electricity. The increase in demand stems primarily from efforts in many states and at the federal level to reduce GHG emissions from the transportation sector through a transition from internal combustion engines to electric vehicles, and in the building sector by transitioning from oil and gas heating/hot water to electric heating such as heat pumps. The CEPP will reduce GHG emissions directly in the power sector, while also lowering the emissions associated with end-use activities. That is, the availability of low-carbon electricity enables the decarbonization of the transportation and building sectors through electrification.
The analysis assumes implementation of a CEPP starting in 2022, with increasing incentives for clean energy until a national target of 80 clean electricity is reached by 2030. The key input to the analysis is changes in the capital and operating costs of new and existing power generating resources across the U.S. Estimates of how the CEPP would affect power plant investment and operations were developed using the Integrated Planning Model (IPM®) based on assumptions and policy scenarios developed by NRDC.18 The results include increases over time, relative to a business-as-usual scenario, in the development and operation of solar, wind, storage, and nuclear generating resources, and decreases over time in generation from fossil-based resources. NRDC’s analysis also tracks changes in costs to consumers and revenues to power generators, on a state and regional basis.
Our economic impact assessment then tracks these differences in investment, operations, costs and revenues as they ripple throughout the economy. The impacts are studied using a macroeconomic model (IMPLAN), focusing on a three key questions:
- How would changes in the level and types of investment in the power sector relative to a business-as-usual scenario – e.g., increasing development of renewable and storage technologies - affect the U.S. economy, jobs and tax revenues?
- How would CEPP implementation facilitate more rapid investment in compliant technologies, in what quantities, and in what years?
- Based on the answers to these questions, what should policymakers consider with respect to the
17 The average 80% outcome means that, for example, some utilities may be at 65% and others at 95%. 18 “EPA’s Power Sector Modeling Platform v6 using IPM January 2020 Reference Case,” EPA, accessed at: https://www.epa.gov/airmarkets/epas-power-sector-modeling-platform-v6-using-ipm-november-2018-reference-case-0. See also the Appendix.

Economic Impact of a Clean Electricity Payment Program – Analysis Group
PAGE 11
advancement of a national CEPP?
It is worth noting that while our analysis reviews the impact of a CEPP strictly through an economic lens, the impetus for a CEPP is driven by a range of benefits and objectives that go well beyond only the impact on jobs and economic output. Specifically, a CEPP would significantly limit the extent of global warming and reduce the social, economic and environmental risks associated with continued warming. In addition, a CEPP would support achievement of a range of additional economic, health, and environmental benefits that could flow from the many changes it would prompt in energy technologies and practices, including growth in domestic technologies, companies, and manufacturing, reducing the geographic concentration of energy sector economic activity, supporting decarbonization of other economic sectors, and improving public health through reducing power plant emissions, particularly in and around disadvantaged communities.
Section III includes a summary of the analytic method and economic model, the data and assumptions applied, and the various modeling inputs and outputs resulting from the analysis. Section IV summarizes the results and observations that flow from the analysis.

Economic Impact of a Clean Electricity Payment Program – Analysis Group
PAGE 12
III. Analytic Method
A. Overview The economic impacts of a CEPP are modeled by running a CEPP scenario through a macroeconomic input-output model, IMPLAN. The key input is a representation of changes in the electric system (in power plant capacity and output, fuel use, costs and revenues, etc.) that would occur with a CEPP, relative to what otherwise would happen in a business-as-usual (BAU) scenario. The modeled CEPP program provides incentives for new and existing clean energy resources, and penalties for electric utilities that do not increase their use of clean energy resources as a percentage of their overall load, and by 2030 results in the U.S. power sector achieving approximately 80 percent clean electricity, on average. The power system changes associated with the CEPP are from a power system modeling framework developed by NRDC. Investment amounts associated with power system changes rely on capital costs modeled based on NRDC’s assumptions and confirmed by research and analysis of multiple public sources for solar, on- and off-shore wind, and other resources.19 We then run the total dollars of investment (based on the level of new resource development times the estimated capital costs) and other cost effects (e.g., changes in fuel use and operating costs) through IMPLAN, and generate results along key economic metrics (value added ($), jobs, tax revenues). Each of these steps is described below.
B. Differences between the CEPP and BAU Cases
1. Capacity and associated capital costs
The first step in the analysis is to identify changes in power system resources (power plants) and operations that would occur with a CEPP, relative to a scenario that does not include a CEPP (i.e., a BAU scenario). For this determination we relied on power system modeling conducted using the Integrated Planning Model (IPM®) with assumptions developed by NRDC using publicly available sources, comparing the level of development of CEPP-eligible resources under the two scenarios, and estimating changes in both generating capacity and annual generation by resource type.20 Figures 1 and 2 provide the impact of a CEPP on generating capacity development as the incremental total MW of installed resources. The primary impact of the CEPP is to induce large increases over time in the development and continued operation of CEPP-eligible resources (e.g., solar, wind, nuclear), and small decreases in the capacity of non-CEPP eligible resources (uncontrolled fossil fuel resources).21,22 Specifically, in the CEPP case (relative to the BAU case), the total installed capacity of solar and wind resources nationwide increases by 588 GW by 2031. More nuclear capacity remains active in the CEPP scenario, due to its presumed eligibility for the CEPP.
19 These include NREL’s JEDI model, US Energy Information Administration’s Annual Energy Outlook, and the US Environmental Protection Agency. 20 For more information on IPM, see https://www.icf.com/technology/ipm. See also the Appendix. 21 The modeled retirement of non-eligible resources is small in part because it is economic to keep much of this capacity on line, even if the annual output of the capacity is very low. That is, while over the study period a lot of fossil generation capacity remains on line, these power plants tend to operate at low capacity factors relative to the BAU scenario due to increased output from CEPP-eligible renewable resources. 22 Prior studies have evaluated the economic impacts of investing stimulus/infrastructure dollars in advanced energy technologies. See, for example, Hibbard et al, ”Economic Impact of Stimulus Investment in Advanced Energy for America,“ June 2021. To the extent that significant infrastructure dollars are dedicated for rapid deployment of technologies that would be eligible for the CEPP, those could be additive to or offset the assumed level of CEPP-driven resources studied in this report.

Economic Impact of a Clean Electricity Payment Program – Analysis Group
PAGE 13
Figure 1 Total changes in added generating capacity through 2031
132 GW
761 GW
0
100
200
300
400
500
600
700
800
BAU CEPP
Adde
d C
apac
ity (G
W)

Economic Impact of a Clean Electricity Payment Program – Analysis Group
PAGE 14
Figure 2 Cumulative changes in non-emitting generating capacity by resource type through 2031, net of BAU23,24
23 Capacity is reported net of business-as-usual (BAU). 24 The differences in resource development (in GW) are translated into a total amount of investment in generating resources across the two cases. Our estimates of capital investment by resource type are based on overnight capital costs modeled based on NRDC’s assumptions. Table 1 shows the estimated total capital investments used in the analysis, by resource category, and reflect the incremental investments above and beyond the BAU new resource investments. These investment differences are reflected in IMPLAN by category of spending (e.g., labor, construction) and type of resource (e.g., wind, solar).
406
316
22
0
50
100
150
200
250
300
350
400
450
2021 By 2027 By 2031
Cha
nge
in G
ener
atin
g C
apac
ity (G
W) Solar
Wind
Nuclear

Economic Impact of a Clean Electricity Payment Program – Analysis Group
PAGE 15
Table 1: Capital costs by resource type ($million), net of business-as-usual25
2. Fuel, operating, and maintenance costs
While differences in total investment represent the most significant impact of CEPP implementation, there are other factors affected by CEPP implementation that are important to understand from an economic perspective. In particular, the increase in CEPP-eligible generation leads to a decrease in generation from fossil fuel units, with a commensurate reduction in fuel purchases, which are shown in Table 2. These reductions are modeled as fuel supply chain impacts across all stages of the fuel cycle, reducing economic activity associated with these fuels.
Table 2: Changes in fuel expenditures ($million), net of business-as-usual26
In addition to changes in fuel costs, changes in the mix of generation assets also results in changing operational and maintenance costs associated with the operation and upkeep of existing and new resources. As shown in Table 3, increased generation from non-emitting resources (relative to BAU) increases expenditures for those resources, while decreases in fossil generation (relative to BAU) reduce expenditures. The net effect is an increase in operations and maintenance activity.
25 Capital costs are reported in $2012 million. 26 Costs are reported in $2012 million.
Resource Type 2022-2027 2028-2031 TotalOnshore Wind $58,968 $288,766 $347,734Solar $4,476 $161,453 $165,929Offshore Wind -$71 $19,006 $18,935Low-Emission Fuel and Gas -$4,874 $5,782 $907Other $1,969 $33,458 $35,427Total $60,468 $508,464 $568,933
Resource Type 2022-2027 2028-2031 TotalCoal -$13,716 -$48,766 -$62,482Low-Emission Fuel and Gas -$11,427 -$108,012 -$119,439Nuclear $3,730 $3,910 $7,640Oil/Gas Steam -$490 -$3,885 -$4,375Total -$21,904 -$156,752 -$178,656

Economic Impact of a Clean Electricity Payment Program – Analysis Group
PAGE 16
Table 3: Changes in operating and maintenance expenditures ($million), net of business as usual27
3. Additional considerations
Changes needed to meet the CEPP affect other types of system costs as well. Decommissioning costs are independently estimated and applied to projected retiring capacity from the CEPP model run; there are avoided decommissioning costs in meeting CEPP as fewer nuclear resources, which have high decommissioning costs, are taken offline.28 The economics of fossil technologies like CCS factor in as well, both in installation (which we include in capital costs) and in ongoing costs. CCS will have a positive or negative expense, depending on the location, sequestration costs, and the effects of EOR sales and tax credits.29
Table 4: Additional costs ($million)
4. Summary
In summary, the primary driver of costs associated with meeting the CEPP is capital costs for increased renewable capacity. Other costs are aggregated and included, for completeness; avoided costs in fuel represent decreased reliance on fossil resources, and operating and maintenance costs increase slightly as the increase for renewables and nuclear more than offsets the decrease in operating and maintenance costs at fossil fuel facilities. Other cost categories, such as resource decommissioning costs and ongoing CCS costs and benefits, have a smaller effect on overall costs at the national level.
27 Costs are reported in $2012 million. 28 Decommissioning costs reflect the total expense associated with retiring generating capacity. The decommissioning costs used in this study are pulled from Duke Energy’s Decommissioning Cost Estimate Study (Duke Energy, “Decommissioning Cost Estimate Study Project No. 95525, April 19, 2017) and are supplemented with the decommissioning cost estimates of other studies. 29 Costs shown are based on the IPM modeling results relying on NRDC assumptions.
Resource Type 2022-2027 2028-2031 TotalNuclear $16,407 $19,850 $36,257Offshore Wind -$2 $3,360 $3,358Onshore Wind $8,178 $43,013 $51,192Solar $573 $14,512 $15,084Fossil -$10,639 -$45,417 -$56,056Other $215 $4,828 $5,043Total $14,732 $40,146 $54,878
Cost Category 2022-2027 2028-2031 TotalDecommissioning and Other Costs -$4,142 $424 -$3,718Total -$4,142 $424 -$3,718

Economic Impact of a Clean Electricity Payment Program – Analysis Group
PAGE 17
Table 5: Investment from implementing CEPP ($million)
C. Macroeconomic Model The differences in power system investment and operations can affect the economy in multiple ways. In our analysis, we pay attention to several key factors. First, when the CEPP prompts development of a resource or technology (such as a new renewable resource), those investments have a direct impact in the form of purchases of goods and services in the economy. Second, when the CEPP prompts differences in generation output (e.g., a decrease in generation from gas-fired power plants), those differences can lead to lower consumption of fuels and lower revenues for certain categories of generation owners. These differences have supply chain impacts that can increase or decrease net economic activity, depending on the fuel source and location of fuel production. Third, changes in electricity prices over time associated with a CEPP will lead to higher or lower consumer costs for electricity, which would be offset by lower or higher revenues to power generators, representing a transfer rather than a specific directional impact on economic activity.
The economic impacts of CEPP-driven changes in the power sector are estimated by including them in the IMPLAN model, which calculates the macroeconomic impact of the scenario based on the economic relationships that exist among providers and users of goods and services in the U.S. In effect, we model economic outcomes with these changes to the economy, and without them, and measure the difference.
IMPLAN is a social accounting/input-output model that attempts to replicate the structure and functioning of a specific economy (e.g., a state or a country), and is widely used in public and private sector economic impact analyses. It estimates the effects on a regional economy of a change in economic activity by using baseline information capturing the relationships among businesses and consumers in the economy based on historical economic survey data. IMPLAN tracks dollars spent in the geography of interest (in this case, the U.S.), including dollars that circulate within it (e.g., transfers of dollars from consumers to producers), dollars that flow into it (e.g., purchases of goods and services from outside the local economy), and dollars that flow outside of it (e.g., payments to the federal government). The model thus examines inflows, outflows, and interactions within the economy under study.
The IMPLAN model allows one to investigate interactions in the economy, and to calculate various economic impacts when a new or different activity (such as new construction of energy infrastructure or lost revenues for owners of power plants) involves money flows around the economy. Specifically, the model captures various impacts, including:
• Employment impacts (the total number of jobs created or lost); • Income impacts (the total change in income to employees that results from the economic activity); and
Cost Category 2022-2027 2028-2031 TotalCapital Costs $60,468 $508,464 $568,933Fuel Costs -$21,904 -$156,752 -$178,656Operating Expenses $14,732 $40,146 $54,878Decommissioning and Other Costs -$4,142 $424 -$3,718
Economic Impact of a Clean Electricity Payment Program – Analysis Group
PAGE 18
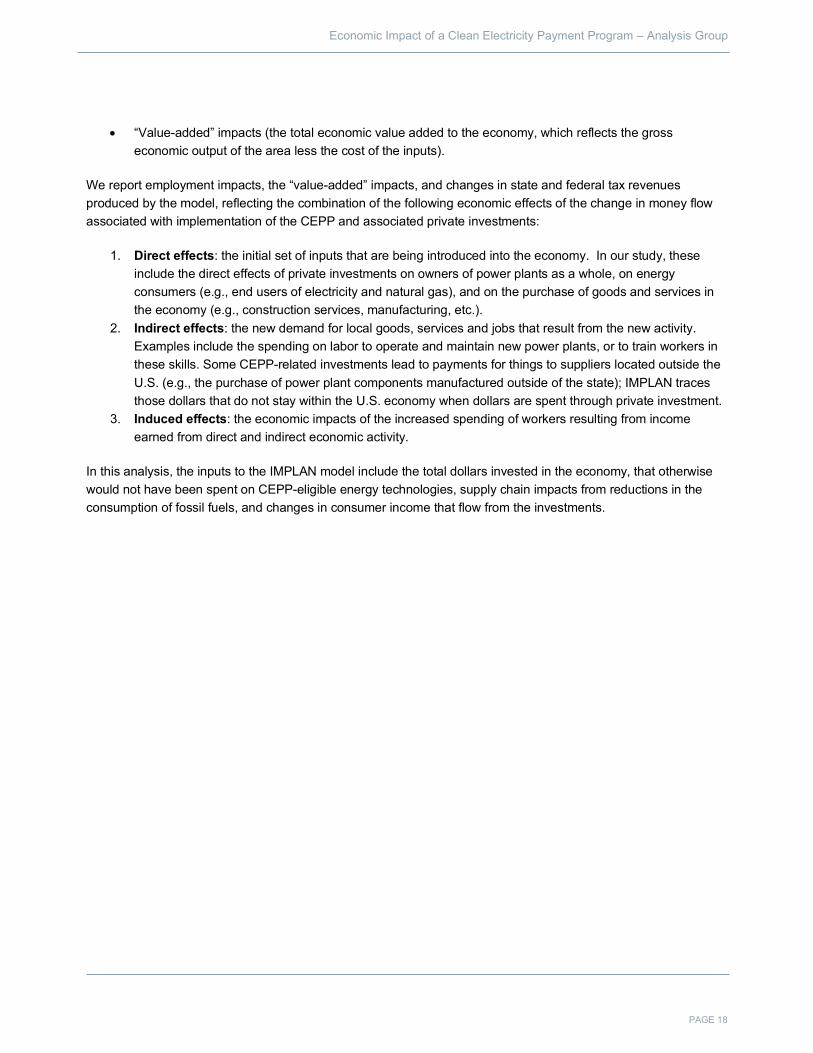
• “Value-added” impacts (the total economic value added to the economy, which reflects the gross economic output of the area less the cost of the inputs).
We report employment impacts, the “value-added” impacts, and changes in state and federal tax revenues produced by the model, reflecting the combination of the following economic effects of the change in money flow associated with implementation of the CEPP and associated private investments:
1. Direct effects: the initial set of inputs that are being introduced into the economy. In our study, these include the direct effects of private investments on owners of power plants as a whole, on energy consumers (e.g., end users of electricity and natural gas), and on the purchase of goods and services in the economy (e.g., construction services, manufacturing, etc.).
2. Indirect effects: the new demand for local goods, services and jobs that result from the new activity. Examples include the spending on labor to operate and maintain new power plants, or to train workers in these skills. Some CEPP-related investments lead to payments for things to suppliers located outside the U.S. (e.g., the purchase of power plant components manufactured outside of the state); IMPLAN traces those dollars that do not stay within the U.S. economy when dollars are spent through private investment.
3. Induced effects: the economic impacts of the increased spending of workers resulting from income earned from direct and indirect economic activity.
In this analysis, the inputs to the IMPLAN model include the total dollars invested in the economy, that otherwise would not have been spent on CEPP-eligible energy technologies, supply chain impacts from reductions in the consumption of fossil fuels, and changes in consumer income that flow from the investments.

Economic Impact of a Clean Electricity Payment Program – Analysis Group
PAGE 19
IV. Results and Observations
A. Results Recent analyses have demonstrated the potential economic benefits of clean energy investments, which can generate substantial economic benefits over time through the infusion of public and private dollars as part of stimulus and/or infrastructure packages.30 A CEPP can amplify and accelerate early investment in low-carbon technologies, and sustain and deepen such investments over time through progressively increasing requirements to purchase or generate electricity with low or zero GHG emission power sources. In this report, we evaluate the potential impact of a CEPP on economic activity across the U.S. Based on our analysis and as we describe in this report, policymakers can leverage the $150 billion CEPP allocation in the recent congressional budget resolution to produce nearly $1 trillion in value to the U.S. economy.
A CEPP would be designed to efficiently decarbonize the nation’s power system over (at least) the next decade, reducing power plant GHGs and opening the door to decarbonization of the transportation and building sectors through electrification. These changes over time would also bring large health, environmental and equity benefits. While we recognize these are important objectives, we do not focus on them here. Rather, our analysis evaluates strictly the economic impacts of investments associated with implementation of the CEPP.31 Economic benefits due to a CEPP are separate from, and in addition to, the myriad energy and environmental policy reasons to pursue such a regulatory strategy.
The results of the analysis point to strong economic benefits associated with implementation of a CEPP in the U.S. In short, relative to a BAU scenario, implementation of the CEPP through 2031 would generate the following benefits:
• An increase of 7.7 million jobs by 2031 (in job-years),32 with over 1.7 million jobs (in job-years) in 2030 alone; and
• Over $907 billion dollars in value added to the U.S. economy; and • Increased tax revenues to federal, state and local governments of
over $154 billion.
The economic benefits from a CEPP derive from increased spending in the economy (relative to the BAU case) on technologies required to meet the progressively increasing clean energy purchase requirement, including primarily new on-shore and off-shore wind generation facilities and new grid-
30 See, for example, Hibbard et al, Economic Impact of Stimulus Investment in Advanced Energy for America, June 2021. The authors have also studied impacts at the state level for certain states. See also, Renewable Energy Benefits: Measuring the Economics, IRENA, 2016. 31 While we focus specifically on the economic impacts of CEPP implementation, there are likely significant additional economic impacts that flow from CEPP-driven reductions in GHGs and other pollutants not captured in this analysis, including (for example) reduced health care costs associated with criteria pollutants, and reduced impacts on health and the economy due to global warming. 32 Employment data are presented in “job years,” reflecting the number of total job years, as a combination of number of jobs and number of years per job, created through the CEPP-driven investments. In other words, 10 job-years could mean 10 jobs lasting one year, 1 job lasting ten years, or some other combination of number of jobs and number of years.
Economic Impact of a Clean Electricity Payment Program – Analysis Group
PAGE 20
connected solar and storage installations. There are also both positive and negative impacts associated with the additions, retirements, and changing capacity factors of other technologies – e.g., fossil generating units, biomass facilities, and energy storage – but these are all minor relative to the impacts of adding substantial new investment in solar, storage and wind generating capacity. In short, the primary emission and economic effects of a CEPP would be driven by the extensive level of new investment of capital in zero-emission technologies required to meet the standard, and the ripple effect of these investments throughout the economy as businesses increase capacity and hiring to support the new construction and operation of these resources, and as the monies invested and paid out to new employees stimulate further incremental spending in the economy.
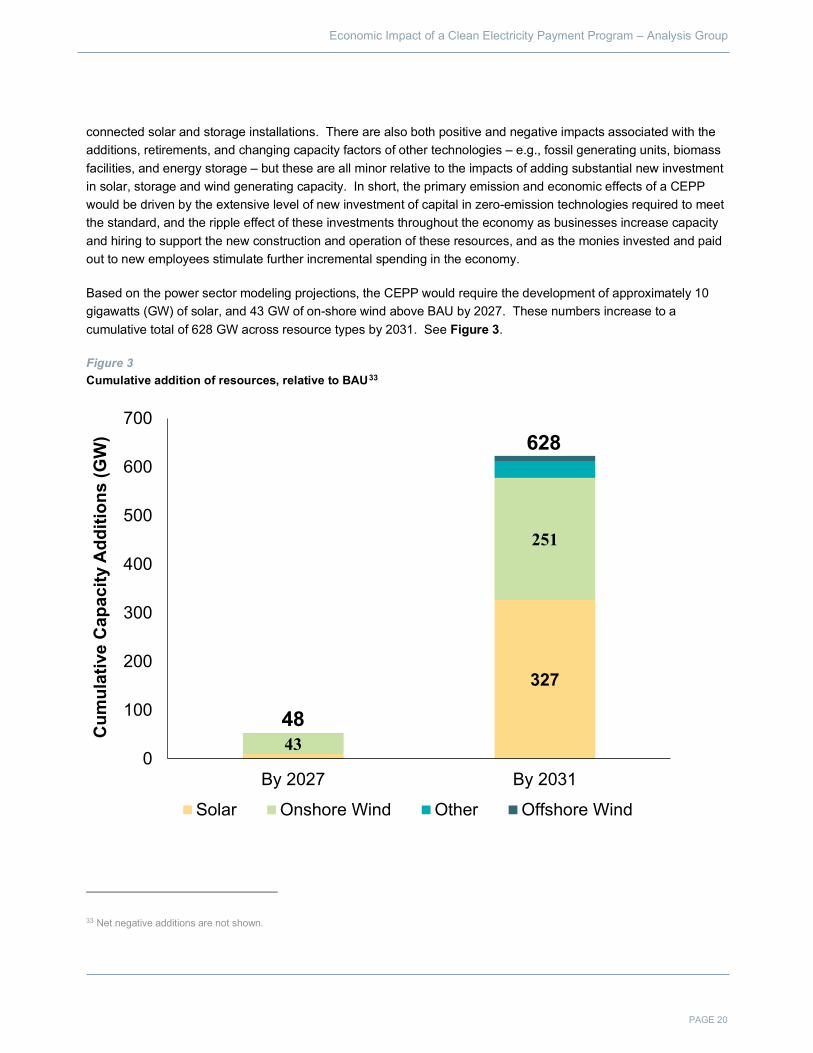
Based on the power sector modeling projections, the CEPP would require the development of approximately 10 gigawatts (GW) of solar, and 43 GW of on-shore wind above BAU by 2027. These numbers increase to a cumulative total of 628 GW across resource types by 2031. See Figure 3.
Figure 3 Cumulative addition of resources, relative to BAU33
33 Net negative additions are not shown.
327
43
251
0
100
200
300
400
500
600
700
By 2027 By 2031
Cum
ulat
ive
Cap
acity
Add
ition
s (G
W)
Solar Onshore Wind Other Offshore Wind
48
628

Economic Impact of a Clean Electricity Payment Program – Analysis Group
PAGE 21
The capital cost projections associated with these investments result in over $60 billion of cumulative capital invested in clean generation technologies by 2027, $569 billion by 2031. The power sector modeling also accounts for the ways in which these clean technology additions change operations at existing fossil resources. The economic modeling in IMPLAN similarly reflects the reductions in economic activity resulting from the reduced use of fossil fuels, changes in decommissioning costs, and changes in the level of CCS investments.
Taken together, these power system shifts lead to a net increase in economic activity and jobs. In addition, IMPLAN estimates the flow of dollars and jobs through the economy that results from indirect and induced activity, which equal $85 billion and 750 thousand jobs (measured in job-years) by 2027, and over $907 billion and over 7.7 million jobs by 2031. See Figures 4 and 5. Finally, on a cumulative basis over the study period, CEPP increases federal and state tax revenues by $154 billion.
Figure 4 Economic value added34
34 Value add is reported in nominal dollars.
$266$56
$557
$85
$823
$0
$100
$200
$300
$400
$500
$600
$700
$800
$900
2022-2027 2028-2031
Valu
e A
dded
($ B
illio
n)
Direct Indirect & Induced

Economic Impact of a Clean Electricity Payment Program – Analysis Group
PAGE 22
Figure 5 Job-years
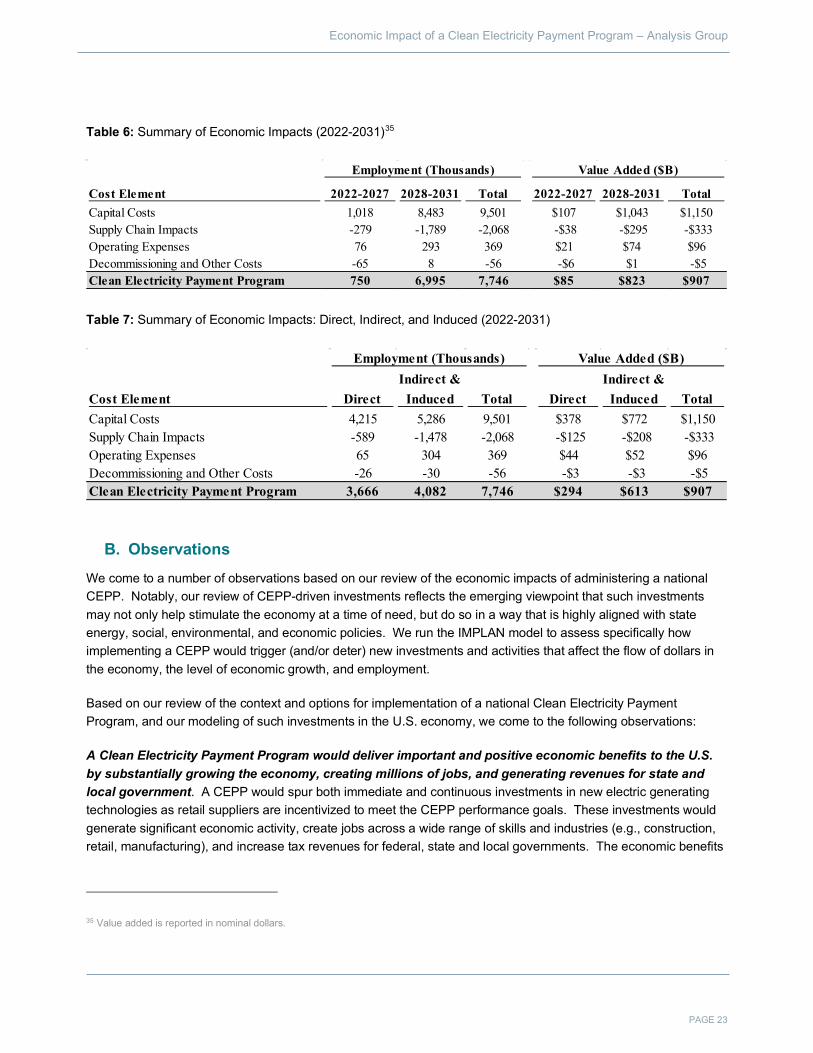
Our analysis forecasts economic impacts under assumptions regarding the potential form and timing of CEPP implementation. The positive economic impacts of the CEPP are nationwide, and flow from the private investment spurred by the demand for compliant clean energy generation from suppliers of electricity that must meet the standards. The distribution of benefits is dictated by the types and manufacturing location of the products and equipment purchased, the types and geographic dispersion of the jobs created through increased economic activity in the sector, and how the additional dollars earned from new investments are spent in the economy. The overall benefits accrue due to these direct impacts of CEPP-driven spending, as well as the additional economic activity induced by the additional flow of dollars in the economy. Tables 6 and 7 summarize the breakdown of economic impacts – positive and negative – under a CEPP.
0.35
3.31
0.40
3.68
0.75
7.00
0.00
1.00
2.00
3.00
4.00
5.00
6.00
7.00
8.00
0
1
2
3
4
5
6
2022-2027 2028-2031
Empl
oym
ent (
Mill
ion
Job-
Year
s)
Direct Indirect & Induced
Economic Impact of a Clean Electricity Payment Program – Analysis Group
PAGE 23
Table 6: Summary of Economic Impacts (2022-2031)35
Table 7: Summary of Economic Impacts: Direct, Indirect, and Induced (2022-2031)
B. Observations We come to a number of observations based on our review of the economic impacts of administering a national CEPP. Notably, our review of CEPP-driven investments reflects the emerging viewpoint that such investments may not only help stimulate the economy at a time of need, but do so in a way that is highly aligned with state energy, social, environmental, and economic policies. We run the IMPLAN model to assess specifically how implementing a CEPP would trigger (and/or deter) new investments and activities that affect the flow of dollars in the economy, the level of economic growth, and employment.
Based on our review of the context and options for implementation of a national Clean Electricity Payment Program, and our modeling of such investments in the U.S. economy, we come to the following observations:
A Clean Electricity Payment Program would deliver important and positive economic benefits to the U.S. by substantially growing the economy, creating millions of jobs, and generating revenues for state and local government. A CEPP would spur both immediate and continuous investments in new electric generating technologies as retail suppliers are incentivized to meet the CEPP performance goals. These investments would generate significant economic activity, create jobs across a wide range of skills and industries (e.g., construction, retail, manufacturing), and increase tax revenues for federal, state and local governments. The economic benefits
35 Value added is reported in nominal dollars.
Cost Element 2022-2027 2028-2031 Total 2022-2027 2028-2031 TotalCapital Costs 1,018 8,483 9,501 $107 $1,043 $1,150Supply Chain Impacts -279 -1,789 -2,068 -$38 -$295 -$333Operating Expenses 76 293 369 $21 $74 $96Decommissioning and Other Costs -65 8 -56 -$6 $1 -$5Clean Electricity Payment Program 750 6,995 7,746 $85 $823 $907
Employment (Thousands) Value Added ($B)
Cost Element DirectIndirect &
Induced Total DirectIndirect &
Induced TotalCapital Costs 4,215 5,286 9,501 $378 $772 $1,150Supply Chain Impacts -589 -1,478 -2,068 -$125 -$208 -$333Operating Expenses 65 304 369 $44 $52 $96Decommissioning and Other Costs -26 -30 -56 -$3 -$3 -$5Clean Electricity Payment Program 3,666 4,082 7,746 $294 $613 $907
Employment (Thousands) Value Added ($B)

Economic Impact of a Clean Electricity Payment Program – Analysis Group
PAGE 24
arise from the direct investment of dollars to build and operate CEPP-eligible resources, and from additional economic activity generated indirectly and induced by the flow of these investment dollars through the economy. Economic value, job creation, and revenue expansion stemming from a CEPP would also serve as a foundation for future economic expansion.
These economic benefits are driven by a major buildout of clean energy resources in all regions of the country, dispersing direct, indirect and induced economic benefits across the country. The CEPP would spur the development of eligible resources widely across the U.S. The program would spur deployment of readily available resources, such as solar, storage, and on-shore wind, while also driving demand for newer, innovative technologies like offshore wind and low- or zero-emissions fuels. Figure 6 provides an overview of additional capacity constructed through 2031. In addition, the total development over the first approximately 10 years of the period would increase total cumulative generation from renewable resources by over 8,500 TWh, relative to BAU. Regional increases in clean electricity generation are shown in Figure 7. The CEPP would increase annual generation from renewables 400% by 2030 compared to 2020 levels, and 150% relative to BAU, with substantial investments made in all regions of the country.36
36 In 2020, renewable resources made up 20% of total U.S net generation from utility-scale generators, or about 800 TWh. See, “Electricity explained: Electricity generation, capacity, and sales in the United States,” EIA, accessed at: https://www.eia.gov/energyexplained/electricity/electricity-in-the-us-generation-capacity-and-sales.php.

Economic Impact of a Clean Electricity Payment Program – Analysis Group
PAGE 25
Figure 6 Cumulative capacity additions (GW) through 2031, net of business-as-usual
19914
34
3146
2838
231346
139

Economic Impact of a Clean Electricity Payment Program – Analysis Group
PAGE 26
Figure 7 Cumulative generation (TWh) changes through 2031, net of business-as-usual
A CEPP would reduce energy and economic supply chain risk and provide an opportunity to create energy sector jobs in every region. Growth in CEPP-compliant technologies will lead to accelerated development of energy sources and technologies that rely primarily on domestic manufacturing and materials industries. This shift would reduce supply chain risks and reliance on concentrated supply sectors and yield economic activity driving energy supply and use across all regions of the country.
Significant renewable resource investments as projected under the CEPP evaluated in this study are aligned with the need to meet vital energy, environmental, and climate policy goals. While this report focuses on the economic impacts of CEPP-driven resource investments, CEPP would also drive significant climate and public health benefits. Virtually every dollar of investment studied in this report increases the production and use of electricity without emissions of GHGs and other pollutants, and builds the electricity system infrastructure needed to continue progress towards the ultimate goal of a net-zero GHG economy. These changes in energy supply would also generate improvements in air quality.37 CEPP investments would also facilitate decarbonization of the nation’s electricity systems at a time when it will need to absorb additional demand from electrification of the
37 See, e.g., Krishnaswami, A. and Murrow, D., “80% Clean Power by 2030: Achievable with Massive Benefits,” NRDC, August 12, 2021, accessed at: https://www.nrdc.org/experts/arjun-krishnaswami/80-clean-power-2030-achievable-massive-benefits and Driscoll, C., et. al., “An 80x30 Clean Electricity Standard: Carbon, Costs, and Health Benefits,” Clean Energy Futures, July 12, 2021, accessed at: https://cleanenergyfutures.syr.edu/wp-content/uploads/2021/07/CEF-80x30-CES-Report_Final_July_15_21.pdf (hereafter “CES Report”). The CES Report found that achieving 80 percent clean electricity by 2030 could result in $100 to $211 billion in climate and public health benefits by 2030, and avoid more than 300,000 premature deaths between now and 2050.
1,645
209
235180
341
1,138
248
909 162203
340
2,891

Economic Impact of a Clean Electricity Payment Program – Analysis Group
PAGE 27
transportation and building sectors, and increasingly the industrial sector. A CEPP program would thus induce private investment in a way that maintains and grows economic productivity and jobs while helping states and the U.S. meet important energy, climate, and public health goals.

Economic Impact of a Clean Electricity Payment Program – Analysis Group
PAGE 28
V. Appendix: CEPP Reference Case Assumptions Assumption Data Source
Electric Demand Annual Energy Outlook (AEO) 2020
Capacity Build Costs - Conventional AEO 2020
Capacity Build Costs - Renewable
National Renewable Energy Laboratory’s 2020 Annual Technology Baseline. Investment Tax Credit and Production Tax Credit assumed per 2015 omnibus (Does not include recent tax extensions in the 2021 omnibus)
Coal Supply/Prices EPA 5.15
Gas Supply/Prices Fuel Supply Curves (AEO 2020 Reference Cast).
Firm capacity additions and retrofits Updated to include market information as of Q2 2020.
Nuclear Retirements
Any nuclear reactors that reach age 40 can receive a subsequent license renewal and operate for 20 more years. One additional 20-year renewal is allowed at age 60 (hence maximum total nuclear lifetime is 80 years).
CCS Cost and Performance EPA v6/AEO 2020 (Up to 90% capture, does not include 100% capture)
CCS Transportation and Storage Curves EPA v6 (Nov 2018 Reference Case)
CCS Incentives Includes 45Q representation