Economic Impact Assessment: Surat Gas Project Impact Assessment: Surat Gas Project Final Report xiii...
140
Economic Impact Assessment: Surat Gas Project Report prepared for: Arrow Energy Pty Ltd and Coffey Environments Australia Pty Ltd Final Report August, 2011
Transcript of Economic Impact Assessment: Surat Gas Project Impact Assessment: Surat Gas Project Final Report xiii...

Economic Impact Assessment: Surat Gas Project
Report prepared for:
Arrow Energy Pty Ltd
and
Coffey Environments Australia Pty Ltd
Final Report August, 2011

Economic Impact Assessment: Surat Gas Project Final Report
i
Document Control Job ID: 15810
Job Name: Economic Impact Assessment: Surat Gas Project
Project Director: Simon Smith
Project Manager: Ashley Page
Company: Arrow Energy Pty Ltd and Coffey Environments Australia Pty Ltd
Job Contact: Christopher Doig (Coffey Environments)
Document Name: Surat Gas Project Economic Impact Assessment Final Report
Last Saved: 19/1/2012 12:01 PM
Version Date Reviewed PM Approved PD
Draft v1.0 8th June, 2011 ARP SS
Draft v1.2 15th July, 2011 ARP ARP
Draft v2.0 29th July, 2011 ARP ARP
Draft v3.0 3rd August, 2011 ARP ARP
Final Report 23rd August, 2011 ARP ARP
Disclaimer:
Whilst all care and diligence have been exercised in the preparation of this report, AEC Group Limited does not warrant the accuracy of the information contained within and accepts no liability for any loss or damage that may be suffered as a result of reliance on this information, whether or not there has been any error, omission or negligence on the part of AEC Group Limited or their employees. Any forecasts or projections used in the analysis can be affected by a number of unforeseen variables, and as such no warranty is given that a particular set of results will in fact be achieved.

Economic Impact Assessment: Surat Gas Project Final Report
ii
Executive Summary Project Background
Arrow Energy Pty Ltd (Arrow) is investigating development of coal seam gas (CSG) reserves in the Surat Basin to meet the growing demand for gas supply, including domestic and potential export markets. Arrow have commissioned this report to examine the likely impacts of the Surat Gas Project on the local and regional economies (where Arrows gas tenements are located), as well as impacts to the Queensland and Australian economies as relevant. Specifically, this report addresses section 4.12 (Economy) of the Environmental Impact Statement (EIS) Terms of Reference for the Arrow Energy Surat Gas Project.
Existing Local Economic Environment
The Darling Downs’ economy has been traditionally based on the agricultural sector and its support services. This traditional economic strength of the region has been in decline over the past decade primarily due to unfavourable climatic conditions and rural downturn, which have adversely impacted on agricultural production. Whilst most farms are used to managing through the variability associated with agricultural production, the prolonged nature of the drought (and more recently floods) has seen many farms in the region record operating losses in recent years, and has resulted in farm business debt levels increasing.
Local supply chains are predominantly based around supporting the traditional agriculture sector and have the capacity and capability to expand and support the growing resources sector.
Examination of the prevailing characteristics of the Darling Downs (the regional economy in which the Surat Gas Project is situated) identifies the region as:
• Recording slower resident population growth than the Queensland average in recent years, but with a fast growing and sizable transient population attracted by significant mining and gas exploration and development activity. Projections suggest population will expand at a similar rate to Queensland over the next 20 years;
• Experiencing strong growth in the mining and resources sector in recent years as a result of significant interest in the Surat Basin, with mining and resources now the second largest contributor to the Darling Downs economy in terms of value added activity;
• Possessing strong local supply chains supporting the traditional agriculture sector, but developing and currently relatively immature local support services for the energy resources sector;
• Currently experiencing a ‘tight’ labour market, with a much lower unemployment rate than Queensland overall. This has led to significant skills shortages, in particular for the energy sector, and a growing fly-in, fly-out (FIFO) and drive-in, drive-out (DIDO) workforce in the region. Unemployment is likely to remain at very low levels in the short term as projects such as the Queensland Curtis LNG Project, Gladstone LNG Project and Australia Pacific LNG Project (all of which propose to develop gas fields in the Surat Basin) ramp up;
• Showing signs of a tightening property market, in particular in the Western Downs Regional Council area, driven largely by increased demand for accommodation from mining and gas companies and their employees. The Darling Downs’ property market has also attracted some speculative property buyers seeking future rental yields as a result of anticipated growth in demand as resource projects come on line; and
• Currently experiencing some transport and telecommunications infrastructure constraints. Where these constraints are not addressed, it will likely impact on the capacity of the Darling Downs to support the significant latent economic development opportunities available within the regional economy.

Economic Impact Assessment: Surat Gas Project Final Report
iii
Economic Impacts of the Surat Gas Project
The economic impact assessment identifies that the Surat Gas Project will generate significant economic benefits for the regional (Darling Downs), state and national economies. Potential beneficial impacts arising from the Surat Gas Project include:
• Significant increases in industry output, GRP, employment and incomes in the Darling Downs and Queensland over the project life through both direct and indirect impacts;
• Opportunities for local business to secure new contracts and increase sales to supply and service the needs of both the project and the workforce;
• Increased population (through attraction of labour to the Darling Downs) and business activity will provide additional demand for local household and business services and likely increase service levels over time;
• A permanent lift in the local skills base through implementation of skills development and training strategies as part of the Surat Gas Project;
• Households will be beneficially effected by the project, through increased job and income earning opportunities;
• The Surat Gas Project will provide a lift in local, Queensland and Australian Government taxation revenues through a variety of taxes and duties; and
• Support for the Australian dollar through production of high value gas for export as LNG, resulting in lower comparative prices for foreign goods and services.
While project benefits are overwhelmingly positive, the Surat Gas Project will also likely result in some adverse impacts on the regional, state and national economies. Key adverse impacts arising from the Surat Gas Project are outlined in Table ES.1, including assessment of the anticipated level of impact associated.
Cost Benefit Analysis of the Surat Gas Project, examining both beneficial and adverse economic impacts associated with the project, identifies the Surat Gas Project provides a
highly positive Net Present Value (NPV) of $1.66 billion at a 15% discount rate. Sensitivity analysis highlights the project provides a positive Net Present Value across all
discount rates examined (6%, 10%, 15% and 20%), and there is less than a 5% probability the project will deliver a NPV of less than $405.1 million or more than $2.9
billion at a discount rate of 15%.
The benefits generated by the project significantly outweigh the costs and is identified to be economically desirable for Queensland.

Economic Impact Assessment: Surat Gas Project Final Report
iv
Table ES.1. Assessment of Adverse Impacts of the Surat Gas Project. Before and After Mitigation
Impact Initial Impact Rating
Relevant Mitigation Measures Residual Impact Rating
Impacts on Business: The Surat Gas Project is likely to adversely impact on some businesses and industry in the Darling Downs and the rest of Queensland as a result of: • Competition for and draw of labour to the Surat Gas Project and its supply chain. This
has the potential to exacerbate skills shortages in the region and Queensland (for both construction and energy related skills) and place upward pressure on labour prices;
• Escalating costs of labour and other inputs to production, which could reduce business profits and viability for some businesses/ industries, particularly for local business already operating at, or near, “the margin”; and
• Support for the Australian dollar as a result of the high level of gas exports (in the form of LNG) generated by the project can adversely impact on those sectors that are “trade exposed”, such as agriculture, manufacturing and tourism, if it results in these products and services becoming more expensive to foreign buyers.
High
• Support strategies aimed at addressing skills shortages in the construction and CSG industries, as well as those that assist local business back-fill positions vacated through labour draw.
• Provide opportunity to local business to secure supply contracts, including: o Informing local business of the goods and services required of the
project; o Developing and implementing a Local Content Strategy; and o Examining options for establishing a local cooperative service or
network/ alliances to connect local business and enable collaboration in meeting service supply requirements of the CSG industry (should be led by local councils).
Medium
Impacts on Agricultural Production: The Surat Gas Project may impact upon up to approximately 1.5% to 3.0% of total land area within the Surat Gas Project’s well footprint. Arrow has committed to working with landholders to minimise the disturbance of good quality agricultural land (GQAL) or strategic cropping land and has developed policies and procedures highlighting an intent to place gas wells and infrastructure in areas that avoid or minimise impacts on high quality agricultural land to the extent practical and possible. Where this cannot be delivered, it is almost certain this will result in some diminished productive capacity in the areas impacted during the project’s life, however Arrow is required to compensate landholders for any impacts on productivity. The scale of impacts on agricultural productivity will vary across the development area according to specific local characteristics, but will be temporary in nature, as it is expected that all land impacted by gas wells and associated pipeline and other infrastructure will be able to be completely rehabilitated to a pre-development standard following gas well closure.
Medium
• Where proponent owned land is available and suitable, consider leasing to farmers to continue agricultural production of that land.
• Engage with affected landholders to identify potential disruptions to existing management practices for each property likely to be impacted.
• Configure well development to minimise impacts on prime agricultural land to the extent practical.
• Negotiate and provide appropriate compensation for landholders. • Ensure all disturbed land is rehabilitated as appropriate. Medium
Impacts on Housing Prices and Availability of Affordable Housing: Residential property impacts from the Surat Gas Project are expected to be minor in consideration of the use of worker camps to accommodate imported construction labour, the relatively small number of operational employees migrating to the region, long lead time to peak workforce and dispersed nature of the project. Even so, it is possible the project could contribute to some degree to an increase in demand (and thereby place additional upward pressure on housing prices which have escalated considerably in the past five years), through permanent migration of workers to the region for either direct or flow-on employment opportunities.
Low
• Ensure construction worker camps are developed prior to commencement of construction activity on the gas fields.
• Accommodate construction workers required for the development of worker camps on site where possible.
• Ongoing dialogue with construction industry bodies, State Government and local Council regarding timing and scale of anticipated worker accommodation requirements.
• Monitor the availability of residential property and median house prices to accommodate operational workers migrating to the region,
• State Government and local Councils monitor the need for the implementation of affordable housing schemes in affected regions.
Low

Economic Impact Assessment: Surat Gas Project Final Report
v
Impact Initial Impact Rating
Relevant Mitigation Measures Residual Impact Rating
Impacts on Industrial/ Commercial Land Prices: The Surat Gas Project has the potential to increase demand for industrial/ commercial land as a result of flow-on supply chain and support service development. The Darling Downs is currently underserviced in terms of industrial land that is ready for development, with industrial land prices having doubled in some areas in the past two years. This price growth will likely be exacerbated to some degree by the Surat Gas Project.
Medium
• Inform relevant Council and State Government departments of goods and services needs of the Surat Gas Project to allow appropriate planning and release of required industrial and commercial land.
• State Government and local Councils should assess the suitability of current planning arrangements to handle a likely increase in demand for industrial and commercial developments, and position themselves to reduce response times to planning applications.
Low
Impacts on Rural Property Values: The potential for reduced productive capacity in some landholdings (see “Impacts on Agriculture Production” above) may result in a decline in the value of these properties. Agricultural land values in the Darling Downs have softened in recent years, primarily driven by factors such as rural downturn and drought. Uncertainty regarding impacts on agricultural production from the resources sector and potential compensation may also have been a contributing factor. The impact of the resources sector on rural property values is very difficult to isolate, but is likely to be insignificant relative to factors such as rural downturn and drought.
Low
• As per “Impacts on Agricultural Production” above.
Negligible
Impacts on Local Infrastructure and Service Capacity: Infrastructure constraints are already being experienced in the region, in particular road and rail transport infrastructure and telecommunications infrastructure. The Surat Gas Project is expected to place additional demand on this infrastructure, which will likely contribute to capacity issues and require infrastructure upgrades and maintenance, in particular for road and air infrastructure. Medium
• Inform local councils of anticipated increases in demands on roads and other transport infrastructure due to the project, and identify appropriate contributions for upgrades and maintenance.
• Identify and communicate anticipated population growth and associated infrastructure requirements and impacts as early as possible to relevant government authorities.
• Relevant government authorities to investigate and develop anticipated cost estimates to provide social and economic infrastructure required to meet demand generated by the Surat Gas Project, and identify appropriate cost recovery strategies for developing this infrastructure.
Low
Source: AECgroup.

Economic Impact Assessment: Surat Gas Project Final Report
vi
Cumulative Impacts
Cumulative impacts on the Darling Downs economy from a large number of major infrastructure and industry projects being developed were assessed. Projects included for consideration in the cumulative impact assessment were as follows:
• Surat Gas Project; • Queensland Curtis LNG Project; • Gladstone LNG Project; • Arrow Surat Pipeline Project; • Australia Pacific LNG Project; • Cameby Downs Expansion Project; • Carbon Energy Blue Gum Energy Park Project; • CS Energy – Kogan Creek Solar Boost Project; • Elimatta Coal Project; • Emu Swamp Dam Project; • Felton Coal Mine and Coal to Liquid Project; • Hunter Gas Pipeline Project; • Linc Energy Underground Coal Gasification Project; • Nathan Dam and Nathan Pipeline; • New Acland Coal Mine Stage 3 Expansion Project; • Spring Gully Power Station; • Surat Basin Rail; and • Wandoan Coal Project.
Other LNG projects that have been proposed in Gladstone which are anticipated to source gas from either the Surat Basin or the Bowen Basin have also been considered in the cumulative impact assessment (e.g., the Arrow LNG Plant).
The cumulative impact assessment focuses on the potential for impacts identified in Table ES.1 to be exacerbated by the concurrent development of a range of projects in the region. In undertaking the analysis, it has been assumed that all projects identified above proceed in accordance with timelines outlined in existing information in the public domain. This is considered a cautious scenario (i.e. an extreme scenario that is unlikely to be realised) as it is highly unlikely that all projects proposed will proceed to development, or that all proposed timelines will be achieved. As such, it is highly likely that impact ratings assessed in this cumulative impact assessment are overstated.
The cumulative impacts of all projects outlined above proceeding are outlined in Table ES.2.
Table ES.2. Assessment of Adverse Cumulative Impacts
Impact Description Impact Rating
Impacts on Business: Concurrent development of a number of major projects in the Darling Downs will almost certainly result in considerable additional demand and competition for labour and other inputs to supply these projects. Competition for labour will place upward pressure on input prices, and can result in “crowding out” of some businesses and industries.
Very High
Impacts on Agricultural Production: Many of the developments considered in the cumulative impact assessment are likely to either temporarily or permanently impact on agricultural production through disruption or take-up of land. Of most significance will be projects that result in the permanent degradation or removal of productive agricultural land (e.g., mining, dam). The development of all of these projects will almost certainly exacerbate adverse impacts on agricultural production in the region. The cumulative impact on agricultural production, though likely to be small in absolute value terms, is assessed as moderate.
High
Impact on Housing Prices and Availability of Affordable Housing: The overlapping development of a number of major industrial projects is likely to increase the peak demand for housing in the region, even in consideration of construction camps to be used, placing upward pressure on prices. Even with appropriate accommodation planning, issues of housing affordability are likely to be of moderate consequence in the short to medium term in the Darling Downs if a significant number of major projects are developed at the same time, in particular in the townships near major developments.
Medium

Economic Impact Assessment: Surat Gas Project Final Report
vii
Impact Description Impact Rating
Impacts on Industrial/ Commercial Land Prices: Development of a number of major industrial and resource projects in the Darling Downs will likely increase demand for industrial/ commercial property (placing upward pressure on prices) as a result of supply chain development. Availability of appropriately zoned and developable industrial and commercial lands is an existing issue in the region, and the likely increase in demand is assessed as having a moderate impact on prices.
Medium
Impacts on Rural Property Values: It is possible that rural property values could be impacted by disruption of agricultural lands as a result of gas and coal resource developments and infrastructure projects in the region. Agricultural land values have softened in recent years in response to a number of factors, most notably rural downturn and drought. Consultation with real estate agents suggests uncertainty regarding compensation and the level of impacts of resource development projects on management practices may also be contributing. The concurrent development of a number of resource, industrial and infrastructure projects has the potential to result in a minor impact on rural property values as a result of disruption of agricultural production.
Low
Impacts on Local Infrastructure and Service Capacity: Some infrastructure in the Darling Downs is currently experiencing capacity constraints – in particular road, rail, air and telecommunications infrastructure, and this has been identified in regional planning as a key issue to be addressed. The concurrent development of multiple resource and industrial projects will almost certainly result in demand exceeding capacity for some infrastructure. The consequence of cumulative impacts on infrastructure and service capacity is assessed as moderate in consideration of existing planning in the region identifying the need for infrastructure upgrades.
High
Source: AECgroup.
Mitigating the cumulative impacts of multiple projects being developed requires significant coordination of activities across project proponents, local, state and national governments, relevant economic and industry organisations, local business and the local community.

Economic Impact Assessment: Surat Gas Project Final Report
viii
Glossary & Abbreviations Abbreviations
Abbreviation Meaning
$2009 / 10 Monetary values given in 2009 / 10 Australian dollars
$M Monetary values given in million dollars
ABARE Australian Bureau of Agricultural and Resource Economics
ABARES Australian Bureau of Agricultural and Resource Economics and Science
ABS Australian Bureau of Statistics
ANZSCO Australian and New Zealand Standard Classification of Occupations
ANZSIC Australian and New Zealand Standard Industry Classifications
APLNG Australia Pacific LNG Project
AUD Australian dollars
bbl Barrels of oil
CBA Cost Benefit Analysis
CGE Computable General Equilibrium
CGPF Central Gas Processing Facility
CPI Consumer Price Index
CSG Coal seam gas
CSQ Construction Skills Queensland
DEEDI Queensland Government Department of Employment, Economic Development and Innovation
DEEWR Australian Government Department of Education, Employment and Workplace Relations
DERM Queensland Government Department of Environment and Resource Management
DETA Queensland Government Department of Education and Training
DHLGP (now DLGP) Queensland Government Department of Housing, Local Government and Planning (now DLGP)
DIP (now part of DEEDI) Queensland Government Department of Infrastructure and Planning (now part of DEEDI)
DLGP Queensland Government Department of Local Government and Planning
DPI (now DPIF) Queensland Government Department of Primary Industries (now DPIF)
DPIF Queensland Government Department of Primary Industries and Fisheries
DTRDI Queensland Government Department of Tourism, Regional Development and Industry
EIA United States Energy Information Administration
EIS Environmental Impact Statement
EP Act Environment Protection Act 1994 (Qld) EPBC Act Environment Protection and Biodiversity Conservation Act 1999 (Cwlth) EPC Engineering, procurement and construction
ESQ Energy Skills Queensland
FIFO (and/ or DIDO) Fly-in, fly-out workers (or drive-in, drive-out)
FTE Full time equivalent employment position
GDP Gross Domestic Product
GJ Gigajoules
GLNG Gladstone LNG Project
GQAL Good quality agricultural land
GRP Gross Regional Product
GSP Gross State Product
GST Goods and services tax
GVA Gross value add
ha Hectare
HEIRG Heavy Engineering Industry Reference Group
ICN Industry Capability Network
ICT Information and telecommunications technology
IPF Integrated Processing Facility
km Kilometre

Economic Impact Assessment: Surat Gas Project Final Report
ix
Abbreviation Meaning
LGA Local Government Area
LNG Liquefied Natural Gas
m Metres
m2 Square metres
m3 Cubic metres
MMBTU Million British Thermal Units
Mt Million tonnes
Mtpa Million tonnes per annum
OECD Organisation for Economic Co-Operation and Development
PJ Petajoules
PPP Productivity Places Program
QCLNG Queensland Curtis LNG Project
QGC Queensland Gas Company
QLD or Qld Queensland
QR Queensland Rail
QRAA Queensland Rural Adjustment Authority
QRC Queensland Resources Council
REIQ Real Estate Institute of Queensland
RTA Queensland Residential Tenancies Authority
RTO Registered Training Organisation
SD Statistical Division
t Tonne
TAF Temporary accommodation facility
TJ Terajoules
ToR Terms of Reference
US$ or USD United States dollars
Glossary of Terms
Term Meaning
2P Gas reserves with a 50% probability of being recovered. This is the traditional measure of assessing marketable quantities of gas when making investment decisions
3P Gas reserves with a 10% probability of being recovered. This is a measure of the known quantities of gas that might be economically recovered; i.e. are also commercial
Back-filling Refers to filling employment positions that are vacated as a result of a draw of labour from one sector to another.
Baseline (without project) scenario
Refers to the base scenario used in this report to compare and examine the impacts of the Surat Gas Project on the local, State and national economies. This scenario includes the committed projects of the Gladstone LNG Project and Queensland Curtis LNG Project.
Building Price Index An indicator of the variation in building costs over time including the costs of labour and building materials inputs.
Computable General Equilibrium modelling
An economic modelling technique that estimates the net increase in demand generated by the project after taking into account resource constraints.
Consumer Price Index The Consumer Price Index is an indicator that is constructed to measure changes over time in the general level of prices of consumer goods and services that households acquire, use or pay for consumption.
Direct economic impacts Refers to impacts associated directly with an increase in expenditure within an economy.
Draw down on labour Refers to a transfer of labour from one sector (sector a) of the economy to another (sector b) as a result of increased demand and wage improvements in sector b.
EIS Study Area The EIS Study Area refers to the Gladstone Local Government Area and represents the region in which the project is located and expected to have the greatest direct impact.
Environmental impact statement (EIS)
The information document prepared by the proponent when undertaking an environmental impact assessment. It is prepared in accordance with terms of reference prepared or approved by government. EIS is the term used by the Environment Protection and Biodiversity Conservation Act 1999 and the Environmental Protection Act 1994, and it is defined in Part 4 of the State Development and Public Works Organisation Act 1971.

Economic Impact Assessment: Surat Gas Project Final Report
x
Term Meaning
Exchange rate Rate at which one currency may be converted into another.
Factor incomes Comprises compensation of employees by, and operating surplus of, producers.
Factors of production Represent the factors used during production activities that are not consumed during the process. Includes land, labour, capital and entrepreneurship.
Flow-on / indirect economic impacts
Flow-on (or indirect) economic impacts refer to impacts throughout an economy induced by a direct increase in expenditure.
Full time equivalent employment position
Represents one employee working full time for a period of one year.
Gross Domestic / State / Regional Product
Represents the market value of all final goods and services produced within the Australian / State / regional economy during a given period of time.
Gross operating surplus Represents the excess of gross output over the sum of intermediate consumption, compensation of employees and taxes less subsidies on production and imports.
Gross value added Measurement of the contribution to the economy of each individual producer, industry or sector based on the net activity at each stage of production. Gross value added only measures the additional value added at each stage of production, and as such is considered a true measure of economic activity.
Indicators Anything that is used to measure the condition of something of interest. Indicators are often used as variables in the modelling of changes in complex environmental systems.
Industry output Measurement of the contribution to the economy of each producer, industry or sector based on the gross sales throughout the whole economy. As a gross measurement, industry output includes the purchases of goods and services consumed in the production process, and as such “double counts” the contribution of these goods and services.
Labour force The labour supply available for the production of economic goods and services in a given period. Labour force is the most widely used measure of the economically active population.
Local Government Area A geographical area under the responsibility of an incorporated local government Council
Offsetting Anything that balances, counteracts, or compensates for something else; providing compensation. For example carbon offsetting is the process of reducing greenhouse gas emissions by purchasing credits from others through emissions reductions projects, or carbon trading schemes.
Place of work The geographic area in which a person’s job is located.
Place of usual residence The geographic area in which a person’s permanent address is located.
Real wage impact Measurement of the change in wages and salaries as a result of a project over and above impacts on inflation.
Skills shortage An economic condition in which there are insufficient qualified candidates (employees) to fill available positions.
Stakeholder A person or organisation with an interest or stake in a project.
Steady state operations Refers to a state in which operational activity does not change substantially over time.
Tight market A ‘tight’ market refers to a market that is experiencing considerable shortages in supply, leading to upward pressure on prices.
Value chain / supply chain Refers to the chain of interlinked value-adding processes and activities that convert inputs into outputs.

Economic Impact Assessment: Surat Gas Project Final Report
xi
PAGE LEFT INTENTIONALLY BLANK

Economic Impact Assessment: Surat Gas Project Final Report
xii
Table of Contents DOCUMENT CONTROL .......................................................................................... I EXECUTIVE SUMMARY ........................................................................................ II GLOSSARY & ABBREVIATIONS ....................................................................... VIII TABLE OF CONTENTS........................................................................................ XII LIST OF FIGURES ............................................................................................ XIV LIST OF TABLES ................................................................................................ XV 1. INTRODUCTION .......................................................................................... 1 1.1 BACKGROUND .................................................................................................. 1 1.2 LEGISLATIVE AND POLICY CONTEXT ......................................................................... 1
1.2.1 RELEVANT AUSTRALIAN GOVERNMENT LEGISLATION ............................................ 1 1.2.2 RELEVANT QUEENSLAND GOVERNMENT LEGISLATION ........................................... 2 1.2.3 RELEVANT AUSTRALIAN, QUEENSLAND AND LOCAL GOVERNMENT POLICIES .................. 2
1.3 PURPOSE OF THE REPORT ..................................................................................... 2 2. METHODOLOGY ........................................................................................... 3 2.1 TERMS OF REFERENCE ........................................................................................ 3 2.2 PROJECT SCOPE ............................................................................................... 3 2.3 METHOD OF ASSESSMENT .................................................................................... 3
2.3.1 EXISTING ECONOMIC ENVIRONMENT .............................................................. 3 2.3.2 ECONOMIC IMPACT ASSESSMENT .................................................................. 4 2.3.3 DEVELOPMENT OF MITIGATION AND ENHANCEMENT MEASURES ................................ 5 2.3.4 CUMULATIVE IMPACT ASSESSMENT ................................................................ 5
3. PROJECT OVERVIEW AND DESCRIPTION .................................................. 11 3.1 PROJECT OVERVIEW ......................................................................................... 11 3.2 PROJECT COSTS AND REVENUE ASSUMPTIONS ........................................................... 11 3.3 WORKFORCE ................................................................................................. 13 3.4 STUDY AREA ................................................................................................. 17 4. EXISTING ECONOMIC ENVIRONMENT ....................................................... 19 4.1 SUMMARY OF EXISTING ENVIRONMENT .................................................................... 19 4.2 ECONOMIC BASE AND ACTIVITY ............................................................................ 20
4.2.1 POPULATION SIZE AND PROJECTED GROWTH .................................................. 20 4.2.2 GROWTH IN AND INDUSTRY CONTRIBUTION TO GROSS REGIONAL PRODUCT ............... 21 4.2.3 LABOUR MARKET CHARACTERISTICS ............................................................ 23 4.2.4 RESIDENTIAL PROPERTY MARKET CHARACTERISTICS .......................................... 32 4.2.5 NON-RESIDENTIAL PROPERTY MARKET CHARACTERISTICS ................................... 35
4.3 CURRENT ECONOMIC TRENDS INFLUENCING THE REGION ............................................... 37 4.3.1 CLIMATIC CONDITIONS AND RURAL DOWNTURN ............................................... 37 4.3.2 GAS EXPLORATION AND APPROVAL OF GAS FIELD DEVELOPMENT FOR LNG PRODUCTION 37 4.3.3 KEY CHALLENGES FACING THE DARLING DOWNS .............................................. 40
4.4 FUTURE ECONOMIC OPPORTUNITIES ....................................................................... 42 4.4.1 AGRICULTURE AND FOOD PROCESSING ......................................................... 42 4.4.2 ENERGY RESOURCES .............................................................................. 43 4.4.3 METAL PRODUCT MANUFACTURING AND EMERGING INDUSTRIES ............................ 43 4.4.4 EDUCATION AND TRAINING ....................................................................... 44 4.4.5 TOURISM ........................................................................................... 44
5. ECONOMIC IMPACT ASSESSMENT ............................................................. 45 5.1 IMPACTS ON INDUSTY OUTPUT AND GROSS PRODUCT ................................................... 45
5.1.1 IMPACTS ON GROSS DOMESTIC, STATE AND REGIONAL PRODUCT ........................... 46 5.1.2 IMPACTS ON INDUSTRY OUTPUT ................................................................. 47
5.2 IMPACTS ON EMPLOYMENT .................................................................................. 48 5.2.1 EMPLOYMENT GENERATION ....................................................................... 48 5.2.2 SKILLS REQUIREMENTS AND POTENTIAL IMPACTS ON SKILLS SHORTAGES ................. 50

Economic Impact Assessment: Surat Gas Project Final Report
xiii
5.3 IMPACTS OF THE PROJECT ON PROPERTY VALUES ........................................................ 52 5.3.1 IMPACTS ON INDUSTRIAL/ COMMERCIAL PROPERTY VALUES .................................. 53 5.3.2 IMPACTS ON RESIDENTIAL PROPERTY VALUES FROM INCREASED POPULATION ............. 53 5.3.3 IMPACTS ON PROPERTY VALUES FROM DISTURBANCE OF LAND ............................... 54
5.4 SIGNIFICANCE OF THE PROJECT ON LOCAL AND REGIONAL ECONOMIES ............................... 55 5.5 DIRECT INVESTMENT OPPORTUNITIES ..................................................................... 56 5.6 DISTRIBUTIONAL IMPACTS .................................................................................. 56
5.6.1 IMPACTS ON BUSINESS AND INDUSTRY ......................................................... 56 5.6.2 IMPACTS TO HOUSEHOLDS ....................................................................... 58 5.6.3 IMPACTS ON LOCAL, STATE AND COMMONWEALTH GOVERNMENT TAXES AND REVENUES . 61
5.7 COSTS TO GOVERNMENT OF ADDITIONAL INFRASTRUCTURE PROVISION .............................. 62 5.8 IMPLICATIONS FOR FUTURE DEVELOPMENT IN THE REGION ............................................. 63
5.8.1 USE OF LAND ...................................................................................... 63 5.8.2 OTHER IMPACTS ................................................................................... 64
5.9 VALUE OF LOST/ GAINED ECONOMIC OPPORTUNITIES .................................................. 64 5.10 ECONOMIC IMPACTS OF MAJOR HAZARDS ................................................................ 65 5.11 ENERGY SELF SUFFICIENCY AND SECURITY ............................................................... 65 5.12 IMPACTS ON BALANCE OF PAYMENTS ...................................................................... 65 5.13 COST BENEFIT ANALYSIS ................................................................................... 66 5.14 SUMMARY OF IMPACTS ...................................................................................... 66 6. MITIGATION AND ENHANCEMENT MEASURES FOR KEY IMPACTS ............. 69 6.1 KEY ISSUES/ IMPACTS TO BE ADDRESSED ................................................................ 69 6.2 MITIGATION STRATEGIES ................................................................................... 70
6.2.1 MITIGATION STRATEGY 1: ADDRESS SKILLS SHORTAGES .................................... 70 6.2.2 MITIGATION STRATEGY 2: SUPPORT LOCAL BUSINESS SECURE SUPPLY CONTRACTS ..... 71 6.2.3 MITIGATION STRATEGY 3: MINIMISE IMPACTS ON AGRICULTURAL PRODUCTION .......... 72 6.2.4 MITIGATION STRATEGY 4: MINIMISE IMPACTS ON LOCAL PROPERTY MARKETS ............ 73 6.2.5 MITIGATION STRATEGY 5: SUPPORT INFRASTRUCTURE DEVELOPMENT IN THE REGION ... 73 6.2.6 MITIGATION STRATEGY 6: MINIMISE ARROW’S CONTRIBUTION TO CUMULATIVE EFFECTS OF
OVERLAPPING TIMEFRAMES ...................................................................... 74 6.3 RESIDUAL IMPACT ASSESSMENT ........................................................................... 75 7. CUMULATIVE IMPACT ASSESSMENT .......................................................... 77 7.1 CUMULATIVE IMPACT ASSESSMENT FRAMEWORK ......................................................... 77 7.2 POTENTIAL CUMULATIVE IMPACTS ......................................................................... 77 7.3 ASSESSMENT OF POTENTIAL ADVERSE CUMULATIVE IMPACTS .......................................... 78
7.3.1 IMPACTS ON BUSINESS ........................................................................... 78 7.3.2 IMPACTS ON AGRICULTURAL PRODUCTION FROM LAND DISRUPTION AND COMPETITION FOR
LAND ................................................................................................ 79 7.3.3 IMPACTS ON HOUSING PRICES AND AVAILABILITY OF AFFORDABLE HOUSING .............. 80 7.3.4 IMPACTS ON INDUSTRIAL/ COMMERCIAL LAND PRICES ........................................ 81 7.3.5 IMPACTS ON RURAL PROPERTY VALUES FROM LAND DISRUPTION ............................ 81 7.3.6 IMPACTS ON LOCAL INFRASTRUCTURE AND SERVICE CAPACITY .............................. 82
7.4 SUMMARY OF CUMULATIVE IMPACTS ....................................................................... 82 8. CONCLUSION ............................................................................................ 85 REFERENCES ..................................................................................................... 87 APPENDIX A: LITERATURE REVIEW .................................................................. 91 APPENDIX B: SUMMARY OF STAKEHOLDER CONSULTATION ........................... 103 APPENDIX C: COMPUTABLE GENERAL EQUILIBRIUM METHODOLOGY ............. 105 APPENDIX D: COST BENEFIT ANALYSIS METHODOLOGY ................................. 107 APPENDIX E: RISK ASSESSMENT FRAMEWORK ............................................... 111 APPENDIX F: MAP OF EIS STUDY AREA ........................................................... 113 APPENDIX G: CENSUS TABLES ........................................................................ 115 APPENDIX H: COST BENEFIT ANALYSIS RESULTS ........................................... 117

Economic Impact Assessment: Surat Gas Project Final Report
xiv
List of Figures FIGURE 3.1. INDICATIVE CONSTRUCTION EXPENDITURE PROFILE .............................................. 12FIGURE 3.2. SURAT GAS PROJECT OPERATIONAL WORKFORCE IN THE DARLING DOWNS SD .............. 13FIGURE 3.3. MAP OF THE SURAT GAS PROJECT STUDY AREA ................................................... 17FIGURE 4.1. PERCENT CHANGE IN GROSS VALUE ADD BY INDUSTRY, DARLING DOWNS, 2006-07 TO
2009-10 .............................................................................................. 23FIGURE 4.2. EMPLOYED PERSONS AND UNEMPLOYMENT RATE, DARLING DOWNS ............................ 24FIGURE 4.3. DARLING DOWNS AND QUEENSLAND UNEMPLOYMENT RATES .................................... 25FIGURE 4.4. DARLING DOWNS AND SUB-REGIONS UNEMPLOYMENT RATES .................................. 26FIGURE 4.5. EMPLOYMENT BY INDUSTRY (FTE), DARLING DOWNS AND SUB-REGIONS, 2009-10 ....... 28FIGURE 4.6. EMPLOYMENT BY OCCUPATION (FTE), DARLING DOWNS AND SUB-REGIONS, 2009-10 ... 29FIGURE 4.7. RESIDENTIAL BUILDING APPROVALS AND VALUE, DARLING DOWNS ............................ 32FIGURE 4.8. NON-RESIDENTIAL BUILDING APPROVAL VALUE, DARLING DOWNS ............................ 36FIGURE 5.1. IMPACT OF THE SURAT GAS PROJECT ON GRP/ GSP/ GDP IN DARLING DOWNS,
QUEENSLAND AND AUSTRALIA, DEVIATION FROM THE BASELINE (WITHOUT PROJECT) SCENARIO ............................................................................................. 46
FIGURE 5.2. IMPACT OF THE SURAT GAS PROJECT ON EMPLOYMENT IN THE DARLING DOWNS AND QUEENSLAND, DEVIATION FROM THE BASELINE (WITHOUT PROJECT) SCENARIO ............. 49
FIGURE 5.3. ANNUAL PERCENT CHANGE IN REAL WAGES RESULTING FROM THE SURAT GAS PROJECT, YEAR ENDED JUNE 2014 TO YEAR ENDED JUNE 2028 ................................................. 52
FIGURE 5.4. IMPACT OF THE SURAT GAS PROJECT ON HOUSEHOLD INCOMES IN THE DARLING DOWNS, QUEENSLAND AND AUSTRALIA, DEVIATION FROM THE BASELINE (WITHOUT PROJECT) SCENARIO ............................................................................................. 60

Economic Impact Assessment: Surat Gas Project Final Report
xv
List of Tables TABLE 2.1. FINAL EIS TERMS OF REFERENCE – ECONOMIC IMPACT ASSESSMENT ............................. 3TABLE 2.2. SIGNIFICANT PROJECTS IN OR NEAR THE DARLING DOWNS, 2011 ................................ 7TABLE 3.1. ASSUMED DISTRIBUTION OF CONSTRUCTION EXPENDITURE ....................................... 12TABLE 3.2. COAL SEAM GAS FIELD STAFF ........................................................................ 14TABLE 3.3. CONSTRUCTION WORKFORCE DETAILS .............................................................. 15TABLE 3.4. OPERATION WORKFORCE DETAILS ................................................................... 16TABLE 4.1. HISTORIC AND PROJECTED POPULATION, 2006 TO 2030 ........................................ 21TABLE 4.2. INDICATIVE ESTIMATES OF GROSS REGIONAL PRODUCT, DARLING DOWNS AND SUB-REGIONS,
2006-07 TO 2009-10 ............................................................................. 21TABLE 4.3. INDUSTRY CONTRIBUTION TO GROSS VALUE ADD, DARLING DOWNS COMPARED TO
QUEENSLAND, 2009-10 ............................................................................ 22TABLE 4.4. LABOUR MARKET CHARACTERISTICS, DARLING DOWNS AND QUEENSLAND, SEPTEMBER
QUARTER 2010 ....................................................................................... 24TABLE 4.5. INDICATIVE FTE EMPLOYMENT BY INDUSTRY DISTRIBUTION (BY PLACE OF WORK), DARLING
DOWNS AND QUEENSLAND, 2009-10 ............................................................. 27TABLE 4.6. INDICATIVE FTE EMPLOYMENT BY OCCUPATION DISTRIBUTION (BY PLACE OF WORK), DARLING
DOWNS AND QUEENSLAND, 2009-10 ............................................................. 29TABLE 4.7. ESTIMATED AVERAGE INDIVIDUAL WEEKLY INCOME BY INDUSTRY, DARLING DOWNS AND SUB-
REGIONS, 2010 ...................................................................................... 31TABLE 4.8. RESIDENTIAL BUILDING APPROVALS AND VALUES, DARLING DOWNS AND SUB-REGIONS, 2006
TO 2010 ............................................................................................... 33TABLE 4.9. PROPERTY SALES AND VALUES, DARLING DOWNS AND SUB-REGIONS COMPARED TO
BENCHMARK REGIONS, 2006 TO 2010 ........................................................... 34TABLE 4.10. RENTAL BONDS LODGED AND AVERAGE WEEKLY RENT, DARLING DOWNS AND SUB-REGIONS
COMPARED TO BENCHMARK REGIONS, 2006 TO 2010 .......................................... 35TABLE 4.11. NON-RESIDENTIAL BUILDING APPROVAL VALUES, DARLING DOWNS AND SUB-REGIONS,
2006 TO 2010 ....................................................................................... 36TABLE 4.12. FINANCIAL PERFORMANCE OF BROADACRE FARMS IN EASTERN DARLING DOWNS (A) ......... 37TABLE 5.1. AVERAGE ANNUAL IMPACT ON INDUSTRY OUTPUT IN THE DARLING DOWNS AND QUEENSLAND,
DEVIATION FROM THE BASELINE (WITHOUT PROJECT) SCENARIO .............................. 47TABLE 5.2. AVERAGE ANNUAL IMPACT ON EMPLOYMENT IN THE DARLING DOWNS AND QUEENSLAND,
DEVIATION FROM THE BASELINE (WITHOUT PROJECT) SCENARIO .............................. 50TABLE 5.3. AVERAGE ANNUAL IMPACT ON EMPLOYMENT BY OCCUPATION IN THE DARLING DOWNS,
DEVIATION FROM THE BASELINE (WITHOUT PROJECT) SCENARIO .............................. 51TABLE 5.4. AVERAGE ANNUAL IMPACT ON KEY ECONOMIC INDICATORS IN THE DARLING DOWNS,
DEVIATION FROM THE BASELINE (WITHOUT PROJECT) SCENARIO .............................. 55TABLE 5.5. AGGREGATE QUEENSLAND AND AUSTRALIAN GOVERNMENT REVENUES FROM THE SURAT GAS
PROJECT, 2013-14 TO 2027-28 ................................................................. 61TABLE 5.6. AGGREGATE QUEENSLAND GOVERNMENT REVENUES FROM THE SURAT GAS PROJECT, 2013-14
TO 2027-28 .......................................................................................... 62TABLE 5.7. AGGREGATE AUSTRALIAN GOVERNMENT REVENUES FROM THE SURAT GAS PROJECT, 2013-14
TO 2027-28 .......................................................................................... 62TABLE 5.8. SUMMARY CBA RESULTS OF SURAT GAS PROJECT IMPACTS TO QUEENSLAND .................. 66TABLE 5.9. ASSESSMENT OF ADVERSE IMPACTS OF THE SURAT GAS PROJECT ............................... 67TABLE 6.1. ASSESSMENT OF ADVERSE IMPACTS OF THE SURAT GAS PROJECT FOLLOWING MITIGATION .. 75TABLE 7.1. ASSESSMENT OF ADVERSE CUMULATIVE IMPACTS .................................................. 82

Economic Impact Assessment: Surat Gas Project Final Report
1
1. Introduction 1.1 Background
Arrow Energy Pty Ltd (Arrow) is investigating development of coal seam gas (CSG) reserves in the Surat Basin to meet the growing demand for gas supply, including domestic and potential export markets.
The area covered by the project extends from Wandoan to Dalby and south to Millmerran and towards Goondiwindi, an area in which Arrow holds a number of petroleum exploration and production tenures. Arrow’s existing gas fields at Tipton West, Daandine, Stratheden and Kogan North near Dalby are also included in the project area to be covered.
Arrow are also investigating an export Liquefied Natural Gas (LNG) market opportunity through the Arrow LNG Plant (formerly the Shell Australia LNG Project) on Curtis Island near Gladstone, and propose to utilise gas extracted from the Surat Basin (Surat Gas Project) and Bowen Basin as feedstock for this processing plant.
1.2 Legislative and Policy Context
Before the Surat Gas Project can proceed Arrow must gain approval from the Queensland Government and the Commonwealth Government. Regulatory authorities must be satisfied Arrow’s activities have been properly assessed, and that appropriate measures are in place to avoid or minimise environmental impacts. To do this, Arrow are preparing an Environmental Impact Statement (EIS) that examines the Surat Gas Project. The EIS aims to identify and, where appropriate, address all potential environmental, social and economic impacts in a manner that is transparent to all stakeholders.
Relevant government legislation and policy pertinent to conducting the economic impact assessment as part of this EIS is outlined below.
1.2.1 Relevant Australian Government Legislation
Assessment of potential economic impacts of major developments is recognised as a key mechanism prior to approval being granted. Whilst legislation pertaining to impact assessment primarily resides within the jurisdiction of state governments, assessment provisions are contained within the Commonwealth Environment Protection and Biodiversity Conservation Act 1999 (Cwlth) (EPBC Act).
The EPBC Act aims to balance the protection of environmental and cultural values with Australian society’s economic and social needs by creating a legal framework and decision-making process based on the guiding principles of ecologically sustainable development. The Department of Sustainability, Environment, Water, Population and Communities is responsible for administering the EPBC Act and it provides a national framework for assessing actions (defined as ‘controlled actions’) likely to have an impact on a matter of national environmental significance.
Arrow referred the Surat Gas Project to the Australian Government on 27 January 2010. On the 26 March 2010, the Australian Government declared the project a controlled action due to its potential to significantly affect listed threatened species and ecological communities (section 18 and 18A), and listed migratory species (section 20 and 20A). Controlled actions require the Commonwealth Minister for Environment’s approval prior to proceeding.
To minimise duplication of the environmental impact assessment process, the EPBC Act contains provision for the Australian Government to accredit a state assessment process for the purposes of its own assessment. Queensland’s EIS process has been accredited for the assessment under Part 8 of the EPBC Act in accordance with the Bilateral Agreement between the Commonwealth of Australia and the State of Queensland (2004). Therefore the EIS for the Surat Gas Project is being prepared to address both Australian and Queensland government requirements.
Aside from the EPBC Act, there is no specific Australian Government legislature or policy identified as being relevant to the conduct of the economic impact assessment.

Economic Impact Assessment: Surat Gas Project Final Report
2
1.2.2 Relevant Queensland Government Legislation
The Surat Gas Project EIS is being conducted under the Queensland Government’s Environmental Protection Act 1994 (EP Act) in accordance with the Bilateral Agreement between the Commonwealth of Australia and the State of Queensland (2004). An EIS is required under chapter 3 of the EP Act, which outlines the purpose of an EIS is “to assess the potential adverse and beneficial environmental, economic and social impacts of [a] project”. The EIS terms of reference set out for assessing the economic impacts of the Surat Gas Project are outlined in section 2.1.
Aside from the EIS terms of reference, there is no specific Queensland Government legislature or policy outlining the requirements of an economic impact assessment. However, the Queensland Government Department of Local Government and Planning’s Social Impact Assessment Unit provide an outline for conducting social impact assessment, which identifies the economy as one of five potential sensitive areas for consideration (DLGP, 2011). The framework for analysis is consistent with that outlined in the EIS terms of reference.
1.2.3 Relevant Australian, Queensland and Local Government Policies
A review of key government policies and other relevant literature is provided in Appendix A.
1.3 Purpose of the Report
This report is developed as a background technical document for use in preparing the EIS. The report quantifies the expected beneficial and adverse economic impacts of the Surat Gas Project on the regional, state and, where relevant, national economies.
The report also recommends mitigation and enhancement strategies as well as monitoring regimes to ensure regional economic values are enhanced or, at least, maintained if the Surat Gas Project proceeds.

Economic Impact Assessment: Surat Gas Project Final Report
3
2. Methodology 2.1 Terms of Reference
Terms of Reference for the Surat Gas Project EIS have been finalised and released by the Queensland Government Department of Environment and Resource Management (DERM, 2010a). Section 4.12 (Economy) of the final Terms of Reference broadly requires:
• Describing the existing economic environment that may be affected by the project;
• Undertaking an economic analysis, including cost benefit analysis, at the national, state, regional and local level (as appropriate to the scale of the project); and
• Developing and proposing mitigation and enhancement strategies and monitoring regimes.
The detailed assessment criteria, as described in the final Terms of Reference, and the sections of this report that address specific criterion are summarised in Table 2.1.
Table 2.1. Final EIS Terms of Reference – Economic Impact Assessment
Terms of Reference Section(s) Description of Values 4
Character and basis of the local and regional economies, including: • Economic viability (including economic base and economic activity, future economic opportunities,
current local and regional economic trends, in particular drought and rural downturn etc) Throughout 4
• Economic development in the region, with consideration of large-scale resource developments and their effects in the region
4.3, 4.2.5.2
Potential Impacts and Mitigation Measures 5, 6
Cost benefit analysis 5.13
Significance of the development in the local and regional economic context 5.4
Long and short-term impacts (beneficial and adverse) likely to result from the development Throughout 5
Potential for direct equity investment in the development by local businesses or communities 5.5
Cost to all levels of government of any additional infrastructure provision 5.7
Implications for future development (including constraints on land use and existing industries) 5.8
Potential economic impact of any major hazard identified 5.10
Distributional effects of the development 5.6
Value of lost or gained opportunities for other economic activities anticipated in the future 5.9
Impacts on local property values 5.3
Development impacts on energy self-sufficiency, security of supply 5.11
Development impacts on balance of payments/trade 5.12
Develop mitigation strategies and monitoring regimes 6
In addition to the above table, the final Terms of Reference for the Surat Gas Project require an assessment of cumulative impacts of the project in consideration of the effects of other known, existing or proposed project(s). This assessment is undertaken in Chapter 7.
2.2 Project Scope
The purpose of the economic impact assessment is to examine the Surat Gas Project in terms of its anticipated economic impacts. Analysis in this report focuses on local, regional and state level impacts, with national level impacts discussed as relevant.
2.3 Method of Assessment
2.3.1 Existing Economic Environment
The existing economic environment section provides an overview of the existing economic profile of the local and regional economies in which the project is located, with comparison to Queensland where information is available, and provides a baseline for

Economic Impact Assessment: Surat Gas Project Final Report
4
assessment of the significance of potential impacts of the proposed development. Regional economic data collected during this stage is used to develop economic models, and forms the ‘base case’ against which the Surat Gas Project’s impacts are assessed. In preparing this section, data and information was sourced from:
• The Australian Bureau of Statistics, Office of the Government Statistician, regional councils and other public sector agencies;
• Review of available government policies and economic development strategies (summarised in Appendix A);
• Consultations with local businesses and peak industry bodies (a summary of stakeholder consultation findings is presented in Appendix B);
• Private sector data providers and company websites; and
• AECgroup propriety economic models.
The existing economic environment provides an assessment and overview of the prevailing conditions of the economy based on available data sets. Recent investment decisions for projects such as the gas field components of the Gladstone LNG Project and the Queensland Curtis LNG Project are unlikely to be appropriately reflected in the statistics and data presented as release of data sets often lag by months and even years. Where appropriate, discussion of the likely implications of these major projects on prevailing economic conditions has been provided based on information obtained through consultation.
2.3.2 Economic Impact Assessment
The economic impact assessment section uses economic impact modelling results as well as information from the existing environment to analyse, assess and discuss the economic impacts of the Surat Gas Project in relation to the Terms of Reference items outlined in Table 2.1.
The economic impact assessment focuses on impacts at the local/ regional and state level as appropriate for each impact. Impacts at the national level are also presented in some instances to highlight the project’s impacts are focused in Queensland (e.g., Gross Domestic Product, Gross State Product). For example, impacts of the project on economic growth are considered pertinent to the regional, state and national economies, while focusing on the regional economy only is considered appropriate for the localised nature of impacts on the property market. For clarity and brevity, the baseline assessment does not present national baseline statistics.
The economic impact assessment includes input and information from:
• Economic modelling using Computable General Equilibrium (CGE) and Cost-Benefit Analysis (CBA) modelling techniques (a brief description of these modelling approaches is provided below, with additional details in Appendix C and Appendix D);
• Consultation with business, industry and key industry organisations to identify potential economic impacts (a summary of stakeholder consultation findings is presented in Appendix B);
• Interpretation of modelling output in the context of the regional and state economies, and analysis of other, non-quantified changes to the economic environment;
• Evaluation of the significance of impacts in relation to economic resources; and
• A summary assessment of the magnitude of key identified impacts based on the above analysis and using a risk assessment framework as outlined in Appendix E.
The assessment identifies the economic impacts specific to the Surat Gas Project compared to what would be anticipated if the project does not proceed (i.e., compared to a baseline scenario). The baseline scenario is not simply the existing economic environment – rather, the baseline scenario accounts for future anticipated economic growth in the local, regional, state and national economies based on available projections of future economic activity from relevant government bodies (refer to Appendix C for more details on these assumptions).

Economic Impact Assessment: Surat Gas Project Final Report
5
Additionally, the baseline scenario includes the anticipated future effects on economic growth and activity resulting from development and operation of the Gladstone LNG Project and the Queensland Curtis LNG Project, including the gas field components of these projects located in the Surat Basin. Descriptions of these projects are provided in Appendix C.
CGE modelling estimates the net increase in demand generated by the project after taking into account resource constraints. An example would be the necessity to pay higher wages to attract workers from other businesses or regions in a tight labour market.
A fixed domestic labour assumption has been used in the modelling, as per modelling undertaken on the LNG industry by McLennan Magasanik Associates (2009) for the Queensland Government. A constrained labour mobility assumption has been utilised between states, with labour mobility assumed to be motivated by real wage differentials. Labour mobility assumptions include both inter-industry labour movement within regions as well as inter-regional and interstate labour movement. Labour is assumed to not be sufficiently mobile to remove these real wage differentials completely (i.e., in order to attract labour, real wages will increase).
The CBA method considers the effect of real resource costs and benefits, and excludes transfer payments from one part of the economy to another (e.g., taxes and subsidies). CBA modelling uses a discounted cash flow (DCF) framework to quantify the relative costs and benefits of a project to estimate whether the benefits delivered by the Surat Gas Project outweigh the costs of the development. CBA assesses the impact of a development by comparing the ‘with’ project and ‘without’ project scenarios, and is useful in identifying the overall benefit or cost accruing to society as a whole as a result of a project. A detailed description of CBA modelling and its limitations is provided in Appendix D.
2.3.3 Development of Mitigation and Enhancement Measures
The mitigation and enhancement measures section identifies strategies to avoid, reduce or mitigate the negative economic impacts and enhance and facilitate the capture of the positive impacts identified in previous sections. This includes:
• Defining and describing the objectives of the task/ strategy;
• Identifying practical methods to protect and/or enhance economic values; and
• Identifying practical monitoring measures.
A residual impact assessment was also undertaken utilising the risk assessment framework outlined in Appendix E to qualitatively describe the anticipated magnitude of identified impacts where mitigation measures are appropriately implemented.
2.3.4 Cumulative Impact Assessment
The cumulative impact assessment section qualitatively examines the potential impacts in terms of capacity constraints of the Surat Gas Project on the local/ regional economy where other proposed projects in the region also proceed. Cumulative impacts have been assessed using the risk assessment framework described in Appendix E.
The assessment of likelihood and consequence of cumulative impacts has been undertaken based on input and information from:
• Desktop review of other projects proposed for the region and the impacts identified in relevant documentation;
• Consultation with business, industry and key industry organisations to identify potential cumulative effects and impacts (a summary of stakeholder consultation findings is presented in Appendix B); and
• Considered application by the project team of the risk assessment framework to identified impacts.
In identifying relevant projects to be included within the scope of the cumulative impact assessment, the following eligibility criteria have been examined:

Economic Impact Assessment: Surat Gas Project Final Report
6
• The project is located in the Darling Downs Statistical Division (SD)1
• The project has documented evidence of a serious intent to develop and sufficient data to conduct a cumulative impact assessment exists (e.g. including approved EIS, and detailed IAS etc., but excluding early studies that do not indicate commitment such as feasibility studies); and
;
• The project has the potential to impact on the Darling Downs SD economy and demand for a range of economic factors.
Based on the above criteria, the following projects have been included for consideration in the cumulative impact assessment:
• Arrow Surat Pipeline Project; • Australia Pacific LNG Project; • Cameby Downs Expansion Project; • Carbon Energy Blue Gum Energy Park Project; • CS Energy – Kogan Creek Solar Boost Project; • Elimatta Coal Project; • Emu Swamp Dam Project; • Felton Coal Mine and Coal to Liquid Project; • Hunter Gas Pipeline Project; • Linc Energy Underground Coal Gasification Project; • Nathan Dam and Nathan Pipeline; • New Acland Coal Mine Stage 3 Expansion Project; • Spring Gully Power Station; • Surat Basin Rail; and • Wandoan Coal Project.
Additional details for these projects are provided in Table 2.2. It is unlikely that all of these proposed developments will be realised, but similarly, there will be other projects that are developed that are not yet in the public domain.
The various beneficial and adverse economic impacts of these projects have or will be examined in their relevant EIS studies being conducted for these projects separately, and have not been assessed in this report. Rather, the cumulative impact assessment section focuses on the potential for the concurrent undertaking of these projects to exacerbate the impacts of the Surat Gas Project identified in the impact assessment.
1 The Darling Downs SD has been selected as the most relevant regional economy for the Surat Gas Project based on project location and dispersed nature of gas tenements within this regional economy (refer to section 3.4).

Economic Impact Assessment: Surat Gas Project Final Report
7
Table 2.2. Significant Projects in or Near the Darling Downs, 2011
Project Description Capital Expenditure
($M)
Employment (a) Commence Operation
Location
Gas Resource Projects
Australia Pacific LNG Project (Oil and Gas) Development of: • 18 Mtpa LNG Plant on Curtis Island over 2 stages • Gas Fields in Surat and Bowen Basins • Pipelines connecting gas fields to the LNG plant
$35,000
(through to 2020, including all components)
C: 2,100 O: 690
(Gas field component
only)
2014 LNG facility in Gladstone, with gas supplied from the Bowen and Surat (near Chinchilla) Basins
Gladstone LNG Project (Oil and Gas) Development of: • 10 Mtpa LNG Plant on Curtis Island over 3 stages • Gas Fields in Surat and Bowen Basins • Pipelines connecting gas fields to the LNG plant
US$16,000
(including all components)
C: 775-975 O: 2,000
(Gas field component
only)
2014 LNG facility in Gladstone, with gas supplied from the Bowen and Surat (near Roma) Basins
Queensland Curtis LNG Project (Oil and Gas)
Development of: • 12 Mtpa LNG Plant on Curtis Island over 3 stages • Gas Fields in Surat Basin • Pipelines connecting gas fields to the LNG plant
$8,000
(including all components)
C: 4,900 O: 530
(Gas field component
only)
2014 LNG facility in Gladstone, with gas supplied from the Surat Basin (Western Downs)
Coal Resource Projects
Cameby Downs Coal Expansion Project Increase production from 1.8Mtpa to 25Mtpa ROM coal (15-20Mtpa product coal) with a 40 year mine life. Stage 1 commenced, Stage 2 undergoing environmental investigations
$100 C: 100 O: 600
Stage 1: 2011 Stage 2: 2014+
Near Miles
Elimatta Coal Project Open cut mine producing 8Mtpa ROM (5mtpa product) coal with a mine life of more than 25 years
$615 C: Not specified O: 300
2013 35km west of Wandoan
Felton Coal Mine and Coal to Liquid Project
Development of: • Open cut mine producing 4Mtpa of feed coal • Fuel production facility converting coal to 940ML/yr
of unleaded petrol and 150ML/yr of LPG
$3,500+ C: 1,880 O: 530
2014 30km southwest of Toowoomba
New Acland Coal Mine Stage 3 Expansion Expand production to approximately 10Mtpa product coal
$500 C: 225 O: 450 (170 new)
2013 14km north-northwest of Oakey
Wandoan Coal Project Development of a 30Mtpa ROM open cut thermal coal mine (22Mtpa product coal) with 30 year operational life
$1,800 C: 1,375 O: 844
Post 2012 West of Wandoan
Wilkie Creek Expansion Project Expansion of the existing Wilkie Creek mine from 2.3Mtpa to 10Mtpa
$162 C: Not specified O: 165
2013 40km northwest of Dalby
Woori Coal Mine: Cockatoo Coal Project Open cut coal mine producing initially 3Mtpa ROM thermal coal, expanding to 6Mtpa within one year of commencement. Mine life of 15 years
Not specified C: Not specified O: Not specified
Not specified 15km south of Wandoan

Economic Impact Assessment: Surat Gas Project Final Report
8
Project Description Capital Expenditure
($M)
Employment (a) Commence Operation
Location
Other Energy Resource Projects
BOC micro-LNG Plant Development of a micro-LNG plant next to the Condamine Power Station
$100 C: Not specified O: Not specified
2011 Condamine (near Chinchilla)
Carbon Energy Bloodwood Creek Project Syngas production consuming approximately 2Mtpa coal over 30 years
Not specified C: Not specified O: Not specified
2011 40km west of Dalby
Carbon Energy Blue Gum Energy Park Project
Development of a commercial scale 300MW power plant utilising syngas developed from the Bloodwood Creek Project
Not specified C: Not specified O: Not specified
Not specified 40km west of Dalby
Coopers Gap Windfarm Development of 252 wind turbine generators with a total generation capacity of 500MW
$1,200 C: Not specified O: Not specified
Not specified 50km west of Kingaroy, 65km north of Dalby
Kogan Creek Solar Boost Project Development of a 44MW solar thermal addition to the existing 750MW Kogan Creek Power Station
$104.7 C: 120 O: Not specified
2013 Kogan Creek Power Station
Linc Energy Underground Coal Gasification Development of: • A 40,000 barrel per day gas-to-liquid diesel
production plant supplied by syngas produced from underground coal gasification
• A 200MW gas turbine fuelled by the syngas
$1,000 C: 400 O: Not specified
On hold 20km southwest of Chinchilla
Energy Infrastructure Projects
Arrow Surat Pipeline Development of 467km of gas pipeline linking the Surat Gas Project (this project) to an LNG facility in Gladstone
$548 C: 450 O: Not specified
2012 Kogan to Gladstone
Spring Gully Power Station Development of a 1,000 MW combined cycle gas fired power station at Spring Gully. The power station will be constructed in two 500 MW stages
$870 C: 400 O: 30
Delayed 80km northeast of Roma
Hunter Gas Pipeline Project Development of approximately 850km of gas pipeline (200km in Queensland) linking the Wallumbilla Gas Hub in Queensland to Newcastle
$850 ($290 in QLD)
C: 600 O: 25
2012 Wallumbilla to Newcastle
Transport Infrastructure Projects
Border Railway Development of 340km of standard gauge rail line from Moree to Charlton (near Toowoomba)
$1,000 Not specified 2014 Moree to Toowoomba
Surat Basin Railway Development of 214km of an open access, multi-use real line linking Wandoan to Moura, and thereby providing access to coal export terminals in Central Queensland
$1,200 C: 1,000 O: 44
2015 Wandoan to Moura

Economic Impact Assessment: Surat Gas Project Final Report
9
Project Description Capital Expenditure
($M)
Employment (a) Commence Operation
Location
Water Infrastructure Projects
Emu Swamp Dam Development of either a 5000 ML urban water supply dam or a 10,500 ML urban and irrigation water supply dam
$76 C: 145 O: Not specified
Not specified Severn River, 15km southwest of Stanthorpe
Nathan Dam and Nathan Pipeline Development of an 880,000ML dam and 260km of pipeline to Dalby, primarily servicing future coal and power station projects
$1,400 C: 425 O: Not specified
2015 75km downstream of Taroom
Note: (a) C = Construction at peak; O = Operation. Source: Details outlined in the table have been compiled from information presented by the Department of Environment and Resource Management (DERM, 2011), Department of Infrastructure and Planning (DIP, 2011), the Heavy Engineering Industry Reference Group (HEIRG, 2011) and documentation from company websites of project proponents.

Economic Impact Assessment: Surat Gas Project Final Report
10
PAGE LEFT INTENTIONALLY BLANK
Economic Impact Assessment: Surat Gas Project Final Report
11
3. Project Overview and Description 3.1 Project Overview
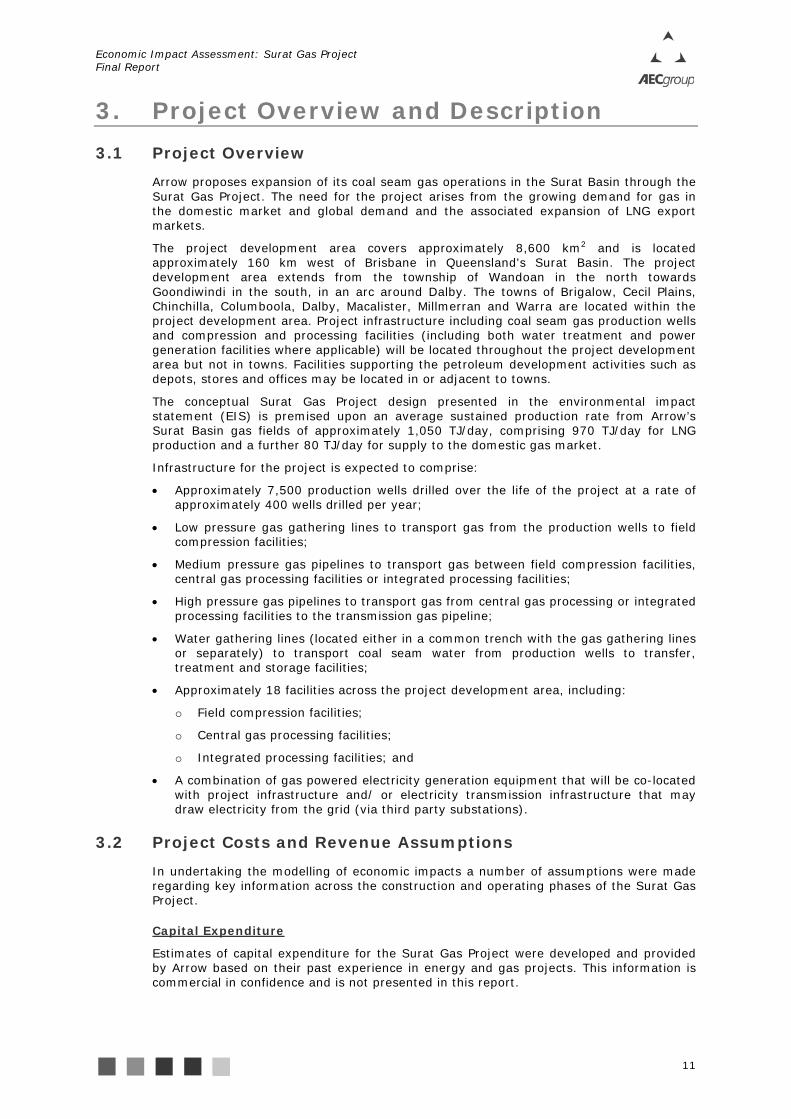
Arrow proposes expansion of its coal seam gas operations in the Surat Basin through the Surat Gas Project. The need for the project arises from the growing demand for gas in the domestic market and global demand and the associated expansion of LNG export markets.
The project development area covers approximately 8,600 km2 and is located approximately 160 km west of Brisbane in Queensland's Surat Basin. The project development area extends from the township of Wandoan in the north towards Goondiwindi in the south, in an arc around Dalby. The towns of Brigalow, Cecil Plains, Chinchilla, Columboola, Dalby, Macalister, Millmerran and Warra are located within the project development area. Project infrastructure including coal seam gas production wells and compression and processing facilities (including both water treatment and power generation facilities where applicable) will be located throughout the project development area but not in towns. Facilities supporting the petroleum development activities such as depots, stores and offices may be located in or adjacent to towns.
The conceptual Surat Gas Project design presented in the environmental impact statement (EIS) is premised upon an average sustained production rate from Arrow’s Surat Basin gas fields of approximately 1,050 TJ/day, comprising 970 TJ/day for LNG production and a further 80 TJ/day for supply to the domestic gas market.
Infrastructure for the project is expected to comprise:
• Approximately 7,500 production wells drilled over the life of the project at a rate of approximately 400 wells drilled per year;
• Low pressure gas gathering lines to transport gas from the production wells to field compression facilities;
• Medium pressure gas pipelines to transport gas between field compression facilities, central gas processing facilities or integrated processing facilities;
• High pressure gas pipelines to transport gas from central gas processing or integrated processing facilities to the transmission gas pipeline;
• Water gathering lines (located either in a common trench with the gas gathering lines or separately) to transport coal seam water from production wells to transfer, treatment and storage facilities;
• Approximately 18 facilities across the project development area, including:
o Field compression facilities;
o Central gas processing facilities;
o Integrated processing facilities; and
• A combination of gas powered electricity generation equipment that will be co-located with project infrastructure and/ or electricity transmission infrastructure that may draw electricity from the grid (via third party substations).
3.2 Project Costs and Revenue Assumptions
In undertaking the modelling of economic impacts a number of assumptions were made regarding key information across the construction and operating phases of the Surat Gas Project.
Estimates of capital expenditure for the Surat Gas Project were developed and provided by Arrow based on their past experience in energy and gas projects. This information is commercial in confidence and is not presented in this report.
Capital Expenditure

Economic Impact Assessment: Surat Gas Project Final Report
12
An indicative construction expenditure profile is provided in Figure 3.1 to provide an indication of timing for construction activity across the key components of gas wells and water and gas treatment facilities.
Figure 3.1. Indicative Construction Expenditure Profile
Source: Arrow Energy (unpublished).
The table below provides a summary of assumed supply of goods and services used in development of the Surat Gas Project based on consultation with Arrow.
Table 3.1. Assumed Distribution of Construction Expenditure
Region Expenditure Distribution (%)
Darling Downs 38%
Rest of Queensland 10%
Rest of Australia 21%
Overseas 31%
Total 100% Source: Arrow Energy (unpublished), AECgroup.
The Surat Gas Project is estimated to have an average sustained production rate of approximately 1,050 TJ/day (or approximately 390 PJ/annum), comprising 970 TJ/day for LNG production and a further 80 TJ/day for supply to the domestic gas market.
Gas Production
Ramp-up to peak production is estimated to take between 4 and 5 years, and is planned to commence in 2014. Following ramp-up, gas production will be sustained at approximately 1,050 TJ/day.
A project life of 35 years has been adopted for EIS purposes. However, economic modelling has been undertaken to 2027-28.
The gas price for gas used in LNG production is assumed to be tied to the value of LNG. As this information is commercial in confidence, estimates of prices received for gas production are not presented in this report, but have been based on an “anticipated” or
Gas Prices
0%
2%
4%
6%
8%
10%
12%
14%
2014
2015
2016
2017
2018
2019
2020
2021
2022
2023
2024
2025
2026
2027
2028
2029
2030
% o
f To
tal
Con
stru
ctio
n Ex
pend
itur
e
Gas Wells Water and Gas Treatment Facilities

Economic Impact Assessment: Surat Gas Project Final Report
13
“likely” CSG price associated with existing prices for LNG of between US$8/MMBTU and US$12/MMBTU, with US$10/MMBTU adopted for this analysis.
Estimates of operating expenditure and timing of this expenditure for the Surat Gas Project were developed and provided by Arrow based on their past experience in energy and gas projects. This information is commercial in confidence and is not presented in this report.
Operating Expenditure
3.3 Workforce
Construction of the gas fields for the Surat Gas Project will commence in 2013-14 and continue through to 2030. Construction activities will include:
• Facilities construction (including labour and management teams);
• Well and gathering line installation and commissioning;
• Earthworks; and
• Construction worker camp development and operation.
The construction workforce will fluctuate considerably throughout the development period as infrastructure is developed in stages. A peak construction workforce of approximately 640 personnel is expected to occur in 2016, coinciding with concurrent development of a central gas processing facility and an integrated processing facility. From 2016 to 2021 the construction workforce ranges from on average 250 to 500 personnel before tailing to an average construction workforce of between 220 and 400 personnel.
During operation, the workforce is expected to reach its peak of 464 personnel in 2028 and plateau from there. The operational workforce located in the Darling Downs SD is outlined in Figure 3.2 – this excludes Brisbane-based support staff for the depots.
Figure 3.2. Surat Gas Project Operational Workforce in the Darling Downs SD
Note: Excludes Brisbane-based support staff. Source: Coffey Environments (2011).
It is anticipated that the types of staff and skills required for the Surat Gas Project during construction, commissioning and operation will be in line with the staff types identified by Energy Skills Queensland (ESQ, 2009), outlined in Table 3.2.
0
50
100
150
200
250
300
350
400
450
500
2014 2015 2016 2017 2018 2019 2020 2021 2022 2023 2024 2025 2026 2027 2028
Ope
rati
onal
Wor
kfor
ce
Support staff at depots Field staff for commissioned production wells Facility operations workforce

Economic Impact Assessment: Surat Gas Project Final Report
14
Table 3.2. Coal Seam Gas Field Staff
Development Stage Commissioning Stage Operating Stage • Completion engineers • Control room technicians • Cultural heritage coordinators • Cultural heritage monitors • Drilling engineers • Driller supervisors • Drillers & driller’s assistants • Electrical & instrument technicians • Electrical/ Instrument/ Control
engineers • Environmental advisors • Field construction supervisors • Field construction technicians • Field delivery supervisors • Field services utilitymen • Maintenance technicians
(mechanical) • OH&S advisors • Operations superintendents • Operations supervisors • Pipeline welders • Production engineers • Production technicians • Project engineers • Reservoir engineers • Senior drillers
• Commissioning engineers • Electrical and instrumentation
technicians • Electrical/ Instrumentation/
Control engineers • Environmental advisors • Facility engineers • Logistics supervisors • Logistics technicians • Maintenance technicians
(mechanical) • OH&S advisors • Operations superintendents • Operations supervisors • Production engineers • Production technicians • Reverse osmosis technicians
• Administrative staff • Area managers • Completion engineers • Control room technicians • Cultural heritage coordinators • Driller supervisors • Drillers & driller’s assistants • Electrical & instrument technicians • Electrical/ Instrument/ Control
engineers • Environmental advisors • Facility engineers • Licensed electricians • Logistics supervisors • Logistics technicians • Maintenance planners • Maintenance superintendents • Maintenance supervisors • Maintenance technicians
(mechanical) • OH&S advisors • Operations superintendents • Operations supervisors • Production engineers • Production technicians • Reservoir engineers • Reverse osmosis specialists • Reverse osmosis supervisor • Reverse osmosis technicians • Senior drillers
Source: ESQ (2009a).
Additional detail on the construction and operation workforces for the Surat Gas Project is provided in Table 3.3 (construction) and Table 3.4 (operation).

Economic Impact Assessment: Surat Gas Project Final Report
15
Table 3.3. Construction Workforce Details
Activity Type Size of Workforce Source of Workforce Accommodation Well and gathering line installation and commissioning team
• Typical workforce is 17 persons for a single shift drilling crew and 30 persons for a double shift drilling crew.
• Peak workforce estimated at 370 persons is predicted to occur in year 2020.
• Average workforce of 250 persons is predicted to occur from years 2012 to 2030.
• On average 70 support staff will be based onsite (and will live locally i.e., not at a camp). This peaks in year 2020 with an estimated 100 onsite support staff.
• An average of 30 Brisbane-based support staff (including project managers, engineers, design engineers and HSSE personnel) will be required each year with the peak workforce of 45 persons occurring in years 2016 and 2019 (when 2 facilities are brought online in each of those years) and in year 2020.
Construction workforce: • 20% local area. • 80% from elsewhere; FIFO/ DIDO
accommodated in camps. Onsite support staff: • 20% local area. • 80% from elsewhere who purchase
/ rent accommodation and live locally.
Brisbane-based support staff: • 100% from Brisbane who travel as
required.
Construction staff and contractors: • Base case considers 100% of construction
drilling workforce accommodated at central gas processing / integrated processing facility construction camps.
• Occasional small (<20 person) mobile drilling camps depending on drilling site and proximity to integrated processing facility camp.
• Some local residences. Arrow support staff onsite: • 20% existing local residences. • 80% renting or purchasing locally. Arrow support staff Brisbane: • Drive to/from Brisbane.
Field compression facility (5 to 7 month construction timeframe)
Construction workforce for a first stage field compression facility ranges from an estimated 40 to 60 persons for construction of 30 and 60 TJ/d facilities, respectively.
• 20% local area. • 80% from elsewhere; FIFO/ DIDO
accommodated in camps.
• 20% local residences. • 80% construction camp.
Compression facilities including: • Integrated processing
facilities • Central gas processing
facilities (9 to 15 month construction timeframe per facility)
Construction workforce for a multistage field compression facility ranges from an estimated 70 to 140 persons for construction of 30 and 150 TJ/day facilities, respectively.
• 20% local area. • 80% from elsewhere; FIFO/ DIDO
accommodated in camps.
• 20% local residences. • 80% construction camp.
High pressure gas pipeline construction
Construction from integrated and central gas processing facilities connecting to either the Surat Header or Arrow Surat Pipeline is part of the EIS scope however workforce numbers are not included here. It is anticipated that the workforce that construct the Arrow Surat Pipeline (including the Surat Header pipeline) will undertake this work.
N/a • 100% in construction camps (central gas processing or integrated processing facility camp if possible, otherwise designated pipeline camp).
Power line construction (where constructing powerlines from substation to facility / field)
Should power line construction be required then the workforce numbers estimated to construct onsite power generation will generally be equivalent to if not smaller than the number estimated to build power lines.
N/a N/a
Note: FIFO = Fly-in, fly-out; DIDO = Drive-in, drive-out. Source: Coffey Environments (2011).

Economic Impact Assessment: Surat Gas Project Final Report
16
Table 3.4. Operation Workforce Details
Activity Type Size of Workforce Source of Workforce Accommodation Development region administration and management
Up to 200 personnel (including 50 existing persons) for various roles including administration, engineering and production, supervisory, OHS and stores will be based at one of the three depots (Dalby, Miles or Millmerran) from year 2022 onwards.
• 50% local area. • 50% from elsewhere who move to
the area to live.
• 50% existing local residences. • 50% renting or purchasing locally.
Field compression facility operation
No designated workforce. Staff from the associated central gas processing facility or integrated processing facility will operate and maintain the field compression facility.
N/a N/a
Central gas processing and integrated processing facilities operation (including water treatment and power generation)
Approximately 7 to 9 persons per gas processing facility. From year 2022 over 70 persons are predicted to be involved with online facilities activities.
• 50% local area. • 50% from elsewhere who move to
the area to live.
• 50% existing local residences. • 50% renting or purchasing locally.
Well operators It is estimated that there will be approximately 1 well operator per 50 wells. As more wells are brought on-line each year during ramp up, the number of well operators increases however a maximum number of operators is reached in year 2025 when 80 personnel are expected to be responsible for well operations across the project development region.
• 50% local area. • 50% from elsewhere who move to
the area to live.
• 50% existing local residences. • 50% renting or purchasing locally.
Well workover crew Similarly to the well operators, whilst workforce increases with each new production well brought on line, there is a peak workforce that plateaus once reached. It is estimated that a production well requires: • One workover every 3 years. • A nominal 7 days per workover. • Five people per workover crew. Based on the above assumptions the maximum number of workover staff is 100 and this number plateaus from year 2022.
• 50% local area. • 50% from elsewhere who move to
the area to live.
• 50% existing local residences. • 50% renting or purchasing locally.
Source: Coffey Environments (2011).

Economic Impact Assessment: Surat Gas Project Final Report
17
3.4 Study Area
Given the dispersed location of gas tenements, the Darling Downs Statistical Division (SD) geographic area has been used in this project as a relevant study area for assessing local/ regional impacts of the Surat Gas Project. The Darling Downs SD (referred to as simply the Darling Downs for the remainder of this report) encompasses the Local Government Areas (LGAs) of:
• Toowoomba Regional Council;
• Western Downs Regional Council;
• Southern Downs Regional Council; and
• Goondiwindi Regional Council.
A map of the Study Area is provided in Figure 3.3. The Study Area used for the economic impact assessment differs from the overall EIS Study Area to account for the likely broader reaching economic impacts of the project. An overlay of the EIS Study Area is also provided in Figure 3.3 (a more detailed map of the EIS Study Area is provided in Appendix F).
Figure 3.3. Map of the Surat Gas Project Study Area
Source: ABS (2010), ABS (2003), AECgroup.
Legend
EIS Study Area
Highway
Rail
Locality
Toowoomba RegionalCouncil
Western DownsRegional Council
Southern DownsRegional Council
GoondiwindiRegional Council

Economic Impact Assessment: Surat Gas Project Final Report
18
PAGE LEFT INTENTIONALLY BLANK

Economic Impact Assessment: Surat Gas Project Final Report
19
4. Existing Economic Environment This chapter presents a summary of key economic indicators and an overview of recent economic performance in the local and regional economies that may be impacted by the proposed Surat Gas Project, with comparison to Queensland or other benchmarks as appropriate. As outlined in section 3.4, the Surat Gas Project covers a geographically dispersed area and the Darling Downs has been selected as the most relevant regional economy for assessing project impacts.
In line with the dispersed nature of the Surat Gas Project, the project’s economic impacts are expected to be felt across the region. The Western Downs and Goondiwindi Regional Council areas are likely to receive the greatest benefit due to their geographic proximity to project activities, while Toowoomba, as the regional service centre to the outlying townships in the Darling Downs, is also expected to benefit from the project proceeding.
The chapter also includes a brief overview of planned and prospective regional economic opportunities, many of which are resource related.
4.1 Summary of Existing Environment
The Darling Downs’ economy has been traditionally based on the agricultural sector and its support services. This traditional economic strength of the region has been in decline over the past decade primarily due to unfavourable climatic conditions and rural downturn, which have adversely impacted on agricultural production. Whilst most farms are used to managing through the variability associated with agricultural production, the prolonged nature of the drought (and more recently floods) has seen many farms in the region record operating losses in recent years, and has resulted in farm business debt levels increasing. The agricultural nature of the Darling Downs economy is important and should be preserved.
Local supply chains are predominantly based around supporting the traditional agriculture sector and have the capacity and capability to expand and support the growing resources sector.
The following points provide a summary of other key conditions within the Darling Downs economy highlighted in the following sections of this chapter:
• The Darling Downs’ resident population has been growing at a slower rate than Queensland in recent years, and projections by the Queensland Government suggest population will expand at a similar rate over the next 20 years. However, these estimates and projections do not account for the sizable and growing transient population in the region that has been attracted by significant mining and gas exploration and development activity;
• The mining and energy resource industry has expanded considerably as a result of significant interest in the Surat Basin, and is now the second largest contributor to the Darling Downs economy in terms of value added activity. This has resulted in strong growth in Gross Regional Product (GRP) in the Western Downs region in particular;
• Local support services for the energy resources sector are developing but currently immature, presenting issues for energy resource operations in sourcing locally produced goods and services. As the energy resource supply chain builds, competition for inputs of goods and services (e.g. transport) has the potential to create issues for the agriculture and other sectors competing with the higher prices able to be paid by the resource sector to secure these suppliers;
• Toowoomba LGA is the primary service centre for the Darling Downs (as well as for some areas further west such as Roma), and has a considerably larger proportion of workers employed in business and household service based industries than the rest of the Darling Downs, it is likely this hierarchy will continue into the future;
• The Darling Downs has a tight labour market, with a much lower unemployment rate than Queensland overall. In the June Quarter 2009 the unemployment rate was below 2%. While unemployment has since increased (due to a number of global economic factors), unemployment is likely to return to very low levels in the short term as

Economic Impact Assessment: Surat Gas Project Final Report
20
projects such as the Queensland Curtis LNG Project, Gladstone LNG Project and Australia Pacific LNG Project (all of which propose to develop gas fields in the Surat Basin) ramp up;
• The low unemployment rate is a symptom of high demand for labour but limited local supply, which has resulted in significant skills shortages developing in the region, in particular for the energy sector, and growing competition for labour between industries. This limited local skills availability has resulted in a growing fly-in, fly-out (FIFO) workforce in the region, which is likely to continue as recently approved projects such as the Queensland Curtis LNG Project and Gladstone LNG Project come on line;
• The property market in the Darling Downs has shown signs of tightening in recent years, driven largely by increased demand for accommodation from mining and gas companies and their employees. The Darling Downs’ property market has also attracted some speculative property buyers seeking future rental yields as a result of anticipated growth in demand as resource projects come on line. Tightening in the property market has been most evident in the Western Downs LGA, where much of the mining and gas activity has occurred. With a significant number of projects proposed for the region, the property market is likely to remain tight in the short to medium term as new supply lags anticipated strong growth in demand; and
• The Darling Downs is currently experiencing some transport and telecommunications infrastructure constraints. Where these constraints are not addressed, it will likely impact on the capacity of the Darling Downs to support the significant latent economic development opportunities available within the regional economy.
4.2 Economic Base and Activity
4.2.1 Population Size and Projected Growth
The total resident population of the Darling Downs was 241,537 people in 2010, representing 5.4% of the overall Queensland population (refer to Table 4.1). The Darling Downs’ resident population has increased at a rate of 1.7% per annum on average since 2006 – a slower rate than the 2.5% per annum on average recorded by Queensland over the period.
Over the years from 2010 to 2015, the Darling Downs’ resident population is projected by the Queensland Government to increase to 261,885 residents, an increase of approximately 1.6% per annum on average. This is relatively in line with growth over the past five years. By comparison, population growth in Queensland is projected to be approximately 2.0% per annum on average, above the Darling Downs growth rate but slower than that experienced between 2006 and 2010.
Between 2015 and 2030, the Darling Downs’ resident population is projected by the Queensland Government to increase to 340,543 residents, representing growth of 1.8% per annum on average. This is slightly higher than the projected growth for the region over the next five years, and in line with the projected growth rate for Queensland between 2015 and 2030.
The Toowoomba Local Government Area (LGA) is the primary population centre in the Darling Downs, accounting for approximately two thirds of the total Darling Downs population in 2010. Toowoomba LGA’s population is projected to grow at a faster rate than the other LGAs in the Darling Downs between 2010 and 2030 to account for over 70% (or 241,331 residents) of the total Darling Downs’ resident population in 2030. The Southern Downs LGA, Western Downs LGA and Goondiwindi LGA are projected to record slower growth in resident population than the Darling Downs average between 2010 and 2030.

Economic Impact Assessment: Surat Gas Project Final Report
21
Table 4.1. Historic and Projected Population, 2006 to 2030
Region Historic Population Population Projections Average Annual Growth 2006 2010 2015 2020 2030 2006-10 2010-15 2015-30
Toowoomba LGA 151,297 162,057 178,148 196,742 241,331 1.7% 1.9% 2.0%
Western Downs LGA 30,180 32,071 33,668 35,435 39,415 1.5% 1.0% 1.1%
Southern Downs LGA 33,589 35,996 38,259 40,791 46,587 1.7% 1.2% 1.3%
Goondiwindi LGA 10,741 11,413 11,811 12,247 13,211 1.5% 0.7% 0.7%
Darling Downs 225,807 241,537 261,885 285,215 340,543 1.7% 1.6% 1.8%
Queensland 4,090,908 4,513,850 4,991,668 5,484,779 6,487,854 2.5% 2.0% 1.8% Source: ABS (2011a), Queensland Treasury (2011a), DIP (2008a).
In addition to the anticipated growth in resident population outlined in the table above, the literature review (refer to Appendix A) and stakeholder consultation (refer to Appendix B) identify that the Darling Downs (or more accurately, the Surat Basin and surrounding service region) has experienced considerable growth in the transient population2
4.2.2 Growth in and Industry Contribution to Gross Regional Product
in recent years. Increasing interest in energy resources, and the resultant exploration and development activity, has attracted a sizeable workforce to the Darling Downs, with many of these workers travelling to and staying temporarily in the region with a permanent home elsewhere. The transient population in the Darling Downs is anticipated to increase over the next ten to fifteen years as energy resource development expands and more skilled labour is imported to the region.
The Darling Downs is estimated to have recorded Gross Regional Product (GRP) of $12.6 billion in 2009-10 (refer to Table 4.2), representing 5.1% of Queensland Gross State Product (GSP) for the year (with Queensland’s GSP being estimated at $244.2 billion in 2009-10). Darling Downs’ GRP is estimated to have increased by 8.4% per annum on average between 2006-07 and 2009-10, considerably above the growth of 5.0% per annum on average recorded in Queensland’s GSP over this period.
Strong growth in the Darling Downs economy has been driven by growth in the Western Downs LGA in particular (11.4% per annum on average), where much of the mining and gas exploration activity has occurred in recent years, as well as Toowoomba LGA (8.2% per annum on average) which is the primary service centre for the Darling Downs and South West regions.
Table 4.2. Indicative Estimates of Gross Regional Product, Darling Downs and Sub-Regions, 2006-07 to 2009-10
Region GRP ($M) Average Annual % Growth,
2006-07 to 2009-10 2006-07 2009-10
Toowoomba LGA $6,638.8 $8,417.2 8.2%
Western Downs LGA $1,521.0 $2,102.7 11.4%
Southern Downs LGA $1,231.4 $1,474.6 6.2%
Goondiwindi LGA $468.4 $574.1 7.0%
Darling Downs $9,859.6 $12,568.7 8.4%
Queensland $211,149.0 $244,159.0 5.0% Source: AECgroup.
Table 4.3 outlines industry contribution to total gross value add (GVA)3
2 Transient population refers to those people temporarily staying in a region and thereby increase demand and loads for a range of services, accommodation and facilities. This includes both imported workers as well as tourists/ leisure visitors.
in the Darling Downs and Queensland. The table highlights that mining (which includes all energy resources, including gas, as well as exploration activity) was the second largest industry in the Darling Downs in 2009-10, contributing over 10% of GVA, or $1.3 billion. Mining’s contribution to total Darling Downs GVA was in line with the industry’s contribution to the
3 Gross value add is equivalent to GRP less taxes and subsidies on products.

Economic Impact Assessment: Surat Gas Project Final Report
22
Queensland economy. Other key contributors to the Darling Downs economy in 2009-10 were:
• Public administration and safety (11.5% of total GVA, or $1.4 billion);
• Construction (9.6% of total GVA, or $1.1 billion);
• Agriculture, forestry and fishing (9.1% of total GVA, or $1.1 billion); and
• Wholesale trade (8.5% of total GVA, or $1.0 billion).
When compared to Queensland, the Darling Downs is considerably more reliant on the following industries:
• Agriculture, forestry and fishing (location quotient of 3.42);
• Public administration and safety (2.08);
• Electricity, gas, water and waste services (2.01); and
• Wholesale trade (1.69).
Table 4.3. Industry Contribution to Gross Value Add, Darling Downs Compared to Queensland, 2009-10
Industry Darling Downs SD
Queensland Location Quotient (a)
Public administration and safety 11.5% 5.5% 2.08
Mining 10.7% 10.3% 1.04
Construction 9.6% 8.7% 1.10
Agriculture, forestry and fishing 9.1% 2.7% 3.42
Wholesale trade 8.5% 5.0% 1.69
Health care and social assistance 6.9% 7.0% 0.98
Retail trade 6.4% 5.3% 1.22
Manufacturing 5.3% 8.4% 0.63
Transport, postal and warehousing 4.8% 6.5% 0.75
Electricity, gas, water and waste services 4.4% 2.2% 2.01
Financial and insurance services 4.0% 6.3% 0.64
Professional, scientific and technical services 3.8% 5.9% 0.64
Ownership of dwellings 3.8% 9.3% 0.41
Education and training 3.1% 4.2% 0.75
Accommodation and food services 2.6% 2.7% 0.93
Other services 1.8% 2.0% 0.90
Administrative and support services 1.3% 2.3% 0.59
Rental, hiring and real estate services 1.1% 2.9% 0.40
Information media and telecommunications 0.8% 2.3% 0.35
Arts and recreation services 0.3% 0.6% 0.53
Total Industry Value Add 100.0% 100.0% -
Industry Value Add as a % of GRP 94.2% 93.6% -
Taxes less Subsidies 5.8% 6.4% -
Gross Regional Product $12,568.7 $244,159.0 - Note: (a) Location Quotient represents Darling Downs percent contribution divided by Queensland percent contribution and represents the relative strength of each industry compared to Queensland as a benchmark. Source: AECgroup.
Figure 4.1 displays growth in GVA for each industry in the Darling Downs as a percent change between 2006-07 and 2009-10. The figure shows that growth in the mining industry has outstripped all other industries in the regional economy, with the estimated $1.3 billion in GVA in 2009-10 approximately 205% more than the estimated contribution in 2006-07 ($415.3 million). This significant increase is reflective of the recent interest and activity in the Surat Basin in terms of mining and gas exploration and development.
Other industries that have experienced strong growth in GVA between 2006-07 and 2009-10 include:

Economic Impact Assessment: Surat Gas Project Final Report
23
• Electricity, gas, water and waste services – 130.2%;
• Wholesale trade – 122.4%;
• Public administration and safety – 112.5%;
• Ownership of dwellings – 53.9%;
• Professional, scientific and technical services – 49.6%; and
• Construction – 46.1%.
Of note, the agriculture, forestry and fishing industry, which was the largest single industry contributor to total Darling Downs GVA in 2006-07, increased in absolute terms by just 2.7% between 2006-07 and 2009-10 to be the fourth largest contributor to GVA in 2009-10. This result highlights that the contribution of the traditionally strong agriculture, forestry and fishing sector to the Darling Downs has been in decline, and future expansion of the mining and gas industry (which competes with the agriculture sector for land) has the potential to further negatively influence the agriculture sector if not appropriately managed. The mining and gas industry provides a benefit to the regional economy in terms of economic diversification that can assist in mitigating deleterious impacts on the Darling Downs economy arising from inherent volatility in agricultural production due to fluctuations in climatic and weather conditions.
Figure 4.1. Percent Change in Gross Value Add by Industry, Darling Downs, 2006-07 to 2009-10
Source: AECgroup.
4.2.3 Labour Market Characteristics
4.2.3.1 Labour Force, Employment and Unemployment
The Darling Downs had a total labour force of 125,725 in the September Quarter of 2010, comprised of 120,560 employed residents and 5,165 people unemployed (refer to Table 4.4). This equated to an unemployment rate of 4.1% in the Darling Downs.
Over the year to the September Quarter 2010, the unemployment rate rose by 2.0 percentage points compared to September Quarter 2009. During this time, the number of employed persons declined by 1.2%, equating to an increase in the labour force in the Darling Downs of 0.9%.
By comparison, Queensland recorded an increase of 1.5% in the total number of people employed between the September Quarter 2009 and the September Quarter 2010, despite also recording an increase in the unemployment rate from 4.9% to 5.6%.
-50.0% 0.0% 50.0% 100.0% 150.0% 200.0% 250.0%
Information media and telecommunications
Rental, hiring and real estate services
Manufacturing
Education and training
Financial and insurance services
Other services
Agriculture, forestry and fishing
Arts and recreation services
Transport, postal and warehousing
Administrative and support services
Accommodation and food services
Health care and social assistance
Retail trade
Construction
Professional, scientific and technical services
Ownership of dwellings
Public administration and safety
Wholesale trade
Electricity, gas, water and waste services
Mining
Change in Value Add (%)
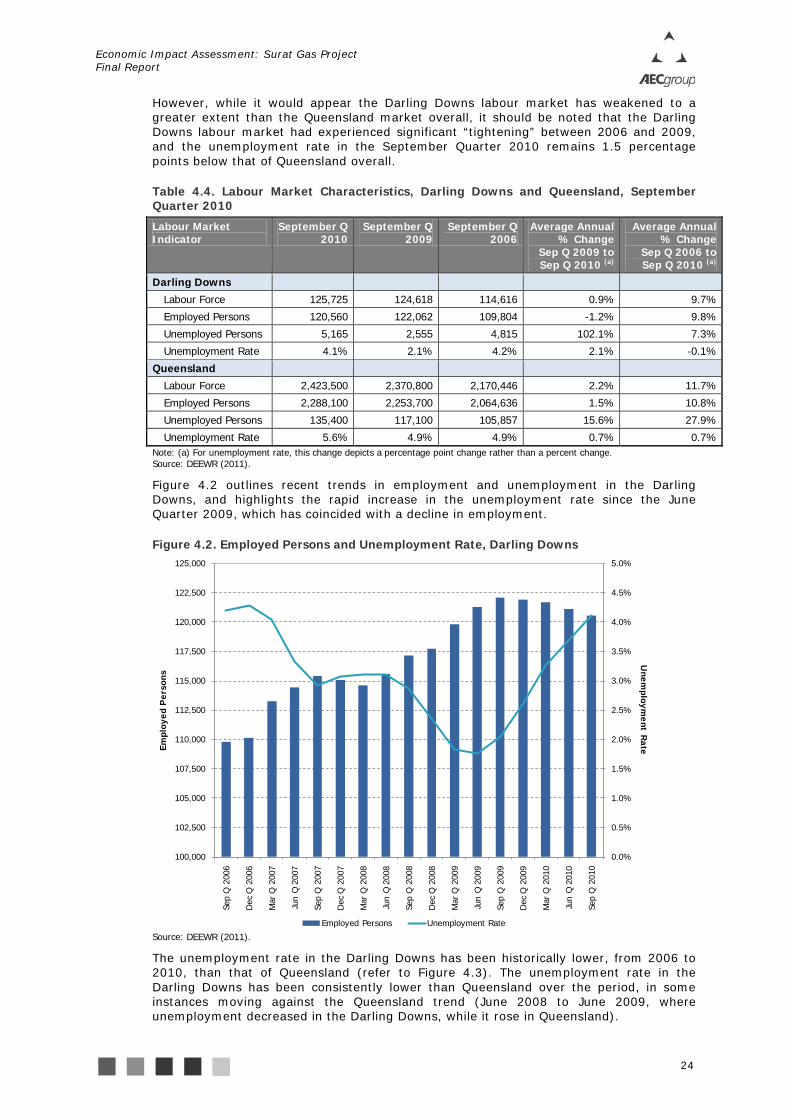
Economic Impact Assessment: Surat Gas Project Final Report
24
However, while it would appear the Darling Downs labour market has weakened to a greater extent than the Queensland market overall, it should be noted that the Darling Downs labour market had experienced significant “tightening” between 2006 and 2009, and the unemployment rate in the September Quarter 2010 remains 1.5 percentage points below that of Queensland overall.
Table 4.4. Labour Market Characteristics, Darling Downs and Queensland, September Quarter 2010
Labour Market Indicator
September Q 2010
September Q 2009
September Q 2006
Average Annual % Change
Sep Q 2009 to Sep Q 2010 (a)
Average Annual % Change
Sep Q 2006 to Sep Q 2010 (a)
Darling Downs
Labour Force 125,725 124,618 114,616 0.9% 9.7%
Employed Persons 120,560 122,062 109,804 -1.2% 9.8%
Unemployed Persons 5,165 2,555 4,815 102.1% 7.3%
Unemployment Rate 4.1% 2.1% 4.2% 2.1% -0.1%
Queensland
Labour Force 2,423,500 2,370,800 2,170,446 2.2% 11.7%
Employed Persons 2,288,100 2,253,700 2,064,636 1.5% 10.8%
Unemployed Persons 135,400 117,100 105,857 15.6% 27.9%
Unemployment Rate 5.6% 4.9% 4.9% 0.7% 0.7% Note: (a) For unemployment rate, this change depicts a percentage point change rather than a percent change. Source: DEEWR (2011).
Figure 4.2 outlines recent trends in employment and unemployment in the Darling Downs, and highlights the rapid increase in the unemployment rate since the June Quarter 2009, which has coincided with a decline in employment.
Figure 4.2. Employed Persons and Unemployment Rate, Darling Downs
Source: DEEWR (2011).
The unemployment rate in the Darling Downs has been historically lower, from 2006 to 2010, than that of Queensland (refer to Figure 4.3). The unemployment rate in the Darling Downs has been consistently lower than Queensland over the period, in some instances moving against the Queensland trend (June 2008 to June 2009, where unemployment decreased in the Darling Downs, while it rose in Queensland).
0.0%
0.5%
1.0%
1.5%
2.0%
2.5%
3.0%
3.5%
4.0%
4.5%
5.0%
100,000
102,500
105,000
107,500
110,000
112,500
115,000
117,500
120,000
122,500
125,000
Sep
Q 2
006
Dec
Q 2
006
Mar
Q 2
007
Jun
Q 2
007
Sep
Q 2
007
Dec
Q 2
007
Mar
Q 2
008
Jun
Q 2
008
Sep
Q 2
008
Dec
Q 2
008
Mar
Q 2
009
Jun
Q 2
009
Sep
Q 2
009
Dec
Q 2
009
Mar
Q 2
010
Jun
Q 2
010
Sep
Q 2
010
Unem
ployment R
ateEmpl
oyed
Per
sons
Employed Persons Unemployment Rate

Economic Impact Assessment: Surat Gas Project Final Report
25
This discrepancy between June 2008 and June 2009 highlights the importance of mining and gas exploration in the Darling Downs in recent years for supporting economic and employment growth, and has insulated the economy to some degree from recent economic events (refer to section 4.3).
Figure 4.3. Darling Downs and Queensland Unemployment Rates
Source: DEEWR (2011).
Figure 4.4 outlines recent trends in the unemployment rate for each of the LGAs within the Darling Downs, and shows that with the exception of the Southern Downs LGA, which has been consistently 0.5 to 1.5 percentage points higher than the Darling Downs overall, unemployment has trended along the same path as that of the Darling Downs between the September Quarter 2006 and September Quarter 2010.
0.0%
0.5%
1.0%
1.5%
2.0%
2.5%
3.0%
3.5%
4.0%
4.5%
5.0%
5.5%
6.0%Se
p Q
200
6
Dec
Q 2
006
Mar
Q 2
007
Jun
Q 2
007
Sep
Q 2
007
Dec
Q 2
007
Mar
Q 2
008
Jun
Q 2
008
Sep
Q 2
008
Dec
Q 2
008
Mar
Q 2
009
Jun
Q 2
009
Sep
Q 2
009
Dec
Q 2
009
Mar
Q 2
010
Jun
Q 2
010
Sep
Q 2
010
Une
mpl
oym
ent
Rat
e
Darling Downs Queensland

Economic Impact Assessment: Surat Gas Project Final Report
26
Figure 4.4. Darling Downs and Sub-Regions Unemployment Rates
Source: DEEWR (2011).
The information presented above is based on place of usual residence, and thereby does not include imported labour. As outlined in section 4.2.1, the Darling Downs and Surat Basin has experienced a considerable increase in the amount of skilled labour imported to the region as a result of growing exploration and development of energy resources. As a result, it is expected that the data outlined above likely under-represents the number of employees active in the Darling Downs at present.
4.2.3.2 Employment by Industry
According to 2006 Census data (refer to Appendix G), agriculture, forestry and fishing was the largest employing industry in the Darling Downs in 2006, accounting for 12.2% of all employment. Retail trade (12.1%), health care and social assistance (11.2%) and manufacturing (10.7%) were the next largest employers in the region in 2006.
However, 2006 Census data does not provide an appropriate description of the Darling Downs employment structure, as significant mining and gas activity has resulted in a considerable increase in employment in this industry. In 2006, mining was the smallest employing industry in the Darling Downs, accounting for just 0.7% of total employment in the region, but anecdotal evidence suggests the industry is now one of the larger employers in the Darling Downs.
To overcome this issue of out-dated employment by industry data, indicative employment estimates were developed for 2009-10 in full time equivalent (FTE)4
Table 4.5 terms
based on estimates of GRP by industry and gross value add per employee. outlines these indicative estimates of employment, and highlights:
• Agriculture, forestry and fishing (along with public administration and safety) was the largest employing industry in the Darling Downs in 2009-10, accounting for 11.4% of total employment. This is representative of the historic contribution of the agriculture sector to the regional economy;
• Construction is the third largest employing industry in the Darling Downs, in keeping with the considerable development activity the region has experienced in recent years;
4 Where one full time equivalent employee is equivalent to one person working full time for one year.
0.0%
0.5%
1.0%
1.5%
2.0%
2.5%
3.0%
3.5%
4.0%
4.5%
5.0%
5.5%
6.0%
Sep
Q 2
006
Dec
Q 2
006
Mar
Q 2
007
Jun
Q 2
007
Sep
Q 2
007
Dec
Q 2
007
Mar
Q 2
008
Jun
Q 2
008
Sep
Q 2
008
Dec
Q 2
008
Mar
Q 2
009
Jun
Q 2
009
Sep
Q 2
009
Dec
Q 2
009
Mar
Q 2
010
Jun
Q 2
010
Sep
Q 2
010
Une
mpl
oym
ent
Rat
e
Toowoomba LGA Western Downs LGASouthern Downs LGA Goondiwindi LGADarling Downs

Economic Impact Assessment: Surat Gas Project Final Report
27
• Mining, which was the smallest employing industry in 2006 (refer to Appendix G), is estimated to have been the sixth largest employing industry in the Darling Downs in 2009-10, accounting for 6.8% of all employment; and
• Manufacturing and education and training were the fourth (10.7%) and fifth (9.1%) largest employing industries in 2006 (refer to Appendix G), however, in 2009-10 these industries were estimated to have employed a considerably smaller proportion of total employment (6.7% and 4.5%, respectively). The decline in the manufacturing sector may be reflective of some similar skill sets to those required for the construction of mining and gas related infrastructure, as well as cessation of some manufacturing operations such as KR Castlemaine’s factory in Toowoomba.
Table 4.5. Indicative FTE Employment by Industry Distribution (by Place of Work), Darling Downs and Queensland, 2009-10
Industry Darling Downs SD
Queensland Location Quotients (b)
Public administration and safety 11.4% 6.3% 1.82
Agriculture, forestry and fishing 11.4% 3.5% 3.27
Construction 10.2% 11.9% 0.85
Retail trade 9.9% 9.9% 1.00
Health care and social assistance 8.9% 11.2% 0.79
Mining 6.8% 2.0% 3.36
Manufacturing 6.7% 8.7% 0.77
Wholesale trade 6.5% 4.2% 1.52
Accommodation and food services 5.1% 5.6% 0.90
Transport, postal and warehousing 4.6% 5.4% 0.85
Education and training 4.5% 6.9% 0.66
Professional, scientific and technical services 3.5% 7.9% 0.44
Other services 2.8% 3.9% 0.73
Electricity, gas, water and waste services 2.6% 1.1% 2.31
Administrative and support services 1.7% 3.2% 0.52
Financial and insurance services 1.7% 2.7% 0.61
Rental, hiring and real estate services 0.8% 2.1% 0.39
Arts and recreation services 0.7% 1.5% 0.43
Information media and telecommunications 0.4% 1.8% 0.24
Total Employment (a) 102,094 1,887,644 - Note: (a) The discrepancy in total employment estimates in this table and in Table 4.4 is due to the a combination of: This table uses Place of Work rather than Place of Usual Residence data; The estimates in this table are Full Time Equivalents (FTE); and each estimate is based off a different data set, and methodological discrepancies contribute to some differences in estimates. (b) Location Quotient represents Darling Downs percent contribution divided by Queensland percent contribution and represents the relative strength of each industry compared to Queensland as a benchmark. Source: AECgroup.
Figure 4.5 shows the location of employment by industry within the Darling Downs, and highlights that Toowoomba LGA is the primary place of employment, in particular for service-based industries.

Economic Impact Assessment: Surat Gas Project Final Report
28
Figure 4.5. Employment by Industry (FTE), Darling Downs and Sub-Regions, 2009-10
Source: AECgroup.
4.2.3.3 Employment by Occupation
As with employment by industry, 2006 Census data (which is the most up-to-date estimate of employment by occupation) is not considered to provide an appropriately complete picture of existing employment demands and skills in the Darling Downs. To assist in overcoming this issue of out-dated employment by occupation data, indicative estimates of employment by occupation in 2009-10 were developed5
Table 4.6
.
summarises these employment by occupation estimates for 2009-10, and highlights that the occupation grouping of managers is the largest employment grouping in the Darling Downs (16.9%), followed by professionals (16.1%) and technicians and trade workers (14.2%). By comparison, clerical and administrative workers (18.3%) is the largest occupational group in Queensland, followed by professionals (16.4%) and community and personal service workers (15.7%). The disparity in occupational groupings between the Darling Downs and Queensland reflects the stronger employment focus in the agriculture, forestry and fishing and mining industries.
5 These employment estimates have been developed using the employment by industry estimates outlined in section 4.2.3.2, combined with 2006 Census employment by industry by occupation data (to identify percent demands for certain occupations by industry).
0 2,000 4,000 6,000 8,000 10,000 12,000 14,000
Information media and telecommunications
Arts and recreation services
Rental, hiring and real estate services
Financial and insurance services
Administrative and support services
Electricity, gas, water and waste services
Other services
Professional, scientific and technical services
Education and training
Transport, postal and warehousing
Accommodation and food services
Wholesale trade
Manufacturing
Mining
Health care and social assistance
Retail trade
Construction
Agriculture, forestry and fishing
Public administration and safety
Number of Employees
Toowoomba
Western Downs
Southern Downs
Goondiwindi

Economic Impact Assessment: Surat Gas Project Final Report
29
Table 4.6. Indicative FTE Employment by Occupation Distribution (by Place of Work), Darling Downs and Queensland, 2009-10
Occupation Darling Downs SD
Queensland Location Quotients (b)
Managers 16.9% 12.5% 1.35
Professionals 16.1% 16.4% 0.98
Technicians & Trade Workers 14.2% 11.5% 1.24
Community & Personal Service Workers 13.9% 15.7% 0.89
Clerical & Administrative Workers 12.3% 18.3% 0.67
Sales Workers 10.8% 7.4% 1.45
Machinery Operators & Drivers 8.4% 9.4% 0.89
Labourers 7.5% 8.8% 0.85
Total Employment (a) 102,094 1,887,644 - Note: (a) The discrepancy in total employment estimates in this table and in Table 4.4 is due to the a combination of: This table uses Place of Work rather than Place of Usual Residence data; The estimates in this table are Full Time Equivalents (FTE); and Each estimate is based off a different data set, and methodological discrepancies contribute to some differences in estimates. (b) Location Quotient represents Darling Downs percent contribution divided by Queensland percent contribution and represents the relative strength of each industry compared to Queensland as a benchmark. Source: ABS (2007), AECgroup.
Figure 4.6 shows the location of employment by occupation within the Darling Downs. The figure shows that the Western Downs LGA, Southern Downs LGA and Goondiwindi LGA have a high proportion of managers, while Toowoomba LGA is the primary centre of employment for white collar occupations.
Figure 4.6. Employment by Occupation (FTE), Darling Downs and Sub-Regions, 2009-10
Source: ABS (2007), AECgroup.
4.2.3.4 Existing Skills Shortages
Energy Skills Queensland (ESQ) have undertaken considerable research in understanding and identifying key skills required in the coal seam gas (CSG) and LNG industries and existing shortages in these skills in Queensland. ESQ (2009b) identified the following occupations likely to be demanded by the CSG industry as experiencing critical skills shortages:
• Chemical engineers; • Civil engineers; • Mechanical engineers; • Petroleum engineers; • Electrical engineers; • Civil engineers; • Production engineers; • Engineering managers;
• Geosciences/ geologists; • Production managers; • General and specialist electricians; • Process plant operators; • Fitters; • Drillers; and • Transport and logistics tradespersons.
0 5,000 10,000 15,000 20,000
Community & Personal Service Workers
Sales Workers
Machinery Operators & Drivers
Professionals
Clerical & Administrative Workers
Labourers
Technicians & Trade Workers
Managers
Number of Employees
ToowoombaWestern DownsSouthern DownsGoondiwindi

Economic Impact Assessment: Surat Gas Project Final Report
30
In addition to current State-wide shortages in skilled labour to service the CSG industry, DEEWR (2010) identify the Queensland construction industry as currently experiencing a range of skills shortages, in particular in regional areas of Queensland.
Consultation with ESQ and local economic development organisations identified that training programs have and are being put in place to assist in meeting the skills requirements of both CSG and LNG projects. The programs will address skills shortages in both construction and operations phases of projects.
4.2.3.5 Average Individual Incomes by Industry
The most recent data on average incomes by industry at a local government level is from the 2006 Census, however, as with employment data this is considered too out-dated to be a relevant estimate of existing incomes in the region. To provide a more up-to-date estimate of incomes, 2006 Census data has been inflated to 2010 values based on growth in earnings by industry at a national level for each industry (ABS, 2011b).
Table 4.7 summarises these estimates of average weekly incomes by industry, and highlights an average weekly income in the Darling Downs of $933 in 2010. This is approximately 5.5% less than the estimated average weekly wage received in Queensland ($987) in 2010. However, Census 2006 data suggests this discrepancy between Darling Downs and Queensland was considerably higher in 2006 (difference of 11.3%, refer to Appendix G), and the “closing of the gap” can largely be attributed to the significant increase in high paying mining jobs.
The Western Downs LGA ($980) and Toowoomba LGA ($957) are estimated to have the highest average earnings for residents within the Darling Downs.

Economic Impact Assessment: Surat Gas Project Final Report
31
Table 4.7. Estimated Average Individual Weekly Income by Industry, Darling Downs and Sub-Regions, 2010
Industry Toowoomba LGA
Western Downs LGA
Southern Downs LGA
Goondiwindi LGA
Darling Downs SD
Queensland
Mining $1,812 $1,607 $1,515 $1,436 $1,757 $2,046
Electricity, gas, water and waste services $1,486 $1,427 $1,319 $1,331 $1,455 $1,509
Public administration and safety $1,238 $985 $1,068 $994 $1,180 $1,224
Construction $1,071 $1,321 $893 $1,038 $1,080 $1,200
Professional, scientific and technical services $1,108 $1,063 $979 $973 $1,078 $1,304
Financial and insurance services $1,095 $1,018 $999 $977 $1,078 $1,218
Rental, hiring and real estate services $1,013 $1,203 $921 $916 $998 $1,071
Information media and telecommunications $1,016 $1,089 $893 $700 $987 $1,152
Education and training $1,005 $888 $937 $993 $984 $993
Transport, postal and warehousing $932 $840 $848 $863 $901 $1,020
Health care and social assistance $866 $788 $760 $746 $842 $895
Wholesale trade $830 $831 $626 $912 $808 $927
Manufacturing $812 $792 $701 $742 $793 $936
Other services $738 $676 $622 $807 $720 $813
Agriculture, forestry and fishing $708 $686 $630 $836 $706 $734
Administrative and support services $689 $636 $632 $728 $673 $809
Retail trade $588 $595 $585 $650 $590 $611
Arts and recreation services $580 $529 $570 $427 $581 $683
Accommodation and food services $459 $486 $476 $497 $470 $540
Average All Industries $957 $980 $783 $884 $933 $987 Source: ABS (2007), ABS (2011b).

Economic Impact Assessment: Surat Gas Project Final Report
32
4.2.4 Residential Property Market Characteristics
4.2.4.1 Residential Building Approvals
There were a total of 1,549 residential buildings approved in the Darling Downs in 2010, with a combined value of $436.7 million. This represented a 3.0% increase in the number of residential building approvals from 2009. The total value for residential building approvals also increased in the Darling Downs in 2010 compared to 2009, by 13.3%.
Figure 4.7 displays recent (past five years) trends in residential building approvals in the Darling Downs, and highlights that the number of approvals declined between 2006 and 2008, with global economic factors such as the financial crisis likely contributing to this decline. The number of approvals have since increased in response to existing strong labour demand and inward migration, as well as anticipated future resident and transient population growth attracted by resource developments in the Surat Basin.
Figure 4.7. Residential Building Approvals and Value, Darling Downs
Source: ABS (2011c).
Table 4.8 summarises recent trends in residential building approvals within the sub-regions of the Darling Downs as well as for Queensland. The table shows that while both Darling Downs and Queensland recorded growth in the number of approvals in the past year, comparison to four years ago and the five year average indicates that the Darling Downs has recovered more strongly than Queensland since 2008.
Toowoomba LGA, as the primary population and service centre of the Darling Downs, accounts for the largest share of residential building approvals, and in 2010 comprised almost two thirds of total residential building approvals in the Darling Downs. However, in line with the LGAs of Southern Downs and Goondiwindi, the number of residential building approvals in Toowoomba LGA in 2010 was less than a year ago (2009), four years ago (2006) and the five year average (2006 to 2010). By comparison, Western Downs LGA recorded considerably more residential building approvals in 2010 than across all three comparison periods, and is likely a reflection of strong demand for additional housing in the local area.
0
200
400
600
800
1,000
1,200
1,400
1,600
1,800
2,000
$0
$50
$100
$150
$200
$250
$300
$350
$400
$450
$500
YE Dec 06 YE Dec 07 YE Dec 08 YE Dec 09 YE Dec 10
Num
ber of Approvals
Val
ue o
f A
ppro
vals
($M
)
Value of Approvals ($M) Number of Approvals

Economic Impact Assessment: Surat Gas Project Final Report
33
Table 4.8. Residential Building Approvals and Values, Darling Downs and Sub-Regions, 2006 to 2010
Region YE Dec 2010 % Annual Change
% Change From Four Years Ago
(2006)
% Change From Five Year
Average
Number of Approvals
Toowoomba LGA 1,013 -1.1% -14.8% -1.4%
Western Downs LGA 311 60.3% 52.5% 69.9%
Southern Downs LGA 200 -22.8% -27.3% -18.5%
Goondiwindi LGA 25 -7.4% -54.5% -39.3%
Darling Downs 1,549 3.0% -10.1% 3.5%
Queensland 30,689 6.9% -20.7% -14.3%
Value of Approvals ($M)
Toowoomba LGA $277.9 8.2% 10.0% 10.7%
Western Downs LGA $82.1 56.5% 102.6% 83.7%
Southern Downs LGA $66.7 2.0% 24.4% 13.1%
Goondiwindi LGA $9.9 -8.3% -22.8% -21.3%
Darling Downs $436.7 13.3% 21.4% 18.8%
Queensland $8,864.3 7.2% -7.3% -10.6%
Average Value per Approval ($)
Toowoomba LGA $274,348 9.4% 29.2% 12.3%
Western Downs LGA $264,003 -2.4% 32.9% 8.1%
Southern Downs LGA $333,610 32.1% 71.0% 38.8%
Goondiwindi LGA $397,400 -0.9% 69.9% 29.7%
Darling Downs $281,909 10.0% 35.1% 14.9%
Queensland $288,842 0.3% 16.9% 4.4% Source: ABS (2011c).
4.2.4.2 Residential Property Sales and Values
There were 2,170 house sales in the Darling Downs in 2010, a fall of over one quarter from 2009 (decline of 27.1%) and 17.4% fewer than in 2006 (refer to Table 4.9). A similar annual decline in sales was experienced for units/ townhouses, down 28.4% from 2009 to 353 sales, although when compared to 2005 this represented an increase in sales of units/ townhouses of 33.2%. Demand for vacant land also decreased between 2009 and 2010.
The median sales price for houses in the Darling Downs was $284,700 in 2010, up 4.9% from 2009 and 34.4% higher than five years earlier (2005). Median sales prices for units/ townhouses, vacant land and large rural vacant land also all increased in the past year as well as over the five year period throughout the Darling Downs.
When comparing growth in sales prices for property in the Darling Downs to benchmark regional areas such as Gladstone, Rockhampton, Mackay and Bundaberg, it can be seen that overall property price growth in the Darling Downs has generally been lower than in Gladstone and Rockhampton, where considerable construction activity has been undertaken. The trend in the Darling Downs is more in line with the experiences of Mackay and Bundaberg LGAs. The Western Downs LGA has been the notable exception to this (and to a lesser degree, the Southern Downs LGA), with property prices in the Western Downs LGA increasing well above the Darling Downs average, in particular for vacant land and large rural vacant land for which prices have more than doubled since 2005. The strong growth in property prices in the Western Downs LGA highlights the recent high level of energy resource exploration and development of major projects in the region, and demand for housing this has generated.

Economic Impact Assessment: Surat Gas Project Final Report
34
Table 4.9. Property Sales and Values, Darling Downs and Sub-Regions Compared to Benchmark Regions, 2006 to 2010
Region Number of Sales Sales Price
Number of Sales
Annual % Change
% Change From 5
Years Ago
Median Sales
Price ($)
Annual % Change
% Change From 5
Years Ago
Houses
Toowoomba LGA 1,608 -30.1% -15.1% $295,750 5.6% 28.6%
Western Downs LGA 212 -30.9% -27.6% $265,000 8.2% 76.7%
Southern Downs LGA 286 10.4% -20.3% $245,000 4.3% 40.0%
Goondiwindi LGA 64 -43.4% -22.0% $250,000 -0.6% 42.9%
Darling Downs 2,170 -27.1% -17.4% $284,700 4.9% 34.4%
Gladstone LGA 755 13.2% 13.5% $385,000 7.2% 67.4% Rockhampton LGA 1,007 -30.3% -30.9% $318,000 3.7% 68.7% Mackay LGA 1,167 -9.3% -16.0% $407,250 5.8% 34.9% Bundaberg LGA 924 -22.9% 21.4% $285,000 3.6% 32.6% Units/ Townhouses
Toowoomba LGA 316 -29.5% 19.2% $240,000 6.7% 21.5%
Western Downs LGA 23 -14.8% N/a $289,000 1.4% N/a
Southern Downs LGA 14 -22.2% N/a $249,900 7.3% 58.7%
Darling Downs 353 -28.4% 33.2% $243,600 6.6% N/a
Gladstone LGA 155 59.8% 78.2% $340,000 13.3% 106.1% Rockhampton LGA 181 -14.2% 110.5% $284,500 3.5% 63.5% Mackay LGA 205 -31.2% -28.8% $309,000 4.7% 41.1% Bundaberg LGA 166 -25.2% 124.3% $251,350 -4.2% 16.9%
Vacant Land
Toowoomba LGA 288 -39.9% 33.3% $135,000 6.3% 40.6%
Western Downs LGA 80 -44.4% N/a $117,500 6.9% 161.1%
Southern Downs LGA 84 -19.2% N/a $92,000 2.3% 67.3%
Goondiwindi LGA 18 -21.7% N/a $80,000 6.7% 39.1%
Darling Downs 470 -37.3% N/a $122,200 4.5% N/a
Gladstone LGA 286 100.0% N/a $180,000 0.0% 74.8% Rockhampton LGA 302 -13.5% N/a $138,000 -4.8% 30.2% Mackay LGA 317 -35.0% N/a $183,000 5.8% 35.6% Bundaberg LGA 206 -17.3% N/a $140,000 3.7% 27.3% Large Rural Vacant Land
Toowoomba LGA 192 7.9% N/a $159,500 -0.3% 35.7%
Western Downs LGA 98 -44.3% N/a $99,000 10.0% 209.4%
Southern Downs LGA 79 -7.1% N/a $149,500 3.1% 73.8%
Darling Downs 369 -15.9% N/a $141,300 9.5% N/a
Gladstone LGA 121 33.0% N/a $200,000 0.0% 66.7% Rockhampton LGA 76 -9.5% N/a $205,000 2.5% 122.8% Mackay LGA 58 -1.7% N/a $271,000 8.4% 35.6% Bundaberg LGA 121 -29.2% N/a $150,000 3.4% 74.4% Note: Property sales and value data for Goondiwindi is not available for Units/ Townhouses and Large Rural Vacant Land. Source: REIQ (2011).
4.2.4.3 Residential Rental Market
There were 6,150 new bonds lodged for houses in the Darling Downs in 2010, slightly fewer than in 2009 (decline of 0.6%), but 4.9% more than in 2006 (refer to Table 4.10). The average weekly rent for houses in the Darling Downs was $275 in 2010, up 5.0% from 2009 and 29.1% higher than four years earlier (2006). Average weekly rents for flats in the Darling Downs were $204 in 2010, and have increased at a similar rate to houses (5.6% growth since 2009, 31.6% since 2006).

Economic Impact Assessment: Surat Gas Project Final Report
35
Consultation with real estate agents and local economic development organisations indicates that the Darling Downs is experiencing a tight rental market and housing shortages, in particular in Western Downs and Southern Downs LGAs, in part due to the influx of mining and gas exploration and development workers. This is borne out to some degree by the higher increase in the average weekly rent for houses and flats in the Western Downs and Southern Downs LGAs than most benchmark regional centres such as Gladstone, Rockhampton, Mackay and Bundaberg.
Table 4.10. Rental Bonds Lodged and Average Weekly Rent, Darling Downs and Sub-Regions Compared to Benchmark Regions, 2006 to 2010
Region Number of Bonds Lodged Average Weekly Rent ($)
YE Dec 2010
% Annual Change
% Change From Four Years Ago
(2006)
YE Dec 2010
% Annual Change
% Change From Four Years Ago
(2006)
Houses
Toowoomba LGA 3,873 -6.5% -4.3% $281 6.0% 26.9%
Western Downs LGA 1,062 20.8% 54.8% $294 -0.8% 31.4%
Southern Downs LGA 1,013 6.2% 15.9% $243 5.4% 37.5%
Goondiwindi LGA 202 -6.0% -21.1% $236 -0.2% 22.7%
Darling Downs 6,150 -0.6% 4.9% $275 5.0% 29.1%
Gladstone LGA 1,687 5.4% 8.9% $332 0.8% 31.4% Rockhampton LGA 1,704 2.6% -2.7% $290 1.3% 34.1% Mackay LGA 2,324 0.8% 9.2% $410 4.5% 22.5% Bundaberg LGA 2,169 -1.7% 9.0% $274 3.2% 24.0% Flats
Toowoomba LGA 2,235 1.5% -7.3% $209 5.4% 30.6%
Western Downs LGA 300 -3.8% 27.7% $228 4.8% 62.5%
Southern Downs LGA 330 10.7% 9.6% $189 14.0% 45.4%
Goondiwindi LGA 147 -9.3% -19.7% $159 3.8% 19.2%
Darling Downs 3,012 1.3% -3.7% $204 5.6% 31.6%
Gladstone LGA 844 4.1% -9.7% $240 -1.8% 34.6% Rockhampton LGA 1,202 20.8% 20.8% $219 2.7% 38.8% Mackay LGA 1,563 -1.6% 28.1% $307 2.7% 35.5% Bundaberg LGA 1,026 2.4% 25.7% $209 1.5% 31.2% Source: RTA (2011).
Within the Darling Downs, growth in average weekly rent has been highest in the Western Downs and Southern Downs LGAs, in keeping with the proximity of towns in these LGAs with major mining and gas exploration activities. The Western Downs and Southern Downs LGAs have also seen an increase in the number of bonds lodged, indicating an increase in supply of rental accommodation, which has been driven by investors purchasing dwellings in the region to yield rental returns. Consultation with local real estate agents indicates that rental vacancy rates are currently less than 1% in the Western Downs LGA, primarily driven by demand from contractors to gas and coal developments in the region.
4.2.5 Non-Residential Property Market Characteristics
4.2.5.1 Non-Residential Building Approvals
Total non-residential building approvals in the Darling Downs in 2010 were valued at $236.5 million, a decrease of 11.9% from the 2009 value ($268.3 million). Figure 4.8 displays recent trends in non-residential building approvals and shows the value of non-residential building approvals in the Darling Downs declined during 2007 and 2008 to $158.3 million and $150.6 million, respectfully. Since 2008, where the value of non-residential building approvals were at their lowest over the past 5 years, the value of approvals has increased by 57.0% to its 2010 levels.

Economic Impact Assessment: Surat Gas Project Final Report
36
Figure 4.8. Non-Residential Building Approval Value, Darling Downs
Source: ABS (2011c).
Table 4.11 outlines trends over the past five years in the value of non-residential building approvals within the Darling Downs and Queensland, and shows that overall the Darling Downs’ recovery since 2008 is in contrast to the experience of Queensland overall. This recovery has been primarily driven by development approvals in the Western Downs, Southern Downs and Goondiwindi LGAs.
Table 4.11. Non-Residential Building Approval Values, Darling Downs and Sub-Regions, 2006 to 2010
Region YE Dec 2010 ($M)
% Annual Change
% Change From Four Years Ago
(2006)
% Change From Five Year
Average
Toowoomba LGA $147.5 -17.4% -19.8% -0.8%
Western Downs LGA $29.1 -15.6% 98.0% 22.5%
Southern Downs LGA $51.2 12.5% 286.5% 84.1%
Goondiwindi LGA $8.7 -12.1% 166.3% 58.0%
Darling Downs $236.5 -11.9% 9.9% 14.9%
Queensland $5,869.4 -34.0% -5.3% -22.0% Source: ABS (2011c).
4.2.5.2 Current Major Developments Underway in the Region
The Darling Downs has a significant number of projects currently proposed and / or being investigated for development over the next five years. Table 2.2 (in section 2.3.4) outlines the range of significant projects located wholly or partly within the Darling Downs, as declared by the Queensland Government. As can be seen from this list of projects, there is significant interest in developing energy resources in the Surat Basin, as well as additional rail and pipeline infrastructure to transport coal and gas to export facilities.
Where the significant interest in energy and other projects is progressed to the point of on-ground activity, demand for construction labour and resources is likely to increase considerably within the Darling Downs, which may affect the ability of other projects to source appropriately skilled workers and will likely place upward pressure on labour prices.
$0
$50
$100
$150
$200
$250
$300
YE Dec 06 YE Dec 07 YE Dec 08 YE Dec 09 YE Dec 10
Val
ue o
f A
ppro
vals
($M
)

Economic Impact Assessment: Surat Gas Project Final Report
37
4.3 Current Economic Trends Influencing the Region
4.3.1 Climatic Conditions and Rural Downturn
Climatic and seasonal conditions have a large impact on the performance and outlook for the Darling Downs economy given the significance of agriculture in the region and its reliance on weather patterns. In the past decade many agricultural producers in the region have been severely affected by drought conditions. Between 2000 and 2009, parts of Toowoomba Regional Council, Western Downs Regional Council and Southern Downs Regional Council were either partially or fully drought declared, while parts of Goondiwindi Regional Council were drought declared between 2002 and 2009 (DERM, 2011b).
Rainfalls in 2009 and 2010 resulted in the drought declared status in the Darling Downs easing, with only Toowoomba Regional Council and part of Southern Downs Regional Council drought declared in December 2010. However, in late December 2010 and January 2011 the Darling Downs recorded a number of heavy rainfalls causing severe flooding events, with the damage caused significant enough that the region was officially declared a disaster zone.
The impact of the drought between 2000 and 2009 is reflected in the financial position of broadacre farms in the region. ABARE (2009) undertook an assessment of financial performance of broadacre farms based on farm surveys within ABARE’s survey region of the “Eastern Darling Downs”, which covers the Toowoomba Regional Council area, as well as the northern part of the Southern Downs Regional Council area (town of Warwick) and eastern part of the Western Downs Regional Council area (Dalby). A summary of the survey findings are presented in Table 4.12, which shows that broadacre farm business profit was negative for two of the three years between 2006-07 and 2008-09. More than half the broadacre farm operations in the region recorded losses in all three years, peaking in 2006-07 with 88% of broadacre farms recording losses. This has resulted in a steady increase in farm debt over the three years, from an average debt of $533,080 in 2006-07 to $712,000 in 2008-09.
Table 4.12. Financial Performance of Broadacre Farms in Eastern Darling Downs (a)
Financial Performance 2006-07 2007-08 2008-09
Average Farm Cash Income $46,710 $101,700 $84,000
% of Farms with Negative Farm Cash Income 49% 36% 38%
Average Farm Business Profit/ Loss -$76,110 $71,900 -$18,000
% of Farms with Negative Farm Business Profit 88% 57% 73%
Farm Debt $533,080 $697,700 $712,000 Note: (a) The Eastern Darling Downs covers the Toowoomba Regional Council area, as well as the northern part of the Southern Downs Regional Council area (town of Warwick) and eastern part of the Western Downs Regional Council area (Dalby). Source: ABARE (2009).
A decade of drought conditions has impacted on farm business viability in the Darling Downs, increasing debt levels held by farmers. Decent rainfalls in late 2009 and 2010 provided some hope to farmers of recording high yields and reversing the trend of recent years, however, severe flooding events in late December 2010 and January 2011 have resulted in significant losses to grain crops as well as to the dairy industry through supply chain impacts (DPIF, 2011).
4.3.2 Gas Exploration and Approval of Gas Field Development for LNG Production
The Surat Basin region is a key contributor to the development of the resource and energy sectors on a regional, national and global level with approximately 20% of Queensland’s coal resources and 65% of Queensland’s coal-seam-gas reserves (QRC, 2009; Geoscience Australia and ABARE, 2010).
The abundance of energy resources located in the Surat Basin, combined with strong global energy demand and high LNG prices, has prompted significant investment interest by major resource organisations such as Arrow, Origin, Santos, Queensland Gas Company (QGC)/ British Gas, as well as some other smaller organisations.

Economic Impact Assessment: Surat Gas Project Final Report
38
Early phase exploration and development activity in the Surat Basin, along with a range of developments in other industries, has contributed to a tightening in labour and housing markets in the Darling Downs, as well as further west in the South West SD (e.g., Maranoa region). Recent impacts on these markets are examined in sections 4.2.3 and 4.2.4.
The Queensland Government has approved (subject to a number of conditions) the following three proposed multi-billion dollar LNG projects in Gladstone:
• QGC/ BG’s Queensland Curtis LNG Project (QCLNG Project);
• Santos/ Petronas’ Gladstone LNG Project (GLNG Project); and
• Origin/ ConocoPhillips’ Australia Pacific LNG Project (APLNG Project).
All three of these projects propose to develop gas fields in the Surat Basin to supply part or all of the gas required for LNG production. A brief summary of each of the three projects, as presented in the relevant EIS documents, is provided below. Please note that delays in timing of Financial Investment Decisions for these projects may impact on timings outlined below.
According to EIS and Supplementary EIS documentation (QGC, 2009; QGC, 2010), the QCLNG project includes the following principal project components:
QCLNG Project
• Development of approximately 6,000 gas production wells in the Surat Basin with associated infrastructure over the life of the project. Initially 1,000 to 1,500 wells will be developed across the gas field by mid 2014. The remaining wells will be phased in over the life of the project (20 to 30 years) to replace declining wells and maintain gas production;
• Development, construction, operation and decommissioning of a gas pipeline network of approximately 730 km to link the gas field and other nearby CSG resources to the LNG facility in Gladstone; and
• Staged development of a LNG facility with total capacity 12 Mtpa and an export terminal on Curtis Island. The LNG facility will be developed in three trains, with each train having a capacity of 4 Mtpa.
Construction/ development of the gas field was estimated in the EIS and Supplementary EIS documentation to commence in late 2010 and be ongoing throughout the life of the project. Key elements of the construction/ gas field development workforce include:
• Approximately 1,000 workers by January 2011, increasing steadily to a peak of approximately 4,900 construction workers in the Western Downs in late 2011/ early 2012, made up of:
o 100 locals;
o 400 workers from the broader Darling Downs; and
o 4,400 workers imported to the region;
• Construction workforce estimated to steadily decline to less than 3,000 workers by November 2012, 1,500 workers by April 2013, and around 750 by late 2013; and
• Proportion of imported workers is expected to be highest at peak labour demand.
The operational workforce for the gas fields is anticipated to steadily ramp up from around 200 employees in 2010 to 530 employees in 2014 (this excludes gas well drilling and maintenance staff that are included in the construction estimate).
Post 2014-15, construction of gathering systems and field compression stations will continue until 2025 with peaks and troughs in labour demand in line with anticipated development and commissioning of LNG trains. Combined construction and operation staff is estimated to reach a peak of approximately 1,000 workers during 2015, some 2,000 workers during 2018-19 and approximately 1,000 workers during 2022-23.
The additional jobs in the Western Downs region (and broader Darling Downs) resulting from the QCLNG Project will place pressures on a range of existing infrastructure, services and facilities, as well as on housing availability and affordability. Tightening in

Economic Impact Assessment: Surat Gas Project Final Report
39
some markets is already being witnessed in the Western Downs (refer to section 4.2.4), and as this project progresses these impacts will likely accentuate.
According to EIS and Supplementary EIS documentation (Santos, 2009a and 2009b), the GLNG project includes the following principal project components:
GLNG Project
• Development of approximately 2,650 wells in the Bowen and Surat Basins with associated infrastructure to produce 5,300 PJ gas to supply the first train of the LNG Plant. Initially 1,200 wells will be established by 2015. The remaining wells will be phased in over the life of the project to replace declining wells to maintain gas production;
• Development of a gas pipeline network linking the gas fields to the LNG facility in Gladstone; and
• Development of a LNG facility (10 Mtpa) and export terminal on Curtis Island, to be developed in three stages with each train having a 3 to 4 Mtpa capacity.
The gas field component, which includes field development in the Darling Downs, was estimated in the documentation to commence construction in 2010 (although significant work is yet to commence), and be ongoing throughout life of project. Key elements of the construction/ gas field development workforce include:
• An average of approximately 600 employees between 2010 and 2013;
• Increase to an average of between 775 and 975 employees between 2014 and 2022 as gas field development ramps up to supply trains 2 and 3;
• An average of approximately 600 employees post 2022 for well maintenance and replacement; and
• Approximately 90% of construction workers are anticipated to be imported.
The operational workforce for the gas fields is anticipated to steadily ramp up from around 250 employees in 2010 to over 2,000 employees in 2021, and then remain relatively steady. Approximately 50% of these workers are estimated to be imported fly-in, fly-out (FIFO) workers.
The workforce impacts outlined above are expected to be split across the Surat and Bowen Basins based on the relative split of gas supply from the two regions. Tenement areas in the Surat Basin are located around Roma in the South West SD, outside of the Darling Downs catchment examined for the Surat Gas Project (and thereby reducing the impacts likely to be felt within the Darling Downs by the GLNG Project). However, labour demand for the GLNG Project will compete with the Surat Gas Project and in an already tight and constrained market for energy skilled workers, will limit the potential for the Surat Gas Project to source labour locally.
According to EIS documentation (APLNG, 2010), the APLNG project includes the following principal project components:
APLNG Project
• Further development of APLNG’s existing coal seam gas fields in the Surat and Bowen Basins. This will involve development of the Walloons gas fields in the Surat Basin in the Western Downs region with up to 10,000 CSG wells to be drilled over the project life;
• Construction of a gas transmission pipeline approximately 450 km long from the coal seam gas fields to an LNG plant at Gladstone; and
• Development of the LNG facility on Curtis Island in Gladstone which will have a processing capacity of up to 18 Mtpa across four trains.
Construction of the gas fields was expected to begin with some early project works in 2010, ongoing through to 2027, although this has likely been delayed as a final investment decision was forthcoming at the time of writing. Based on this start date, the peak workforce would be required between 2012 and 2017 where, on average, a workforce of approximately 1,600 to 1,800 would be required per year. The workforce

Economic Impact Assessment: Surat Gas Project Final Report
40
would peak in 2013-14 with up to an estimated 2,100 construction workers in the gas fields for that year.
The operational workforce requirements for the gas fields are indicated in the documentation to commence in 2011, with an average of 30 workers required for the first year (although this is likely to be delayed). Operational workforce requirements will steadily increase between 2011 and 2027, when a total of 690 workers will be eventually required. Between 2011 and 2027, an average of 471 workers will be required.
The EIS documentation (APLNG, 2010) highlights that while the APLNG Project will seek to utilise local labour where possible, existing constraints in the labour market will likely make it difficult to source a large proportion of labour locally.
The Queensland Government commissioned McLennan Magasanik Associates to assess the State and national economic impacts of an LNG industry developing in Queensland. McLennan Magasanik Associates (2009) used CGE modelling to assess the economic impacts of a 28 Mtpa LNG export industry developing, with the first trains commencing production in 2014. In $2005-06, the modelled impacts include:
• An increase in real GDP over the project life of approximately 0.1%, or approximately $1 billion per annum;
• An increase in national mining industry output of approximately $2.5 billion per annum;
• An additional 18,195 persons employed in Queensland;
• A contraction in output from the electricity, gas & water industry of approximately $177 million per annum owing to higher domestic gas and electricity prices to achieve parity with high export prices for LNG;
• Benefits to industries that supply inputs to the LNG industry, particularly construction ($130 million additional output per annum), wholesale trade ($61 million) and property & business services ($35 million);
• Additional activity generating greater royalties and wages. Consumption-oriented industries such as retail trade would benefit from higher incomes, with household consumption projected to increase by approximately $38 per capita;
• A reduction in production from export industries such as manufacturing, agriculture and tourism due to an appreciation of the Australian dollar;
• A slight positive impact on Australia’s trade balance despite the crowding out of some export industries; and
• A transfer of labour to industries and regions where demand increases (such as the LNG industry, construction and retail trade).
In Queensland, Gross State Product is expected to increase by approximately $3 billion per annum (2005-06 dollars) to 2030. Production from Queensland’s (and Australia’s) trade-exposed industries is expected to decline as a result of an appreciation in the Australian dollar.
At a regional level the development of the 28 Mtpa LNG industry is projected to have a large positive effect on employment in the Darling Downs and South West SDs (that is, the Surat Basin) of approximately 3.3%.
4.3.3 Key Challenges Facing the Darling Downs
In addition to overcoming the short term impacts of the recent flood events, the Darling Downs has a number of challenges that need to be overcome in order to maximise the benefits of energy resource developments and minimise the impacts on other business as well as the liveability of the region.
Key challenges for the region are identified in the Surat Basin Economic Development Strategy (AECgroup, 2011) as including:
• Natural resource use and management, such as:
o Constraints on availability of water resources: Availability of water resources is vital for the ongoing sustainability of communities. Drought has been a major

Economic Impact Assessment: Surat Gas Project Final Report
41
limiting factor in the region in recent years (refer to section 4.3.1), which places significant constraints of water resources for variable and uncontrollable periods of time.
o Environmental management: The Darling Downs has a number of key environmental assets such as water resources, diverse and productive agricultural lands, unique pockets of rare flora and fauna and an overall appreciation of environmental assets and values. Rapid economic growth can have detrimental impacts upon the environment where it is not well managed.
o Competing land use issues: The emergence of the coal and coal-seam-gas industries in the Surat Basin may give rise to conflicting land use activities, particularly with the agriculture sector, which has been the traditional and primary land use activity. Although resource and energy sectors will be a key driving force within the regional economy, the importance of maintaining and building the existing strength in agriculture will remain a priority.
As population and industry continue to expand in the region there will be an increasing demand and subsequent competition for water resources across both residential and industrial water uses. Water management and resource allocation planning in the Surat Basin will be necessary to ensure the viability and sustainability of population and industry growth in the region. Without suitable provision of water, regional growth will be unsustainable.
Similarly, preserving the integrity of the agriculture industry – through preservation of high quality productive lands – will also be important to the region, not only for economic and environmental perspectives but also for the social and historical value.
The degree of environmental management across all areas of the economy will directly correlate to the level of sustainability and quality of life achieved by the region in the future.
• Enabling infrastructure constraints:
o Transport infrastructure: Capacity constraints are recognised as a common issue that negatively impact on Queensland’s coal export capacity, access of agricultural production to export infrastructure and the connectivity of the regional population. The Surat Basin is already impacted by constraints in rail, air and road infrastructure. The Surat Basin Rail is one critical piece of infrastructure necessary to unlock the coal export potential of the region. Improvements to the Warrego Highway, rail links to Brisbane and throughout the region would also immediately improve the accessibility of the region.
o Telecommunications infrastructure: Telecommunications infrastructure development in the Darling Downs has lagged behind the pace of major regional centres across Australia. With major industry and population growth to occur in the region, development of new telecommunications infrastructure is required to facilitate and meet the changing standards required by industry and the community.
• Existing constraints that limit the ability of local industry to respond to change, such as:
o Gaps in supply chain capacity: Gaps in local supply chains present issues for both resource and agriculture sector operations resulting in the import of goods/ services to the region in order to support the desired level of industry activity. Competition for inputs of goods and services (e.g. transport) has the potential to create issues for the agriculture and other sectors competing with the higher prices able to be paid by the resource sector to secure these suppliers.
o Current shortages of skilled labour: As seen in other regional Queensland resource production areas, high demand for skilled workers is likely to result in competition with other industry sectors. Local service businesses, rural industries and local government are likely to be the most affected by skills shortages, as these industries are the least competitive with high paying resource sector salaries. Shortages in local skilled labour in most resource production areas have contributed to a trend toward resource companies utilising a higher proportion of

Economic Impact Assessment: Surat Gas Project Final Report
42
non-resident, fly-in fly-out (FIFO) contract workers. Shortages in labour can result in lost productivity and economic opportunities, which can translate to lost opportunities for regional communities.
o Limited availability and suitability of industrial land: Limited availability of serviced industrial land presents many issues for investment and attraction of industrial sector businesses to the region, which will be required to support the resource sector and associated supply chain growth. The Darling Downs currently has limited availability of serviced industrial land that is ready for development.
Rapid development by the resource sector in the region is likely to occur sporadically, in short time frames and at a pace beyond what regional supply chains and businesses are likely to be able to respond to without significant growth and change to business service delivery structures and diversification of products. This will place significant pressures on local suppliers to respond to the market needs and will impact all aspects of the regional economy (e.g. accessibility to finance, ability to source skilled labour, timely business expansion, product development).
High demands placed on industry for development and investment will also flow through to town planning and government processes, which will be required to respond swiftly to market needs for industrial land development and business support services.
• Social factors such as housing, culture, and liveability:
o Residential housing and social effects of a rapidly increasing population: High demand for labour by resource companies has resulted in acute growth in local housing demand and associated price effects where the provision of additional accommodation lags growth in demand. The Darling Downs is already starting to see increases in housing demands, which have stimulated increased building activity in the region. At the same time, short-term accommodation operates at capacity during the week due to the FIFO workforce. As the Darling Downs continues to rapidly develop, there will be increased pressures on social infrastructure to keep pace with the population growth and associated services.
o Potential impact on cultural and social liveability: With rapid investment and industry development expected to occur across the region the challenge will be maintaining the social integrity and liveability of the region to ensure that existing and new residents continue to enjoy the quality of life the region has to offer. Attracting new workers to the region and encouraging them to permanently establish themselves and their families will also be important in sustaining positive economic and social/ cultural growth. Ensuring existing and new residents enjoy appropriate ‘liveability’ will be dependent on the timely development of social infrastructure (e.g. community halls, sporting clubs, schools and health facilities, availability and suitability of housing, cafes, restaurants and other population based services).
4.4 Future Economic Opportunities
The Surat Basin Economic Development Strategy (AECgroup, 2011) identifies a number of economic development opportunities for the Surat Basin region, many which leverage the intense resource development opportunities, as well as others which arise independently of resource development as a result of the existing strengths, combination of assets and population and industry service based opportunities that exist in the region. The full list of opportunities can be found in Appendix A.
Eight key areas, or headline initiatives, for economic development were identified to be across the industries of agriculture, food processing, energy resources (CSG and coal) and support services, metal product manufacturing, emerging industries, education and training, and tourism.
Opportunities for economic development in each of the headline areas are outlined below.
4.4.1 Agriculture and Food Processing
Agriculture and food processing opportunities focus primarily upon building on the historical strengths of the agriculture industry, in particular livestock, broadacre cropping

Economic Impact Assessment: Surat Gas Project Final Report
43
and horticulture, and leveraging agricultural production through high value-adding food manufacturing and processing such as pre-packaged foods, meat products and specialised health foods.
Key strengths supporting this opportunity include:
• An abundance of good quality agricultural land;
• A strong and established sector with a well developed and diverse supply chain/ support services;
• An established skills base in the region;
• Strong global demand for food products; and
• Established utilities and infrastructure supporting the industry, including water availability for agricultural production.
4.4.2 Energy Resources
Industry opportunities for the energy resources sector are focused upon leveraging the large deposits of black coal and natural gas which are located in the Surat Basin, and providing the necessary services to support the sector. CSG and coal exploration and development has been increasing rapidly in the Surat Basin in recent years as a number of resource companies have invested in the region. This is examined in more detail in section 4.3.2.
Key drivers and strengths to be leveraged by the resources sector in the Surat Basin include:
• Abundance of coal and CSG deposits;
• Strong export demand for coal and gas, which has encouraged major international company interest and investment;
• Existing electricity distribution network and CSG power and coal-fired power stations in the region; and
• Interest in energy resources has prompted significant government investment in examining and understanding issues facing the industry, and the development of plans and strategies to assist in “unlocking” the resources (e.g., energy skills development and workforce development strategies).
4.4.3 Metal Product Manufacturing and Emerging Industries
The anticipated development of the energy resources sector (and increased demand for housing and a range of services), maintenance of the traditionally strong agriculture industry and transition to higher value-adding food products provides considerable opportunity for a number of manufacturing and service based industries to develop and expand in the region.
In particular, opportunities exist for:
• A range of metal products, such as prefabricated steel products, structural steel applications (e.g., bridge construction or electricity transmission towers), architectural steel products, specialised steam, gas and water pipes, fittings and valves;
• Specialised equipment, in particular mining and gas equipment, transport equipment and maintenance;
• Fibre composite materials for building and construction, as well as infrastructure for transport and mining;
• Pre-fabricated buildings to assist in accommodating anticipated high resident and transient population growth;
• Environmental services, including testing and monitoring services for soils, water, carbon and flora and fauna management, as well as treatment and disposal of CSG water; and

Economic Impact Assessment: Surat Gas Project Final Report
44
• Emerging technologies, such as renewable energies, carbon capture and sequestration, energy sector research and development, coal chemical manufacturing and robotic automation.
4.4.4 Education and Training
Education and training opportunities are primarily focused upon supporting and building skills capacity for the region’s energy, agriculture and food product industries, as well as emerging industry development. Further, the strong population growth anticipated for the region will place additional demands on the education and training industry.
4.4.5 Tourism
Tourism industry opportunities are focused upon the expansion and packaging of existing tourism experiences and stronger marketing of the region. Key drivers and strengths to be leveraged by the tourism sector in the Surat Basin region include:
• Diverse range of existing tourism experiences;
• Strong cultural heritage and country Australia culture;
• Existing events and festivals;
• Diverse range of natural assets and scenic tours; and
• Existing accommodation supply.

Economic Impact Assessment: Surat Gas Project Final Report
45
5. Economic Impact Assessment The following assessment examines the economic impacts of the Surat Gas Project within the project’s Study Area as well as in Queensland in response to the EIS Terms of Reference (listed in Table 2.1).
This analysis utilises economic modelling outcomes as well as consultation with key stakeholders (including local Council, economic development organisations, industry bodies and local business) to inform the assessment of economic impacts as appropriate.
The modelling outcomes identified throughout this impact assessment depict the value and percent change in a range of economic indicators anticipated as a result of the Surat Gas Project. These estimates represent the net change in the respective indicators compared to what growth may be without the Surat Gas Project proceeding in the regional, state and national economies.
Assumptions used in developing baseline estimates of growth are outlined in Appendix C. The baseline scenario includes the anticipated effects on economic growth and activity resulting from development and operation of the gas field components of the Gladstone LNG Project and the Queensland Curtis LNG Project. Descriptions of these projects are provided in section 4.3.2.
These projects have been included in the baseline scenario to most accurately reflect anticipated future economic growth in the regional, state and national economies if the Surat Gas Project does not proceed. The modelling outcomes presented in this chapter do not include a representation of the impacts of the Gladstone LNG Project and the Queensland Curtis LNG Project in combination with the Surat Gas Project, but rather the impacts of the Surat Gas Project over and above what is anticipated to occur as a result of the other two projects. The inclusion of these projects in the baseline reduces the level of resources and factors of production available to the Surat Gas Project in the regional, state and national economies.
All modelling outcomes are presented in 2009-10 dollar values.
Modelling results have been presented in this chapter in graph and table form. Results depicted in table form present average annual impacts across two timeframes:
• The ramp up period between 2013-14 to 2018-19; and
• Steady state gas production between 2019-20 and 2027-28.
Peak economic impacts of the project in terms of industry output will occur during steady state operations. Modelling results have only been presented to 2027-28 as economic impacts are expected to remain relatively stable once steady state production is achieved.
5.1 Impacts on Industy Output and Gross Product
The Surat Gas Project will generate considerable output and gross product (or value added activity), both:
• Directly, through construction activity as well as the production of coal seam gas; and
• Indirectly, through additional demand for goods and services to support the gas development, household consumption effects as a result of additional wages and salaries paid throughout the domestic economy, and government expenditure through additional taxation revenues.
The following sub-sections examine the Surat Gas Project’s impact on gross regional (Darling Downs), State (Queensland) and domestic (Australia) product as well as impacts on output by industry in the Darling Downs and Queensland using CGE modelling results. CGE modelling results present the net impacts in aggregate form rather than differentiating between direct and indirect impacts. Output as a measure of economic activity refers to the gross value of goods and services transacted, including the costs of goods and services used in the development and provision of the final product. Value

Economic Impact Assessment: Surat Gas Project Final Report
46
added activity refers to the value of output after deducting the cost of goods and services inputs in the production process (in line with measures of gross regional/ state/ domestic product). That is, value added activity (or gross product) defines the true net economic contribution of the project, while estimates of industry output present the overall increase in economic transactions and, thereby, industry production and activity.
5.1.1 Impacts on Gross Domestic, State and Regional Product
Modelling outcomes of the impacts of the Surat Gas Project on Darling Downs GRP, Queensland GSP and Australian GDP between 2013-14 and 2027-28 are presented in Figure 5.1. The figure highlights:
• A steady increase in the regional, State and national economies over a seven year ramping up period (2013-14 to 2018-19). During this time the Surat Gas Project’s contribution to regional, State and national gross product is estimated to increase from approximately $75 million in GRP (or approximately $150 million in GSP/ GDP) above the baseline (without project) scenario in 2013-14 to approximately $1.15 billion above the baseline scenario by 2018-19;
• The Surat Gas Project’s contribution to regional, State and national gross product is estimated to plateau at approximately $1.3 to $1.4 billion on average above the baseline scenario once peak gas production is reached. Over time the impact of the project is modelled to slowly trend towards the baseline scenario as resources that are used by the Surat Gas Project are assumed to be utilised for other purposes;
• In percentage terms, the Surat Gas Project is estimated to result in an increase in Darling Downs GRP (above what would be expected to occur without the project) of just under 6% once peak gas production is reached. This increase is estimated to trend down over time as the difference between the with and without project scenarios in percentage terms declines; and
• The Darling Downs is anticipated to receive the vast majority of growth generated by the Surat Gas Project, accounting for almost all gross product (as evidenced by similar absolute changes in Darling Downs GRP as observed in GSP and GDP).
Figure 5.1. Impact of the Surat Gas Project on GRP/ GSP/ GDP in Darling Downs, Queensland and Australia, Deviation from the Baseline (Without Project) Scenario
Note: All years depicted in the figure are year ended June. Source: Prime Research (unpublished).
0.0%
0.5%
1.0%
1.5%
2.0%
2.5%
3.0%
3.5%
4.0%
4.5%
5.0%
5.5%
6.0%
6.5%
7.0%
$0
$125
$250
$375
$500
$625
$750
$875
$1,000
$1,125
$1,250
$1,375
$1,500
$1,625
$1,750
2014 2015 2016 2017 2018 2019 2020 2021 2022 2023 2024 2025 2026 2027 2028
Change in G
RP
/ GSP
/ GD
P from
the Base C
ase (%)
Cha
nge
in G
RP
/ G
SP/
GD
P f
rom
the
Bas
e C
ase
($M
)
Darling Downs - GRP ($M) Queensland - GSP ($M) Australia - GDP ($M)
Darling Downs - GRP (%) Queensland - GSP (%) Australia - GDP (%)

Economic Impact Assessment: Surat Gas Project Final Report
47
5.1.2 Impacts on Industry Output
The impacts of the Surat Gas Project on industry output in the Darling Downs and Queensland compared to the baseline (without project) scenario are presented in Table 5.1.
The concurrent development, commissioning and operation of gas wells and related infrastructure throughout the modelling period is highlighted in the table, with both the mining industry and the construction industry recording an increase in output compared to the baseline scenario. Impacts on construction are estimated to be higher during the ramp up period when construction activity is estimated to be more intense. Conversely, impacts on the mining industry (which includes CSG extraction as part of the Surat Gas Project) are estimated to be highest during steady state gas production, and in the Darling Downs will represent an increase of more than one third compared to the baseline scenario.
In the Darling Downs, the industries of business, finance and insurance and trade are also estimated to increase output throughout the modeled period as a result of the Surat Gas Project, while ownership of dwellings is estimated to increase output during steady state gas production as the region’s housing market adjusts to the stimulus created by the project.
Benefits to business, finance and insurance, ownership of dwellings and trade are estimated to be higher in Queensland than in the Darling Downs, while public administration, defence, health and education services is also estimated to record an increase in output in Queensland overall compared to the baseline scenario. These increases will be brought about by a combination of increased demand for these services to supply the Surat Gas Project and its workforce, as well as through additional household incomes and government revenues (and associated expenditure) throughout the State.
Table 5.1. Average Annual Impact on Industry Output in the Darling Downs and Queensland, Deviation from the Baseline (Without Project) Scenario
Industry Darling Downs Queensland
2013-14 to 2018-19
2019-20 to 2027-28
2013-14 to 2018-19
2019-20 to 2027-28
Change in Industry Output (%)
Agriculture, forestry and fishing -0.3% -0.2% -0.1% 0.0%
Mining 20.0% 36.6% 1.7% 3.4%
Manufacturing -0.6% -1.1% -0.2% -0.4%
Electricity and water -1.1% -1.3% -0.6% -0.5%
Construction 2.8% 1.1% 0.1% 0.1%
Trade 0.0% 0.2% 0.0% 0.0%
Transport and storage -0.3% -0.3% 0.0% 0.0%
Business, finance and insurance services 0.6% 0.4% 0.1% 0.1%
Public administration, defence, health and education -0.2% -0.1% 0.0% 0.0%
Recreation and other services -0.7% -0.7% 0.0% 0.0%
Ownership of dwellings -0.1% 0.1% 0.0% 0.1%
Total Change in Industry Output (%) 2.0% 4.1% 0.1% 0.2%

Economic Impact Assessment: Surat Gas Project Final Report
48
Industry Darling Downs Queensland
2013-14 to 2018-19
2019-20 to 2027-28
2013-14 to 2018-19
2019-20 to 2027-28
Change in Industry Output ($M)
Agriculture, forestry and fishing -$13.4 -$11.5 -$16.1 -$15.1
Mining $718.7 $1,912.4 $714.8 $1,851.6
Manufacturing -$41.9 -$93.4 -$287.4 -$591.4
Electricity and water -$8.1 -$11.4 -$85.7 -$86.9
Construction $59.3 $29.5 $63.5 $36.7
Trade $2.6 $14.8 $6.4 $16.5
Transport and storage -$3.0 -$3.7 -$6.1 -$16.5
Business, finance and insurance services $25.1 $20.0 $101.5 $100.5
Public administration, defence, health and education -$10.4 -$8.4 $0.1 $11.7
Recreation and other services -$4.1 -$4.8 -$0.7 -$0.3
Ownership of dwellings -$2.1 $1.5 $14.1 $23.7
Total Change in Industry Output ($M) $722.8 $1,844.9 $504.3 $1,330.6 Source: Prime Research (unpublished).
The increase in construction and mining activity directly generated by the Surat Gas Project, as well as additional demand for and activity in household and business related support services, will result in a reallocation of some constrained resources resulting in a potential overall “draw-down” on some sectors. These negative impacts will be driven by competition for constrained resources, in particular labour (this is examined further in section 5.6.1).
For example, modelling outcomes suggest the industries of manufacturing, transport and storage and agriculture could record a decline in output relative to the baseline scenario. Employees in these industries are typically more likely to transfer to construction and/ or mining as many of the skill sets required in these industries are similar. However, it should be recognised that these are modelled outcomes, and that employee movement may occur between any sector.
5.2 Impacts on Employment
5.2.1 Employment Generation
This section examines the impacts of Surat Gas Project in terms of employment generation, incorporating both effects of direct and flow-on job creation, as derived using CGE modelling. All employment estimates presented in this section are based on place of work rather than place of usual residence.
Operational workers are assumed to all reside in the region with approximately 50% assumed to be current residents and 50% assumed to relocate to the region. In regards to construction workers, a large proportion (assumed 80%) is anticipated to operate on a FIFO or DIDO (drive-in, drive-out) basis, with many of these workers having a permanent residence outside of the Darling Downs. As such, care should be taken in interpreting the employment estimates presented in terms of their implications for permanent versus temporary population change.
Employment requirements of the Surat Gas Project are outlined in section 3.3 across the construction and operational workforces. Modelling has been undertaken to understand the likely impacts of the Surat Gas Project on total employment in the Darling Downs and Queensland in consideration of constrained labour resources6
Figure 5.2
and expected increases in demand for goods and services in the local, State and national economy as a result of flow-on industry and household consumption as well as government expenditure. An overview of modelled employment outcomes are presented in .
6 Modelling has included demand for labour from the Gladstone LNG Project and Queensland Curtis LNG Project and their associated gas supply requirements, on top of growth in demand for labour generated by underlying growth in the Queensland economy (refer to Appendix C).

Economic Impact Assessment: Surat Gas Project Final Report
49
The figure highlights that the Surat Gas Project is anticipated to result in a beneficial impact with a net increase of just under 500 full time equivalent7
On a percentage basis the Surat Gas Project’s impact on employment in the Darling Downs is estimated to peak at approximately 0.375% above the baseline scenario, highlighting the mild nature of the increase in employment provided by the project.
(FTE) employees in the Darling Downs compared to the baseline (without project) scenario during peak labour demand in 2015-16 and 2016-17. Impacts on labour is estimated to fluctuate throughout the modelling period – reflecting the staged development of gas fields throughout the project’s life – but will generally trend downward following the peak in construction activity in 2016-17.
By comparison, employment (by place of work) in Queensland (including the Darling Downs) is anticipated to increase above the baseline scenario by just under 200 FTE employees during peak labour demand. The lower overall employment impact in Queensland than in the Darling Downs is a reflection of the high FIFO labour requirement for construction of the Surat Gas Project and permanent migration of operational workers, with labour being drawn to the Darling Downs from the rest of Queensland.
Figure 5.2. Impact of the Surat Gas Project on Employment in the Darling Downs and Queensland, Deviation from the Baseline (Without Project) Scenario
Note: All years depicted in the figure are year ended June. Source: Prime Research (unpublished).
Estimates of the average annual impact on employment by industry in the Darling Downs and Queensland, compared to the baseline scenario, are outlined in Table 5.2.
The table highlights the relatively stronger increase in construction labour during the ramp up period (compared to steady state gas production) in both the Darling Downs and Queensland, in keeping with the higher construction labour requirement of the Surat Gas Project over this period. Conversely, mining employment increases are strongest during steady state gas production when operations workers for the Surat Gas Project will be in peak demand.
Other industries that are beneficially impacted by an increase in employment compared to the baseline scenario include business, finance and insurance services and trade. Once
7 Where one FTE employee is equivalent to one person working full time for a period of one year.
0.000%
0.075%
0.150%
0.225%
0.300%
0.375%
0.450%
0
100
200
300
400
500
600
2014 2015 2016 2017 2018 2019 2020 2021 2022 2023 2024 2025 2026 2027 2028
Change in Em
ployment from
the Base C
ase (%)
Cha
nge
in E
mpl
oym
ent
from
the
Bas
e C
ase
(FTE
s)
Darling Downs - Employment (FTEs) Queensland - Employment (FTEs)
Darling Downs - Employment (%) Queensland - Employment (%)

Economic Impact Assessment: Surat Gas Project Final Report
50
in steady state gas production, public administration, defence, health and education services are also estimated to increase in Queensland.
Table 5.2. Average Annual Impact on Employment in the Darling Downs and Queensland, Deviation from the Baseline (Without Project) Scenario
Industry Darling Downs Queensland
2013-14 to 2018-19
2019-20 to 2027-28
2013-14 to 2018-19
2019-20 to 2027-28
Agriculture, forestry and fishing -56 -52 -68 -66
Mining 180 431 209 494
Manufacturing -112 -226 -457 -680
Electricity and water -14 -19 -148 -130
Construction 315 160 334 197
Trade 53 81 36 59
Transport and storage -9 -18 -34 -47
Business, finance and insurance services 88 39 299 242
Public administration, defence, health and education -50 -47 -6 34
Recreation and other services -11 -18 -5 -11
Ownership of dwellings 0 0 -1 -1
Total Change in Employment (FTEs) 384 332 158 92 Source: Prime Research (unpublished).
Adverse impacts on employment in the industries of manufacturing, agriculture and transport and storage are estimated to be higher in Queensland than in the Darling Downs, driven by a draw of labour to the Darling Downs from these industries in rest of Queensland to support the Surat Gas Project. Skills available in these three industries are typically similar to the skills required of the Surat Gas Project.
5.2.2 Skills Requirements and Potential Impacts on Skills Shortages
5.2.2.1 Skills Requirements of the Project
It is anticipated that the Surat Gas Project will entail a similar skills requirement as identified by ESQ (2009a) and summarised in section 3.3 (Table 3.2). Outcomes from modelling of employment by occupation impacts in the Darling Downs (including both direct and flow-on impacts) are presented in Table 5.3.
The percentages presented in the table refer to the proportional change in total labour required for each occupation compared to what would be required if the Surat Gas Project did not proceed. The percentages provide insight into the types and acuteness of demand and impacts on certain occupations and skill sets in the Darling Downs.
Modelling results show that demand for labour is anticipated to be strongest (compared to what would otherwise be expected to occur without the project) in the occupation of technicians and trades workers during the both the initial ramp up period (1.2% above the baseline scenario) and steady state gas production (0.8% above the baseline scenario).
At a more detailed occupational split, key occupations identified in the modelling results that will be in highest demand (including both direct and flow-on labour demand) include:
• Construction, distribution and production managers; • Engineering managers; • Architects, designers, planners and surveyors; • Engineering professionals; • Natural and physical science professionals (e.g., geologists); • Building and engineering technicians; • Fabrication engineering trades workers; • Mechanical engineering trades workers; • Electricians; • Electronics and telecommunications trades workers; • Miscellaneous technicians/ trades workers; • Stationery plant operators; and

Economic Impact Assessment: Surat Gas Project Final Report
51
• Construction/ mining labourers.
Table 5.3. Average Annual Impact on Employment by Occupation in the Darling Downs, Deviation from the Baseline (Without Project) Scenario
Occupation 2013-14 to 2018-19
2019-20 to 2027-28
Managers 0.1% 0.1%
Professionals 0.2% 0.2%
Technicians and trades workers 1.2% 0.8%
Community and personal service workers 0.0% 0.0%
Clerical and administrative workers 0.2% 0.1%
Sales workers 0.1% 0.1%
Machinery operators and drivers 0.2% 0.2%
Labourers 0.1% 0.0%
Total Change in Employment in the Darling Downs 0.3% 0.2% Source: Prime Research (unpublished).
5.2.2.2 Skills Development/ Training and Attraction
Arrow are committed to sourcing local labour to the extent practical (based on local skills availability) and will provide development and training opportunities in the local community to support the Surat Gas Project. Even so, it is anticipated that construction activities are expected to require the importation of a significant amount of the specialist labour to meet the project’s requirements.
For operations, Arrow intends to directly employ a permanent local workforce. The majority of staff are expected to be based in towns close or adjacent to the project development areas. Arrow does not intend to have fly-in fly-out operations personnel. During short periods with high demand for specialist services (e.g., major servicing of compressors or electricity generators), there may be a need to bring in contract personnel from outside the region to conduct works (Coffey Environments, 2011).
For both construction and operational activity, the local workforce is expected to benefit from training programs delivered as part of the Surat Gas Project, and this will deliver a permanent lift in the local skills base. The Surat Gas Project will provide skill development and training through apprenticeships, scholarships, vocational training, support work readiness programs and pre-trade training. These opportunities will benefit local residents and includes a specific indigenous employment and education program. Details on skills development and training programs to be implemented as part of the Surat Gas Project are examined in the Social Impact Assessment appended to the EIS (URS, 2011).
Skills development may be further enhanced through skills transfer and on-the-job skills development. Historically the construction of major projects has been observed to ‘up-skill’ already skilled workers. The relatively long term aspect of construction is also likely to result in the skill development of relatively lower skilled individuals.
5.2.2.3 Potential Impacts of the Project on Skills Availability and Shortages
The Surat Gas Project will place additional demand on specific skill sets of the CSG industry – some of which are already experiencing shortages across Queensland. An overview of occupations demanded by the Surat Gas Project that are currently experiencing skills shortages is provided in section 4.2.3.4. This additional demand will place pressure on skills availability within the Darling Downs, leading to a further tightening of an already ‘tight’ labour market.
The likely deepening in skills shortages as a result of the Surat Gas Project is reflected in an anticipated increase in real wages (refer to section 5.2.2.4), which reflects the anticipated pressures placed on business to increase employee compensation in order to attract and retain labour.

Economic Impact Assessment: Surat Gas Project Final Report
52
5.2.2.4 Impacts to Real Wages
As outlined in sections 5.6.1 and 5.2.1, the Surat Gas Project will result in a draw of labour from some sectors to support the development and operation of the gas fields. This draw will be generated by labour moving to higher paying positions, and, through competition in a constrained labour market, will place upward pressure on the cost of attracting and retaining labour.
This effect is best observed through the impact of the project on real wages, which represent the real (i.e., above inflation) changes to average salaries in the economy.
Modelling results are presented in Figure 5.3 and indicate that the Surat Gas Project could contribute to a marginal increase in real wages of approximately 0.02% per annum on average in Australia and 0.05% per annum on average in Queensland between 2013-14 and 2027-28. In the Darling Downs the impact to real wages is higher than in Queensland and Australia though still relatively moderate, averaging 0.5% above the baseline (without project) scenario between 2013-14 and 2027-28, peaking at almost 0.6% in 2023-24 and 2024-25.
The increase in real wages is an indication of pressures in the local labour force to provide the labour requirements of the Surat Gas Project. However, an average increase of 0.5% in real wages, while notable, is not anticipated to significantly destabilise the existing labour market in the region.
Figure 5.3. Annual Percent Change in Real Wages Resulting from the Surat Gas Project, Year Ended June 2014 to Year Ended June 2028
Note: All years depicted in the figure are year ended June. Source: Prime Research (unpublished).
5.3 Impacts of the Project on Property Values
Potential direct impacts of the Surat Gas Project on property values have the potential to be generated through:
• Increased demand, both directly or indirectly, for industrial or commercial property to support the project and flow-on service development;
• Increased demand for residential property for accommodation of the construction and operational workforces, as well as people migrating to the region for flow-on employment opportunities; and
• Potential disturbance of or restricted access to land.
0.0%
0.1%
0.2%
0.3%
0.4%
0.5%
0.6%
0.7%
2014 2015 2016 2017 2018 2019 2020 2021 2022 2023 2024 2025 2026 2027 2028
Cha
nge
in R
eal W
ages
(%
)
Darling Downs Queensland Australia

Economic Impact Assessment: Surat Gas Project Final Report
53
5.3.1 Impacts on Industrial/ Commercial Property Values
While the Surat Gas Project will not directly impact on industrial or commercial land values, the project will provide additional demand for goods and services in the local region, which has the potential to generate demand for these land types from support industries. Potential opportunities for support industry, both related to servicing the gas industry and servicing population growth in the region, are examined in section 5.6.1.
Consultation with local real estate agents, Council and economic development organisations identified that the Darling Downs is currently underserviced in terms of serviced industrial land that is ready for development, which is presenting issues for investment and attraction of industrial sector businesses to the region to support the resource sector and associated supply chain.
Consultation with local real estate agents suggests industrial land prices have doubled in the past two years in some areas, in particular Chinchilla and Dalby. Issues of suitable available land and lengthy approval processes have seen some industrial development occurring on farm land outside of major towns. The Surat Gas Project will contribute to increased demand for industrial and commercial land and if not appropriately planned for will exacerbate price increases.
Issues of appropriately zoned industrial land to support the resources sector have been identified in recent planning and economic development studies for the Surat Basin (refer to Appendix A), and strategies developed to assist local and State government meet the future industrial and commercial land requirements of the region have also been developed.
5.3.2 Impacts on Residential Property Values from Increased Population
Direct and flow on employment and associated population increase resulting from the Surat Gas Project is expected to, all else remaining constant, increase demand for accommodation in the region, contributing to lower vacancy rates and putting upward pressure on rental and sales prices in the region. In the first instance, prices growth is expected to be greatest in the Dalby and Wandoan areas, extending to other townships such as Millmerran, Kogan, Chinchilla and Goondiwindi as drilling commences for successive stages of the project.
Impacts of recent resource sector activity as well as other recent major infrastructure developments (e.g., Origin’s Darling Downs Power Station) on the local Dalby and Wandoan property markets are highlighted in sections 4.2.4.2 and 4.2.4.3. House sales prices in the regions (which are both located in the Western Downs LGA) have increased by over 75% in the past five years, double that of the Darling Downs overall and higher than both Gladstone and Rockhampton, which have also experienced significant development activity in recent years. Sales prices for vacant land in the Western Downs LGA have increased by more than 150% over the same period, considerably higher than any other region. Rental prices in the Western Downs LGA have also increased strongly, in particular for units/ townhouses, while the number of bonds lodged compared to four years ago has doubled.
An assessment of the likely impacts of the Surat Gas Project on the local residential property market, both directly and through flow-on impacts, is examined in the sub-sections below.
5.3.2.1 Direct Impacts on Residential Property Values
To assist in mitigating impacts of the Surat Gas Project on the local residential property market, Arrow will utilise temporary accommodation facilities (TAFs) to accommodate its FIFO construction workforce, as well as any visiting management personnel and consultants (where beds are available). TAFs will be designed to accommodate peak construction labour requirements of the project, and therefore the impact on the local residential property market from the construction workforce should be negligible.
There is potential, however, for some construction workers to permanently migrate to the region (and thereby be considered as “local” labour), although this is expected to be a small proportion with minimal impact on demand for residential property.

Economic Impact Assessment: Surat Gas Project Final Report
54
By comparison, the operational workforce is expected to all reside locally and be comprised of existing local residents and people migrating to the region. In consideration of the workforce profile and worker availability in the development area, Arrow anticipates to fill approximately 50% of operations positions for the project from within or nearby the project development area (and therefore already have accommodation in the region), with the remaining 50% assumed to migrate to the region. Based on these assumptions approximately 230 operational workers (and their families) will migrate to the region and place additional demand on the residential property market (primarily in major townships), with the number of workers ramping up as new infrastructure and wells become operational.
Given the use of TAFs to accommodate imported construction labour, the relatively small number of operational employees migrating to the region, long lead time to peak workforce and dispersed nature of the project (with demand for accommodation likely to be dispersed across a number of townships), it is considered likely that the Surat Gas Project’s direct impact on the local residential property market will be small, and will not replicate the impacts of recent major developments in the region. This is supported by consultation findings, with consultees noting the direct impacts of the project on residential demand is unlikely to be significant in consideration of the long ramp up period, which will provide ample time for required residential land release and development to accommodate anticipated increases in property demand.
5.3.2.2 Flow On Impacts on Residential Property Values
In addition to the direct impacts of the project on the residential property market, the Surat Gas Project has the potential to increase residential property demand to accommodate workers and their families attracted to the region through flow-on activity.
Examination of modelled labour impacts (refer to section 5.2.1) in consideration of the direct labour requirements of the Surat Gas Project shows that on a net basis (i.e., accounting for anticipated draw of labour from some sectors to supply the project) flow-on impacts of the project are not expected to result in any significant changes in the overall number of people employed in the Darling Downs.
While modelling suggests flow-on impacts may be small, sections 4.2.4.2 and 4.2.4.3 highlight that residential property sales and rental prices in the Darling Downs have increased considerably in the past five years, in particular in the Western Downs LGA and Southern Downs LGA, suggesting the local property market is already experiencing pressures on residential property. Consultation with local real estate agents and economic development organisations indicated that a developing supply chain and associated inward migration has contributed to increased pressure on the residential property market, and that regional planning has – to date – not appropriately planned for this additional flow-on demand. This has contributed to residential developments selling at a faster rate than anticipated, resulting in developers bringing forward subsequent stages of some existing residential developments in the region.
Land planning will need to consider likely impacts of supply chain development not only on industrial/ commercial land demand, but also on residential property demand through inward migration of workers.
5.3.3 Impacts on Property Values from Disturbance of Land
The Surat Gas Project development area covers some 8,600 km2, extending from the township of Wandoan in the north towards Goondiwindi in the south. Development of gas wells and gathering lines, field compression facilities, central gas processing facilities, integrated processing facilities and other infrastructure is likely to impact on existing land uses in the Darling Downs, the majority of which are rural properties used for agricultural purposes.
An assessment of potential impacts of the Surat Gas Project on agricultural lands was undertaken by Gilbert and Sutherland (2011), and a summary of potential impacts on agricultural production is provided in section 5.6.1.
The potential for reduced productive capacity in some landholdings may result in a decline in the value of these properties. Agricultural land values in the Darling Downs have softened in recent years, primarily driven by factors such as rural downturn and

Economic Impact Assessment: Surat Gas Project Final Report
55
drought. Consultation with local real estate agents, however, indicated that uncertainty regarding impacts on agricultural production from the resources sector and potential compensation has also likely been a contributing factor to softening agricultural land values in the region, though the overarching effects of drought and rural downturn mean it is not possible to ascertain to what level, if any, the resource sector has impacted on rural property values in the region.
Arrow has committed to working with landholders to minimise the disturbance of good quality agricultural land (GQAL) or strategic cropping land, and as such, has developed policies and procedures highlighting an intent to place gas wells and infrastructure in areas that avoid or minimise impacts on high quality agricultural land to the extent practical and possible. This will assist in minimising any potential for the Surat Gas Project to impact on rural property values. Furthermore, any potential disturbance of agricultural land will only be temporary and it is expected that all land impacted by gas wells and associated pipeline and other infrastructure will be rehabilitated to a pre-development standard.
Depending on the nature and type of compensation provided, the Surat Gas Project may have the potential to add value to rural properties in the region. At time of writing, Arrow was negotiating with representative groups to define appropriate compensation terms.
5.4 Significance of the Project on Local and Regional Economies
Impacts of the Surat Gas Project on industry output, GRP, employment and household incomes in the Darling Downs are examined in sections 5.1, 5.2 and 5.6.2, and have been summarised in Table 5.4.
The table highlights the Surat Gas Project will provide a boost to GRP in the Darling Downs of approximately $534.7 million per annum on average during ramp up and approximately $1.4 billion per annum on average during steady state gas production. This is equivalent to an increase in Darling Downs’ GRP in 2009-10 of 4.3% and 11.2%, respectively (refer to section Table 4.2).
In consideration of anticipated baseline growth in the Darling Downs economy, GRP is estimated to increase by approximately 2.5% compared to what would otherwise be expected to occur without the project during ramp up. The increase in GRP above the baseline scenario is estimated to magnify to 5.1% once steady state gas production is reached.
Table 5.4. Average Annual Impact on Key Economic Indicators in the Darling Downs, Deviation from the Baseline (Without Project) Scenario
Economic Indicator Change from Baseline Scenario
2013-14 to 2018-19
2019-20 to 2027-28
Change from Baseline Scenario (Value)
Industry Output ($M) $722.8 $1,844.9
Gross Regional Product ($M) $534.7 $1,409.1
Household Incomes ($M) $28.7 $51.0
Employment (FTE) 384 332
Change from Baseline Scenario (%)
Industry Output (%) 2.0% 4.1%
Gross Regional Product (%) 2.5% 5.1%
Household Incomes (%) 0.5% 0.6%
Employment (%) 0.3% 0.2% Source: Prime Research (unpublished).
Development of the coal seam gas industry is in keeping with regional and State Government planning for the Darling Downs and Surat Basin economy. The literature review (summarised in Appendix A) identifies energy resources, in particular gas, as one of the key sectors for future economic development in the region, in conjunction with agriculture and food manufacturing.

Economic Impact Assessment: Surat Gas Project Final Report
56
5.5 Direct Investment Opportunities
There is likely to be little scope for direct equity investment by local businesses during either the construction or operation phases of the Surat Gas Project. The proponent will attempt where practical and possible to source inputs from local and regional business to support the project, however, this is likely to be limited to work carried out on a contractual rather than equity basis.
Arrow Energy Pty Ltd, is a wholly owned subsidiary of Arrow Energy Holdings Pty Ltd, which has been wholly acquired by subsidiaries Royal Dutch Shell plc and PetroChina Company Ltd.
5.6 Distributional Impacts
Distributional effects refer to the way in which the economic impacts of the development accrue to individuals and groups. Three key groups that will be impacted by the project are:
• Business and industry;
• Households; and
• Government.
The anticipated impacts to these groups are examined in the sub-sections below.
5.6.1 Impacts on Business and Industry
The Surat Gas Project has the potential to beneficially impact some businesses and industries, while some businesses and industries have the potential to be adversely impacted by the project. Impacts to industry in terms of industry output are presented in 5.1.2. Additional detail on the potential beneficial and adverse impacts on business and industry is presented in this section.
The Surat Gas Project will provide opportunities for local business to secure new contracts and increase sales to supply and service the needs of both the project and the workforce. This will support the viability of some local small businesses in the Darling Downs.
Local Supply Contracts
Consultation with economic development organisations identified that gas related activity in the region in recent years has supported development of industrial land, notably in Dalby. Businesses supplying transport, logistics and drilling services and technical laboratory support to the gas industry have taken up new industrial land releases, with the majority of these operations representing new businesses rather than existing businesses upgrading and/or expanding facilities. This process can be expected to continue as the supply opportunities are realised and, for some goods and services, the demand for and benefits of localised delivery are realised (for example, local supply and support may be a key factor in winning a supply contract). This may result in some businesses looking to relocate or establish a local/ regional office.
Nonetheless, there are a number factors that will be expected to constrain the capacity of local businesses to supply the project, including:
• Scale: Many small businesses will not have the capacity to supply large contracts. This will be more prominent for specialised, larger scale requirements of the project (e.g., engineering construction). To some extent this may be overcome by partnering and collaborating with other local businesses or external parties, however, consultation identified there is currently very little collaboration or clustering amongst small business to deliver the combined capacity and economies of scale to be competitive and efficient in delivering the products and services needed for major projects; and
• Quality Assurance (including Health, Safety and Environment): Many small businesses will not meet quality assurance standards required of the proponent. Consultation identified many businesses in the region are not fully cognizant of the

Economic Impact Assessment: Surat Gas Project Final Report
57
stringent quality assurance requirements of major projects and will be unable to compete for supply contracts in the short term on this basis.
Benefits of the Surat Gas Project to local business will not be isolated to those industries supplying goods and services to the project. Retail and other household services will benefit as a result of additional population, household incomes and expenditure in the region. As demand is a major factor influencing the supply of goods and services, a significant and permanent increase in population and incomes will generate business opportunities to meet additional demand locally, in particular for goods and services used on a regular basis (e.g., groceries) and entertainment/ recreation options. An increase in population, and the additional demand this generates, can also provide a ‘catalytic’ level of demand for some services and activities (i.e., population increase generates sufficient demand to attract a new service or activity to a region).
Increased Demand for Household Services
This will also be the case for firms supplying business-to-business services. Consultation with local business revealed a sentiment that a larger population base will have strong positive impact on the availability and range of services locally.
An assessment of potential impacts of the Surat Gas Project on agricultural lands was undertaken by Gilbert and Sutherland (2011). The assessment indicates the Surat Gas Project may impact upon up to approximately 1.5% to 3.0% of total land area within the Surat Gas Project’s well footprint (Gilbert and Sutherland, 2011), with the potential for diminished productive capacity in the areas impacted during the project’s life.
Impacts on Agriculture
Gilbert and Sutherland (2011) identify that the scale of impacts of the Surat Gas Project on agricultural productivity will vary greatly across the development area according to specific local characteristics, such as:
• The unique properties of soils at different sites;
• The tolerance of crops grown in the area to degraded soils;
• Property size, with larger properties likely to be less affected in the broader operations than smaller properties; and
• The localised impacts of climate change.
Not all of the land area impacted will be high quality agricultural lands. In fact, it could realistically be considerably less than 1.5% to 3.0% of high quality agricultural land in the development footprint affected; Arrow has committed to working with landholders to minimise the disturbance of good quality agricultural land (GQAL) or strategic cropping land, and as such, has developed policies and procedures highlighting an intent to place gas wells and infrastructure in areas that avoid or minimise impacts on high quality agricultural land to the extent practical and possible. Furthermore, any disruption to agricultural land will be temporary and it is expected that all land impacted by gas wells and associated pipeline and other infrastructure will be rehabilitated to a pre-development standard following gas well closure.
In line with requirements of the Petroleum and Gas (Production and Safety) Act 2004 (Qld), Arrow will also negotiate and provide compensation to landholders affected by infrastructure developed for the Surat Gas Project to assist in mitigating impacts of any lost productive value.
The Surat Gas Project will compete with local business and industry for constrained labour resources. Due to the higher than average incomes on offer from the project during both construction and operation, it is expected that the Surat Gas Project will attract labour away from other businesses both locally and further afield. This is examined in section
Competition for Labour
5.2.1.
Where local businesses are unable to attract and/ or retain staff, this impacts on their capacity to sustain business productivity and limits potential for future business growth.

Economic Impact Assessment: Surat Gas Project Final Report
58
Attraction and retention of staff will be more of an issue for lower income paying industries (in particular agriculture, smaller manufacturing businesses and many service based industries such as retail, education and local government) that are unable to compete for labour on a price basis. Issues of attracting and retaining staff may be exacerbated by potential impacts of the project on costs of living, which has the effect of reducing disposable incomes and placing cost pressures on lower income earners. This issue is examined in more detail in the social impact section of the EIS.
Consultation with local Council and economic development organisations indicated that in recent years, as local labour has moved to construction projects in the region there have been difficulties in filling vacated positions due to the tightness in labour markets and difficulties associated with encouraging workers to move to small and remote locations.
The Surat Gas Project is estimated to result in an increase in real wage rates (i.e., increase the average wages and salaries received by employees from industry) in the Darling Downs, Queensland and Australia, driven by increased demand and competition for labour (refer to section
Increased Business Costs and Reduced Profitability
5.2.2.4 for additional details on impacts to real wages). In order to recover costs and maintain business profitability, it is likely that some businesses will seek to increase prices for their goods and services (resulting in inflation in the Australian economy), placing additional cost pressures on business and industry that utilise these goods and services as an input to production. In line with the relatively mild increase in real wages, the impact of the Surat Gas Project on business costs is anticipated to be minor.
For businesses where increases in labour and other input costs are not matched by an equivalent increase in the prices of their goods and services, this will erode business profitability, potentially impacting on business viability. This impact is likely to be felt most strongly by industries that are price takers, such as many agricultural and manufacturing businesses where final products compete on global markets with limited capacity to increase prices to match increases in costs.
The Surat Gas Project will produce gas for the export market, and given the scale of development it is realistic to expect this level of exports to support the Australian dollar over the medium to long term. A strong Australian dollar will assist many businesses and households that purchase goods and services from overseas through potential effects of exchange rates on the price of these goods and services. However, a strong Australian dollar can also be a negative for industries which sell their products and services overseas, as these products and services will be more expensive to foreign buyers (for example, manufacturing, some agricultural commodities and tourism-related sectors).
Impacts on Exchange Rates and Global Competitiveness
5.6.2 Impacts to Households
The Surat Gas Project has the potential to considerably increase household incomes and wealth.
Construction activities will generate demand for construction workers and materials as well as other construction support services such as plant and equipment supplies. Around 38% of the Surat Gas Project’s well development capital cost is expected to be expended on local labour and businesses in the Darling Downs, with a further 10% expended in the rest of Queensland, 21% in the rest of Australia and 31% internationally (refer to section 3.2).
A large proportion of the expenditure locally is expected to be associated with the supply of construction labour. However, a significant proportion of this labour force (assumed approximately 80%) is expected to be FIFO/ DIDO workers ‘imported’ from outside of the Darling Downs and only temporarily staying in the region for the period of their contract. This will result in some of the additional consumption expenditure driven by construction wages and salaries being spent outside of the Darling Downs in the workers’ place of usual residence, resulting in some ‘leakage’ of local benefits.
Unlike many other construction projects which tend to have project lives of one to three years, well construction activity is expected to continue through to 2030, extending these

Economic Impact Assessment: Surat Gas Project Final Report
59
benefits to the long term. In the medium to long term, it is likely that the number and proportion of construction workers residing permanently in the region will increase. The operational labour force for the Surat Gas Project is anticipated to entirely reside permanently in the Darling Downs, with workers either sourced from the local labour force or permanently migrating to the region for work.
Flow-on expenditure is also likely to contribute to growth in local employment opportunities and inward migration, as demand for local industry supply of goods and services as well as for recreational and community services encourages business investment, relocation and expansion in the region.
As a result, the economic benefits generated by the Surat Gas Project are expected to increasingly be retained in the local and regional economy as local labour and support industries expand to meet project demand.
Figure 5.4 provides a summary of the modelling estimates of household incomes resulting from employment opportunities generated by the Surat Gas Project in the Darling Downs, Queensland and Australia. These estimates are based on the place of residence of income earners, as this is where the majority of expenditure from households is likely to be captured.
The figure highlights the wide ranging effects of the project on household incomes, with the Darling Downs, the rest of Queensland and the rest of Australia all realising relatively large proportions of total income effects of the project. This result is a reflection of three key factors:
• The addition of high income paying jobs in the Surat Gas Project, boosting overall income earnings of those employed directly by the project;
• Moderate growth in real wages (refer to section 5.2.2.4), which represents a lift in the average incomes paid to all employees. The increase in real wages is expected to be strongest in the Darling Downs, but will be felt throughout Queensland and Australia. The increase in real wages is over and above any increases in inflation, and therefore represents an increase in disposable incomes for Australian households; and
• Increased economic activity, spending and employment throughout Australia as a result of the Surat Gas Project, primarily driven by increased government taxation revenues and subsequent expenditure.
Of note, household income impacts are initially largest in the rest of Queensland, however, over time these benefits to the rest of Queensland decline and from 2024-25 are estimated to become negative. This is a reflection of:
• The high FIFO/ DIDO labour force component during construction, which peaks during the ramp up period (2013-14 to 2018-19); and
• In the longer term, labour (in particular operational labour) are estimated to permanently migrate to the Darling Downs from the rest of Queensland, resulting in negative net income impacts in the rest of Queensland compared to the baseline (without project) scenario.

Economic Impact Assessment: Surat Gas Project Final Report
60
Figure 5.4. Impact of the Surat Gas Project on Household Incomes in the Darling Downs, Queensland and Australia, Deviation from the Baseline (Without Project) Scenario
Note: All years depicted in the figure are year ended June. Source: Prime Research (unpublished).
Not all impacts on households from the Surat Gas Project will be positive. For example, much of the additional wealth generated by the Surat Gas Project will be distributed to those directly engaged in the project (through wages and salaries or profits). As outlined in Figure 5.4, this can lead to a repatriation of wealth from the Darling Downs (where the jobs are generated) to the rest of Queensland and rest of Australia where workers permanently reside, in particular during the ramp up period where a large proportion of construction workers are anticipated to operate on a FIFO/ DIDO arrangement.
The Surat Gas Project is also likely to result in an overall increase in the cost of living, particularly in the Darling Downs. Impacts on the cost of living will be two-fold:
• The anticipated increase in real wages, while representing a benefit in terms of increased household income, also reflects an increase in costs of production for business. Higher costs of production is likely to see prices for some goods and services increase to maintain business profitability (refer to section 5.6.1); and
• The draw of labour to the Darling Downs, in particular permanent migration to the region during operation, has some potential to increase the cost of housing and accommodation where growth in demand exceeds growth in supply. This is examined further in section 5.3, and outlines the impact of the Surat Gas Project on the cost of housing is likely to be small.
For households, the increase in prices for goods and services and for housing represents an increase in the cost of living, the impact of which will be felt most keenly by lower income earning households. An increase in the cost of living will result in a reduction in disposable incomes, with the most obvious impact being on demand for discretionary expenditure items (e.g., luxury goods and other non-essentials).
However, it should be recognised that despite the likely increase in the cost of living, modelling outcomes indicate that residents of the Darling Downs, Queensland and Australia are expected to be, on average, “better off” as a result of an increase in the real wage, which reflects an increase in wages and salaries above inflation.
-0.1%
0.0%
0.1%
0.2%
0.3%
0.4%
0.5%
0.6%
0.7%
0.8%
0.9%
-$20
$0
$20
$40
$60
$80
$100
$120
$140
$160
$180
2014 2015 2016 2017 2018 2019 2020 2021 2022 2023 2024 2025 2026 2027 2028
Change in H
ousehold Incomes from
the Base C
ase (%)C
hang
e in
Hou
seho
ld I
ncom
es f
rom
the
Bas
e C
ase
($M
)
Darling Downs - Incomes ($M) Rest of Queensland - Incomes ($M)
Rest of Australia - Incomes ($M) Darling Downs - Incomes (%)
Queensland - Incomes (%) Australia - Incomes (%)

Economic Impact Assessment: Surat Gas Project Final Report
61
5.6.3 Impacts on Local, State and Commonwealth Government Taxes and Revenues
Details of anticipated taxation revenues associated with the Surat Gas Project, relative to the base case, are summarised in Table 5.5, with the Queensland Government expected to receive over one third of additional revenue, primarily through royalty payments.
It should be noted that a portion of Australian Government revenues are likely to provide benefits to Queensland through the subsequent expenditure and redistribution of these revenues to provide services and infrastructure throughout Australia.
Table 5.5. Aggregate Queensland and Australian Government Revenues from the Surat Gas Project, 2013-14 to 2027-28
Government Estimated Revenue ($M)
Proportion of Total Government Revenue
Queensland $1,691.3 34.2%
Australian $3,257.6 65.8%
Total $4,948.9 100.0% Source: Prime Research (unpublished), AECgroup.
On an average annual basis, the Surat Gas Project is estimated to provide:
• The Queensland Government with additional revenues of approximately $120.8 million per annum. This equates to an average annual increase in Queensland Government revenues of approximately 0.3% from the $39.7 billion received in 2009-10 (Queensland Government, 2010b); and
• The Australian Government with additional revenues of approximately $232.7 million per annum. This equates to an average annual increase in Australian Government revenues of approximately 0.1% from the $298.9 billion received in 2009-10 (Commonwealth of Australia, 2010).
More detail regarding the source of revenue is discussed in the following sections.
5.6.3.1 Local Government
Additional workers locating permanently or temporarily can be expected to contribute to council revenues, through additional rates revenue associated with dwellings and workers camps that are constructed to meet additional demand and any appreciation in land value brought on by increased population. For renters, and those in workers camps, council fees and charges will be met by the landlords and employers.
The net impact on each regional council is expected to be neutral in the long run, with additional revenues (including headworks charges and developer contributions) used to fund additional capital and/or operating expenditure to ensure the marginal cost to users remains unchanged, assuming fees and charges are appropriately levied.
5.6.3.2 State Government
The Surat Gas Project will increase Queensland Government revenues directly and indirectly through:
• Payroll tax; • Royalties; • Transfer (Stamp) duty; • Land tax; • Tenure Rents; and • Other duties (e.g., motor vehicle, insurance, gambling).
Payroll tax and royalties will be the two largest contributors to Queensland Government revenues. Estimates of payroll tax and royalty revenues have been developed based on industry benchmarks for 2009-10 applied to results from CGE modelling. The Surat Gas Project is estimated to contribute approximately $1.69 billion in total to Queensland Government revenues between 2013-14 and 2027-28 through payroll tax and royalties (refer to Table 5.6).
Queensland Government tax revenues from transfer duties, land tax, tenure rents and other duties are difficult to estimate in consideration of potential flow-on impacts of the

Economic Impact Assessment: Surat Gas Project Final Report
62
project. Revenues from these taxes have not been estimated, but are likely to be considerably smaller than revenues provided by payroll tax and royalties.
Table 5.6. Aggregate Queensland Government Revenues from the Surat Gas Project, 2013-14 to 2027-28
Revenue Source Estimated Revenue ($M) Proportion of Revenue
Payroll Tax $99.7 5.9%
Royalties $1,591.6 94.1%
Total Revenue $1,691.3 100.0% Source: Prime Research (unpublished), AECgroup.
5.6.3.3 Australian Government
The Surat Gas Project will have a positive impact on Australian Government revenues through increased personal income tax, fringe benefits tax, company tax and goods and services tax (GST) revenues. The aggregate value of the Surat Gas Project’s direct and indirect impacts on Australian Government revenues is estimated to be $3.26 billion in the period 2013-14 to 2027-28 (refer to Table 5.7).
Assessing tax impacts is complex due to exemptions, deductions, variable tax rates, and varying range of salaries, consumption and business profits. Estimates of Australian Government tax revenues have therefore been developed based on industry benchmarks for 2009-10 applied to results from CGE modelling.
Table 5.7. Aggregate Australian Government Revenues from the Surat Gas Project, 2013-14 to 2027-28
Revenue Source Estimated Revenue ($M) Proportion of Revenue
Income Tax $561.1 17.2%
Fringe Benefits Tax $19.2 0.6%
Company Tax $2,305.7 70.8%
GST $371.6 11.4%
Total Revenue $3,257.6 100.0% Source: Prime Research (unpublished), AECgroup.
5.7 Costs to Government of Additional Infrastructure Provision
As outlined in sections 5.6.1 and 5.2.1, the Surat Gas Project will result in additional business and employment opportunities and, subsequently, population growth in the Darling Downs. This will result in an increase in demand for a number of local, State and Commonwealth government facilities, infrastructure and services, which will require additional government expenditure to meet.
While the provision of additional facilities and infrastructure (and some services) presents an upfront cost to government, it should be recognised that the majority of economic and social infrastructure is provided on a user pays basis. For example, the cost to deliver water, sewerage and waste services are embodied in local council rate charges, electricity charges are met on a user pays basis, as are rail and air transport and telecommunication charges. Depending of the level of competition in a market, charges typically reflect long run marginal costs, which take account of capital and operating costs, including ongoing costs to upgrade and replace capital.
Theoretically, assuming council and business planning processes identify and respond to changes in demand in a timely manner, the net impact of the Surat Gas Project in terms of costs to government for additional infrastructure provision, should be zero over the longer term.
One general exception to the user pays concept is roads in the region (although in some circumstances the user may be required to pay if it classifies as a “notifiable road use”

Economic Impact Assessment: Surat Gas Project Final Report
63
under the Petroleum and Gas (Production and Safety) Act 2004 (Qld)8
Findings from review of literature (refer to Appendix A) and consultation with Council and economic development organisations identified that infrastructure constraints are already being experienced in the region, in particular road and rail transport infrastructure and telecommunications infrastructure.
). Roads are public goods, and with the exception of certain road uses (such as notifiable road uses) no-one can effectively be excluded from using them, even if they do not pay for them. As such, there is the risk that increased volumes of traffic and loads directly associated with the Surat Gas Project will increase costs to local and Queensland governments.
Cardno Eppell Olsen (2010) identify that traffic associated with the Surat Gas Project has the potential to negatively impact the road environment, through increased stress on the road network, infrastructure and road safety. In particular, the Surat Gas Project is expected to have an impact on road ‘life’ on the Leichhardt Highway (immediately north of Miles), the Warrego Highway (between Miles and Dalby), the regional connecting road between Dalby and Millmerran and the Gore Highway south of Millmerran. Surat Gas Project activity in these areas is expected to reduce pavement life by approximately 5% or more. That is, in the absence of upgrades/increased repairs and maintenance, roads will deteriorate more rapidly, with potential (direct and indirect) economic and social costs.
It is anticipated that Arrow will collaborate with local council’s to identify relevant contributions for road upgrades and maintenance. Assuming relevant transport impacts related to the Surat Gas Project are compensated by Arrow, the net budgetary impact to government will be zero (additional costs will be offset by additional revenue). In consideration of existing issues in the Darling Downs in terms of road network capacity, contributions by Arrow for road upgrades and maintenance will likely result in an improvement in overall road conditions.
Planning and provision of social infrastructure such as schools, hospitals, law enforcement and recreational facilities will depend on government priorities, which is likely to be influenced by population growth and identified demand. Implications of the Surat Gas Project for social infrastructure is examined in the Social Impact Assessment undertaken by URS (2011) and appended to the Surat Gas Project EIS.
5.8 Implications for Future Development in the Region
5.8.1 Use of Land
Much of the land in the Darling Downs is used for agricultural purpose ranging from cropping to pasture and some intensive agriculture. The development of the energy resource sector has the potential to impact some agricultural land uses (through competition for land) unless activities are carefully managed to ensure they are able to co-exist. There is a strong local desire to maintain the status of the agricultural industry. The Queensland Government intends to introduce legislation in late 2011 which aims to protect designated ‘strategic cropping land’ from developments that would lead to its permanent alienation or diminished productivity (DERM, 2011c).
The Queensland Resources Council (QRC, 2011) analysed the impact of current and expected land disturbance generated by the resources sector in the Darling Downs on food security. It was concluded in this analysis that development of the resources sector is unlikely to result in a material impact on domestic or global food security between 2011 and 2020. This is due to the relatively low percentage of total land area in the Darling Downs that is anticipated to be disrupted by the resources sector.
An assessment by Gilbert and Sutherland (2011) on the impacts of the Surat Gas Project on agricultural lands indicates the project may impact upon approximately 1.5% to 3.0% of total land area within the Surat Gas Project’s well footprint. As outlined in section 5.6.1, not all of the land area impacted will be high quality agricultural lands and Arrow has a stated intent to avoid disturbing highly productive agricultural land and have
8 Under the Petroleum and Gas (Production and Safety) Act 2004 (Qld), for a notifiable road use the road user must provide notification to the relevant authority with compensation for “any cost, damage or loss it incurs, or will incur, that is or will be caused by notifiable road uses carried out by the holder that relate to the road.”

Economic Impact Assessment: Surat Gas Project Final Report
64
committed to working with landholders to minimise the disturbance of good quality agricultural land (GQAL) or strategic cropping land.
5.8.2 Other Impacts
The Surat Gas Project is likely to positively contribute to the future development of the Darling Downs through the following means:
• Opportunities for the growth of associated industries in the area. The Draft Surat Basin Economic Development Strategy (AECgroup, 2011), which has been made available for public feedback by DEEDI, identifies a number of sectors that provide the opportunity for economic development over the next 10 years (refer to Appendix A: Literature Review). The growth of several of these sectors will be encouraged by the Surat Gas Project, either directly (through development of a local supply chain) or indirectly (through population growth due to inward migration of labour). These sectors include building materials and manufacturing, education, environmental services, health services and machinery and equipment manufacturing; and
• Skills development and training opportunities provided by the Surat Gas Project can be expected to result in the ‘up-skilling’ of the regional labour force (refer to section 5.2.2.2). This will be beneficial to development in the region after the life of the Surat Gas Project.
There is potential, however, for the Surat Gas Project to have some adverse implications for future development through the following avenues:
• Short-term competition for construction labour can be expected (refer to section 5.2.2.3). The shortage of labour can be expected to bid up wages in the region. Therefore the Surat Gas Project may result in some other developments being delayed or postponed; and
• As the majority of gas to be extracted is to be converted to LNG for export, the Surat Gas Project is expected to maintain the strength of the Australian dollar. This may have adverse consequences for the profitability of exporting sectors, while benefiting households and businesses that import from abroad (refer to section 5.12).
5.9 Value of Lost/ Gained Economic Opportunities
The commercialisation of CSG reserves represents a relatively new industry globally and in developing the Surat Gas Project there is the opportunity to develop skills and expertise that are valuable in the international market, and could potentially result in a new export industry.
An advantage of coal seam gas extraction is that it leaves the coal resource intact for future extraction. As such, the extraction of CSG is not anticipated to result in lost economic development opportunities regarding future coal extraction activities or alternative use of coal (for example, underground coal gasification).
With large volumes of by-product water extracted with the CSG there are likely to be opportunities for associated beneficial use of this water (e.g., for coal washing, light industry, dust suppression and irrigation) though this will depend on water quality and/ or transport and treatment costs.
Potential foregone economic opportunities include local economic development opportunities that rely on gas as an input. This will work in three ways, firstly through the loss of large volumes of gas to export markets. This gas could alternatively have been used locally in the future, secondly through price impacts that ration gas supply to manufacturing activities, and thirdly through exchange rate impacts that disadvantage exporters and importing competing businesses. Modelling undertaken for this report suggests the Surat Gas Project will result in decreased agricultural and manufacturing output in Queensland (albeit, with significant increases in economy-wide production).
Agricultural production also has the potential to be impacted by the loss of productive land to gas production. Nonetheless, any disturbance to agricultural land will be temporary and it is expected that all land will be rehabilitated to a pre-CSG standard.

Economic Impact Assessment: Surat Gas Project Final Report
65
5.10 Economic Impacts of Major Hazards
A Hazard and Risk Assessment of the Surat Gas Project was prepared by Planager (2011) as part of the project approval process to determine the risk to people and property from potential significant incidents associated with the Surat Gas Project. The Hazard and Risk Assessment does not specifically consider economic risks but rather focuses on the following types of risks:
• Risk of human injury or fatality;
• Risk of propagation of an incident to neighbouring facilities or damage to property; and
• Risk of damage to the natural environment from significant incidents.
The Hazard and Risk Assessment provides an assessment of the likelihood and consequence of the above risks across the construction, commissioning and operation of the following infrastructure:
• CSG wells;
• Gathering system;
• Field compression facilities;
• Central gas processing facilities; and
• Integrated production facilities.
The Hazard and Risk Assessment did not identify any risks to public safety or to the biophysical environment from accidental releases of hazardous material associated with the proposed development beyond acceptable levels or that exceed legislative safety and risk guidelines.
From the point of view of adherence to generally accepted risk criteria, the proposed facilities which form part of this development can be developed within the Surat Basin alongside existing land use and possible future development.
5.11 Energy Self Sufficiency and Security
An assessment of likely impacts of the Arrow LNG Plant on the domestic gas market and gas prices was undertaken by ACIL Tasman (2011) as part of the Arrow LNG Plant EIS. The analysis examined a range of scenarios, and identifies development of gas to supply the first two trains of the Arrow LNG Plant (which is approximately in line with proposed gas extraction rates from the Surat Gas Project) will place increased pressure on Eastern Australian gas consumption and prices.
5.12 Impacts on Balance of Payments
Construction expenditure on gas wells and water and gas treatment facilities is expected to be incurred throughout the life of the Surat Gas Project (refer to Figure 3.1). The majority of this will be incurred in the first 8 years of the project, between 2014 and 2022. Just under a third, or 31% of construction expenditure is expected to be spent overseas as materials and labour are imported. Assuming the proportion of expenditure spent overseas remains constant over the project’s life, the value of imports will decline as the project progresses.
At average sustained production, 970 TJ/day of gas is expected to be converted to LNG. This is equivalent to 354PJ per annum. Assuming an LNG gas price of US$10/MMBTU (as outlined in section 3.2) and an exchange rate of around USD0.80/AUD, the Surat Gas Project could potentially generate approximately $4.2 billion of LNG exports per annum.
Queensland’s balance of payments (including interstate and overseas trade) was estimated to be -$1.2 billion in 2009-10, consisting of $82.7 billion in imports and $81.5 billion in exports (Queensland Treasury, 2011). The balance of payments for the whole of Australia was estimated to be -$3.9 billion, consisting of $256.7 billion in imports and $252.8 billion in exports (ABS, 2011d). Once at average sustained production, the Surat Gas Project has the potential to increase Queensland exports by around 5%, and Australia-wide exports by around 1.5% to 2%.

Economic Impact Assessment: Surat Gas Project Final Report
66
While the magnitude of expected imports for construction is unknown, it is expected that once peak production is reached, the value of exports will exceed the value of imports generated by the Surat Gas Project. Overall this will increase the balance of payments for both Queensland and Australia, and help maintain the currently high value of the Australian dollar. As discussed in section 5.6.1, a strong Australian dollar benefits importing businesses and households, while disadvantaging exporting businesses (e.g., those in the manufacturing, agricultural and tourism industries), many of which are already competing in tight global markets. However, the impact of the Surat Gas Project on Australia’s exchange rate is likely to be small.
5.13 Cost Benefit Analysis
A Cost Benefit Analysis (CBA) for the Surat Gas Project is provided in Appendix H. The CBA shows that, assuming a discount rate of 15.0%, the Net Present Value (NPV) of the Surat Gas Project to the Queensland economy is estimated at $1.66 billion (refer to Table 5.8). Even at a real discount rate of 20% the Surat Gas Project is estimated to result in a net benefit to Queensland of $605.5 million.
Table 5.8. Summary CBA Results of Surat Gas Project Impacts to Queensland
Real Discount Rate NPV ($M)
6.0% $6,400.6
10.0% $3,587.0
15.0% $1,655.4
20.0% $605.5 Source: AECgroup
The CBA identifies that the Surat Gas Project is economically desirable for Queensland with the benefits outweighing the costs across all discount rates examined (6%, 10%, 15% and 20%).
Sensitivity analysis across three key variables (construction expenditure by the proponent, value of foregone agricultural production and net value added activity in Queensland) highlighted a 90% probability of the project returning a NPV of between $405.1 million and $2.9 billion at a discount rate of 15%. Whilst this appears a broad range, in consideration of the level of investment by the proponent and anticipated net value added economic activity estimated to be generated by the project, this represents a relatively narrow upper (combination of all anticipated best case) and lower (combination of all anticipated worst case) band of outcomes for the variables examined.
5.14 Summary of Impacts
Assessment of the economic impacts of the Surat Gas Project in the above sections directly responds to the terms of reference (set out in section 2.1) and identifies a wide range of beneficial and adverse impacts associated with the project. However, there is considerable overlap between terms of reference items (e.g., impacts of the draw down on labour and other resources is relevant to and has been discussed in more than one terms of reference item).
The following summary distils the wide range of impacts down into the key beneficial and adverse impacts arising from the Surat Gas Project. Beneficial impacts are described in the dot points below, however, adverse impacts have been examined using a risk assessment framework described in Appendix E to enable comparison of impacts following appropriate mitigation measures in chapter 6.
Potential beneficial impacts arising from the Surat Gas Project include:
Beneficial Impacts
• Contribution to economic growth in the Darling Downs and Queensland through increased industry output, GRP, employment and incomes throughout the project life through both direct and indirect impacts;
• Opportunities for local business to secure new contracts and increase sales to supply and service the needs of both the project and the workforce. This will likely contribute

Economic Impact Assessment: Surat Gas Project Final Report
67
to the development of an industry supply chain to support gas and energy resources, may support the viability of some local small businesses in the Darling Downs;
• Increased population (through attraction of labour to the Darling Downs) and business activity will provide additional demand for local household and business services and likely increase service levels over time;
• Arrow will implement skills development and training strategies as part of the Surat Gas Project, delivering a permanent lift in the local skills base. This will be supported by the delivery and implementation of existing Queensland and Australian government programs and funds to support skills development in the construction and energy sectors;
• Households will be beneficially effected by the project, through:
o Increased job and income earning opportunities, with a subsequent decrease in unemployment;
o Increased household incomes resulting from additional jobs, as well as through a moderate increase in real wages (i.e., above inflation) resulting from competition for labour and upward pressure on prices;
• The Surat Gas Project will provide a lift in local, State and Australian Government taxation revenues through a variety of taxes and duties. These additional revenues would then be used to provide additional infrastructure and services to support business and households throughout Australia; and
• Support for the Australian dollar through production of high value gas for export as LNG. The impacts of a strong domestic currency can be both positive and negative, with a key beneficial impact being lower comparative prices for foreign goods and services.
Key adverse impacts arising from the Surat Gas Project are outlined in
Adverse Impacts
Table 5.9, including assessment of anticipated risk or level of impact associated (using a risk assessment framework described in Appendix E).
Table 5.9. Assessment of Adverse Impacts of the Surat Gas Project
Impact Description Likelihood Consequence Impact Rating
Impacts on Business: The Surat Gas Project is likely to adversely impact on some businesses and industry in the Darling Downs and the rest of Queensland as a result of: • Competition for and draw of labour to the Surat Gas Project and
its supply chain (refer to sections 5.2.1 and 5.6.1). This has the potential to exacerbate skills shortages in the region and Queensland (for both construction and energy related skills) and place upward pressure on labour prices (wages and salaries) for business to attract and retain labour;
• Escalating costs of labour and other inputs to production (refer to sections 5.2.2.4 and 5.6.1), which could reduce business profits and viability for some businesses/ industries, particularly for local business already operating at, or near, “the margin”; and
• Support for the Australian dollar as a result of the high level of gas exports (in the form of LNG) generated by the project (refer to section 5.12 and 5.6.1), can adversely impact on those sectors that are “trade exposed”, such as agriculture, manufacturing and tourism, if it results in these products and services becoming more expensive to foreign buyers.
Almost Certain Moderate High

Economic Impact Assessment: Surat Gas Project Final Report
68
Impact Description Likelihood Consequence Impact Rating
Impacts on Agricultural Production: The Surat Gas Project may impact up to approximately 1.5% to 3.0% of total land area within the Surat Gas Project’s well footprint (refer to section 5.6.1). Arrow has committed to working with landholders to minimise the disturbance of good quality agricultural land (GQAL) or strategic cropping land and has developed policies and procedures highlighting an intent to place gas wells and infrastructure in areas that avoid or minimise impacts on high quality agricultural land to the extent practical and possible. Where this cannot be delivered, it is almost certain this will result in some diminished productive capacity in the areas impacted during the project’s life, however Arrow is required to compensate landholders for any impacts on productivity. The scale of impacts on agricultural productivity will vary across the development area according to specific local characteristics, but will be temporary in nature, as it is expected that all land impacted by gas wells and associated pipeline and other infrastructure will be able to be completely rehabilitated to a pre-development standard following gas well closure.
Likely Minor Medium
Impacts on Housing Prices and Availability of Affordable Housing: Residential property impacts from the Surat Gas Project are expected to be minor in consideration of the use of worker camps to accommodate imported construction labour, the relatively small number of operational employees migrating to the region, long lead time to peak workforce and dispersed nature of the project (refer to section 5.3.2). Even so, it is possible the project could contribute to some degree to an increase in demand (and thereby place additional upward pressure on housing prices which have escalated considerably in the past five years), through permanent migration of workers to the region for either direct or flow-on employment opportunities.
Possible Minor Low
Impacts on Industrial/ Commercial Land Prices: The Surat Gas Project has the potential to increase demand for industrial/ commercial land as a result of flow-on supply chain and support service development (refer to section 5.3.1). The Darling Downs is currently underserviced in terms of industrial land that is ready for development, with industrial land prices having doubled in some areas in the past two years. This price growth will likely be exacerbated to some degree by the Surat Gas Project.
Likely Minor Medium
Impacts on Rural Property Values: The potential for reduced productive capacity in some landholdings (see “Impacts on Agriculture Production” above) may result in a decline in the value of these properties (refer to section 5.3.3). Agricultural land values in the Darling Downs have softened in recent years, primarily driven by factors such as rural downturn and drought. Uncertainty regarding impacts on agricultural production from the resources sector and potential compensation may also have been a contributing factor. The impact of the resources sector on rural property values is very difficult to isolate, but is likely to be insignificant relative to factors such as rural downturn and drought.
Possible Insignificant Low
Impacts on Local Infrastructure and Service Capacity: Findings from review of literature (refer to Appendix A) and consultation with Council and economic development organisations identified that infrastructure constraints are already being experienced in the region, in particular road and rail transport infrastructure and telecommunications infrastructure (refer to section 5.7). The Surat Gas Project will place additional demand on this infrastructure, which will likely contribute to capacity issues and require infrastructure upgrades and maintenance, in particular for road and air infrastructure9
Likely
.
Minor Medium
Source: AECgroup.
9 In addition there may be a need for additional social infrastructure to support the needs of direct and indirect migration to the region due to the Surat Gas Project. This is examined in the Social Impact Assessment by URS (2011) appended to the Surat Gas Project EIS.

Economic Impact Assessment: Surat Gas Project Final Report
69
6. Mitigation and Enhancement Measures for Key Impacts This chapter summarises the key impacts and issues arising from development and operation of the Surat Gas Project as identified in chapters 5 and 6 and recommends strategies for addressing these issues.
6.1 Key Issues/ Impacts to be Addressed
Assessment of the economic impacts of the Surat Gas Project in chapter 5 identified the following key issues that need to be addressed in order to minimise any adverse impacts of the project and to maximise any potential benefits:
• Impacts on local business as a result of:
o Competition for and draw of labour to the Surat Gas Project and its supply chain;
o Deepening skills shortages in both the construction and energy sectors;
o Escalating costs of labour and other inputs to production, reducing business profits and viability; and
o Support for the Australian dollar as a result of the high level of gas exports;
• Impacts to agricultural production from land disruption;
• Impacts on industrial/ commercial land prices as a result of flow-on supply chain and support service demand;
• Potential impacts on availability and affordability of housing resulting from increased temporary and permanent population in the region;
• Potential for impacts on rural property prices as a result of land disruption; and
• Impacts on already constrained local infrastructure and service capacity from additional economic activity and population loads.
To assist in addressing the above issues, the following mitigation strategies are proposed:
• Support strategies aimed at addressing skills shortages in the construction and CSG industries, as well as those that assist local business back-fill positions vacated through labour draw;
• Provide assistance/ guidance to local business to secure supply contracts;
• Develop appropriate strategies for minimising impacts on agricultural production;
• Minimise impacts on local property markets (industrial/ commercial, residential and rural) by:
o Informing relevant Council and State Government departments of goods and services needs of the Surat Gas Project to allow appropriate planning and release of required industrial and commercial land;
o Ensuring construction worker camps are developed prior to commencement of construction activity on the gas fields;
o Ongoing dialogue with construction industry bodies, State Government and local Council regarding anticipated worker accommodation requirements;
o Monitoring availability of residential property to accommodate operational workers migrating to the region;
o Negotiating with affected rural land holders and government appropriate compensation for gas exploration and activity; and
• Support current planning and negotiate appropriate infrastructure charges to provide necessary infrastructure to support the project.

Economic Impact Assessment: Surat Gas Project Final Report
70
In addition to the above impacts and proposed mitigation strategies, there is potential for escalation of adverse economic impacts where a number of major industrial and infrastructure projects are developed concurrently in the region (including the Surat Gas Project). This is examined in more detail in chapter 7. To assist in mitigating cumulative impacts it is recommended that Arrow coordinate construction works and infrastructure usage with other proponents where possible to minimise cumulative effects of overlapping timeframes.
Proposed mitigation strategies are discussed in more detail below.
6.2 Mitigation Strategies
6.2.1 Mitigation Strategy 1: Address Skills Shortages
The Darling Downs and Queensland is currently experiencing skills shortages in the construction and CSG industries which could be exacerbated by the Surat Gas Project. Skills shortages have identified as a key issue by all levels of government, and a number of strategies and programs are currently being implemented to address these issues, guided by the Queensland Government’s Surat Basin Future Directions Statement.
Energy Skills Queensland (ESQ) has undertaken considerable research into the workforce demands of the CSG industry and developed a range of strategies designed to assist in attracting and developing the required skills of the industry (ESQ, 2009b).
The following list of programs has been identified that are available to assist in developing the required skills for the Surat Gas Project:
• Construction Skills Queensland Industry Support Program: This program, run by Construction Skills Queensland (CSQ), is designed to increase retention rates of apprentices and trainees by providing a different approach to servicing the needs of regions’ building and construction industry employers, apprentices and trainees through an industry driven mentoring and support model;
• Energy Skills Solutions: This program is a free information service provided by Energy Skills Queensland on behalf of Skilling Solutions Queensland and the Queensland Government. The program provides:
o Career advice on skills and training opportunities for career advancement in the Queensland energy industry;
o Skills evaluation to identify and match skills to qualifications;
o Referral advice to registered training organisations for skills assessment and recognition;
o Gap training advice on services provided by registered training organisations; and
o Advice on regulatory requirements including licensing and permits;
• CSG/ LNG Industry Training Program: This program is a flagship partnership between the Queensland Government (run through Energy Skills Queensland) and the CSG/ LNG industry to train the thousands of workers needed for the new CSG and LNG industries. $10 million will be invested in the CSG/ LNG Industry Training Program to cater for up to 18,000 direct and indirect jobs, with the Queensland Government investment an initial $5 million to fund the program over two years, and matched funding by companies within the CSG/ LNG industry when they access training through the program;
• Skills Queensland Strategic Investment Fund: the Strategic Investment Fund provides up to $50 million of funding per year, including grants of up to $2 million for industry groups and companies, to provide industry and enterprises with the capacity to directly influence where public funding for skills and workforce development is invested; and
• Australian Government Skills and Training Programs: The Australian Government offer a range of funding and incentives for employers and employees to engage in skills training and development, including:
o Australian Apprenticeships Program;

Economic Impact Assessment: Surat Gas Project Final Report
71
o Training Pathways Program;
o Productivity Places Program (The Queensland Government has recently expanded its partnership with Energy Skills Queensland to manage the delivery of an additional $8.1 million worth of training to job seekers and existing workers within the energy and telecommunications industries under the PPP); and
o Workforce Innovation Program.
Mitigation Strategy 1: Address Skills Shortages
Issue
The Surat Gas Project will contribute to a deepening of existing skills shortages in the construction and CSG industries.
Objective
Develop the local/ regional skills base to support the CSG industry and assist existing local business retain skills and back-fill vacated positions.
Recommended Mitigation / Enhancement Strategies
To assist in addressing skills shortages in the construction and CSG industries as a result of the Surat Gas Project, it is recommended that Arrow: • Encourage contractors engaged by the project to utilise Australian and Queensland Government skills and
training programs where possible, including the Australian Apprenticeship Program. This should include providing information and developing awareness of government incentives and programs to all contractors engaged, and direct contractors to relevant agencies.
• Engage and collaborate with CSQ to identify potential strategies for increasing the capacity of local job seekers to develop appropriate skills for construction.
• Collaborate with other CSG proponents and ESQ to identify opportunities for securing funding through the Skills Queensland Strategic Investment Fund.
• Continue to support programs such as the CSG/ LNG Industry Training Program to develop CSG industry skills in the local workforce.
In terms of addressing issues of skill retention and back-filling vacancies as a result of labour being drawn to the Surat Gas Project from other sectors, collaborative planning between State Government, local Council, local industry, industry organisations, and CSG proponents is required. To this end, it is recommended that ESQ, the Queensland Government Department of Employment, Economic Development and Innovation (DEEDI), the Queensland Government Department of Education and Training (DETA), local government and other industry development organisations collaborate to identify and develop programs and strategies aimed at: • Encouraging locals to re-enter the labour force, including older workers and partners of CSG employees. • Up-skilling unemployed, disadvantaged and under-utilised labour in industries most at risk from labour draw
(i.e., lower income paying services that support business and household activities such as retail trade, government administration, education and some health and community services).
• Providing flexible working arrangements and job-sharing in key industries susceptible to a draw down in labour.
Responsibility
Arrow to collaborate with relevant agencies and registered training organisations in terms of the timing and nature of demand for workers and skills programs required to facilitate this.
6.2.2 Mitigation Strategy 2: Support Local Business Secure Supply Contracts
The CSG/ gas extraction industry is an emerging industry in the Darling Downs. Local business has been developing to supply the industry, however, local supply chains may not have reached maturity to maximise local benefits in terms of supplying the industry. Numerous suppliers have, however, capitalised on opportunities to date.

Economic Impact Assessment: Surat Gas Project Final Report
72
Mitigation Strategy 2: Support Local Business Secure Supply Contracts
Issue
The CSG/ gas extraction industry is an emerging industry in the Darling Downs and local business may not be able to maximise local benefits in terms of supplying the industry.
Objective
Provide opportunities for local business to secure supply contracts for the Surat Gas Project.
Recommended Mitigation / Enhancement Strategies
• Collaborate with Council, economic development organisations, Industry Capability Network (ICN) and State Government to: o Inform local business of the goods and services required of the project, service provision opportunities and
requirements of business to secure contracts; o Develop and implement a Local Content Strategy, including the development of relevant networks to assist
qualified local and regional businesses tender for provision of goods and services to support the Surat Gas Project. The benefits of such a network could be enhanced where all CSG proponents in the Surat Basin participate, linking the CSG industry to local service providers through a common pathway such as a web portal operated by relevant economic or industry organisations; and
o Examine options for establishing a local cooperative service or network/ alliances to connect local business and enable collaboration in meeting service supply requirements of the CSG industry. This should be led by local Councils, chambers of commerce (and other economic development organisations) and the ICN, with input from Arrow and other CSG participants to ensure needs of the industry are met.
• Inform local Council, economic development organisations, the ICN and State Government of goods and services required by the Surat Gas Project that are not currently available or under-serviced from within the Darling Downs. This information should be utilised by relevant agencies and Council to promote the Darling Downs and attract investment in order to build the local supply chain.
Responsibility
Arrow to collaborate with the ICN, DEEDI, local Council, local chambers of commerce, other economic development organisations and local business.
6.2.3 Mitigation Strategy 3: Minimise Impacts on Agricultural Production
The Surat Gas Project may impact upon approximately 1.5% to 3.0% of total land area within the Surat Gas Project’s well footprint, with the potential for diminished productive capacity of agricultural land areas impacted during the project’s life. Arrow have committed to a policy intent to avoid highly productive agricultural land wherever practical and possible.
Mitigation Strategy 3: Minimise Impact on Agricultural Production
Issue
The Surat Gas Project has potential to impact on agricultural production in the project development area.
Objective
Minimise impacts on agricultural production.
Recommended Mitigation / Enhancement Strategies
It is recommended that the following mitigation strategies are undertaken by Arrow to minimise the impact of the Surat Gas Project on agricultural production: • Where proponent owned land is available and suitable (particularly in buffer zones around production facilities),
consider leasing to farmers to continue agricultural production of that land. • Arrow to engage with affected landholders to identify potential disruptions to existing management practices for
each property likely to be impacted, including potential changes to land configuration and likely costs; • Arrow to work with landholders to configure well development plans to minimise impacts on prime agricultural
land to the extent practical, including placement of gas wells and infrastructure in areas that avoid high quality agricultural land to the extent practical and possible.
• Negotiate and provide appropriate compensation for landholders where impacts cannot be avoided. This will also provide funds to allow farmers to re-adjust their farm models to increase productivity, to some extent offsetting the decline associated with the Surat Gas Project.
• Ensure all disturbed land is rehabilitated as appropriate when gas facilities are decommissioned.
Responsibility
Arrow in consultation with landholders and Queensland Government departments such as DEEDI, Queensland Government Department of Environment and Resource Management (DERM) and Queensland Department of Primary Industries and Fisheries (DPIF).
In addition to the mitigation strategies outlined above, Sustainability Loans are available under the Queensland Government’s Primary Industries Productivity Enhancement Scheme. These provide loans for farmers experiencing structural adjustment pressures (QRAA, 2011). These loans allow rural producers to borrow a maximum of $650,000 at

Economic Impact Assessment: Surat Gas Project Final Report
73
concessional interest rates to adjust their farming operations to increase productivity and viability, and it is likely that farmers impacted by the Surat Gas Project will be eligible to apply.
6.2.4 Mitigation Strategy 4: Minimise Impacts on Local Property Markets
The Surat Gas Project has potential to, either directly or indirectly, increase demand for residential and industrial/ commercial property and thereby inflate prices. There is also some potential for the project to impact on rural property values as a result of disturbance of agricultural lands and any reduction in productive capacity.
Mitigation Strategy 4: Minimise Impacts on the Local Property Market
Issue
The Surat Gas Project has the potential to impact on demand and prices/ values of residential, industrial/ commercial and rural properties.
Objective
Minimise impacts on local property markets (residential, industrial/ commercial and rural).
Recommended Mitigation / Enhancement Strategies Residential Housing: • Ensure construction worker camps are developed prior to commencement of construction activity on the gas
fields. • Construction workers required for the development of worker camps to be accommodated on site in temporary
accommodation facilities where possible. • Ongoing dialogue with construction industry bodies, State Government and local Council regarding timing and
scale of anticipated worker accommodation requirements. • Monitor the availability of residential property and median house prices to accommodate operational workers
migrating to the region. • State Government and local Councils monitor the need for the implementation of affordable housing schemes in
affected regions to assist in providing affordable accommodation for low income and displaced households. Industrial/Commercial Property: • Inform relevant Council and State Government departments of goods and services needs of the Surat Gas
Project to allow appropriate planning and release of required industrial and commercial land. • State Government and local Councils should assess the suitability of current planning arrangements to handle a
likely increase in demand for industrial and commercial developments, and position themselves to reduce response times to planning applications, particularly as the number of planning applications is likely to increase.
Rural Property: Mitigation strategies relevant to minimising any adverse impacts on rural property values are outlined in section 6.2.3.
Responsibility
Arrow to collaborate with local Councils, Queensland Government Department of Local Government and Planning (DLGP), DEEDI and rural land holders.
6.2.5 Mitigation Strategy 5: Support Infrastructure Development in the Region
It is anticipated that the development of major projects in the Surat Basin will require upgrades to road, air, telecommunications, energy infrastructure, water and waste water infrastructure. Infrastructure projects such as the Surat Basin Rail project will help alleviate pressure on existing rail infrastructure.
The Queensland Government launched the Sustainable Resource Communities policy in August 2008, which invests $100 million over three years for social and economic infrastructure (Queensland Government, 2008). In March 2010 the Surat Basin received $27.95 million, which funded various projects including upgrading the Roma Airport, road safety improvements and affordable housing for key service workers.

Economic Impact Assessment: Surat Gas Project Final Report
74
Mitigation Strategy 5: Support Infrastructure Development in the Region
Issue
The Surat Gas Project will require upgrades and maintenance to a range of economic infrastructure types. In addition there may be a need for additional social infrastructure to support the needs of direct and indirect migration to the region due to the Surat Gas Project.
Objective
Minimise the project’s impact on existing socio-economic and community infrastructure.
Recommended Mitigation / Enhancement Strategies
• Arrow to inform local councils of anticipated increases in demands on roads and other transport infrastructure due to the project, and identify appropriate contributions for upgrades and maintenance (impacts on road infrastructure and proposed mitigation strategies is examined in the Transport Impact Assessment undertaken as part of this EIS).
• Arrow to identify and communicate anticipated population growth and associated infrastructure requirements and impacts as early as possible to relevant government authorities (impacts on population and associated infrastructure is examined in the Social Impact Assessment undertaken as part of this EIS).
• Relevant government authorities to investigate and develop anticipated cost estimates to provide social and economic infrastructure required to meet demand generated by the Surat Gas Project, and identify appropriate cost recovery strategies for developing this infrastructure. In order for Council to appropriately fund the development of required social and economic infrastructure, sources for initial funding will likely need to be negotiated between local Council and State Government, and potentially project proponents.
Responsibility
Arrow, local Councils and relevant government authorities.
6.2.6 Mitigation Strategy 6: Minimise Arrow’s Contribution to Cumulative Effects of Overlapping Timeframes
The Surat Gas Project is one of a number of resource sector development projects in the region that have overlapping timeframes. The cumulative impact of these projects being undertaken simultaneously could worsen the issues identified above, as they compete for the same resources and are likely to exacerbate the need for infrastructure upgrades and maintenance.
Mitigating the cumulative impacts of multiple projects being developed requires significant coordination of activities across project proponents, local, state and national governments, relevant economic and industry organisations, local business, imported workers and local residents. Relevant government authorities will be required to take a lead role in the coordination process.
Mitigation Strategy 6: Minimise Arrow’s Contribution to Cumulative Effects of Overlapping Timeframes
Issue Cumulative impacts of concurrent development of a number of major industrial and infrastructure projects could exacerbate the above issues.
Objective
Minimise the impact of multiple projects competing for resources.
Recommended Mitigation / Enhancement Strategies
• Arrow to collaborate with Queensland Government and other proponents of major projects being developed in the region to identify key project timings and potential peak overlap periods to allow adequate and appropriate planning for and mitigation of cumulative project impacts and minimise overlap between peak activity.
Responsibility
Arrow to collaborate with Queensland Government and other proponents.
The Coordinator-General should take a lead role in any coordination process to minimise adverse impacts of concurrent project development, including development of regional plans for accommodation and support services. Project sequencing will require cooperation between proponents as well as relevant government authorities to coordinate activities and source from the same labour pool rather than creating intense competition for labour. However, it is acknowledged that commercial pressures may not always allow this to occur.

Economic Impact Assessment: Surat Gas Project Final Report
75
6.3 Residual Impact Assessment
An assessment of residual adverse impacts of the Surat Gas Project assuming the proposed mitigation strategies above are adopted has been undertaken in Table 6.1 using the risk assessment framework outlined in Appendix E. The assessment shows that the impact rating for “impacts on business”, “impacts on industrial/ commercial land prices”, “impacts on rural property values” and “impacts on local infrastructure and service capacity” are able to be downgraded as a result of the proposed mitigation measures.
The risk assessment framework utilised can be coarse, and as such, whilst the mitigation measures may have reduced deleterious impacts the impact assessment rating (as prescribed in Appendix E) may not capture this through a lower rating (e.g., “impacts on agricultural production” and “impacts on housing prices and availability of affordable housing”).
Table 6.1. Assessment of Adverse Impacts of the Surat Gas Project Following Mitigation
Impact Original Impact Rating
Relevant Mitigation Measures
Residual Likelihood
Residual Consequence
Residual Impact Rating
Impacts on Business
High
• Address skills shortages
• Support local business secure supply contracts
Almost Certain Minor Medium
Impacts on Agricultural Production
Medium • Minimise impacts
on agricultural production
Likely Minor Medium
Impact on Housing Prices and Availability of Affordable Housing
Low
• Minimise impacts on local property markets Possible Minor Low
Impacts on Industrial/ Commercial Land Prices
Medium
• Minimise impacts on local property markets Possible Minor Low
Impacts on Rural Property Values
Low
• Minimise impacts on agricultural production
• Minimise impacts on local property markets
Unlikely Insignificant Negligible
Impacts on Local Infrastructure and Service Capacity
Medium • Support
infrastructure development
Possible Minor Low
Source: AECgroup.

Economic Impact Assessment: Surat Gas Project Final Report
76
PAGE LEFT INTENTIONALLY BLANK
Economic Impact Assessment: Surat Gas Project Final Report
77
7. Cumulative Impact Assessment This chapter provides an assessment of the cumulative economic impacts arising from development of the large number of major projects either currently being developed or proposed for the Darling Downs outlined in section 2.3.4. In particular, this chapter is designed to address the cumulative economic impacts arising from large project workforces associated with proposed major projects being constructed in overlapping timeframes.
7.1 Cumulative Impact Assessment Framework
The cumulative impact assessment examines the potential cumulative impacts of a large number of major infrastructure and industry projects (including the Surat Gas Project) being developed concurrently in the Darling Downs using a risk assessment framework described in Appendix E.
Projects included for consideration in the cumulative impact assessment include:
• Surat Gas Project; • Arrow Surat Pipeline Project; • Australia Pacific LNG Project; • Cameby Downs Expansion Project; • Carbon Energy Blue Gum Energy Park Project; • CS Energy – Kogan Creek Solar Boost Project; • Elimatta Coal Project; • Emu Swamp Dam Project; • Felton Coal Mine and Coal to Liquid Project; • Hunter Gas Pipeline Project; • Linc Energy Underground Coal Gasification Project; • Nathan Dam and Nathan Pipeline; • New Acland Coal Mine Stage 3 Expansion Project; • Spring Gully Power Station; • Surat Basin Rail; and • Wandoan Coal Project.
Summary details of these projects are provided in section 2.3.4. In addition to the projects outlined above, the Gladstone LNG Project and Queensland Curtis LNG Project have been included as part of the baseline scenario. Other LNG projects that have also been proposed in Gladstone which are anticipated to source gas from either the Surat Basin or the Bowen Basin (e.g., the Arrow LNG Plant – which Arrow intends to utilise gas extracted from the Surat Gas Project as feedstock) have also been considered in the cumulative impact assessment.
The cumulative impact assessment focuses on the potential for impacts identified in chapter 5 to be exacerbated by the concurrent development of a range of projects in the region. In undertaking the analysis, it has been assumed that all projects identified above proceed in accordance with timelines outlined in section 2.3.4 (based on existing information in the public domain). This is considered a cautious scenario (i.e. an extreme scenario that is unlikely to be realised) as it is highly unlikely that all projects proposed will proceed to development, or that all proposed timelines will be achieved. As such, it is highly likely that impact ratings assessed in this cumulative impact assessment are overstated.
7.2 Potential Cumulative Impacts
The development of the Surat Gas Project in combination with multiple other major projects will result in higher output, GRP, employment and household income estimates in the Darling Downs and Queensland than those depicted in chapter 5. Other potential beneficial impacts of concurrent development may include:
• Increased labour compensation and real wage effects in order to attract constrained labour resources, thereby enhancing some household incomes;

Economic Impact Assessment: Surat Gas Project Final Report
78
• Development of a “critical mass” of projects to support development and expansion of local supply chain networks;
• Coordinated and potentially enhanced use of infrastructure developed to support major projects; and
• Enhanced business, consumer and investor confidence arising from greater certainty in demand for goods, services and local infrastructure and assets.
While there are some real and tangible cumulative benefits likely to arise from the concurrent development of a number of projects, with respect to government as well as local community and business investment in the local and regional economy it is more important to understand the stresses that will be collectively created by multiple projects. As such, the focus of the cumulative impact assessment is on understanding these stresses.
Key resources (factors of production) likely to be affected by development of multiple projects in terms of increased demand and competition include:
• Labour; • Capital; • Accommodation; and • Transport and other infrastructure/ services. • Gas resources.
An assessment of cumulative impact on gas resources has also been undertaken by ACIL Tasman (2011).
7.3 Assessment of Potential Adverse Cumulative Impacts
Adverse impacts potentially resulting from concurrent development of major projects have been identified through the preceding analysis, desktop review of other projects proposed for the region and the impacts identified in relevant documentation, as well as consultation with business, industry and key industry organisations. The key potential adverse impacts expected to result are assessed in the sections below and include:
• Impacts on business;
• Impacts on agricultural production from land disruption and competition for land;
• Impacts on housing prices and availability of affordable housing;
• Impacts on industrial/ commercial land prices;
• Impacts on rural property values from land disruption;
• Impacts on local infrastructure and service capacity; and
• Impacts on gas prices and security of supply.
7.3.1 Impacts on Business
Potential impacts of the Surat Gas Project on business as a result of increased competition for and cost of labour are presented in sections 5.1.2, 5.2.1 and 5.6.1. The analysis outlines that competition for resources will result in a “crowding out” effect as resources (in particular labour) are drawn from some sectors of the local, State and national economy to the Surat Gas Project and its support services. The concurrent development of the Surat Gas Project and the projects listed in section 7.1 is almost certain (expected to occur in most circumstances) to exacerbate these impacts as a result of additional demand and competition for labour and other business inputs such as capital, goods and services used in production processes, transport infrastructure and utilities.
For example, competition for labour will exacerbate issues of attracting and retaining labour for all businesses in the Darling Downs, in particular businesses in industries that are typically lower income paying as labour is attracted to industries that offer higher employee compensation. This will place increased upward pressure on wage rates throughout the region; while this will benefit households in terms of enhancing household

Economic Impact Assessment: Surat Gas Project Final Report
79
incomes, the overall result for business will be increased costs of production (e.g., wages, lease costs, additional transportation costs).
Higher costs of production will erode the viability of some businesses, particularly smaller businesses already operating on or near the margin and those businesses that are unable to increase final prices of their goods and services to match the increased costs of production (i.e., any good or service that can be readily substituted with a lower cost import). This will exacerbate issues of “crowding out” of some businesses and industries, and will likely reduce availability of lower income paying services that support business and household activities such as retail trade, government administration, education (in particular primary and secondary) and some health and community services.
The increased competition for resources will also hinder the region’s capacity to develop local supply chains and secure local supply contracts for these major projects in the short term. As a result, in the short to medium term, the Darling Downs will become more reliant on imported goods and services to supply the needs of these projects as well as the local population – this will mean a reduction in the local capture of flow-on benefits arising from proposed major projects.
Where the projects considered in this cumulative impact assessment all proceed, the adverse impacts on business will be greater than the impacts outlined in chapter 5. As such, the cumulative impact of competition from resources without appropriate planning is assessed to be of major (substantial and significant changes, uncertain if it can be successfully rehabilitated) consequence.
The cumulative impact associated with a combination of an ‘almost certain’ likelihood and a ‘major’ consequence assessed as a ‘very high’ impact.
7.3.2 Impacts on Agricultural Production from Land Disruption and Competition for Land
The Surat Gas Project may impact on up to approximately 1.5% to 3.0% of total land area within the Surat Gas Project’s well footprint (Gilbert and Sutherland, 2011), with the potential for diminished productive capacity in these areas during the project’s life. As noted in section 5.6.1, Arrow has committed to working with landholders to minimise the disturbance of good quality agricultural land (GQAL) or strategic cropping land and has developed policies and procedures highlighting an intent to place gas wells and infrastructure in areas that avoid high quality agricultural land to the extent practical and possible. As such, the impact on high quality agricultural land could realistically be much less than 1.5% to 3.0%. Furthermore, any disturbance of agricultural land will be temporary and it is expected that all land impacted by gas wells and associated pipeline and other infrastructure will be rehabilitated to a pre-development standard following gas well closure.
Many of the other developments considered in the cumulative impact assessment are also likely to impact on agricultural production through disruption or take-up of land, in particular resource projects such as mines and other gas projects. While some projects would only temporarily impact on agricultural production (e.g., land impacted by gas projects could realistically be rehabilitated to pre-development standard, while many infrastructure projects primarily impact on land during the construction period), some projects would likely result in a permanent degradation of agricultural land in the region (e.g., mines, dams). As such, the development of other gas fields, coal projects and infrastructure projects in the Darling Downs would almost certainly (expected to occur in most circumstances) exacerbate adverse impacts on agricultural production in the region.
Unless substantive measures are developed to support the agriculture industry and minimise the adverse impacts of the energy resources sector, the cumulative impacts of multiple gas, coal and infrastructure projects on agricultural production, though likely to be small in absolute value terms, is assessed as moderate (significant changes, may be rehabilitated with difficulty).
The cumulative impact associated with a combination of an ‘almost certain’ likelihood and a ‘moderate’ consequence assessed as a ‘high’ impact.

Economic Impact Assessment: Surat Gas Project Final Report
80
7.3.3 Impacts on Housing Prices and Availability of Affordable Housing
Development of multiple projects concurrently will result in higher imported (FIFO/ DIDO) labour requirements for each project than would be required if each project were undertaken in isolation. This will increase accommodation requirements to house these imported workers, although many of the proponents of major projects proposed for the region have indicated they will utilise worker camps at least during construction of the projects to accommodate FIFO/ DIDO workforces.
The potential for these FIFO/ DIDO workers to impact on the local residential property market will depend to some degree on bed availability in the worker camps in comparison to the number of beds required at any point in time. Many proponents have plans to develop worker accommodation to meet their currently anticipated peak FIFO/ DIDO labour demands. Where the anticipated peak workforce is realised there should be not material effect on the local housing market from these workers.
However, as indicated in documentation for these projects, the anticipated peak FIFO/ DIDO labour requirements outlined (to which worker accommodation is to be designed) are likely to be exceeded where multiple projects are developed concurrently, as the capacity to source workers locally diminishes. Any overflow of workers (above currently anticipated peaks) is therefore likely to increase demand for accommodation in the local community, unless proponents are able to readily expand the capacity of the worker camps.
Additionally, the local property market will be impacted in the short term by a combination of:
• Some workers choosing to permanently migrate to the region, thereby increasing loads on existing housing supply; and
• Non-project workers being attracted to the region to back-fill positions vacated as a result of labour draw to the projects, or to support businesses involved in supplying major projects.
The combination of multiple projects being developed will therefore increase both transient and resident population loads, which will likely (will probably occur) increase demand for residential property and place upward pressure on prices.
As outlined in section 5.3.2.1, the direct impact of the Surat Gas Project from construction and operational workers on local residential property prices is anticipated to be small in consideration of worker camps to accommodate FIFO construction workers, the relatively small number of operational workers migrating to the region, long lead times and the dispersed nature of the project. An influx of workers to construct and operate the major projects outlined in section 7.1, some of which will draw labour to the region prior to the Surat Gas Project, will likely take up much of the additional residential capacity planned for the region over the next few years (and could potentially exceed additional supply of housing). This will support current high growth in housing prices, and require additional residential development to meet additional demand generated by the Surat Gas Project.
The take up of accommodation by other major projects will erode the benefit of long lead times for the Surat Gas Project as residential development in the interim will primarily cater to increased population loads from other projects. Complicating this issue, the demand for construction labour by major projects would compete with demand for residential construction workers, constraining the industry’s capacity to deliver additional supply to market, particularly in the short to medium term.
The increase in housing prices would reduce the affordability of housing, in particular for lower income earning households, and may result in some households being forced to leave the region. Disposable incomes of households that remain in the region would be expected to also decline, as a greater share of income is required for accommodation. The outward migration of some residents from the region and high housing costs would also exacerbate difficulties of local business in retaining and attracting workers.
Counter-acting the adverse implications on housing affordability from increased activity in the region to some degree, the development of a number of projects concurrently has the potential to provide some benefits in terms of coordination of housing and accommodation planning. However, even with appropriate accommodation planning

Economic Impact Assessment: Surat Gas Project Final Report
81
issues of housing affordability are likely to be of moderate (significant changes, may be rehabilitated with difficulty) consequence in the short to medium term in the Darling Downs if a significant number of major projects are developed at the same time, in particular in the townships near major developments.
The cumulative impact associated with a combination of a ‘likely’ likelihood and a ‘moderate’ consequence assessed as a ‘medium’ impact.
7.3.4 Impacts on Industrial/ Commercial Land Prices
As outlined in section 5.3.1, the Surat Gas Project will not directly impact on industrial and commercial land values. For the most part it is unlikely that the other major projects outlined in section 7.1 will directly impact on industrial and commercial land values either, with the majority of these projects either resource projects or infrastructure projects.
Each of these projects will, however, provide additional demand for goods and services in the Darling Downs, which has the potential to generate demand for industrial and commercial lands from support industries. Availability of appropriately zoned and developable industrial and commercial lands has been identified as a key issue in the region (refer to Appendix A and section 4.3.3), with consultation noting that limited availability is currently constraining development of industry support networks and supply chains and has resulted in a doubling in industrial land prices in some areas in the past two years.
In addition to increased demand for local goods and services generated by each project individually (and likely impacts on industrial and commercial land demand), the cumulative demand for goods and services generated by multiple major projects being developed concurrently has the potential to create a “critical mass” of demand for some goods and services that are not currently or adequately provided in the Darling Downs. This could result in additional investment by, and relocation of, support industries to the region.
Consultation with real estate agents and economic development organisations indicates that current land planning has not appropriately considered the likely increase in demand for industrial and commercial land generated by flow-on impacts of major projects. Combined with existing issues in terms of lead times to release of land and approval for industrial and commercial developments, cumulative flow-on demand from supply chain and support service development will likely (will probably occur) place significant upward pressure on industrial and commercial lands in the short to medium term.
Counter-acting this increase in demand to some degree is likely issues in sourcing labour to fill positions in the local industrial and commercial labour markets, in particular those sectors without direct links to the resource sector supply chain (refer to section 7.3.1). However, even in consideration of labour supply issues, the cumulative impact on industrial and commercial land prices is assessed as moderate (significant changes, may be rehabilitated with difficulty).
The cumulative impact associated with a combination of a ‘likely’ likelihood and a ‘moderate’ consequence assessed as a ‘medium’ impact.
7.3.5 Impacts on Rural Property Values from Land Disruption
Rural property values may be impacted through disruption of agricultural lands by gas and coal resource developments and infrastructure projects in the region, dissecting properties and leading to access and property management issues. There are also concerns regarding the impacts of gas and other developments on the long term quality of agricultural lands in the region, and whether this will reduce the productive capacity of agricultural lands.
As indicated in 7.3.2, many of the major projects listed in section 7.1 have the potential to impact agricultural land through disruption of activities or consumption of land in the Darling Downs. This has the potential to increase the adverse impacts on rural property values in the Darling Downs, even with compensation to landholders, due to issues such as disconnectivity and the potential for ‘land locking’ of some land parcels (i.e., isolating or stranding some areas of land and thereby decreasing their commercial attractiveness and utilisation).

Economic Impact Assessment: Surat Gas Project Final Report
82
As outlined in section 5.3.3, agricultural land values have softened in recent years in response to a number of factors, most notably rural downturn and drought. Consultation with real estate agents suggests uncertainty regarding compensation and the level of impacts of resource development projects on management practices may also be contributing.
Based on the above assessment it is considered possible (could occur) the cumulative impact of multiple major projects will decrease the value of rural properties. In consideration of compensation from proponents, this impact is assessed as being minor (limited consequence, no significant long-term changes, may be easily rehabilitated).
The cumulative impact associated with a combination of an ‘possible’ likelihood and a ‘minor’ consequence assessed as a ‘low’ impact.
7.3.6 Impacts on Local Infrastructure and Service Capacity
Findings from the literature review (refer to Appendix A) and consultation identified that some infrastructure in the region is already experiencing capacity constraints – in particular road, rail, air and telecommunications infrastructure – and the development of the Surat Gas Project will require infrastructure upgrades and maintenance. The cumulative impacts of developing the Surat Gas Project and other proposed major projects will almost certainly (expected to occur in most circumstances) exacerbate the need for infrastructure upgrades and maintenance in the Darling Downs to support project activity as well as additional population loads in the region.
It should be noted, however, that one of the major projects included in the cumulative assessment is the Surat Basin Rail project, which will in fact alleviate existing issues on rail infrastructure and open the Surat Basin to export terminals in Gladstone.
Even so, recent planning documents – for example the Draft Surat Basin Economic Development Strategy (AECgroup, 2011) – identify that development of proposed major projects in the region will require significant upgrades to road, air, telecommunications, energy infrastructure, water and waste water infrastructure to support project activity and increased population.
The consequence of cumulative impacts on infrastructure and service capacity is assessed as moderate (significant changes, may be rehabilitated with difficulty) in consideration of existing planning in the region identifying the need for infrastructure upgrades.
The cumulative impact associated with a combination of an ‘almost certain’ likelihood and a ‘moderate’ consequence assessed as a ‘high’ impact.
7.4 Summary of Cumulative Impacts
The cumulative impacts outlined in the sections above are summarised in Table 7.1.
Table 7.1. Assessment of Adverse Cumulative Impacts
Impact Description Likelihood Consequence Impact Rating
Impacts on Business: Concurrent development of a number of major projects in the Darling Downs will almost certainly result in considerable additional demand and competition for labour and other inputs to supply these projects. Competition for labour will place upward pressure on input prices, and can result in “crowding out” of some businesses and industries.
Almost Certain Major Very High
Impacts on Agricultural Production: Many of the developments considered in the cumulative impact assessment are likely to either temporarily or permanently impact on agricultural production through disruption or take-up of land. Of most significance will be projects that result in the permanent degradation or removal of productive agricultural land (e.g., mining, dam). The development of all of these projects will almost certainly exacerbate adverse impacts on agricultural production in the region. The cumulative impact on agricultural production, though likely to be small in absolute value terms, is assessed as moderate.
Almost Certain Moderate High

Economic Impact Assessment: Surat Gas Project Final Report
83
Impact Description Likelihood Consequence Impact Rating
Impact on Housing Prices and Availability of Affordable Housing: The overlapping development of a number of major industrial projects is likely to increase the peak demand for housing in the region, even in consideration of construction camps to be used, placing upward pressure on prices. Even with appropriate accommodation planning, issues of housing affordability are likely to be of moderate consequence in the short to medium term in the Darling Downs if a significant number of major projects are developed at the same time, in particular in the townships near major developments.
Likely Moderate Medium
Impacts on Industrial/ Commercial Land Prices: Development of a number of major industrial and resource projects in the Darling Downs will likely increase demand for industrial/ commercial property (placing upward pressure on prices) as a result of supply chain development. Availability of appropriately zoned and developable industrial and commercial lands is an existing issue in the region, and the likely increase in demand is assessed as having a moderate impact on prices.
Likely Moderate Medium
Impacts on Rural Property Values: It is possible that rural property values could be impacted by disruption of agricultural lands as a result of gas and coal resource developments and infrastructure projects in the region. Agricultural land values have softened in recent years in response to a number of factors, most notably rural downturn and drought. Consultation with real estate agents suggests uncertainty regarding compensation and the level of impacts of resource development projects on management practices may also be contributing. The concurrent development of a number of resource, industrial and infrastructure projects has the potential to result in a minor impact on rural property values as a result of disruption of agricultural production.
Possible Minor Low
Impacts on Local Infrastructure and Service Capacity: Some infrastructure in the Darling Downs is currently experiencing capacity constraints – in particular road, rail, air and telecommunications infrastructure, and this has been identified in regional planning as a key issue to be addressed. The concurrent development of multiple resource and industrial projects will almost certainly result in demand exceeding capacity for some infrastructure. The consequence of cumulative impacts on infrastructure and service capacity is assessed as moderate in consideration of existing planning in the region identifying the need for infrastructure upgrades.
Almost Certain Moderate High
Source: AECgroup.

Economic Impact Assessment: Surat Gas Project Final Report
84
PAGE LEFT INTENTIONALLY BLANK

Economic Impact Assessment: Surat Gas Project Final Report
85
8. Conclusion The economic impact assessment identifies that the Surat Gas Project will generate significant economic benefits for the regional (Darling Downs), state and national economies. Potential beneficial impacts arising from the Surat Gas Project include:
• Significant increases in industry output, GRP, employment and incomes in the Darling Downs and Queensland over the project life through both direct and indirect impacts;
• Opportunities for local business to secure new contracts and increase sales to supply and service the needs of both the project and the workforce;
• Increased population (through attraction of labour to the Darling Downs) and business activity will provide additional demand for local household and business services and likely increase service levels over time;
• A permanent lift in the local skills base through implementation of skills development and training strategies as part of the Surat Gas Project;
• Households will be beneficially effected by the project, through increased job and income earning opportunities;
• The Surat Gas Project will provide a lift in local, Queensland and Australian Government taxation revenues through a variety of taxes and duties; and
• Support for the Australian dollar through production of high value gas for export as LNG, resulting in lower comparative prices for foreign goods and services.
While overwhelmingly beneficial, the Surat Gas Project will also likely result in adverse impacts within some cohorts of the regional, state and national economies, including:
• A potential draw down on business as a result of:
o Competition for and draw of labour to the Surat Gas Project and its supply chain;
o Deepening skills shortages in both the construction and energy sectors;
o Escalating costs of labour and other inputs to production, reducing business profits and viability; and
o Support for the Australian dollar as a result of the high level of gas exports, potentially making “trade exposed” industries such as agriculture, some manufacturing and tourism more expensive to foreign buyers;
• Potential for diminished agricultural productive capacity and associated rural property values as a result of land disruption;
• Likely upward pressure on industrial/ commercial land prices as a result of flow-on supply chain and support service demand;
• Possible increases in demand and prices for housing resulting from increased temporary and permanent population in the region;
• Additional demand on already constrained local infrastructure and service capacity from additional economic activity and population loads; and
• Higher domestic gas prices.
Cost Benefit Analysis of the Surat Gas Project identifies the project provides a highly positive Net Present Value. The benefits generated by the project significantly outweigh the costs and is economically desirable for Queensland.
Cumulative impacts resulting from the concurrent development of a number of major resource, industrial and infrastructure projects currently proposed for the region are estimated to exacerbate identified adverse impacts as they compete for the same resources. Mitigating the cumulative impacts of multiple projects being developed requires coordination of activities across project proponents, local, state and national governments, relevant economic and industry organisations, local business and the local community.

Economic Impact Assessment: Surat Gas Project Final Report
86
PAGE LEFT INTENTIONALLY BLANK

Economic Impact Assessment: Surat Gas Project Final Report
87
References ABARES (2010). Australian Energy Statistics – Australian Energy Update 2010. Australian
Bureau of Agricultural and Resource Economics and Sciences, Canberra.
ABARE (2009). Commodity Outlook and Financial Performance of Key Agricultural Industries in South East Queensland. Conference Paper 09.5, Australian Bureau of Agricultural and Resource Economics, Canberra.
ABS (2011a). Regional Population Growth, Australia, 2009-10. Cat. No. 3218.0, Australian Bureau of Statistics, Canberra
ABS (2011b). Average Weekly Earnings, Australia. Cat. No. 6302.0, Australian Bureau of Statistics, Canberra.
ABS (2011c). Building Approvals, Australia. Cat. No. 8731.0, Australian Bureau of Statistics, Canberra.
ABS (2011d). Australian National Accounts: National Income, Expenditure and Product, Mar 2011. Cat. No. 5206.0, Australian Bureau of Statistics, Canberra.
ABS (2010). Australian Standard Geographical Classification (ASGC) Digital Boundaries (Intercensal), Australia, July 2010. Cat. No. 1259.0.30.001, Australian Bureau of Statistics, Canberra.
ABS (2008). Agricultural Commodities: Small Area Data, Australia, 2006-07. Cat. No. 7125.0, Australian Bureau of Statistics, Canberra.
ABS (2007). 2006 Census of Population and Housing. Cat No. 2068.0, Australian Bureau of Statistics, Canberra.
ABS (2003). C-Data 2001, Second Release. Australian Bureau of Statistics, Canberra.
ACIL Tasman (2011). Arrow LNG Plant: Implications for Domestic Gas Markets. An assessment of potential impacts of the Arrow LNG Plant on domestic gas availability and price. Report prepared for Coffey Environments by ACIL Tasman, Brisbane.
AECgroup (2011). Draft Surat Basin Economic Development Strategy. Report prepared for the Queensland Government Department of Employment, Economic Development and Innovation by AECgroup, Brisbane.
AECgroup (2008). Creating Regional Economic Development by Value Adding the Surat Energy Resources Province. Report prepared for the Queensland Department of Tourism, Regional Development and Industry by AECgroup, Brisbane.
APLNG (2010). Australia Pacific LNG Project Environmental Impact Statement. Report prepared for Australia Pacific LNG Pty Ltd (joint venture between Origin Energy and ConocoPhillips), Brisbane.
Arrow Energy (unpublished). Arrow Energy Surat Gas Project – Production and Capital Estimate data. Unpublished data provided by Arrow Energy via email, 9th March 2011.
Campbell, H. and Brown, R. (2003). Benefit-Cost Analysis – Financial and Economic Appraisal Using Spreadsheets. Published by Cambridge University Press, Cambridge.
Cardno Eppell Olsen (2010). Surat Gas Project EIS: Road Impact Assessment. Report prepared for Arrow Energy and Coffey Environments by Cardno Eppell Olsen, Brisbane.
Coffey Environments (2011). Arrow LNG Project (Surat Gas) – Project Description (Assumptions and Options). Report prepared for Arrow Energy by Coffey Environments, Brisbane.
Commonwealth of Australia (2010). Consolidated Financial Statements for the Year Ended 30 June 2010. Available from: http://www.finance.gov.au/publications/commonwealth-consolidated-financial-statements/index.html. Last accessed: 27 July 2011.

Economic Impact Assessment: Surat Gas Project Final Report
88
DEEDI (2011b). Gas in Queensland: Gas Consumption. Queensland Government Department of Employment, Economic Development and Innovation. Available from: http://www.dme.qld.gov.au/Energy/gas_consumption.cfm
DEEDI (2010a). Surat Basin Future Directions Statement. Queensland Department of Employment, Economic Development and Innovation. Available from: http://rti.cabinet.qld.gov.au/documents/2010/feb/surat%20basin%20future%20directions/Attachments/Surat%20Basin%20Future%20Directions%20Statement.pdf. Last accessed: 31 May 2011.
DEEDI (2010b). Coal Seam Gas Reserves January 2005 to June 2010. Queensland Government Department of Employment, Economic Development and Innovation. Available at:
DEEDI (2010c). Queensland’s LNG Industry: A once in a generation opportunity for a generation of employment. Queensland Government Department of Employment, Economic Development and Innovation. Available at:
http://www.dme.qld.gov.au/mines/production_and_reserves_statistics.cfm
http://www.industry.qld.gov.au/documents/LNG/LNGBlueprint-Progress-Report-Part1.pdf
DEEDI (2009). Blueprint for Queensland’s LNG Industry. Queensland Government Department of Employment, Economic Development and Innovation. Available at: http://www.industry.qld.gov.au/key-industries/810.htm
DEEWR (2011). Small Area Labour Markets Australia. Labour Market Research and Analysis Branch, Australian Government Department of Education, Employment and Workplace Relations, Canberra.
DERM (2011a). Current EIS Processes. Queensland Government Department of Environment and Resource Management, retrieved from: http://www.derm.qld.gov.au/environmental_management/impact_assessment/eis-processes/current.html. Last accessed: 29/4/2011.
DERM (2011b). Drought Situation Reports. The Long Paddock, Queensland Government Department of Environment and Resource Management. Available from: http://www.longpaddock.qld.gov.au/queenslanddroughtmonitor/queenslanddroughtreport/index.php. Last accessed: 4/5/2011.
DERM (2011c). Protecting Queensland’s Strategic Cropping Land: Proposed criteria for identifying strategic cropping land. Queensland Government Department of Environment and Resource Management. Available from: http://www.derm.qld.gov.au/land/planning/pdf/strategic-cropping/proposed-criteria.pdf. Last accessed: 27 July 2011.
DERM (2010a). Terms of Reference for the Arrow Energy Surat Gas Project Environmental Impact Statement (EIS). Queensland Government Department of Environment and Resource Management, Brisbane.
DFA (2006). Introduction to Cost Benefit Analysis and Alternative Evaluation Methodologies – January 2006. Australian Government, Department of Finance and Administration, Financial Management Group, Canberra.
DIP (2011). Coordinator-General’s Projects. Queensland Government Department of Infrastructure and Planning, retrieved from: http://www.dip.qld.gov.au/coordinator-general-projects/index.php. Last accessed: 29/4/2011.
DIP (2008a). Queensland’s Future Population, 2008 Edition. Planning Information and Forecasting Unit, Queensland Government Department of Infrastructure and Planning, Brisbane.
DIP (2008b). Coal Infrastructure Program of Actions: Identifying the needs of Queensland coal industry, including rail, ports, rollingstock, water, skills, energy and housing and planning. Queensland Government Department of Infrastructure and Planning, Brisbane.
DIP (2008c). Project Assurance Framework - Cost Benefit Analysis. Queensland Department of Infrastructure and Planning.

Economic Impact Assessment: Surat Gas Project Final Report
89
http://www.dip.qld.gov.au/resources/guideline/project-assurance-framework/paf-cost-benefit-analysis.pdf. Last accessed 12 October, 2009.
DLGP (2011). Social Impact Assessment: Fact Sheet. Queensland Government Department of Local Government and Planning. Available from: http://www.dlgp.qld.gov.au/resources/factsheet/eis/sia-fact-sheet.pdf. Last accessed: 23/6/2011.
DPI and DHLGP (1993). Planning Guidelines: The Identification of Good Quality Agricultural Land. Queensland Government Department of Primary Industries and Department of Housing, Local Government and Planning. Available from http://www.dlgp.qld.gov.au/docs/ipa/plng_guide_identif_ag_land.pdf. Last accessed: 6 June 2011.
DPIF (2011). Counting the Costs to Queensland’s Primary Industries from Recent Disasters. Minister for Primary Industries, Fisheries and Rural and Regional Queensland, The Honourable Tim Mulherin. Accessed from: http://www.mysunshinecoast.com.au/articles/article-display/counting-the-costs-to-queenslands-primary-industries-from-recent-disasters,20505. Last accessed: 4/5/2011.
DTRDI (2008a). Darling Downs and South West Queensland Centres of Enterprise Surat Energy Province Action Plan. Queensland Government Department of Tourism, Regional Development and Industry. Accessed from: http://203.210.126.185/dsdweb/v4/apps/web/secure/docs/3178.pdf. Last accessed: 31 May 2011.
DTRDI (2008b). Darling Downs and South West Queensland Centres of Enterprise Food Industry Action Plan. Queensland Government Department of Tourism, Regional Development and Industry.
EIA (2010). International Energy Outlook 2010 – Natural Gas. United States Energy Information Administration. Available from: http://www.eia.doe.gov/oiaf/ieo/nat_gas.html. Last accessed: 11/5/2011.
ESQ (2010). The Skill Connection Newsletter. April 2010. Available from: http://www.energyskillsqld.com.au/esq-publications/the-skill-connection-newsletter. Last accessed: 31 May 2011.
ESQ (2009a). Part A: Workforce Planning Report to Inform the Workforce and Competency Development Strategy Plan for the Queensland Coal Seam Gas/ Liquefied Natural Gas Industry. Energy Skills Queensland, Brisbane.
ESQ (2009b). Part B: Addendum of Labour Market Analysis – Demand and Supply for the Queensland Coal Seam Gas/ Liquefied Natural Gas Industry. Energy Skills Queensland, Brisbane.
ESQ (2009c). Part C: Workforce & Competency Development Strategy Plan – Prepared for the Queensland Coal Seam Gas/ Liquefied Natural Gas Industry. Energy Skills Queensland, Brisbane.
Gilbert and Sutherland (2011). Draft Arrow Energy Surat Gas Project Agricultural Report Surat Basin. Report prepared for Coffey Environments by Gilbert and Sutherland, Robina.
HEIRG (2011). Darling Downs Projects. Heavy Engineering Industry Reference Group, retrieved from: http://www.heirg.com/projects/by-region-dd.php. Last accessed: 29/4/2011.
McLennan Magasanik Associates (2009), Queensland LNG Industry Viability and Economic Impact Study, McLennan, Magasanik Associates, Brisbane. Retrieved 29 September 2009 from: http://www.dip.qld.gov.au/resources/project/liquefied-natural-gas/final-mma-1-may-09.pdf.
Planager (2011). Preliminary Hazard and Risk Assessment of Arrow Energy’s Surat Gas Project. Report prepared for Coffey Environments by Planager, Berowra Heights, NSW.
QGC (2010). Queensland Curtis LNG Project Supplementary Environmental Impact Statement. Report prepared for Queensland Gas Company Ltd, Brisbane.

Economic Impact Assessment: Surat Gas Project Final Report
90
QGC (2009). Queensland Curtis LNG Project Environmental Impact Statement. Report prepared for Queensland Gas Company Ltd, Brisbane.
QRAA (2011). Sustainability Loans. Queensland Rural Adjustment Authority, Brisbane. Available at: http://www.qraa.qld.gov.au/index.php?option=com_qraa&view=detail&id=193&Itemid=89. Last accessed: 7 June 2011.
QRC (2011). Policy Paper Series April 2011. Queensland Resources Council, Brisbane.
QRC (2009).Queensland Resources Sector Primer, October 2009. Queensland Resources Council (QRC). Available from: www.qrc.org.au. Last accessed: 11th June 2010.
Queensland Government (2010a). Regional Skills Relocation. Submission into the Commonwealth inquiry into ‘regional skills relocation’. Accessed from: http://www.aph.gov.au/House/committee/ewr/regionalskills/subs/sub33.pdf. Last accessed: 31 May 2011.
Queensland Government (2010b). 2009-10 Report on State Finances of the Queensland Government – 30 June 2010. Available from: http://www.treasury.qld.gov.au/office/knowledge/docs/state-finances/2009-10/state-finances-report-2009-10.pdf. Last accessed: 27 July 2011.
Queensland Government (2008). Sustainable Resource Communities Policy: Social impact assessment in the mining and petroleum industries. Available at: http://203.210.126.185/dsdweb/v4/apps/web/secure/docs/3072.pdf
Queensland Treasury (2011a). Population Projections to 2056 Queensland and Statistical Divisions, 2011 Edition. Office of Economic and Statistical Resources, Queensland Treasury, Brisbane.
Queensland Treasury (2011b). Queensland State Accounts - Supplementary Tables, December Quarter 2010. Available from: http://www.oesr.qld.gov.au/subjects/economy/state-accounts/tables/qld-state-accounts-tables/index.php. Last accessed: 20th July 2011.
RBA (2011). Table F2 – Capital Market Yields, Government Bond Rates. Reserve Bank of Australia. Available from: http://www.rba.gov.au/statistics/tables/index.html#interest_rates. Last accessed: 13 July 2011.
REIQ (2011). Queensland Market Monitor. Real Estate Institute of Queensland, Brisbane.
RTA (2011). Rental Bond Lodgments. Data provided via email from the Rental Tenancies Authority, Brisbane, on 24th March 2011.
Santos (2009a). Gladstone LNG Project – Environmental Impact Statement. Report prepared for Santos Ltd, Brisbane.
Santos (2009b). Gladstone LNG Project –Environmental Impact Statement Supplement. Report prepared for Santos Ltd, Brisbane.
Schandl, H. and Darbas, T. (2008). Surat Basin Scoping Study. Enhancing regional and community capacity for mining and energy driven regional economic development. Report prepared for the Southern Inland Queensland Area Consultative Committee and Australian Government Department of Infrastructure, Transport, Regional Development and Local Government by CSIRO Sustainable Ecosystems, Canberra.
Sinden, J.A. and Thampapillai, D.J. (1995). Introduction to Benefit-Cost Analysis. Published by Longman Australia, Melbourne.
URS (2011). Surat Gas Project Social Impact Assessment. Report prepared for Arrow Energy and Coffey Environments by URS Australia, Brisbane.

Economic Impact Assessment: Surat Gas Project Final Report
91
Appendix A: Literature Review Introduction
The Surat Basin is experiencing rapid growth and high employment demand largely as a result of energy resource development, which brings a number of challenges for the region. A number of socio-economic issues could arise if inadequate services exist to support rapid development, including employment and skills shortages, a shortage of affordable housing, social inequities and a lack of appropriate infrastructure and services. The documents reviewed in the section below identify the potential for land use conflicts between the region’s two major sectors of agriculture and mining, and for increased competition for resources and staff. In order to achieve sustainable and diversified economic development, strategies have also been developed to support growth in the region’s other key sectors of agriculture and food processing. Other economic sectors will also be affected by the strong demand and competition for labour in the resources sector, reducing the ability of these industries to compete with global supply chains. The documents discuss strategies to address these challenges and ensure long term benefits for the region.
Investment in workforce development and attraction strategies were highlighted as a primary priority for the region in light of the region’s strong growth in the mining sector and associated downstream industries, and the forecast increase in demand for vocational skills. Supporting programs such as industry curriculums should bring about an increase in the numbers of local residents working in the energy resource industries over time, thus assisting with the retention of a highly skilled, locally based labour force. Similar employment strategies will be required for the supporting industries of gas and water, finance and insurance, transport and storage and manufacturing.
The literature review identifies that additional and improved hard infrastructure is required to assist with the development of the region’s resource energy industry while maintaining and supporting other industries as well as the local communities. This will also contribute to developing the region’s supply chain and the involvement of local business to support the energy resources industry, improving prospects for local employment. Key infrastructure required includes additional and improved transport, pipeline, ICT, accommodation, community and water infrastructure.
Documents Reviewed
Key documents reviewed included:
• Draft Surat Basin Economic Development Strategy (AECgroup, 2011);
• Surat Basin Scoping Study: Enhancing regional and community capacity for mining and energy driven regional economic development (Schandl and Darbas, 2008);
• Creating Regional Economic Development by Value Adding the Surat Energy Resources Province – 2008 Update (AECgroup, 2008);
• Coal Infrastructure Program of Actions: Identifying the needs of Queensland coal industry, including rail, ports, rollingstock, water, skills, energy and housing and planning (DIP, 2008b);
• Food Processing Action Plan (DTRDI, 2008a);
• Surat Energy Province Action Plan (DTRDI, 2008b);
• Regional Skills Relocation: A Queensland Government submission to the Commonwealth inquiry (Queensland Government, 2010a);
• Surat Basin Future Directions Statement (DEEDI, 2010a);
• Workforce Planning Report for the Queensland Coal Seam Gas/ Liquefied Natural Gas Industry: Part A – Workforce Planning (ESQ, 2009a);
• Workforce Planning Report for the Queensland Coal Seam Gas/ Liquefied Natural Gas Industry: Part C – Workforce & Competency Development Strategy Plan (ESQ 2009c); and

Economic Impact Assessment: Surat Gas Project Final Report
92
• The Skill Connection (ESQ, 2008).
Summary of Documents
Draft Surat Basin Economic Development Strategy
The Surat Basin Economic Development Strategy, which is currently in draft and has been presented for public comment by the Queensland Government Department of Employment, Economic Development and Innovation (DEEDI), identifies a number of key priority areas and opportunities for economic development in the Surat Basin region over the next 10 years.
These key opportunities are outlined in the table below.
The report also identifies challenges presented by the above opportunities, namely the provision of catalytic infrastructure and/or ‘pre-conditions’ to support economic and industry growth and expansion, including:
• Development of sufficient transport infrastructure (e.g. road, rail, air);
• Development of the necessary Information & Communication Technology (ICT) across the whole region to facilitate industry growth and community needs;
• Development of community infrastructure (e.g. schools, range of housing options, health care and recreational facilities) to support the quality of life, interaction and cohesion of existing and new residents;
• Management of critical resources such as water, land and labour (including strategies to enhance the region’s capacity to utilise these resources more effectively and/ or generate more or attract new resources to the region);
• Encouraging an entrepreneurial and “Can Do” attitude across all stakeholders within the region;
• Consolidated regional leadership and representation to manage and cope with the rate of change across business, government and the broader community; and
• In many cases, the capital to realise many of these catalytic pre-conditions and infrastructure requirements.
The report outlines the framework upon which the Surat Basin Economic Development Strategy, including detailed industry development plans, will be based. It contains the following broad strategic themes:
• Assisting and supporting local businesses;
• Adding value to existing production and resources;
• Attracting investment;
• Workforce development; and
• Advocacy and leadership.
Stakeholder groups and their roles and responsibilities are also summarised.

Economic Impact Assessment: Surat Gas Project Final Report
93
Table A.1. Future Industry Growth Opportunities, Surat Basin Region
Growth Sector High Value-Adding Activity Why the Surat Basin Region? Agriculture • Livestock production (beef and sheep production:
breeders, grass-fed grazers, stud cattle producers, feedlots and abattoirs)
• Broadacre cropping (grains production, other broad acre crops such as cotton and oilseeds)
• Horticulture (fruits and vegetables, hydroponics, nursery) • Forestry (cypress plantations) • Intensive Livestock (piggeries, poultry and egg
production) • Aquaculture (onshore aquaculture)
• Abundance of diverse agricultural land and established industry: The region has some of the most diverse agricultural land in Queensland which has been traditionally engaged in broad range agricultural production activities.
• Proximity to existing supply chain: The region has an existing supply chain to support industry such as transport, wholesale trade and food processing sectors and has proximity to alternative Ipswich and Brisbane supply chains and markets.
• Population: Local and regional population growth will increase demand for agricultural product. • Existing skills base: The Surat Basin region has an existing resident workforce which supports the
sector. • Water Resources: The region has unique access to major water resources including the Great
Artisan Basin and a number of major rivers. Development of the CSG industry may provide potential horticulture activities if the water extracted is of high quality and useable for agricultural purposes.
Building Materials Manufacturing
• Metal product manufacturing (Prefabricated steel, structural steel and architectural aluminium manufacturing)
• Pre-fabricated building manufacturing (Buildings, garages, sheds, kit homes, waste disposal blocks, etc.)
• Cement, lime, plaster & concrete manufacturing (Plaster product manufacturing, concrete slurry, concrete pipe and box culvert manufacturing)
• Cypress wood building products (building structures, fixtures, internal and external building fittings)
• Local and regional demand for product: Strong population and industry growth will result in high demand for residential and non-residential building. As a growing region there is an existing local demand for building products to support this growth.
• Existing skills base: Surat Basin region has an existing skilled resident population in the manufacture of building materials (mainly metal products).
• Availability of industrial land for development: The Surat Basin region has significant amounts of undeveloped land, which could be developed to support population and industry growth as either residential, commercial or industrial lot developments. However, much of this land will require appropriate zoning and development as there is limited service land available in the region. A broad hectare study should be undertaken to determine existing capacity in towns. DIP is currently undertaking an industrial land demand assessment in the region.
Education • University (provision of higher education courses, research activities and institutes)
• TAFE (provision of TAFE courses and technical research programs)
• RTO’s (other training organisation which will provide specialised services and training to the region)
• Centre of Excellence (water, resource sector, energy, food, environment)
• Population: Population growth will increase the demand for education services. • Industry demand: Growing industry demand will increase the demand for specialized education and
training services. • Established infrastructure & services: The Surat Basin region has existing education
infrastructure including University of Southern Queensland and TAFE.

Economic Impact Assessment: Surat Gas Project Final Report
94
Growth Sector High Value-Adding Activity Why the Surat Basin Region?
Environmental Services
• Testing & Monitoring Services (soil testing, water testing, carbon monitoring, flora and fauna management and assessment)
• Emerging carbon trading awareness & market potential: With the emergence of carbon trading the Surat Basin region may capitalize on this in the future.
• Government policy and public perception: Government policy supports environmental preservation of unique assets, as such land and water use should be monitored in the region in the future.
• Significant environmental assets: The Surat Basin has significant land and water assets in the region which should be preserved and managed appropriately.
• Emerging industrial and resource based industry: The emergence of resource and industrial based industry may present some environmental risk to certain areas of the region. Provision of environmental services will be integral in risk minimization and mitigation.
• Established agriculture industry: As a highly agricultural area, the demand for environmental services to preserve the environment of productive and non-productive lands is likely to be a key priority in the future – particularly in raising environmental awareness and adapting farming processes to consider environmentally sensitive techniques.
Food & Beverage Manufacturing
• Processed foods (packaged foods, frozen foods, ingredients, snack foods, etc.)
• Meat product processing (beef and sheep meat processing, poultry, pork)
• Baked goods (breads, biscuits, etc.) • Health foods (muesli and cereals, energy drinks, fruit and
vegetables, hydroponics, any range of high value horticulture)
• Existing industry and established supply chain: The Surat Basin region has an established food processing sector with supporting supply chain including transport, services to transport, wholesale trade and agriculture sector inputs.
• Strong agriculture sector due to abundance of diverse agricultural land and traditional agriculture activities.
• Population Demand: Product demand for food and beverage manufacturing is linked to population growth. The Surat Basin region largely supplies manufactured product to the growing population in SEQ. The Surat Basin region is expected to experience strong population growth on the back of industry lead economic growth.
• Existing skills base: A traditional strength in agriculture production and more recently food processing has resulted growth in a skills base in the region.
• Proximity to SEQ supply chains and export markets: The Surat Basin region is strategically connected and in proximity to major markets and supply chains in Ipswich, Brisbane and the remainder of SEQ and further export markets.
Government Services
• Government Offices (Commonwealth and State Government Services)
• Population: Population growth will increase the demand for government services. • Industry: Presence of significant industry activities across resource, agriculture and industrial sectors
will increase demand for regionally based Commonwealth and State Services particularly as the region develops over the next five to ten years.
• Toowoomba’s role as a regional service centre for the Darling Downs and Surat Basin region: Toowoomba has an existing role as a major regional service centre in south west Queensland and as such has an established government presence with significant Commonwealth, State and local government authorities already located in Toowoomba City, Roma and Dalby.

Economic Impact Assessment: Surat Gas Project Final Report
95
Growth Sector High Value-Adding Activity Why the Surat Basin Region?
Health Services • Hospitals (public and private) • Aged care services (retirement villages, respite and
hospice care, in-home care services) • Allied health services (physiotherapy, general
practitioners, diagnostic facilities, occupational therapy, dentists, etc.)
• Population: Population growth will increase the demand for health services. • Ageing demographic: The ageing population trend will result in increased demand for health
services, particularly aged care. • Existing infrastructure and services: The Surat Basin region has an existing strength in health
service provision with the presence of hospitals (public and private), retirement and aged care facilities and allied health care services. The region also has a reasonable service hierarchy meeting the needs of the broader community through regional centres such as Dalby and Roma.
• Existing skills base: The Surat Basin region has an existing resident workforce which supports the sector.
Machinery & Equipment Manufacturing
• Industrial machinery & equipment manufacturing (resource sector equipment, agriculture equipment, food processing equipment, specialty pumps / compressors / components, other high-tech industrial equipment)
• Specialty transportation equipment manufacturing (military vehicles, public transportation equipment, freight machinery & equipment)
• Existing industry and established supply chain: The Surat Basin region has an established machinery and equipment sector with supporting supply chain including transport, services to transport and wholesale trade.
• Existing skills base: A traditional strength in machinery and equipment manufacturing has resulted growth in a skills base in the region.
• Demand for product locally and regionally (agriculture & resources): Growth of agriculture and resource sectors in the region will result in growth in demand for specialized machinery and equipment in the Surat Basin region.
Mining & Resources
• Mining/Resources (coal mining, coal-seam-gas extraction, coal-seam-gas water extraction, other metals and minerals products)
• Quarrying & extractive resources (sand, hard rock and other resources used in building)
• Abundance of resources: An abundance of resources in the Surat Basin region has sparked significant industry investment in the region and result in strong industry growth and activity in the region over the next 20 years.
• Global, national and regional demand for energy resources will result in high prices for energy and resource products and continued investment and interest by large resource sector stakeholders in the resource rich region.
• Regional demand for building material resources to support infrastructure building and general construction activities.
Professional Services
• Professional services (accounting, banking, legal, property)
• Population: Growth in population will result in increasing demand for banking, legal, accounting and property services.
• Industry: Growth in industry will result in increased demand for property services particularly through the development of commercial and industrial lots.
• Availability of land for development: The Surat Basin region has significant amounts of undeveloped land, which could be developed to support population and industry growth as either residential, commercial or industrial lot developments. However, much of this land will require appropriate zoning and development as there is limited serviced land available in the region.

Economic Impact Assessment: Surat Gas Project Final Report
96
Growth Sector High Value-Adding Activity Why the Surat Basin Region?
Renewable Energy • Solar (photovoltaic’s energy generation, connection and storage with energy grids)
• Bio-fuels (diesel and fuel production from forestry, animal and other waste products)
• Wind (wind turbines and supporting infrastructure) • Geo-thermal (hot rocks) • Waste management (household, industry, business)
• Climate & geography: The climate and geography of the Surat Basin region make it ideal for solar and wind farm energy generation activities.
• Existing energy infrastructure: The presence of existing energy infrastructure in the region is an advantage as additional energy created through renewable energy sources may be more easily linked into the transmission network (lower costs of capital than if located away from transmission infrastructure).
• Growing demand for energy: A growing national and global demand for energy resources, particularly renewable where possible.
• Established agriculture & forestry activities: Existing agriculture and forestry activities in the region provide a range of natural resources, which could be used in biofuel production such as manures and other waste products and in some cases oil seeds and trees for fuel production.
• Emerging CSG industry byproduct activities: The CSG industry is also exploring options for energy production from waste or water products from production activities.
Services to Mining & Resources
• Engineering Services (design and construction of resource sector equipment and structures, construction, site survey)
• Geology & Mining/Resource Technical Services (geotechnical analysis, exploration services, drilling services, oil & gas well castings, gas field support)
• Strong and growing resource sector: The growth of the resource sector in the region will likely result in a local demand for mining and resource services in the region.
Tourism • Agriculture & heritage tourism (farm stay, regional heritage museums, built and unbuilt environment tourism, agriculture asset and processes e.g. stock yards, shows and selling centres)
• Events tourism (gardens festival, jazz and music festivals) • Food & wine tourism (farmers markets, food and wine
festivals, cafes and restaurants)
• Existing Tourism events: An existing range of tourism events that the Surat Basin region is well known for including garden festivals, picnics, country and farmers markets, jazz festivals, arts ,crafts and cultural show.
• Agriculture and environmental tourism: With major agriculture assets and environmental landscapes the Surat Basin region has an existing strength in agriculture and environmental tourism.
• Food & wine tourism: An existing strength in food production and some wine production in the region lends the region to developing its food and wine tourism base.
• Proximity to SEQ: Proximity to SEQ provides an easily accessible tourism market for people seeking an escape from the highly populated areas of SEQ.
• Unique landscapes and environmental assets: The diversity of environmental assets provides a range of nature activities, landscapes and flora and fauna for those seeking a nature experience in country Queensland.
Transport & Logistics
• Logistics operations (warehousing and distribution operations servicing a variety of clients and customers for both import and export to and from the region)
• Rail transport (Rail freight for major exports from the region)
• Airport transport (passenger travel, aviation services)
• Services to transport (services to road, rail and air)
• Industry demand: High demand for transport and transport services by the resource and agriculture sectors.
• Population Growth: Population growth will increase demand for passenger travel into and out of the region.

Economic Impact Assessment: Surat Gas Project Final Report
97
Growth Sector High Value-Adding Activity Why the Surat Basin Region?
Water Treatment & Monitoring
• Treatment Services (filtration plant, pumping station, reservoir and water supply system operation)
• Monitoring Services (Pollution monitoring service, testing or assay service, hydrographic surveying service)
• R&D (research centre and training: water use and treatment research, Great Artisan Basin and water replacement research, water use and conservation research)
• Industry demand for water resources: A growing industry demand in the region (agriculture and resource industries) will require high quality water and management and monitoring of water resources in the region.
• CSG industry water extraction: There is potential for water extracted during CSG extraction process to be used for regional industrial and population uses or reinjected back into the ground water system. In either case, the usability of the water will be determined by the quality the water. As such water treatment, monitoring and management services in the region will be integral to future water use processes.
• Availability of unique water resources: The Surat Basin region has a number of unique water resources including the Great Artisan Basin and several major rivers which feed into the catchment. It also has two major rivers which supply the Murray-Darling River Systems. Managing and protecting these precious water resources will not only impact the sustainability of the Surat Basin region but also other regions throughout Australia.
• Research Assets: An existing presence of research assets such as USQ and TAFE could be fundamental to the establishment of water research facilities to support water industry development in the region.
• Population demand: Growing population demands will call for high quality water and management of water resources in order to ensure sustainability of supply to the region.
Source: DEEDI (2011).

Economic Impact Assessment: Surat Gas Project Final Report
98
Surat Basin Scoping Study: Enhancing regional and community capacity for mining and energy driven regional economic development.
This scoping study addresses the significant change in regional development faced by the communities of the Surat Basin due to the expected growth in development of the resource sector. The study identifies that, like the development of the Bowen Basin, the rapid, resource driven growth of the Surat Basin could introduce numerous social issues for the region and its economic development, including employment and skills shortages, a shortage of affordable housing, social inequities and lack of appropriate infrastructure and services. Drawing from a comprehensive literature review and an extensive consultation and workshopping process with local stakeholders, the authors of the scoping study arrived at a number of recommendations and actions that can be implemented to maximise the potential positive impacts and to mitigate the potential negative impacts. The study finds that, in order to support the sustainable development of the communities of the Surat Basin, it will be necessary to recognise the following:
• Gain and revenue sharing will be essential to increase the social acceptability of mining operation and to increase the local economic opportunities from mining in the Surat Basin;
• Economic diversification leveraged off the energy boom is essential to the long term well being of the region;
• Investment in hard and soft infrastructure will be crucial to meet the demand of an increased population; and
• Information, communication and transparency are all critical for effective on-going management of regional opportunities and for enabling good governance and change management at the community level.
The study further analyses the difficulties in achieving a well balanced regional economy where mining is dominant; the potential downsizing of agriculture in the region, the region’s traditional primary economic sector, and loss in social fabric resulting from the younger generation moving away from traditional agricultural employment into higher paid mining employment; the need for, and difficulty with, successfully attracting the indigenous populations into the changing workforce; and potential conflicts that could arise with various economic sectors competing for water, with climate change potentially exacerbating this situation.
Food Processing Industry Action Plan
Produced by the Department of Tourism, Regional Development and Industry (DTRDI), this fact sheet identifies the major contribution that primary production and food processing represent to the South West region of Queensland, and the desire of the Darling Downs and South West region to become Australia’s centre for food processing in meat, grains and horticulture. The region generated approximately a quarter of the state’s crops and livestock and is well known for its beef, cotton, wool and grain. It hopes to build upon its strong agricultural heritage to facilitate economic development and contribute to greater wealth generation within the region.
Surat Energy Province Action Plan
Produced by DTRDI, this fact sheet gives a very broad overview of the initiatives to capitalise on supply chain opportunities stemming from the development of the Surat Energy Resource Province. Recognising that the Surat Basin has the potential to become the “central energy powerhouse of Queensland and ultimately a major exporter of high quality thermal coal and coal seam gas”, DTRDI hopes to work in partnership with local industry groups, mines, mining services and other supply companies to take advantage of emerging opportunities, to build upon industry strengths and address challenges facing the mining supply sector.
Surat Basin Future Directions Statement
This document provides a framework for a coordinated and region-wide approach to maximising the economic benefits associated with the development of the Surat Basin’s

Economic Impact Assessment: Surat Gas Project Final Report
99
energy resource sector and minimising any unintended consequences of rapid growth. Future Directions identifies the major issues facing the region and sets out an integrated approach on how the region will address these issues. It establishes clear mechanisms to coordinate the work of the Queensland and regional governments and the Surat Stakeholders.
Recognising that the energy resource sector provides serious opportunity for economic growth and development, Future Directions also realises that this will put pressure on local communities, all other aspects of their economies and the environment, that adequate planning is needed to precede and accompany rapid growth, and seeks to develop the strategies necessary to convert some of the energies and wealth of the expected resource boom into long term benefits for the region.
Positioned on a twenty year time horizon to 2030, Future Direction identifies the key themes that need to be addressed in order to successfully facilitate the sustainable development of the region in a way the delivers the maximum benefits to its businesses and communities. Drawing heavily on the lessons learned from the impacts of the development of the Bowen Basin on its regional communities, the six key themes are:
• Planning for growth;
• Planning and developing infrastructure;
• Capturing economic opportunities and building resilience;
• Developing a skilled workforce;
• Building and maintaining liveable communities; and
• Sustaining regional environments.
Workforce Planning Report for the Queensland Coal Seam Gas/ Liquefied Natural Gas Industry: Part A – Workforce Planning
The Workforce Planning Report, authored by Energy Skills Queensland, assesses the strategy workforce planning, training and development of Queensland’s coal seam gas/liquefied natural gas (CSG/LNG) industry and addresses the planning necessary to prepare for the considerable increasing skills demand within this industry over the next ten years. It recognises that the operational workforce within this industry is likely to grow by four times its current size by 2020, with the greatest demand for workers being in vocational occupations with technical skills as well as across all engineering professional and para-professional roles. Competition is likely to be intense between occupational groups, between the various resource industries and between the regions throughout Australia where mining plays an integral or leading role in the economy.
The report recognises that the current supply of trainees and apprentices to critical jobs roles is inadequate and that it will be crucial for the industry and government to invest in targeted workforce development strategies. These strategies include:
• Providing significant investment in education and training to allow for qualified staff to enter into the industry;
• Attracting and retaining workers to the industry and regions from supply streams such as direct interstate and international migration;
• Attracting retirees back to the workforce;
• Sourcing labour from industries in decline; and
• Targeting minority groups such as females and indigenous workers in relation to employment opportunities in the industry.
The report concludes that the likelihood of acute labour shortages in resource intensive regions is ‘extreme’, and that one strategy alone will not resolve the pending level of acute skills shortages or mitigate risk to the industry. Rather, the implementation of several workforce strategies is required that clearly target the attraction of new skills and labour to the industry through a concerted industry-owned approach to workforce development.

Economic Impact Assessment: Surat Gas Project Final Report
100
Workforce Planning Report for the Queensland Coal Seam Gas/ Liquefied Natural Gas Industry: Part C – Workforce & Competency Development Strategy Plan
Incorporating the same findings from Part A of the Workforce Planning Report, this report identifies the key strategic workforce development responses to address the identified skills shortage within the CSG/LNG industry. The workforce development strategy advocates a multi-faceted systems approach to building the capacity, capability and long term sustainability of the industry wide workforce, with an intent to achieve a competitive advantage for the industry in the attraction and retention of skills.
The Workforce Development Plan offers a comprehensive way of thinking about and responding to the complexity of the labour market that impact the supply of a skilled and competent workforce, and hopes to move the focus from individual workers within an organisation to the development of a strategic and sustainable system from an industry wide workforce planning perspective.
The report identifies four primary areas of focus within the ‘Integrated Workforce and Competency Strategy’:
• Workforce skills attraction and retention strategy;
• Skills development strategy;
• Skills systems strategy; and
• Skills and competency sustainability.
Within each of the primary areas of focus, a number of programs are presented which address specific objectives, such as the establishment of career advisory centres, the introduction of industry specific curriculums into the local and national knowledge infrastructure, and programs attracting specific supply streams of labour (migrants, defence force personnel, recent retirees, etc).
The strategies for implementing the Workforce Development Plan represents framework for identifying the various objectives of competency and skills development, key activities to be undertaken to achieve the objective and the indicative outcomes sought, the advantages of realizing these outcomes and methods for assessing the success of the implementation of the strategies.
Regional Skills Relocation: A Queensland Government submission to the Commonwealth inquiry
This paper identifies that, with the easing of the Global Financial Crisis, competition for skilled mining labour will once again heat up between Queensland and Western Australia and this will likely create acute skills shortages, particularly in regional and remote areas. The paper singles out the Surat Basin as its case study, citing that it had the state’s lowest unemployment rate, 3.0%, at the height, and that is should learn from the rapid population and economic growth experienced in the Bowen Basin that led to social problems such as road safety, lack of affordable housing and insufficient medical services. It advises that in order for the Surat Basin to avoid many of the negative impacts experienced by the Bowen Basin, it will require a long term strategy that will involve commitment from all levels of government, industry and the local community working together to ensure that stakeholders are committed and empowered to achieve the necessary outcomes for their respective interests. Foremost to achieving the sustainable development of the Surat Basin is the attraction and retention of an appropriately sized and skilled workforce. The paper suggests that the strategies for attracting additional members to the regional workforce should target migrants/refugees, young people, retrenched workers, and older, skilled workers that have recently retired.
The Skill Connection
The April newsletter of Energy Skills Queensland (ESQ) gives a comprehensive overview of the various strategies and programs in place or which have been committed, to train, up-skill and attract workers in Queensland’s energy and telecommunications industries. ESQ continues to be a strong advocate for the energy industry and has secured funding in 2010 for 1,540 training places. Working in partnership with the QLD Government and several major private sector companies, ESQ has developed a Coal Seam Gas to

Economic Impact Assessment: Surat Gas Project Final Report
101
Liquefied Natural Gas (CSG/LNG) Workforce Development Plan to address the need for an estimated 7,000 skilled positions needed to fill the estimated 25 year life span of the CSG/LNG industry, with the partnership recently announcing a $10 million program to train thousands of worker for these industries.
Private sector companies have also instated their own programs for training workers, with Santos unveiling a $50 million skills training plan to be rolled out over the next five years, and including apprenticeship training, investment in knowledge infrastructure to introduce LNG curriculum and an indigenous training program to support a target of 300 indigenous jobs within the industry. The private sector has also partnered with the QLD Government to introduce and offer education and training options for students within the key industry regions, such as the Surat Basin, where from 2010, seven high schools have begun offering curriculum related to the CSG/LNG industry.
Creating Regional Economic Development by Value Adding the Surat Energy Resources Province – 2008 Update
Undertaken by AECgroup, this paper updated the 2007 "Creating Regional Economic Development by Value Adding the Surat Energy Resources Province" report in light of existing, planned and potential future mining and gas extraction developments, as well as associated value adding projects, in the region. Consultation was undertaken with government and industry stakeholders to identify development opportunities that had come to light since the previous report, and potential future development scenarios. These development scenarios fed into a dynamic labour force driven population growth and economic output model to examine the impact of these development scenarios on the regional economy.
The report found that the production of both coal and coal seam gas in the Surat Energy Resources Province is expected to increase ten-fold by 2031 from its 2008 levels. Over this time, employment will increase by 12,500 full time positions (4,500 direct, 8,000 flow-on), with growth expected primarily in the sectors of mining, electricity, gas and water, finance and insurance, transport and storage and manufacturing.
Coal Infrastructure Program of Actions: Identifying the needs of Queensland coal industry, including rail, ports, rollingstock, water, skills, energy and housing and planning
Produced in 2008, the Coal Infrastructure Program of Actions 2008 identifies $19.3 billion of coal related infrastructure works underway or planned in Queensland, including:
• Rail: $1 billion committed and $4.6 billion planned
• Additional rollingstock: $2.1 billion
• Ports: $2.5 billion committed and $7.2 billion planned
• Water: $445 million
• Energy: $1.3 billion
• Skills: $25 million
• Housing and Planning: $31 million
The Surat Basin Railway, linking the Surat Basin to Gladstone, is identified as one of the major projects planned to position the state to meet current and future demand for Queensland coal. The $195 million Western Coal Supply System linking mines in the Surat and Clarence-Moreton Basins to the Port of Brisbane is also underway.
The Program of Actions notes the $25 million committed by the Queensland Government to assist the industry with finding solutions to skills shortages. These funds have been used to establish the Queensland Minerals and Energy Academy and the Mining Industry Skills Centre to address medium to long term training and skills issues, and to increase the number of students pursuing trades in the mining and energy sectors through apprenticeships, traineeships and work experience.

Economic Impact Assessment: Surat Gas Project Final Report
102
PAGE LEFT INTENTIONALLY BLANK

Economic Impact Assessment: Surat Gas Project Final Report
103
Appendix B: Summary of Stakeholder Consultation
In order to inform elements of the existing economic environment and relevant sections of the economic and cumulative impact assessments, consultation was undertaken with a range of stakeholders, including:
• Southern Downs Regional Council;
• Toowoomba Regional Council;
• Western Downs Regional Council;
• Industry and regional organisations including:
o Energy Skills Queensland;
o Queensland Resources Council;
o Surat Basin Corporation;
o Surat Basin Developments;
o Chamber of Commerce and Industry; and
• Local real estate agents.
Key themes identified throughout consultation included:
• There has been a considerable increase in resource activity, in particular exploration activity, which has attracted a sizeable FIFO/ DIDO workforce to the Darling Downs. The FIFO/ DIDO population in the Darling Downs is anticipated to increase over the next ten to fifteen years as energy resource development expands and more skilled labour is imported to the region.
• Businesses in the region, in particular small business, have experienced difficulties in recent years in filling positions vacated due to the tightness in labour markets and difficulties associated with encouraging workers to move to small and remote locations.
• The Darling Downs is currently experiencing considerable infrastructure constraints, in particular road and rail transport infrastructure and telecommunications infrastructure. Social infrastructure is also lagging the influx of population to the region.
• The Darling Downs is experiencing a tight rental market and housing shortages, in particular in Western Downs and Southern Downs LGAs where most of the recent development activity has occurred. This is in part due to the influx of mining and gas exploration and development workers. Rental vacancy rates are reportedly less than 1% in the Western Downs LGA.
• Serviced industrial land that is ready for development is undersupplied in the Darling Downs, which is presenting issues for investment and attraction of industrial sector businesses to the region to support the resource sector and associated supply chain.
• Industrial land prices have reportedly doubled in the past two years in some areas, in particular Chinchilla and Dalby. Issues of suitable available land and lengthy approval processes have seen some industrial development occurring on farm land outside of major towns.
• Gas related activity in the region in recent years has supported development of industrial land, notably in Dalby. Businesses supplying transport, logistics and drilling services and technical laboratory support to the gas industry have taken up new industrial land releases, with the majority of these operations representing new businesses rather than existing businesses upgrading and/or expanding facilities.
• The long ramp up period associated with gas projects are expected to result in less acute impacts on the property market than most other major projects, as it allows for a more steady release and development of residential land to accommodate increased demand for property.

Economic Impact Assessment: Surat Gas Project Final Report
104
• Regional planning has not accounted for flow-on demand for property being generated as a result of supply chain and support services development to support current projects. This has contributed to residential developments selling at a faster rate than anticipated, resulting in developers bringing forward subsequent stages of some existing residential developments in the region.
• Agricultural land values have softened in recent years. This is primarily a result of climatic conditions and general rural downturn. Anecdotally, however, uncertainty regarding impacts on agricultural production from the resources sector and potential compensation has also been cited as a potential contributing factor to softening agricultural land values in the region.
• Training programs have and are being put in place to assist in meeting the skills requirements of coal seam gas (and LNG) projects during both construction and operation.

Economic Impact Assessment: Surat Gas Project Final Report
105
Appendix C: Computable General Equilibrium Methodology Model Overview
Computable General Equilibrium (CGE) economic models represent the workings of the economy through a system of interdependent behavioural and accounting equations linked to an input-output database.
Beginning with the production processes of individual industries, supported by inputs from other industries and the use of the primary factors of production, then adding in investment demand, private and government consumption, imports and exports, CGE modelling represents a fully integrated model of the world economy. In the model used for this assessment, production technology, individual markets, investment, trade and consumption are represented by equations with strong microeconomic foundations. The simultaneous solution of these equations in response to external changes (or ‘shocks’) generates the model solutions. When an economic shock, such as a new project, is applied to the model, each of the markets adjusts to a new equilibrium according to the economic theory and behavioural parameters that underpin the model.
In addition to recognising the linkages between industries in an economy, CGE models also recognise the constraints that apply in an economy (e.g. increased demand for labour will push the costs of labour up if there is full employment).
The CGE model used for this assessment is a dynamic model, which means it solves year-by-year, allowing a stream of annual results to be reported. Results are presented as deviations from a base (or reference) case, where the base case represents an anticipated growth path of the economy without the project.
Figure C.1. Representation of a Single Region in the CGE Model
Modelling Assumptions
The economic impacts of the three components of the Surat Gas Project on the Darling Downs, Queensland and national economies has been assessed by Prime Research utilising the Tasman Global Computable General Equilibrium (CGE) modelling framework.
Dynamic simulations using CGE modelling require two separate model runs. The first model run, known as the ‘base case’, simulates one view of the economic future. In this view of the future the Surat Gas Project does not proceed.
Capital Labour Land Natural resources
Production
Supplying industries
Using industries
Investment Private consumption
Government consumption
Imports Exports
Final Demand
Primary factor market
Production process
Final demand
International trade

Economic Impact Assessment: Surat Gas Project Final Report
106
In the second model run, known as the ‘with project case’, an alternative view of the economic future is simulated. In this view of the future the Surat Gas Project development proceeds, and includes activities associated with gas extraction for domestic and export markets.
Economic growth rates used in the modelling are based on near-term projections from Australian Government and State Treasuries, and medium to long term projections are a function of assumptions regarding changes in population, and particularly changes in the working age population), workforce participation rates and changes in labour productivity.
Regional population growth used in the modelling has been projected using an in-house demographic model. This model projects how populations change in each region and subsequently estimates changes in the working age population which flows through to regional labour supply and participation rates.
Population growth for the eight Australian States and Territories incorporates detailed ABS data on population levels, births, deaths and migration. Population growth in the Darling Downs is based on information referenced from Queensland Treasury.
Labour productivity growth is influenced by many factors, including capital intensity, training and education and composition of the workforce. Over the last 30 years Australia’s labour productivity growth has averaged around 1.75% per annum. In the ‘base case’ Australian labour productivity growth is assumed to gradually slow from around 1.75% per annum in 2020 to 1.5% per annum in 2030.
Table C.1. Base Case Economic Growth Assumptions
Region Average Annual Growth (%)
Queensland 3.6%
Australia 3.0%
Rest of the World 3.1% Source: Prime Research (unpublished).
In addition to the base assumptions outlined in Table C.1, the following key assumptions for the baseline scenario were applied to the Darling Downs:
• Queensland Curtis LNG Project proceeds at the maximum scale contemplated under the project environmental approvals, with three LNG trains each of 4 Mtpa capacity, for a total of 12 Mtpa, sourcing gas from the Surat Basin. The first two trains are assumed to come on line at the beginning of 2014 and 2015 respectively, with the third train not in production until 2021.
• Gladstone LNG Project proceeds at maximum scale contemplated under the project environmental approvals, with three LNG trains for a total of 10 Mtpa and sourcing gas from the Surat and Bowen basins. The first two trains are assumed to be of 3.9 Mtpa capacity and to come on line in 2015 and 2016 respectively, in accordance with the configuration announced by the proponents as the basis for the final investment decision. As a result, and in order to remain within the overall 10 Mtpa capacity covered by the existing environmental approvals, the third train is limited to 2.2 Mtpa, assumed to come on line 2022.
A fixed domestic labour assumption has been used in the modelling, as per modelling undertaken on the LNG industry by McLennan Magasanik Associates (2009) for the Queensland Government. A constrained labour mobility assumption has been utilised between States, with labour mobility assumed to be motivated by real wage differentials. Labour mobility assumptions include both inter-industry labour movement within regions as well as inter-regional and interstate labour movement. Labour is assumed to not be sufficiently mobile to remove these real wage differentials completely (i.e., in order to attract labour, real wages will increase).

Economic Impact Assessment: Surat Gas Project Final Report
107
Appendix D: Cost Benefit Analysis Methodology Overview
A Cost Benefit Analysis (CBA) framework is utilised in this analysis to identify if the benefits delivered by the proposed development of the Surat Gas Project are anticipated to outweigh the costs of the development.
CBA is an analytical tool that identifies and attempts to quantify the relative costs and benefits of a project and converts available data into manageable and comparable information units. CBA uses a discounted cash flow (DCF) framework and applies this framework across the entire range of benefits and costs that may accrue as a result of a project to a community or group of stakeholders. The strength of the method is that it provides a framework for analysing complex and sometimes confusing data in a logical and consistent way.
CBA assesses the impact of a development by comparing the ‘with’ and ‘without’ scenarios, and is useful in assessing the net benefits accruing to society as a whole as a result of a project. The CBA method considers the effect of real resource costs and benefits, and excludes, for example, taxes and subsidies, which are regarded as transfer payments from one part of the economy to another.
A detailed overview of the steps undertaken in the CBA process is discussed below, and is consistent with accepted CBA methodologies as outlined in Campbell and Brown (2003), Sinden and Thampapillai (1995), Australian Government Department of Finance and Administration (DFA, 2006) and Queensland Government Department of Infrastructure and Planning (DIP, 2008c).
Step 1: Define the Scope and Boundary
To enable a robust determination of the net benefits of undertaking a given project, it is necessary to specify base case and alternative case scenarios. The base case scenario represents the ‘without project’ scenario and the alternative or ‘with project’ scenario examines the impact with the project in place.
The base case (without) scenario is represented by line NB1 (bc) over time T1 to T2 in the figure below. The investment in the project at time T1 is likely to generate a benefit, which is represented by line NB2 (bd). Therefore the net benefit flowing from investment in the project is identified by calculating the area (bcd) between NB1 and NB2.
Figure D.1. With and Without Scenarios
a b c
d
T1 T2
Benefit
Time
NB2
NB1
Source: AECgroup

Economic Impact Assessment: Surat Gas Project Final Report
108
Step 2: Identify Costs and Benefits
A comprehensive quantitative specification of the benefits and costs included in the evaluation and their various timings is required and includes a clear outline of all major underlying assumptions. These impacts, both positive and negative, are then tabulated and where possible valued in dollar terms.
Some impacts may not be quantifiable. Where this occurs the impacts and their respective magnitudes will be examined qualitatively for consideration in the overall analysis.
Financing costs are not included in a CBA. As a method of project appraisal, CBA examines a project’s profitability independently of the terms on which debt finance is arranged. This does not mean, however, that the cost of capital is not considered in CBA, as the capital expenses are included in the year in which the transaction occurs, and the discount rate (discussed below in Step 5) should be selected to provide a good indication of the opportunity cost of funds, as determined by the capital market.
Step 3: Quantify and Value Costs and Benefits
CBA attempts to measure the value of all costs and benefits that are expected to result from the activity in economic terms. It includes estimating costs and benefits that are ‘unpriced’ and not the subject of normal market transactions but which nevertheless entail the use of real resources. These attributes are referred to as ‘non-market’ goods or impacts. In each of these cases, quantification of the effects in money terms is an important part of the evaluation.
However, projects frequently have non-market impacts that are difficult to quantify. Where the impact does not have a readily identifiable dollar value, proxies and other measures should be developed as these issues represent real costs and benefits. Some commonly utilised techniques for valuing non-market impacts are outlined in Table D.1.
Table D.1. Valuation Techniques
Type of Valuation
Valuation Technique
Description
Stated Preference Valuation
Contingent Valuation (CVM)
This technique uses a simulated or hypothetical market to directly assess the willingness to pay (WTP) or the willingness to accept compensation (WTAC) for a particular environmental outcome. The survey-based approach can be used to measure both use and non-use values, and is generally applied in assessing a dollar value to a change in or preservation of environmental quality.
Choice Modelling (CM)
Similar to CVM, choice modelling (CM) utilises stated preferences of respondents to rank or rate different scenarios. Respondents must choose between specific options presented to them. CM can produce independent values for the specific attributes of an environmental program.
Revealed Preference Valuation (surrogate market based)
Hedonic Pricing
Hedonic pricing employs the use of surrogate markets to value environmental quality. Property and labour markets are widely used for this technique.
Travel Cost This valuation technique is based on the assumption that demand for an asset is revealed by a willingness to spend money and time travelling to the particular site. It is also assumed that expenditure is higher for travel to more valuable sites. This methodology is best used in assessing amenity or recreational value.
Revealed Preference Valuation (market based)
Factor of Production
The factor of production technique is limited to assets that are used in the production process of goods and services within the market, as it uses the direct value in production as an indicator of the environmental worth.
Producer/ Consumer surplus
This technique is a calculation of both producer and consumer surplus.
Defensive Expenditure
This valuation technique is based on expenditure that is made on behalf of the public or specific industry in prevention or counteraction of environmental damage (such as pollution).
One commonly used method of approximating values for non-market impacts is ‘benefit transfer’. Benefit transfer (BT) means taking already calculated values from previously conducted studies and applying them to different study sites and situations. In light of the significant costs and technical skills needed in using the methodologies outlined in the

Economic Impact Assessment: Surat Gas Project Final Report
109
table above, for many policy makers utilising BT techniques can provide an adequate solution.
Context is extremely important when deciding which values to transfer and from where. Factors such as population, number of households, and regional characteristics should be considered when undertaking benefit transfer. For example, as population density increases over time, individual households may value nearby open space and parks more highly. Other factors to be considered include, depending on the location of the original study, utilising foreign exchange rates, demographic data, and respective inflation rates.
Benefit transfer should only be regarded as an approximation. Transferring values from similar regions with similar markets is important, and results can be misleading if values are transferred between countries that have starkly different economies (for example a benefit transfer from the Solomon Islands to Vancouver would likely have only limited applicability). However, sometimes only an indicative value for environmental assets is all that is required.
Step 4: Tabulate Annual Costs and Benefits
All identified and quantified benefits and costs are tabulated to identify where and how often they occur. Tabulation provides an easy method for checking that all the issues and outcomes identified have been addressed and provides a picture of the flow of costs, benefits and their sources.
Step 5: Calculate the Net Benefit in Dollar Terms
As costs and benefits are specified over time it is necessary to reduce the stream of benefits and costs to present values. The present value concept is based on the time value of money – the idea that a dollar received today is worth more than a dollar to be received in the future. The present value of a cash flow is the equivalent value of the future cashflow should the entire cashflow be received today. The time value of money is determined by the given discount rate to enable the comparison of options by a common measure.
The selection of appropriate discount rates is of particular importance because they apply to much of the decision criteria and consequently the interpretation of results. The higher the discount rate, the less weight or importance is placed on future cash flows.
The choice of discount rates should reflect the weighted average cost of capital (WACC). For this analysis, a base discount rate of 15.0% has been used to represent the minimum commercial rate of return. As all values used in the CBA are in real terms, the discount rate does not incorporate inflation (i.e., it is a real discount rate, as opposed to a nominal discount rate).
To assess the sensitivity of the project to the discount rate used, one discount rate either side of the base discount rate (15.0%) has also been examined (10% and 20%), as well as the average Australian Government 10-year bond rate over the past 30 years of approximately 9%, or 6% in real terms (RBA, 2011).
The formula for determining the present value is:
nn
r
FVPV
)1( +=
Where:
PV = present value today
FV = future value n periods from now
r = discount rate per period
n = number of periods

Economic Impact Assessment: Surat Gas Project Final Report
110
Extending this to a series of cash flows the present value is calculated as:
nn
rFV
rFV
rFVPV
)1()1()1( 22
11
+++
++
+=
Once the stream of costs and benefits have been reduced to their present values the Net Present Value (NPV) can be calculated as the difference between the present value of benefits and present value of costs. If the present value of benefits is greater than the present value of costs then the option or project would have a net economic benefit.
In addition to the NPV, the internal rate of return (IRR) and benefit-cost ratio (BCR) can provide useful information regarding the attractiveness of a project. The IRR provides an estimate of the discount rate at which the NPV of the project equals zero, i.e., it represents the maximum WACC at which the project would be deemed desirable. However, in terms of whether a project is considered desirable or not, the IRR and BCR will always return the same result as the NPV decision criterion.
Step 6: Senstivity Analysis
Sensitivity analysis allows for the testing of the key assumptions and the identification of the critical variables within the analysis to gain greater insight into the drivers to the case being examined.
A series of Monte Carlo analyses has been conducted in order to test the sensitivity of the model outputs to changes in key variables. Monte Carlo simulation is a computerised technique that provides decision-makers with a range of possible outcomes and the probabilities they will occur for any choice of action. Monte Carlo simulation works by building models of possible results by substituting a range of values – the probability distribution – for any factor that has inherent uncertainty. It then calculates results over and over, each time using a different set of random values from the probability functions. The outputs from Monte Carlo simulation are distributions of possible outcome values.
During a Monte Carlo simulation, values are sampled at random from the input probability distributions. Each set of samples is called an iteration, and the resulting outcome from that sample is recorded. Monte Carlo simulation does this hundreds or thousands of times, and the result is a probability distribution of possible outcomes. In this way, Monte Carlo simulation provides a comprehensive view of what may happen. It describes what could happen and how likely it is to happen.

Economic Impact Assessment: Surat Gas Project Final Report
111
Appendix E: Risk Assessment Framework A risk-based approach, adapted from the Australian/New Zealand Standard for risk management (AS/NZS 31000:2009), has been used in the assessment of cumulative impacts. The risk assessment framework used identifies and ranks risks into relevant levels (negligible, low, medium, high and very high) to inform key issues and impacts for avoidance, mitigation and management measures.
The assessment was undertaken by examining the likelihood of an effect occurring and the potential consequences (i.e., a measure of severity of environmental effect) should the effect occur. Table E.1 contains the descriptors used to classify the likelihood and consequence.
Table E.1. Descriptors Used to Classify Likelihood and Consequence
Descriptor Description
Likelihood Almost certain Will occur, or is of a continuous nature, or the likelihood is unknown. There is likely to be an
event at least once a year or greater (up to 10 times per year). It often occurs in similar environments. The event is expected to occur in most circumstances.
Likely There is likely to be an event on average every one to five years. Likely to have been a similar incident occurring in similar environments. The event will probably occur in most circumstances.
Possible The event could occur. There is likely to be an event on average every five to 20 years.
Unlikely The event could occur but is not expected. May have heard it discussed as a possibility but an extremely unusual one. A rare occurrence (once per 100 years).
Rare The event may only occur in exceptional circumstances. Very rare occurrence (once per 1,000 years). Unlikely that it has occurred elsewhere; and if it has occurred, it is regarded as extremely unique.
Consequence Insignificant Possible impacts but without noticeable consequence. Temporary or short-term reversible
environmental impact, localised event, location of little environmental value.
Minor Some limited consequence but no significant long-term changes, may be easily rehabilitated.
Moderate Significant changes, may be rehabilitated with difficulty. Direct or indirect environmental impacts beyond location (on site or off site). Repeated public concern. Reportable to the government.
Major Substantial and significant changes, will attract ongoing public concern, only partially able to be rehabilitated or uncertain if it can be successfully rehabilitated. Actual or potential environmental harm either temporary or permanent, requiring immediate attention. Possible prosecution by regulatory authorities.
Catastrophic Extreme permanent changes to the environment, major public outrage, or the consequences are unknown. Serious environmental harm that causes actual or potential environmental impacts that are irreversible or of high impact or widespread. Likely prosecution by regulatory authorities.
Source: Adapted from AS/NZS 31000:2009.
The level of risk associated with each potential cumulative impact was then determined by combining likelihood and consequence using the matrix in Table E.2.
Table E.2. Risk Evaluation Matrix
Likelihood Consequences
Insignificant Minor Moderate Major Catastrophic
Almost certain Medium Medium High Very High Very High
Likely Low Medium Medium High Very High
Possible Low Low Medium High High
Unlikely Negligible Low Low Medium High
Rare Negligible Negligible Low Medium Medium Source: Adapted from AS/NZS 31000:2009.

Economic Impact Assessment: Surat Gas Project Final Report
112
PAGE LEFT INTENTIONALLY BLANK

Economic Impact Assessment: Surat Gas Project Final Report
113
Appendix F: Map of EIS Study Area Figure F.1. Surat Gas Project EIS Study Area
Source: Coffey Environments (2011).

Economic Impact Assessment: Surat Gas Project Final Report
114
PAGE LEFT INTENTIONALLY BLANK

Economic Impact Assessment: Surat Gas Project Final Report
115
Appendix G: Census Tables Table G.1. Census Employment by Industry (by Place of Work), Darling Downs and Queensland, 2006
Industry Darling Downs SD
Queensland
Agriculture, forestry and fishing 12.2% 3.5%
Retail trade 12.1% 12.0%
Health care and social assistance 11.2% 10.6%
Manufacturing 10.7% 10.1%
Education and training 9.1% 7.9%
Construction 7.8% 9.1%
Public administration and safety 6.6% 6.9%
Accommodation and food services 5.5% 7.1%
Transport, postal and warehousing 4.4% 5.1%
Other services 4.0% 3.9%
Wholesale trade 3.8% 4.1%
Professional, scientific and technical services 3.5% 5.9%
Financial and insurance services 2.6% 3.0%
Administrative and support services 1.8% 3.1%
Rental, hiring and real estate services 1.3% 2.2%
Information media and telecommunications 1.0% 1.5%
Electricity, gas, water and waste services 1.0% 1.1%
Arts and recreation services 0.7% 1.4%
Mining 0.7% 1.7%
Total Employment 95,584 1,737,633 Source: ABS (2007).
Table G.2. Average Weekly Incomes by Industry, Darling Downs and Queensland, 2006
Industry Darling Downs SD
Queensland
Agriculture, forestry and fishing $599 $623
Retail trade $1,331 $1,550
Health care and social assistance $704 $832
Manufacturing $1,138 $1,181
Education and training $839 $932
Construction $724 $831
Public administration and safety $513 $532
Accommodation and food services $410 $471
Transport, postal and warehousing $780 $883
Other services $791 $923
Wholesale trade $886 $1,000
Professional, scientific and technical services $831 $892
Financial and insurance services $850 $1,028
Administrative and support services $558 $671
Rental, hiring and real estate services $936 $971
Information media and telecommunications $831 $838
Electricity, gas, water and waste services $730 $775
Arts and recreation services $536 $630
Mining $573 $648
Average All Industries $709 $799 Source: ABS (2007).

Economic Impact Assessment: Surat Gas Project Final Report
116
PAGE LEFT INTENTIONALLY BLANK

Economic Impact Assessment: Surat Gas Project Final Report
117
Appendix H: Cost Benefit Analysis Results This Appendix presents the findings of the cost benefit analysis (CBA) modelling undertaken for the Surat Gas Project.
Approach
The following CBA to assess the net impact of the Surat Gas Project has been conducted at the state level. All impacts resulting from the project were identified and compared to the counterfactual case (or ‘without project’ scenario) to present a net stream of benefits and costs.
For this project, the ‘without project’ scenario (i.e., Arrow Energy’s Surat Gas Project does not proceed) is as per the baseline scenario used for the CGE modelling (refer to Appendix C).
Each impact is converted into a monetary value (or proxy) and is assessed individually before being combined in the CBA model to calculate the net impact of the proposed development.
Key assumptions applied in the CBA include:
• Modelling has been undertaken between financial years ending June 2014 and June 2038 (25 years);
• A base discount rate of 15.0% has been used for demonstration purposes, with additional discount rates also examined (6%, 10% and 20%). As all values used in the CBA are in real terms, the discount rate does not incorporate inflation (i.e., it is a real discount rate, as opposed to a nominal discount rate); and
• All values are expressed in 2009-10 Australian dollars;
The methodology used in conducting the CBA is outlined in Appendix D.
Decision Criteria:
The Net Present Value (NPV) will be the primary decision criteria for the CBA. The NPV of a project expresses the difference between the present value (PV) of future benefits and PV of future costs, i.e.: NPV = PV (Benefits) – PV (Costs).
Where the CBA results in a:
• Positive NPV: the development of the Surat Gas Project will be deemed as being desirable.
• NPV equal to zero: the development of the Surat Gas Project will be deemed as being neutral (i.e., neither desirable nor undesirable).
• Negative NPV: the development of the Surat Gas Project will be deemed undesirable.
It is acknowledged that the CBA guidelines developed by the Queensland Government Department of Infrastructure and Planning (DIP, 2008c) identify that IO modelling results should not be included in a CBA for the following reasons:
1. Direct and indirect benefits outlined using IO modelling could also be generated through an alternative use of the resources;
2. In IO modelling, increased expenditure leads to increased outputs, and therefore benefits, while in CBA increased expenditure represents increased costs;
3. A project can have a positive economic impact on a small region (at the expense of other regions) but this represents a distributional effect and does not usually create an increase in economic welfare for the community, unless the project activates otherwise idle resources;
4. IO modelling assumes that a project can obtain unrestricted quantities of goods and labour without having any impact on market prices; and
Economic Impact Assessment: Surat Gas Project Final Report
118
5. GDP impacts are not a satisfactory measure of social welfare as it does not allow for the measurement of externalities, non-market goods and consumer surplus.
To overcome these pertinent issues, CBA modelling undertaken for this project has utilised CGE modelling results. CGE modelling results are considered appropriate for use in this project for the following reasons:
• Issue 1 is not pertinent for this assessment as, where the Surat Gas Project does not proceed, these resources will not be extracted and therefore will have no alternative use within the analysis period. As such, those direct and flow-on impacts generated by the project would not occur elsewhere if the Surat Gas Project does not proceed, and therefore should be incorporated in the CBA. The resources utilised in this project would be left otherwise idle where Surat Gas Project does not proceed;
• With regards to Issue 2, while it is agreed that additional expenditure represents a cost, it also represents a revenue stream for those businesses engaged by the proponent(s) to undertake the work, which is represented in IO modelling as an increase in final demand with an associated increase in value added activity. As such, including modelling results to represent the increase in final demand as a benefit is appropriate within a CBA framework where the costs to the proponent(s) and operating profile of the businesses engaged are also recognised;
• Issues 3 and 4, while pertinent to IO modelling, are overcome through the use of CGE modelling which accounts for constrained resources and reallocation of resources across regions; and
• With regards to Issue 5, externalities, non-market goods and consumer surplus are not represented by either IO or CGE modelling, and as such would need to be included in CBA modelling as additional cost and benefit items, with care taken to ensure no double counting of either benefits or costs. This has been undertaken and incorporated in the analysis where possible.
Identification of Impacts
This section provides a summary of the identified costs and benefits anticipated to result from the development of the Surat Gas Project that would not otherwise occur. These costs and benefits are discussed in more detail in chapter 5 of this report.
Costs
Costs associated with the Surat Gas Project include:
• Construction and rehabilitation expenditure by the proponent;
• Additional operating expenses across Queensland as a result of direct and flow-on activity, including:
o Operational expenditure by the proponent;
o Operating expenditure by businesses engaged by Arrow for the construction of the Surat Gas Project that would otherwise not occur;
o Operating expenditures of other businesses as a result of industrial support and consumption induced flow-on activity that would otherwise not occur;
• Value of foregone agricultural production as a result of uptake of land;
• Value of foregone production across the Queensland economy as a result of additional competition for, and reallocation of, constrained resources (e.g., labour);
• Reduced international demand for ‘trade exposed’ industries as a result of an appreciation in the Australian dollar;
• Lost incomes of employees as a result of foregone production outlined above. It should be recognised, however, that this is largely a reallocation of labour (and the source of their income) rather than an actual loss, and has a corresponding benefit in terms of additional incomes generated by these new activities (included below);
• Higher costs of operation for businesses across Queensland as a result of an increase in domestic gas prices (and electricity prices);

Economic Impact Assessment: Surat Gas Project Final Report
119
• Reduced consumptive capacity of households due to an increase in domestic gas prices (and electricity prices);
• Potential social amenity impacts from the development and operation of the Surat Gas Project such as noise, dust, travel times or safety; and
• Potential environmental impacts of the project, e.g., groundwater impacts, greenhouse gas emissions, or damage to any natural habitats within the development footprint.
Benefits
Benefits associated with the Surat Gas Project include:
• Direct and flow-on revenues generated across Queensland, including:
o Revenues to the proponent from exports of LNG;
o Revenues to those Queensland-based companies engaged by the proponent for the construction of the Surat Gas Project that would otherwise not occur;
o Revenues to those Queensland-based companies engaged by the proponent for the provision of goods and services during operation that would otherwise not occur;
o Revenues to other businesses as a result of industrial support and consumption induced flow-on activity that would otherwise not occur;
o Revenues accruing to local and state governments in Queensland, as well as the estimated redistribution of Australian Government revenues to Queensland10
• Additional wages and salaries paid to employees both directly and through flow-on activity that would otherwise not occur; and
. It should be recognised that the benefit of this revenue is not the revenue itself, but rather the utility provided to the community from increased government facilities and service provision (i.e., quantified by the redistribution of this revenue to the Queensland community through service provision and salaries paid);
• Economy-wide benefits in terms of increased consumptive capacity of households (i.e., disposable incomes) as a result of real wages growth, driven by increased competition for labour that would otherwise not occur.
In addition to the benefits identified above, a salvage value has been applied in the CBA following decommissioning of the gas fields.
Model Drivers
To simplify the modelling of the CBA and avoid a number of data limitations, the output from the CGE modelling are utilised to capture a number of the above identified impacts. As such, this analysis represents and provides an overall ‘net’ flow of benefits/ costs in the form of value added activity plus other effects as relevant.
Value added activity includes:
• Gross operating surplus (i.e., producer surplus);
• Compensation of employees (wages and salaries paid to employees); and
• Taxes less subsidies.
Value added activity is effectively equivalent to the revenues generated by an activity less the associated operating purchases and expenses such as input materials, wages and salaries and taxes paid. The impacts outlined above identify direct and flow-on revenues as well as wages and salaries as benefits of the project, and direct and flow-on operating expenses as costs. Subtracting the cost items from benefits provides estimates equivalent to value added activity.
10 Represented by the flow of social welfare benefits (i.e. services and funding) provided by the Commonwealth Government to all states, including Queensland.
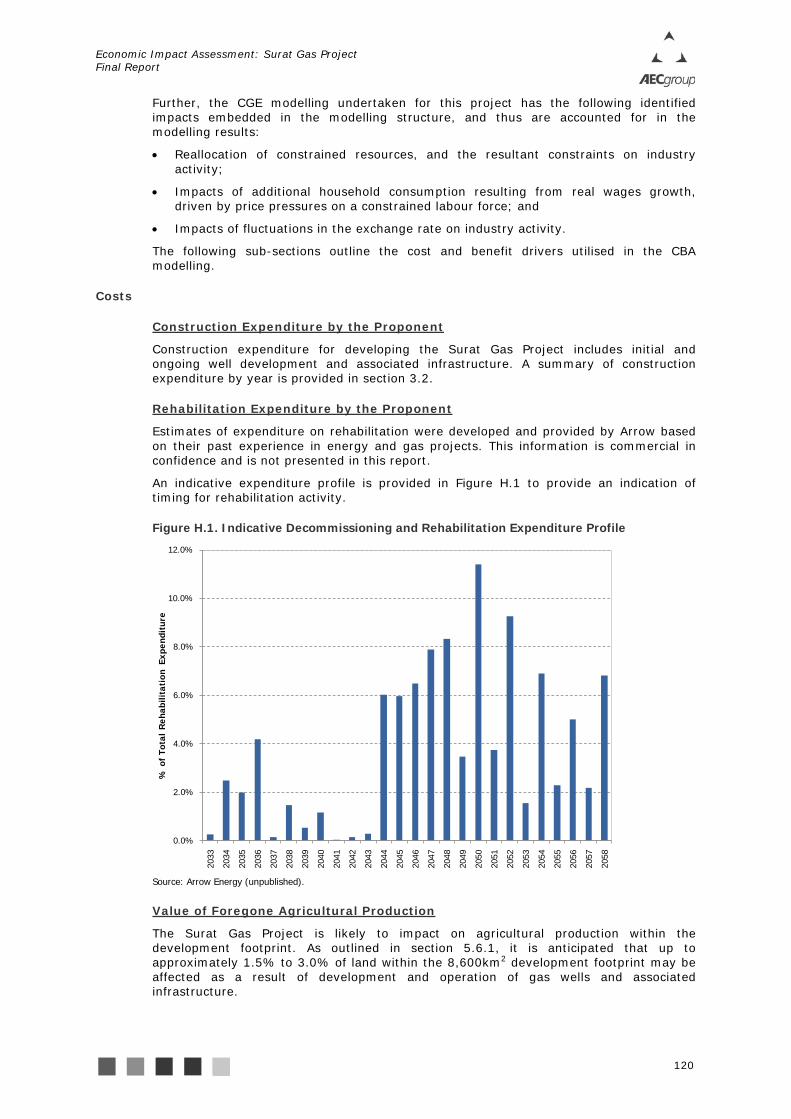
Economic Impact Assessment: Surat Gas Project Final Report
120
Further, the CGE modelling undertaken for this project has the following identified impacts embedded in the modelling structure, and thus are accounted for in the modelling results:
• Reallocation of constrained resources, and the resultant constraints on industry activity;
• Impacts of additional household consumption resulting from real wages growth, driven by price pressures on a constrained labour force; and
• Impacts of fluctuations in the exchange rate on industry activity.
The following sub-sections outline the cost and benefit drivers utilised in the CBA modelling.
Costs
Construction expenditure for developing the Surat Gas Project includes initial and ongoing well development and associated infrastructure. A summary of construction expenditure by year is provided in section
Construction Expenditure by the Proponent
3.2.
Estimates of expenditure on rehabilitation were developed and provided by Arrow based on their past experience in energy and gas projects. This information is commercial in confidence and is not presented in this report.
Rehabilitation Expenditure by the Proponent
An indicative expenditure profile is provided in Figure H.1 to provide an indication of timing for rehabilitation activity.
Figure H.1. Indicative Decommissioning and Rehabilitation Expenditure Profile
Source: Arrow Energy (unpublished).
The Surat Gas Project is likely to impact on agricultural production within the development footprint. As outlined in section
Value of Foregone Agricultural Production
5.6.1, it is anticipated that up to approximately 1.5% to 3.0% of land within the 8,600km2 development footprint may be affected as a result of development and operation of gas wells and associated infrastructure.
0.0%
2.0%
4.0%
6.0%
8.0%
10.0%
12.0%
2033
2034
2035
2036
2037
2038
2039
2040
2041
2042
2043
2044
2045
2046
2047
2048
2049
2050
2051
2052
2053
2054
2055
2056
2057
2058
% o
f To
tal
Reh
abili
tati
on E
xpen
ditu
re

Economic Impact Assessment: Surat Gas Project Final Report
121
Approximately two-thirds of land within the development footprint is classified as either good quality agricultural land (GQAL) or strategic cropping land (Gilbert and Sutherland, 2011). In consideration of mitigation strategies proposed, the base scenario for the CBA has examined a reduction in GQAL and strategic cropping land of 1.5% within the development footprint, with sensitivity analysis examining a range of between 0% and 4.5%.
The average value of production of GQAL and cropping lands in the Darling Downs in 2006-07 was approximately $1,225 per ha (ABS, 2008). Using this average value, an indicative estimate of the value of agricultural production disrupted (assuming diminished production in 1.5% of GQAL and strategic cropping lands) is approximately $10.6 million. In keeping with the precautionary principle this value has been applied in the base scenario of the CBA as foregone agricultural production on the basis that if the Surat Gas Project did not proceed this land would not be disturbed and would be fully available for agricultural production. Caution should be applied in interpreting this estimate, as it is unlikely that all production within disturbed areas would cease. As such, this estimate is considered particularly cautious as it will likely overestimate the potentially diminished productive capacity of the disturbed land.
As noted in section 3.1, well (and associated infrastructure) will be developed throughout the project life, with wells developed at a rate of approximately 400 wells per annum (to a total of 7,500 wells). The impact on agricultural production is assumed to increase to a peak of $10.6 million over time following this same rate11
All lands impacted by gas wells and associated infrastructure is expected to be rehabilitated to pre-CSG standard (i.e., return to 100% of current agricultural productive capacity) upon cessation of gas extraction. In the base case (1.5% of land disturbed) over the life of the project the impact to agricultural production in net present value terms is estimated to be $29.8 million (discount rate 15%).
.
Benefits
As outlined above, value added activity as estimated in the CGE modelling has been used to represent the net benefit arising from:
Net Value Added Activity in Queensland
• Benefits:
o Direct and flow-on revenues generated across Queensland;
o Additional consumptive capacity as a result of wages and salaries paid in Queensland, including growth in real wages;
• Costs:
o Additional operating expenses across Queensland as a result of direct and flow-on activity;
o Value of foregone production across the Queensland economy as a result of increased competition for, and reallocation of, constrained resources (e.g., labour, input materials);
o Reduced international demand (and, subsequently, production) for ‘trade exposed’ industries as a result of an appreciation in the Australian dollar;
o Higher costs of operation for businesses across Queensland as a result of an increase in domestic gas prices (and electricity prices);
o Reduced consumptive capacity of households due to an increase in domestic gas prices (and electricity prices); and
11 This value is a potential measure of the value of agricultural production affected by the project and does not in any way represent a value for compensation. The Petroleum and Gas (Production and Safety) Act 2004 (QLD) states that any compensation should consider: landowners time, impact on operations and amenity (e.g. disturbance, loss of profit/ productivity), change in value and/ or use of land and legal, valuation and accountant advice.

Economic Impact Assessment: Surat Gas Project Final Report
122
o Potential for lost incomes of employees as a result of foregone production outlined above (and thus a potential rationalisation of labour for those businesses encountering a reduction in demand for their goods and services).
CGE modelling has been undertaken through to 2027-28. Indicative estimates of value added activity have been developed through to 2037-38 based on gas production estimates over this period and average value added activity per PJ of gas between 2013-14 to 2027-28.
An indicative salvage value of 2.5% of total capital expenditure has been assumed, accruing in the final year of analysis (2038).
Salvage Value
Impacts That Have Not Been Quantified
The following potential costs of the Surat Gas Project have not been quantified for inclusion in the CBA:
• Potential social amenity impacts from the development and operation of the Surat Gas Project, such as noise, dust, travel times or safety; and
• Potential environmental impacts of the project, e.g., groundwater impacts, greenhouse gas emissions, or damage to any natural habitats within the development footprint.
CBA Results
Assuming a discount rate of 15.0%, the Net Present Value (NPV) of the Surat Gas Project to the Queensland economy is estimated at $1.66 billion (refer to Table H.1). As this assessment was undertaken utilising a ‘net’ position for many benefits and costs (through the use of value added activity), a benefit cost ratio has not been estimated. As can be seen, even at a real discount rate of 20% the Surat Gas Project is estimated to result in a net benefit to Queensland of $605.5 million.
Table H.1. Summary CBA Results of Surat Gas Project Impacts to Queensland
Real Discount Rate NPV ($M)
6.0% $6,400.6
10.0% $3,587.0
15.0% $1,655.4
20.0% $605.5 Source: AECgroup
Sensitivity Analysis
The sensitivity analysis has been undertaken using a Monte Carlo analysis (refer to Appendix D) across the following assumptions used in the CBA modelling (the base assumptions used are outlined in the ‘Model Drivers’ section of this Appendix):
• Construction expenditure by the proponent; • Value of foregone agricultural production; and • Net value added activity in Queensland.
These three model drivers represent the key variables influencing modelling results.
Each of the above assumptions has been tested in isolation with all other inputs held constant, with the results reported in Table H.2 in terms of the modelled change in NPV resulting from the variance in the base assumptions at a discount rate of 15%. The final row of Table H.2 examines each assumption simultaneously to provide a “combined” or overall sensitivity of the model findings to the assumptions used. Table H.2 also outlines the distribution used allowing for a 10% confidence interval, with the “5%” and “95%” representing a 90% probability that the distribution and NPV will be within the range outlined in the table.

Economic Impact Assessment: Surat Gas Project Final Report
123
Table H.2. Sensitivity Analysis Summary, Discount Rate 15%
Variable Distribution of Tested Variable (a)
Net Present Value ($ Million)
5% 95% 5% 95%
Construction Expenditure by the Proponent 116.4% 83.5% $922.5 $2,387.1
Value of Foregone Agricultural Production 3.21% 0.49% $1,621.4 $1,675.5
Net Value Added Activity in Queensland 83.6% 116.4% $644.4 $2,664.7
Combined As above As above $405.1 $2,871.8 Notes: (a) The percent distributions outlined in the table represent the deviation from the base assumptions for these variables using a +/- 5% confidence level. The percent distributions for construction expenditure and net value added activity are based on a percent deviation from the baseline values (where the baseline equals 100.0%), while the percent distributions for agricultural production are based on an average reduction in production of 1.5% in the baseline scenario, with a maximum reduction modelled in the sensitivity analysis of 4.5% and minimum reduction of 0.0%. Source: AECgroup.
The table shows that, at a discount rate of 15%, there is a 90% probability the Surat Gas Project will provide a NPV of between $405.1 million and $2.9 billion.
Conclusion
The CBA identifies that the Surat Gas Project is economically desirable for Queensland with the benefits outweighing the costs at discount rates of up to and above 20%. Sensitivity analysis shows there is a 90% probability of the project returning a NPV of between $405.1 million and $2.9 billion at a discount rate of 15%.

E [email protected] W www.aecgroupltd.com
Brisbane Level 5, 131 Leichhardt Street Spring Hill QLD 4000
PO Box 942 Spring Hill QLD 4004
T +61 7 3831 0577 F +61 7 3831 3899
Melbourne Level 13, 200 Queen Street Melbourne VIC 3000
GPO Box 4500 Melbourne VIC 3001
T +61 3 8648 6586 F +61 3 8648 6480
Sydney Level 3, 507 Kent Street Sydney NSW 2000
PO Box Q569, QVB Sydney NSW 1230
T +61 2 9283 8400 F +61 2 9264 9254
Townsville 233 Flinders Street East Townsville QLD 4810
PO Box 5804MC Townsville QLD 4810
T +61 7 4771 5550 F +61 7 4771 5152
Perth Level 18, Central Park 152 - 158 St Georges Terrace Perth WA 6000
T +61 8 9288 4456 F +61 8 9288 4457