Economic Impact Assessment - Berths 203 to 205 Expansion … … · ECONOMIC IMPACT ASSESSMENT FOR...
41
Economic Impact Assessment For the proposed deepening of berths 203, 204 and 205 of the Durban Container Terminal (DCT). Developed for Transnet Ports Authority by Urban-Econ (PTY) Ltd Year: 2012
Transcript of Economic Impact Assessment - Berths 203 to 205 Expansion … … · ECONOMIC IMPACT ASSESSMENT FOR...

ECONOMIC IMPACT ASSESSMENT FOR THE EXPANSION OF BERTHS 203, 204 AND 205 AT THE DURBAN CONTAINER TERMINAL
1
Economic
Impact
Assessment For the proposed deepening
of berths 203, 204 and 205
of the Durban Container
Terminal (DCT).
Developed for Transnet Ports Authority
by Urban-Econ (PTY) Ltd
Year: 2012

ECONOMIC IMPACT ASSESSMENT FOR THE EXPANSION OF BERTHS 203, 204 AND 205 AT THE DURBAN CONTAINER TERMINAL
2
Table of Contents Table of Acronyms and Definitions ............................................................................................... 3
Executive Summary ...................................................................................................................... 4
Section 1: Introduction ................................................................................................................. 7
1.1 Description of the Expansion ........................................................................................................ 7
1.2 Motivation for the Expansion ....................................................................................................... 8
1.3 Methodology ................................................................................................................................. 9
1.4 Structure of the Report ............................................................................................................... 10
Section 2: Current Trade and Container Shipping Trends ............................................................. 11
2.1 National Production and Trade Trends ....................................................................................... 11
2.2 Durban Port Container Trends .................................................................................................... 12
2.3 Berths 203-205 Container Trends ............................................................................................... 14
2.4 Global Containership Trends ....................................................................................................... 15
Section 3: Economic Impacts ...................................................................................................... 19
3.1 Input-Output Economic Model ................................................................................................... 19
3.2 CAPEX Impact Modelling ............................................................................................................. 19
3.3 OPEX Impact Modelling .............................................................................................................. 22
3.4 Berth Deepening Scenarios and Associated Impacts .................................................................. 25
3.5 Concluding Comments ................................................................................................................ 28
Section 4: Scoped Socio-Economic Impacts ................................................................................. 29
4.1 Subsistence Fishing (Includes Commercial and Recreational) .................................................... 29
4.2. Beach Tourism ............................................................................................................................ 31
4.3 Traffic .......................................................................................................................................... 33
Section 5: Integrated Impact Tables ............................................................................................ 35
Section 6: Conclusion ................................................................................................................. 40
6.1 Summary of Findings ................................................................................................................... 40
6.2 Recommendations ...................................................................................................................... 41

ECONOMIC IMPACT ASSESSMENT FOR THE EXPANSION OF BERTHS 203, 204 AND 205 AT THE DURBAN CONTAINER TERMINAL
3
Table of Acronyms and Definitions
GVA Gross Value Added. A measure of the value of goods and services produced in
an economy. In this report GVA is calculated using factor costs. It includes
remuneration and gross operating surplus.
TEU Twenty-foot equivalent unit. One TEU represents the cargo capacity of a
standard intermodal container, 20 feet (6.1 m) long and 8 feet (2.44 m) wide.
Deepsea A shipment coming from or going to an international port
Transhipped The shipment of goods or containers to an intermediate destination, and then
from there to yet another destination.
Coastwise From one domestic coastal port to another (e.g. Cape Town to Durban)
gt Gross tonnage measures a ships overall internal volume
LOA Length Overall is the maximum length of a vessel's hull measured parallel to the
waterline.
VLCS Very large container ship is a container vessel able to carry 8000 and more TEU
CRM data Customer Relationship Management data from Transnet
SAECS trades Southern Africa Europe Container Services
TNPA Transnet National Port Authority
TPT Transnet Port Terminals

ECONOMIC IMPACT ASSESSMENT FOR THE EXPANSION OF BERTHS 203, 204 AND 205 AT THE DURBAN CONTAINER TERMINAL
4
Executive Summary
1: Introduction
This report describes the Economic Impact of the proposed expansion of the Durban Container
Terminal at Durban Port. In particular, the expansion includes the deepening and widening of
berths 203 to 205 which will allow larger vessels to safely berth, thus increasing the overall
economic production gained from the terminal.
2: Current Trade and Container Shipping Trends
Productive industries (i.e. manufacturing, agriculture and mining) have shown recovery since the
2009 recession; hence exports and imports have recovered to 2008 levels and continue to show
strong growth (11%) placing increasing demand on the port. Volumes of containers handled have
increased by 7% on average annually, and also superseded 2008 levels in 2011. Evidence shows
continued growth in 2012. Berths 203-205 handle 37% of these containers and are therefore critical
to the port. It is therefore, evident that the volume of traffic at these berths is increasing.
Furthermore, regardless of demand for containers, ship sizes are increasing and will continue to do
so into the near future to a point where 3,000-6,000 TEU range ships are phased out and replaced
with medium and large sized vessels of 8,000-10,000TEUs. Currently, the terminal can only
accommodate ships up to 9,000TEUs (not fully laden) at high tide. If the expansion does not occur,
Durban Port will be unable to accommodate an increasing number of containerships and, thus,
regional competitiveness of KZN will be reduced. In the long term, this reduced competitiveness will
be significant and detrimental to trade in the province and will raise cost of exports by incurring an
additional feedering service to a port that can handle larger vessel sizes.
3: Economic Impacts
Economic impact refers to the effects on the level of economic activity in a given area as result of
some form of external intervention in the economy. The intervention can be in the form of new
investment in for example, transport facilities, social developments, housing, business development,
the establishment of a new or the expansion of existing production capacity. In this instance, it is the
expansion of the Durban Container Terminal.
3.1 CAPEX
The economic impact during the construction phase is shown for each of the three construction
options. The construction options are Caisson, Deck on Piles, and Sheet Piles (which has the highest
component of off-shore expenditure)1. For all options, only the local capital spend has been
modelled and all dredging costs have been excluded.
The temporary benefits of the construction process have been shown to include:
R3050m to R5494m in new business sales
R1083m to R1952m in Gross Value Added
R963m to R535m in income multipliers locally (KZN)
5 222 to 9 406 temporary work opportunities created through the port construction
process.
1 The share of off-shore capital spend associated with the purchase of sheetpile material and backs has been
excluded from the modelled data. Only the South African on-shore capture of spend is reflected.

ECONOMIC IMPACT ASSESSMENT FOR THE EXPANSION OF BERTHS 203, 204 AND 205 AT THE DURBAN CONTAINER TERMINAL
5
3.2 OPEX
The operational benefits of the expansion to year 2025 have been shown as follows:
Using the projections of TEU volumes from TNPA from 2012/13 – 2017/18 and a
medium term growth rate of 8% (post-recession growth) from 2017/18 – 2024/25, by
2025 TEU traffic projections on these berths reaches over 5 million TEU per annum. This
relates to spend of R27 088m first round and a further spend of R21 671 induced into
supporting services. Employment related to this traffic base is 21 506 persons.
3.3 Two further scenarios show:
3.3.1 The losses in benefits if the berths were only deepened but not lengthened by 170m were
shown to include:
a loss of direct spend of R16 653m, induced spend of R21 671m and port related
employment loss of 5 547 jobs and total employment loss of 13 221 jobs over the four years
of construction.
a loss of direct spend of R1 523m, induced spend of R2119m and port related employment
loss of 507 jobs and total employment loss of 1225 jobs over the operational seven years. If
the capacity for the Dig-Out Port comes on line, in accordance with the anticipated planning
horizon, by 2021 then this loss is reduced to: a loss in direct spend of R554m, a loss in
induced spend of R443m and port related employment loss of 185 jobs and total
employment loss of 446 jobs over the operational three year period between the end of
construction and the availability of initial capacity at the dig-out port.
3.3.2 The losses in benefits if the expansion does not occur at all were shown to include:
No loss of trade for the first 5 years, absolute loss of all CAPEX investment benefit.
This equates to a loss of handling capacity of 284 108 TEUS carried on vessels too large to be
berthed if the depth at berths 203 – 205 is not increased in the short term, until available
capacity at the dig-out port becomes available.
Which has a direct spend loss impact of R1961m, induced spend of R1569m, port related
employment loss of 852 jobs and total employment loss of 3530 over the period of 2016 –
2020.
4 Scoped Socio-economic Impacts
The impact on subsistence fishing, beach tourism, and traffic were flagged as part of the scoping
report and raised during public meetings by interested and affected parties.
4.1 Subsistence Fishing: There are approximately 4000 true subsistence fishers on the East Coast
of South Africa, but none of these are registered within eThekwini region according to Ezemvelo
Wildlife, who maintains the registry. Fishers in eThekwini comprise of small scale commercial and
recreational participants. This is, however, an important part of locals’ livelihoods and Durban’s
economy. Ecology studies show that there will be no long term impact on line-fish in the bay with
mitigation, and during construction there will be a displacement of 50% of the fish within the
turbidity plume only (within the bay). There will therefore be an impact on fishers within the bay
and slightly along the coast during construction; however, the exact impact is unknown. There is no

ECONOMIC IMPACT ASSESSMENT FOR THE EXPANSION OF BERTHS 203, 204 AND 205 AT THE DURBAN CONTAINER TERMINAL
6
associated impact on subsistence activities per se, as these fishers do not fall into this catchment
area.
4.2 Beach tourism: The economic value of the beach to Durban is R260 million for non-resident
tourists alone. This figure would be in the billions of rand per year if a resident spend was included.
The beach is considered the most important draw-card to Durban for tourists and residents. Any
impact on the beaches would be detrimental to Durban’s economy. Specialist studies have found,
however, that there will be no impact on the beaches or the quality of the water.
4.3 Traffic: Any increase in landed containers will result in an increase in trucks on eThekwini roads.
Currently there are 3000 trucks leaving the port in a day. However, planning for this additional
volume of road freight traffic on domestic roads adjacent the port precinct is mitigated by
eThekwini’s freight plan and TNPAs projects to increase road capacity, which has taken into account
projected growth in port traffic in line with Transnet’s projections. Furthermore, the economic
impact on increased truck business and related truck servicing and production industries will be
positive.
5 Recommendations
5.1. The results of the Economic Impact Assessment show that the economic benefits for
extending and deepening the berths at Pier 2 are significant and, therefore, warrant full
development to go ahead.
5.2. The benefits are equal across the three construction types in the operational phase and the
variation between the three options during construction phase is not significant enough to
warrant a preference.

ECONOMIC IMPACT ASSESSMENT FOR THE EXPANSION OF BERTHS 203, 204 AND 205 AT THE DURBAN CONTAINER TERMINAL
7
Section 1: Introduction This report describes the Economic Impact of the proposed expansion of the Durban Container
Terminal at Durban Port. In particular, the expansion includes the deepening and widening of
berths 203 to 205 which will allow larger vessels to safely berth, thus increasing the overall
economic production gained from the terminal.
1.1 Description of the Expansion The map below shows the location of the relevant berths within the port.
FIGURE 1 MAP SHOWING LOCATION OF BERTHS 203 TO 205
Source: Nemai Consulting (May 2012) ‘Deepening, Lengthening and Widening of Berth 203 to 205, Pier , Container
Terminal, Port of Durban, FINAL SCOPING REPORT’
The proposed upgrade would include the following activities:
1. The westward lengthening of Berth 205 by 170m; 2. The eastward lengthening of Berth 203 by 100m; 3. The seaward widening of Berths 203 to 205 by 50m; 4. The deepening of the berth channel, approach channel and vessel turning basin from the
current -12.8m CDP to -16.5m CDP; 5. Three technical options will be considered namely, the Deck on Pile option, Sheet Pile option
and the Caisson option. For the Caisson option, a trench will need to be excavated to -19m CDP;
6. The precasting of beams; storage of sheet piles or construction of caissons (for the Deck on Pile, Sheet Pile and Caisson option respectively) would take place at Bayhead Lot 10;
7. The offshore disposal of dredge material;

ECONOMIC IMPACT ASSESSMENT FOR THE EXPANSION OF BERTHS 203, 204 AND 205 AT THE DURBAN CONTAINER TERMINAL
8
8. The offshore sand winning for infill material; and 9. The installation of new Ship to Shore (STS) cranes and associated infrastructure.
1.2 Motivation for the Expansion Providing operating capacity ahead of the demand has become an essential element of managing
national logistics capability in a fast changing and competitive global economic environment.
Included in these commitments will be the necessity of providing major container capacity
enhancements along the highest demand logistics corridor in the country in the form of increasing
container handling capacity at the Port of Durban. The proposed expansion of the DCT offers this in
line with existing market provision of extensive logistics capabilities.
The Port of Durban is the gateway port in the South African ports system which plays an important
role in facilitating the import and export needs for much of South Africa. The existing Blockwork
Quay wall structure along Pier 2 Berth 203 to 205 was designed in the 1970s, to support dockside
cranes with a lifting capacity of 4 tonnes and a water depth of -12.8m Chart Datum Port (CDP). This
allowed for the safe berthing of vessels with a fully laden draft (vertical distance between the
waterline and the bottom of the hull) not greater than -11.8m CDP. At present the existing quay wall
structure is operated beyond its original design parameters. Recent studies have concluded that the
existing quay walls do not meet the minimum Eurocode 7 Safety Standards and that there is a risk of
potential quay wall failure2.
Current trends show the number of containers handled at the port increasing by 7% on average each
year over the previous decade (albeit with a recession in growth over 2008/9)3. In addition, vessel
sizes have increased since the original terminal was constructed and Berth 203 to 205 cannot
therefore safely accommodate fully laden new generation container vessels due to insufficient water
depth at these berths. At present these vessels enter and exit the Port partially laden and during the
high tide window. This is an unsafe operating condition and the risk exists that vessels could run
aground. Transnet National Ports Authority (TNPA) has proposed the deepening, lengthening and
widening of Berth 203 to 205 in order to improve the safety of the berths as well as to improve the
efficiency of the Port4.
Given the positive relationship between economic growth and trade, it is expected that the trade
resulting from the economic activity within the port system have a significant positive economic
impact on both the local regional economy as well as on the wider hinterland economies serviced by
the total system – and hence at a national level. The Port System is a hub of numerous and diverse
economic activities involving a range of economic actors. Once vessels call at port, or when cargo
passes through wharf side, the economic activity is energised in a myriad of areas. The economic
impact of improved efficiency at the port, therefore, will not be confined to the port alone but will
have a significant impact on the local economy as a whole. The value chain of a container terminal is
extensive, and the economic impact is, therefore, equally extensive. The next section describes the
methodology used to measure the extent of this impact.
2 Prestedge Retief Dresner Wijnberg (PRDW) (2011). Pre-Feasibility Study Report for the Proposed Berth Deepening of Berths 203 to 205 at DCT. PRDW Report No. 1079/0/003/REV01. 3 National Port Authority of South Africa container traffic recorded as per cargo due issues
4 Nemai Consulting (May 2012) ‘Deepening, Lengthening and Widening of Berth 203 to 205, Pier , Container
Terminal, Port of Durban, FINAL SCOPING REPORT’

ECONOMIC IMPACT ASSESSMENT FOR THE EXPANSION OF BERTHS 203, 204 AND 205 AT THE DURBAN CONTAINER TERMINAL
9
1.3 Methodology
The economic impact of the ports on their hinterlands and local economies is not measured in tons
of cargo, in TEUs (twenty foot equivalent unit) or in gross tonnage (gt) of vessels utilising the port,
rather, it is measured in terms of persons employed in port-related economic activity, and in cycles
of expenditure that originate in the port, and reverberate through the economy of the region.
Importantly, it examines the linkages that are forged between the maritime cluster and other
commercial and industrial groupings within the economy.
For instance, ships make use of marine infrastructure and marine services provided by the port
authority, they utilise a range of port terminals that are provided by Transnet and by a number of
private terminal operators, they require the ships’ husbandry services made available by ships’
agents, ship chandlers and bunker suppliers, their crews need transport services, medical services
and recreation, and they provide custom from time to time for local ship repairers, with their deep
and rich linkages into the steel fabrication, engineering, painting and outfitting industries. A much
broader array of economic activities surrounds the cargo handling and logistics process. Cargo is
handled physically in port terminals and by stevedores, it is distributed by road, rail and by pipeline,
its documentation, financing and on-carriage is facilitated by the employment-rich clearing &
forwarding industry, it requires storage in warehousing facilities, it is scrutinised by customs officials,
and its seamless progress to consignees and from suppliers is tracked by freight logistics
professionals5.
In order to calculate the economic impact of increased number of calls and containers handled at
berths 203-205, each of these ship services need to be taken into account. In this case, the spend of
an average call at pier 2 on each of these services was calculated in order to determine the injection
into the economy per call. Economic multipliers that calculate the increase in sales, income, gross
value added (production) and jobs generated per R1 spent are used to transfer the total call spend
into a measure of the impact on the economy. An average call at pier 2 handles 2300 TEUs
(one TEU represents the cargo capacity of a standard intermodal container) according to TPT, with a
calculated related spend impact of R12.3million through the local and regional economy. The
expansion of pier 2 will allow for this average call rate to increase, and hence the injection into the
economy will be able increase accordingly. This is referred to OPEX (operational expenditure)
economic modelling.
The economic impact of CAPEX (capital expenditure) is calculated by applying these multipliers to
the level of investment made by Transnet during the construction of the expansion. The direct and
indirect impacts of the OPEX and CAPEX make up the total economic impact of a given project, in
this case, the expansion of the Durban Container Terminal.
Once the operational and capital expenditure impact have been calculated, the socio-economic costs
can be incorporated. These impacts have been raised as part of the Scoping Report and as part of
the public participation process. Particular impacts flagged include the impact on subsistence
fishermen and recreational users of the port. The full set of socio-economic benefits and costs are
then assessed in table format. The diagram below outlines the steps in the methodology.
5 Urban-Econ, 2009, ‘South African Ports Sector Review’; developed for the National Ports Regulator of South
Africa.

ECONOMIC IMPACT ASSESSMENT FOR THE EXPANSION OF BERTHS 203, 204 AND 205 AT THE DURBAN CONTAINER TERMINAL
10
FIGURE 2 METHODOLOGY
Source: Urban-Econ 2012
1.4 Structure of the Report Given the above methodology, the structure of the report is as follows:
Section 1: Introduction
Section 2: Current Trade and Container Shipping Trends o This includes national trade trends, current container volumes being experienced at
the DCT and at pier 2 specifically, as well as, global trends in the size of container ships.
Section 3: Economic Impact o This includes the IO Modelling on CAPEX and OPEX as described in the methodology.
Section 4: Scoped Socio-Economic Impacts o This includes a brief description of the relevant socio-economic impacts as raised in
the scoping report and by various members of the public.
Section 5: Integrated Impact Table o This table provides a summary of all the social and economic impact considered as
part of this economic impact assessment.
Section 6: Conclusion o This includes the recommendations

ECONOMIC IMPACT ASSESSMENT FOR THE EXPANSION OF BERTHS 203, 204 AND 205 AT THE DURBAN CONTAINER TERMINAL
11
Section 2: Current Trade and Container Shipping Trends The following section describes the container shipping trends at Durban Port, at the relevant berths
(203-205) and internationally. It also describes current trade trends and how they relate to
production in South Africa and KZN. This allows us to understand the economic value of the industry
and the reasons for infrastructure development, given current growth trends.
2.1 National Production and Trade Trends The graph below describes export and import trends in South Africa for the previous 11 years. In
this time, imports and exports have grown by 12% and 11% respectively. Similarly, growth in
production measured using GVA (gross value added) has grown by 11% in this time. The trend lines
in the graph below show how both the primary and secondary sector correlate with the level of
imports and exports (trade). Trade and production rely on each other. The majority of this trade is
done through Durban Port and therefore, as production increases, so will demand for the port.
FIGURE 3 EXPORT TRENDS FOR SOUTH AFRICA, 2000 - 2011
Source: Quantec Dataset, 2011
The graph below shows trade trends for KwaZulu-Natal, of which the significant majority (over two-
thirds) is derived from activity eThekwini’s economy. KZN is slightly different to the rest of the
country in that its trade is generated primarily by the secondary sector (manufacturing) and to a
lesser by the primary sector (agriculture and mining). Since 2009, the manufacturing sector has
been showing good recovery, and thus, in 2011, exports and imports have reached 2008 levels once
again. This positive growth in GVA and trade indicates a growing demand for port infrastructure.
-
100 000
200 000
300 000
400 000
500 000
600 000
700 000
800 000
20
00
20
01
20
02
20
03
20
04
20
05
20
06
20
07
20
08
20
09
20
10
2 0
11
Ran
d M
illio
ns
Export Trends for South Africa
South Africa Primary sector
South Africa Secondary sector
South Africa Imports
South Africa Exports

ECONOMIC IMPACT ASSESSMENT FOR THE EXPANSION OF BERTHS 203, 204 AND 205 AT THE DURBAN CONTAINER TERMINAL
12
FIGURE 4 EXPORT TRENDS FOR KZN, 2000 -2011
Source: Quantec Dataset, 2011
2.2 Durban Port Container Trends The graph below gives the number of TEUs (one TEU represents the cargo capacity of a standard
intermodal container) that landed at Durban Port between 2003 and 2011. The trend shows that
the majority of containers are deepsea, and these deapsea incoming shipments have been growing
on average annually at 7.7% since 2003. Transhipped containers have grown at 6% on average
annually, although have reduced for the previous two years. The volume of coastwise containers is
significantly less than the other two categories and has experienced a negative growth rate of -7.9%
since 2003. Overall, the number of landed containers has grown at an average annual growth rate
of 7.2% over the period.
-
20 000
40 000
60 000
80 000
100 000
120 000
20
00
20
01
20
02
20
03
20
04
20
05
20
06
20
07
20
08
20
09
20
10
2 0
11
Ran
d M
illio
ns
Export Trends for KZN
Kwazulu-Natal Primary sector
Kwazulu-Natal Secondary sector
Kwazulu-Natal Imports
Kwazulu-Natal Exports

ECONOMIC IMPACT ASSESSMENT FOR THE EXPANSION OF BERTHS 203, 204 AND 205 AT THE DURBAN CONTAINER TERMINAL
13
FIGURE 5 CONTAINERS LANDED IN DURBAN, 2003 - 2011
Source: National Port Authority of South Africa
The graph below shows the number of containers (measured in TEUs) shipped from Durban Port.
The trend for container shipments is similar to that of containers landed at Durban Port. Deepsea
shipments make up the majority of all shipments, and have been growing at an average annual rate
of 6.7%. Transhipments have been growing at 8.4% and Coastwise shipments at 3.9%. Overall, the
number of shipped containers has grown at an average annual rate of 6.9% over the period.
FIGURE 6 CONTAINERS SHIPPED FROM DURBAN, 2003 - 2011
Source: National Port Authority of South Africa
The following table describes the volumes of containers handled at Durban Port across various
categories in 2011. The total number of TEUs handled in 2011 was 2 720 915. Due to the recovery
in the manufacturing sector and the KZN economy in general, volumes of containers shipped have
reached 2008 levels and both shipped and landed containers continue to grow. The proportion of
TEUs shipped versus landed in 2011 was exactly 50/50 and the proportion of TEUs that were full was
76%, and empty was 24%.
-
200 000
400 000
600 000
800 000
1 000 000
1 200 000
2003 2004 2005 2006 2007 2008 2009 2010 2011
6M
Un
its
(TEU
s)
Containers Landed in Durban Port, 2003-2011
DEEPSEA
COASTWISE
TRANSHIPPED
-
200 000
400 000
600 000
800 000
1 000 000
1 200 000
2003 2004 2005 2006 2007 2008 2009 2010 2011
6M
Un
its
(TEU
s)
Containers Shipped from Durban Port, 2003-2011
DEEPSEA
COASTWISE
TRANSHIPPED

ECONOMIC IMPACT ASSESSMENT FOR THE EXPANSION OF BERTHS 203, 204 AND 205 AT THE DURBAN CONTAINER TERMINAL
14
TABLE 1 DURBAN PORT STATISTICS EXPRESSED IN 6M UNITS (TEUS), 2011
FULL EMPTY TOTAL
LANDED:
DEEPSEA 1 004 104 103 229 1 107 333
COASTWISE 2 753 6 125 8 878
TRANSHIPPED 200 933 43 094 244 027
TOTAL LANDED 1 207 790 152 448 1 360 238
SHIPPED:
DEEPSEA 627 731 422 242 1 049 973
COASTWISE 13 457 12 814 26 271
TRANSHIPPED 217 725 48 708 266 433
TOTAL SHIPPED 858 913 483 764 1 342 677
GRAND TOTAL 2 066 703 636 212 2 720 915
Source: National Port Authority of South Africa
The following graph gives a comparison of the period January to May for 2010, 2011 and 2012. The
graph reflects that the positive trends described above are continuing thus far in 2012, with only the
number of transhipped containers reducing in 2012.
FIGURE 7 CONTAINERS HANDLED, Q1 2010, 2011, 2012
2.3 Berths 203-205 Container Trends 37% of all containers handled at the port are handled at berths 203-205 which indicates the
importance of these berths to the container handling capacity of the port. These berths are located
on pier two which is the only area that has direct access to rail (Gauteng bound). The graph below
shows that berth 205 handles 51% of all containers at pier 2, while berths 203 and 204 handle 25%
each.

ECONOMIC IMPACT ASSESSMENT FOR THE EXPANSION OF BERTHS 203, 204 AND 205 AT THE DURBAN CONTAINER TERMINAL
15
FIGURE 8 TEUS HANDLED AT PIER 2, BERTHS 203, 204 AND 205
Source: Transnet Ports Authority
While the existing profile of vessels berthing at berths 203-205 is described by the liner trade as
“feeder –sized”, with an average gross tonnage of a vessel at these berths is 26 000gt (gross tonnage
measures a ships overall internal volume) and the average length overall is 180m6 (length overall is
the maximum length of a vessel's hull measured parallel to the waterline). These berths do
accommodate large vessels up to 345m LOA and it is for this reason that the expansion has been
proposed. The expansion is particularly important if, as expected, the average vessel size is going to
increase significantly over the next 10 to 20 years – this is described in detail in the following section.
2.4 Global Containership Trends After a capacity increase of 7.9% in 2010, cellular containership capacity is expected to grow by 8.1%
in 2012 and 10.3% in 2013, based on BRS-Alphaliner projections, with net global fleet increases of
1.4m TEU in 2012 and 1.8m TEU in 2013. The table below shows the number of existing container
ships and their capacity (measured in TEUs), as well as the number of containerships on order. It is
clear in the table that the capacity growth is unevenly distributed, with ships over 4,000 TEU
representing 87%-90% of the total capacity delivered during these two years. Half of the expected
6 CRM data provided from Transnet National Port Authorities
-
50 000
100 000
150 000
200 000
250 000
300 000
203 204 205
TEU
s
Berths
TEUs Handled at Berths 203-205
TEUS Landed
TEUS Shipped
SUMMARY BOX: Trends in allied economic and port performance
Productive industries (i.e. manufacturing, agriculture and mining) have shown recovery since the 2009 recession; hence exports and imports have recovered to 2008 levels and continue to show strong growth (11%) placing increasing demand on the port.
Volumes of containers handled have increased by 7% on average annually, and also superseded 2008 levels in 2011. Evidence shows continued growth in 2012.
Berths 203-205 handle 37% of the entire ports containers and are therefore critical to the port.

ECONOMIC IMPACT ASSESSMENT FOR THE EXPANSION OF BERTHS 203, 204 AND 205 AT THE DURBAN CONTAINER TERMINAL
16
capacity to be delivered in 2012 involves ships above 10,000 TEU. This trend is likely to continue as
large fixed port costs and high fuel oil prices, hovering at $600-700 per tonne, actually encourage the
use of the largest possible units on long haul routes as they allow operators to spread prohibitively
high port and fuel oil costs over a larger number of containers. This gives an impetus to carriers
employing such ships, and put those without them at a disadvantage. Some carriers, notably
Evergreen, may return to the shipyards in 2012 to order larger ships for this reason.
TABLE 2 EXISTING ORDER BOOK AS AT DECEMBER 2011
Source: Barry Rogliano Salles Annual Review 2012
Most of these large ships are earmarked for deployment on the Far East-Europe route. As a
consequence, medium-size VLCS of 8,000-9,000 TEU displaced by 10,000+ TEU ships are increasingly
finding their way onto north-south trades (emerging markets such as Africa being affected in this
way). Furthermore, the 8.1% fleet growth expected for 2012 presents a serious challenge for the
industry, as the demand growth is expected to weaken to 6.5%, against almost 8% growth in 2011.
This imbalance is leading to a build-up of excess ships. The 3,000-6,000 TEU range is likely to be the
most affected. Many ships in this size range are expected to be displaced by larger ships, with no
ready market to fully absorb large chunks of this redundant tonnage7.
At present, a typical caller to DCT is approximately 36 000gt, with a typical capacity of 34 00 TEU, this
is derived from the CRM data provided from Transnet National Port Authorities. However, the
indications are clear that the global phenomenon of larger vessels is becoming a reality on the
southern trade, with local liner operators anticipating the downward cascading of larger vessels
currently on the Europe-Asia and Europe-North America routes. Industry insiders reflect that there
is a 5 – 10 year window until Durban can expect average callers to be sized 7 000-10 000 TEU, this he
sees as a cascade down from their Europe-Asia and Europe-North America trade fleets. It is
anticipated that the SAECS trades, which have purpose built vessels will be slower to change. As
markets continue to expand in Africa, there will be a need to use larger vessels. For this trade, it is
not anticipated that the liner trade will require carriers of 10 000 – 12 000 TEU category for the next
decade. Currently, DCT does handle callers at the 10 000 TEU threshold, however, these vessels are
not operating fully laden.
7 Barry Rogliano Salles Annual Review 2012

ECONOMIC IMPACT ASSESSMENT FOR THE EXPANSION OF BERTHS 203, 204 AND 205 AT THE DURBAN CONTAINER TERMINAL
17
Liner comment also reflected that if DCT doesn’t deepen sufficiently to meet new draught
requirements of larger vessels, then it is likely that the trade would consider in the medium term
calling at Coega and feedering cargo onto the Port of Durban. The impact of this is that there would
likely be higher cost passed onto the cargo owner per TEU and in addition, it could be anticipated
that given the close proximity (14hrs) by road, that container traffic could be redirected onto road
which would reduce absolute port caller numbers.
The cost per TEU of ship-time in port is an increasing function of ship size8. Figure 2 below shows
that as vessel size increases, average costs decrease (line) but total costs increase (histogram). As
mentioned, the average costs decrease due to the large fixed port and fuel costs making it
advantageous to increase ship capacity. The total costs increase with vessel size, however, because
turnaround times at the port increase. It is, therefore, vital that capacity at the DCT is increased to
match the increase in large vessels through infrastructure investment such as this berth expansion
project and the current increase in capacity of the crane configuration in the port which is seeing 30
staff being added to pier 2 alone. If this does not occur, it will become increasingly cost inefficient
for vessels to use Durban Port resulting in increased shipping prices for local importers and exporters
in particular.
FIGURE 9 INCREASE IN TOTAL COSTS (HISTOGRAM) AND DECREASE IN AVERAGE COSTS
(LINE) PER DAY AS A FUNCTION OF CONTAINERSHIP SIZE IN 1997
Source: Cariou and Haralambides (1999), Cariou (2000)
The following table describes the recorded average vessel and port turnaround time at pier 2 from
April to December 2011. It also shows the key performance indicator for each of these. The average
turnaround time for a container vessel calling at Pier 2 is 60 hours (2 and a half days)9, and the
8 Haralambides E. H., Benacchio M., Cariou P. (2002) Costs, Benefits and Pricing of Dedicated Container Terminals,
International Journal of Maritime Economics Vol. 4-1, March, pp. 21-34 9 If the vessel arrives 2 or 3 days earlier than the ETA given to the terminal then this time is not included in the calculation.
If there are transhipment connections which the Line needs to take place and the on-carrying vessel arrives before the pre-carrying vessel so cannot be worked then this time is also not included in the calculation.

ECONOMIC IMPACT ASSESSMENT FOR THE EXPANSION OF BERTHS 203, 204 AND 205 AT THE DURBAN CONTAINER TERMINAL
18
average port turnaround time is 141 hours (just less than 6 days). However, the key performance
indicator for both these is 40 hours (less than 2 days). It is vital for trade in South Africa that the
port is efficient. Efficiency will determine Durban Port’s ability to remain competitive as vessel sizes
and volumes increase.
TABLE 3 KEY PERFORMANCE INDICATORS FOR PIER 2, DCT
Indicator April May June July Aug Sept Oct Nov Dec Target
Vessel Turnaround Time
53.0 51.2 54.1 61.8 72.8 70.7 64.1 52.5 55.1 40 Hours
Port Turnaround Time
165.4 131.8 141.1 128.2 183.7 194.3 137.8 87.0 104.1 40 Hours
Source: Durban Container Terminals, DPC presentation, December 2011
Currently, the average call-size is 1,770 moves (using information from 1 April 2012 to-date). Several
cranes have been purchased by Transnet in order to increase the number of moves. The crane
configuration after January 2013 will be:
North Quay (Berths 203-205): 2 Liebherr twin lift cranes, 1 Impsa single lift carne and 7
ZPMC tandem lift cranes = 10
East Quay(Berths 200+202): 6 Noell single lift cranes
South Quay Berth (108/9): 4 Liebherr twin lift cranes
Pier 1(Berths 105+107): 6 Liebherr single lift cranes.
The 7 new tandem lift cranes will assist reduce handling inefficiencies, and support faster
turnaround times for vessels. This is anticipated to a 10% gain in efficiency, which will reduce vessel
turnaround times by 9 hours10.
10
TPT estimates, 201
SUMMARY BOX: Relevance of current container shipping trends to DCT
The consequence of these factors for the Durban Container Terminal is that, regardless of demand
for containers, ship sizes are increasing and will continue to do so into the near future to a point
where 3,000-6,000 teu range ships are phased out and replaced with medium and large sized
vessels of 8,000-10,000teus. Currently, the terminal can only accommodate ships up to 9,000teus
(not fully laden) at high tide. If the expansion does not occur, Durban Port will be unable to
accommodate an increasing number of containerships and, thus, regional competitiveness of KZN
will be reduced. In the long term, this reduced competitiveness will be significant and detrimental
to trade in the province and will raise cost of exports by incurring an additional feedering service,
at best, to a port that can handle larger vessel sizes and at worst, losing out on the trades to other
ports on the eastern sea-board of Africa that are undertaking these necessary in-situ upgrades.

ECONOMIC IMPACT ASSESSMENT FOR THE EXPANSION OF BERTHS 203, 204 AND 205 AT THE DURBAN CONTAINER TERMINAL
19
Section 3: Economic Impacts This section provides an initial quantification of the economic impact of the proposed expansion of
berths 203 – 205 at the DCT.
Economic impact refers to the effects on the level of economic activity in a given area as result of
some form of external intervention in the economy. The intervention can be in the form of new
investment in for example, transport facilities, social developments, housing, business development,
the establishment of a new or the expansion of existing production capacity. In this instance, it is the
expansion of the Durban Container Terminal.
3.1 Input-Output Economic Model In order to quantify the economic impact of the proposed expansion, an input/output model was
used. The model contains information on inter-sector relations, including tables that describe, for
each sector included in the model, the amount of input the sector requires from other sectors to
produce one unit of output. It is thus a set of equations describing the relationships that link the
output of one industry with all other industries in an economy.
These models are able to estimate impacts within each industry in the model and thereby provide
much more information than simple total economic impacts on income, output, and employment.
Using, for example, new investment or operational expense data, multipliers are calculated to
estimate different impacts of development investment and its ripple effects through the economy.
Measures of input also take into account imports and exports to and from the specific geographic
area.
Impact Measurement – Direct and Indirect: The economic impact in this regard is defined as effects
on the level of economic activity in South Africa and the benefit to the economy, such as the
generation of additional jobs, business sales, and/or disposable income. To quantify the most likely
economic impact of a new business or expansion of an existing activity into a specific area, two types
of economic impact can be measured, namely, direct and multiplicative impacts.
The direct economic effects are generated when the new business creates new jobs and purchase
additional goods and services to operate the new facility.
The multiplicative effects can be grouped into two distinct effects: indirect and induced.
The indirect economic effects occur when the suppliers of goods and services to the new business
experience larger markets and potential to expand. Induced impacts: The induced impacts are the
impacts on goods and services demanded due to increased expenditure by households from income
earned due at the project.
3.2 CAPEX Impact Modelling The economic impact during the construction phase is shown for each of the three construction
options. The construction options are Caisson, Deck on Piles, and Sheet Piles (which has the highest
ECONOMIC IMPACT ASSESSMENT FOR THE EXPANSION OF BERTHS 203, 204 AND 205 AT THE DURBAN CONTAINER TERMINAL
20
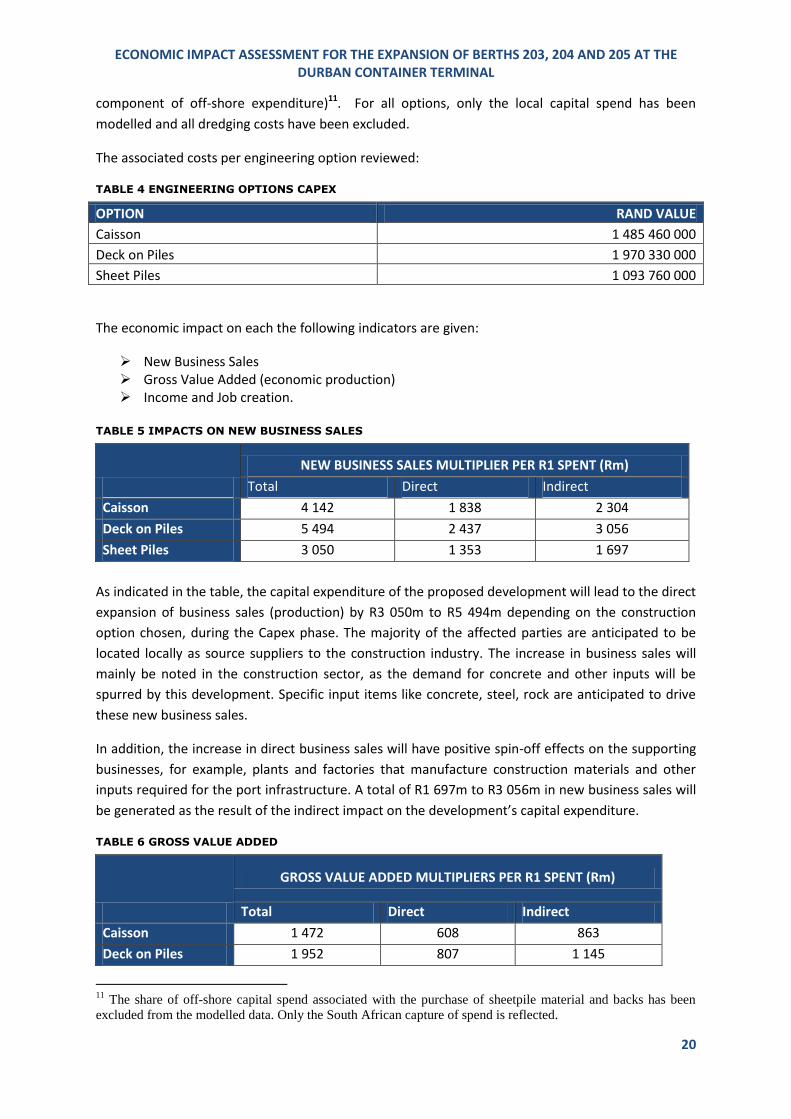
component of off-shore expenditure)11. For all options, only the local capital spend has been
modelled and all dredging costs have been excluded.
The associated costs per engineering option reviewed:
TABLE 4 ENGINEERING OPTIONS CAPEX
OPTION RAND VALUE
Caisson 1 485 460 000
Deck on Piles 1 970 330 000
Sheet Piles 1 093 760 000
The economic impact on each the following indicators are given:
New Business Sales Gross Value Added (economic production) Income and Job creation.
TABLE 5 IMPACTS ON NEW BUSINESS SALES
NEW BUSINESS SALES MULTIPLIER PER R1 SPENT (Rm)
Total Direct Indirect
Caisson 4 142 1 838 2 304
Deck on Piles 5 494 2 437 3 056
Sheet Piles 3 050 1 353 1 697
As indicated in the table, the capital expenditure of the proposed development will lead to the direct
expansion of business sales (production) by R3 050m to R5 494m depending on the construction
option chosen, during the Capex phase. The majority of the affected parties are anticipated to be
located locally as source suppliers to the construction industry. The increase in business sales will
mainly be noted in the construction sector, as the demand for concrete and other inputs will be
spurred by this development. Specific input items like concrete, steel, rock are anticipated to drive
these new business sales.
In addition, the increase in direct business sales will have positive spin-off effects on the supporting
businesses, for example, plants and factories that manufacture construction materials and other
inputs required for the port infrastructure. A total of R1 697m to R3 056m in new business sales will
be generated as the result of the indirect impact on the development’s capital expenditure.
TABLE 6 GROSS VALUE ADDED
GROSS VALUE ADDED MULTIPLIERS PER R1 SPENT (Rm)
Total Direct Indirect
Caisson 1 472 608 863
Deck on Piles 1 952 807 1 145
11
The share of off-shore capital spend associated with the purchase of sheetpile material and backs has been
excluded from the modelled data. Only the South African capture of spend is reflected.

ECONOMIC IMPACT ASSESSMENT FOR THE EXPANSION OF BERTHS 203, 204 AND 205 AT THE DURBAN CONTAINER TERMINAL
21
Sheet Piles 1 083 448 636
Gross Value Added reflects the rand values for the goods and services produced (less the cost of raw
materials and inputs). The measure provides the basis for determining impact on gross domestic
product – as it provides a mechanism to measure the additional output produced as a result of the
economic intervention of expanding DCT.
As reflected in the table above, GVA indicates a direct impact of R448m to R807m as a result of the
Capex spend on the Pier 2 expansion, and a further indirect/induced impact of R636m to R1145m. In
total this provides a GVA impact of R1 083m to R1 952m depending on which option is chosen.
TABLE 7 INCOME MULTIPLIERS
KZN Impact
INCOME MULTIPLIERS PER R1 SPENT (Rm)
Total Direct Indirect
Caisson 726 322 404
Deck on Piles 963 427 536
Sheet Piles 535 237 298
The income multipliers above reflect the KZN anticipated impact12. Additional income generated as
a result of the construction phase of the development is totalled at R 535m to R963m. The directly
attributed wage bill – for work both on site and for immediate first round impacts is estimated at
R237m to R427m. Many of these jobs are likely to be filled by local residents as the closest source of
labour, which will significantly increase the disposable income levels within the Durban area.
Additional income of R298m to R536m is likely to be generated through indirect mechanisms.
TABLE 8 TOTAL TEMPORARY EMPLOYMENT OPPORTUNITES DURING CONSTRUCTION PHASE
Total Temporary Job Opportunities
Total Direct Indirect
Caisson 7 091 3 991 3 100
Deck on Piles 9 406 5 294 4 112
Sheet Piles 5 222 2 939 2 283
Lastly, the number of temporary employment opportunities is provided. It is anticipated that 5 222
to 9 406 temporary job opportunities will be created depending on what option is chosen. Directly
related employment is likely to rise by 2 939 to 5 294 persons – and this impact is most likely to be
felt in the construction sector. In addition, 2 283 to 4 112 positions will be created through indirect
impact, and these are likely to be in the manufacturing and tertiary sectors.
Typically, employment is equated solely to the number of jobs generated, however in measuring the
impact of large scale capital projects such as the Pier 2 deepening additional considerations must be
included: the capital intensive nature, due to the engineering requirements, and the phasing in
distinct phases where part-time and/or contract workers are likely to be used must be considered in
the model, otherwise there is a potential to create a misleading assessment resulting in an
12
This figure has been derived using the KZN I-O model, and is provided as there is a higher level of certainty
with the regional impact than the national impact with regard to anticipated income changes at household level.

ECONOMIC IMPACT ASSESSMENT FOR THE EXPANSION OF BERTHS 203, 204 AND 205 AT THE DURBAN CONTAINER TERMINAL
22
exaggeration of economic impact. The model takes the nature of the development and the local
spend consideration into account in deriving the job opportunities.
In this model, employment impacts are measured in terms of the number of temporary jobs
generated over the capital construction period, these are referred to as temporary as the these
opportunities are likely to be taken up by equally over the phased development time frame.
Permanent employment opportunities are measured based on increased operational (OPEX) output,
and are described in the following section.
3.3 OPEX Impact Modelling A considered method for measuring the economic impact of the port at the operational impact
modelling level focuses on expenditure flows associated with additional port activity. To this end,
the operational impact has been modelled using a typical spend profile of a 2300 TEU container call
by an average sized 36 680 gt vessel13. The following assumptions about intermodal and destination:
an 85%/15% road/rail split of cargo distribution and 35%/65% split of container volumes across
Durban/non-Durban cargo owners14. To reduce the double count on the road split, the figures in the
table allows for short-haulage to a de-stuffing warehousing and re-parcelling of container goods.
This method takes a representative container vessel working 2300 TEU of container cargo by
traditional stevedoring services over a typical 4 day port visit15. A conservative view is taken of
expenditure flows, as these are limited to direct port-ancillary activities16, without considering
expenditure generated in the family of locally-based cargo owners (importers and exporters); and
expenditure flows are expressed initially in direct, first-round terms, without taking account of
multiplier effects. The port is consequently seen purely as a cargo-handling interface without regard
for the origins and destinations of cargo.
The typical spend profile per vessel is shown on below in table 7.
TABLE 9 PROFILE OF CONTAINER VESSEL SPENDING, EXCL CARGO DUES, CURRENT TRAFFIC AND
TARIFF LEVELS, 2012
Item/Service Expenditure R
% total
TNPA marine infrastructure & services 180 524 1.46
TPT Terminal charges 2 665 700 21.62
Stevedoring & Lashing/Securing 80 500 0.65
Ships Agency 4 840 0.04
Ship Chandlers 63 600 0.52
Clearing & Forwarding and Warehousing 1 235 850 10.02
Container depots, logistics etc 360 400 2.92
Road haulage 3 519 000 28.54
Rail charges 2 208 000 17.91
13
Based on TNPA CMR data for 2011 and year to date 2012. 14
Based on industry inputs from clearing and forwarding industry and haulier industry provided during June 2012. 15
Average turnaround time for a container vessel calling at Pier 1 or Pier 2 is around 62 hours with and average call-size of about 1,770 moves (TNPA: 22 June 2012) 16
It should be stressed that this relates solely to port-ancillary activities – that is, to economics activities that would not exist in the absence of a port of Durban – and do not include port-using cargo owners, however intimately many of these might be dependent upon the port.

ECONOMIC IMPACT ASSESSMENT FOR THE EXPANSION OF BERTHS 203, 204 AND 205 AT THE DURBAN CONTAINER TERMINAL
23
Ship repair services 106 400 0.86
Bunkers & fuel 1 861 798 15.10
Miscellaneous medical, crew transfers etc 44 000 0.36
TOTAL EXPENDITURE PER CALL PER VESSEL DIRECTLY RELATED SPEND
12 330 611
100
Source: Urban-Econ: Based on Industry Interviews, June 2012.
The table indicates a total direct spend of R12 330 611 per visit by container vessels, this includes
bunker (fuel) spend. This spend is then circulated through the multiplier effect to a range of indirect
and induced beneficiaries in supporting industries, promoting employment opportunities in allied
industries that support the port cluster, industries ranging from manufacturing through to business
services.
In order to present the impact of the port over the lifetime of the infrastructural asset base, the
spend profile impacts is shown for specific years of the operational phase of the expanded berths.
This shows a depth of linkages between port traffic levels and associated (port and petroleum) as
well as non-port industry.
The induced spends indicate the multiplier effect impact. Importantly, the traffic growth supports
broad employment opportunities.
The TEU figure is derived using the proposed TNPA model for the expansion plan, and the spend per
TEU is based on vessel spend for an average 2300 TEU container vessel.
Direct first round post cluster spend reflects spend to port related businesses.
Induced spend makes use of the transport sector multipliers
Total spend is the sum of direct and induced spend.
Port Related Petroleum Industry Employment was derived using a petroleum multiplier,
weighted for the percentage of bunker trade as a share of total sector
Wider economy employment examines the induced employment provided by the increase in
port traffic figures.
Total employment is the sum of all three employment categories.

ECONOMIC IMPACT ASSESSMENT FOR THE EXPANSION OF BERTHS 203, 204 AND 205 AT THE DURBAN CONTAINER TERMINAL
24
TABLE 10 SPEND PROFILE IMPACTS FOR PROJECTED NEXT 13 YEARS (2012/13 – 2024/25) FOR THE OPERATIONAL PHASE IF THE FULL DEEPENING IS
ACHIEVED17
Year TEU PROJECTIONS at PIER 2, BERTHS 203 - 205
First round port cluster spend (Rm)
Induced supporting services spend (Rm)
Total Port Cluster Employment
Port Related Petroleum Industry Employment
Wider Economy Employment
Total Employment
2012/13 1 977 010 10 599 8 479 19 078 3 530 214 4 670 8 415
2013/14 2 095 631 11 235 8 988 20 223 3 742 227 4 950 8 920
2014/15 2 244 411 12 033 9 626 21 659 4 008 243 5 302 9 553
2015/16 2 449 633 13 133 10 506 23 639 4 374 265 5 787 10 426
2016/17 2 622 929 14 062 11 250 25 311 4 684 284 6 196 11 164
2017/18 2 948 214 15 806 12 645 28 450 5 265 319 6 964 12 548
2018/19 3 184 071 17 070 13 656 30 726 5 686 345 7 522 13 552
2019/20 3 438 797 18 436 14 749 33 185 6 141 372 8 123 14 636
2020/21 3 713 901 19 911 15 929 35 839 6 632 402 8 773 15 807
2021/22 4 011 013 21 504 17 203 38 706 7 163 434 9 475 17 072
2022/23 4 331 894 23 224 18 579 41 803 7 736 469 10 233 18 438
2023/24 4 678 446 25 082 20 065 45 147 8 354 507 11 052 19 913
2024/25 5 052 721 27 088 21 671 48 759 9 023 547 11 936 21 506
17 TNPA projections provided to 2018. Urban-Econ projections (medium growth) scenario applied from 2018 – 2025.

ECONOMIC IMPACT ASSESSMENT FOR THE EXPANSION OF BERTHS 203, 204 AND 205 AT THE DURBAN CONTAINER TERMINAL
25
Using the projections of TEU volumes from TNPA from 2012/13 – 2017/18 the following is evident:
First round impact spend equates to R10 599m in the local economy, and a further induced spend of
R8 479m in 2012/13. This has an overall impact of employment of 8 415 persons. Using this growth
rate in TEU, by 2017/18 the traffic base in TEUs is estimated at just under 3m TEU, with an
equivalent impact of R28 450m (direct and induced spend) and an employment profile of 12 548
persons.
Using a medium term growth rate of 8% of (post recession growth), by 2025 TEU traffic projections
on these berths reaches over 5 million TEU per annum. This relates to spend of R27 088m first round
and a further spend of R21 671 induced into supporting services. Employment related to this traffic
base is 21 506 persons.
3.4 Berth Deepening Scenarios and Associated Impacts The following section relates this growth rate projected in 3.3 above to three scenarios of
development, and tests whether or not this economic activity will be able to be captured in the
regional economy as anticipated if the deepening of the nominated three berths does not occur as
per Transnet planning in this EIA submission.
Currently, Pier 2 is 914m in length. A standard large vessel caller to Pier 2 is 350m in length and a
typical feeder (smaller) vessel is 220m in length. Each large vessel requires 40m on either side in
order to safely berth – therefore each larger caller actually requires 430m. During construction it
will be necessary to decommission 1 berth and keep two berths operational at any time.
The three scenarios:
Full development takes place; Limited development, deepening but no extension to Pier 2 at berth 205 by the proposed
170m; and
No development takes place
These scenarios are detailed in the table, and take into account that there is a 4 year construction
period (mid 2013 to end 2017) anticipated for the deepening of berths 203, 204 and 205. In addition,
these scenarios take into account the anticipated Durban Dig-Out Port depth capacity becoming
available by 2020.

ECONOMIC IMPACT ASSESSMENT FOR THE EXPANSION OF BERTHS 203, 204 AND 205 AT THE DURBAN CONTAINER TERMINAL
26
Scenario De-Commissioning of Berth During Construction (mid 2013-2017) Impact
Post Construction (2018 onwards) Impact
Full development
No loss of handling facilities as single berth decommissioning can be accommodated during this period in other parts of the port.
No loss of handling anticipated.
No Extension to Berth 205
During construction it will be necessary to decommission 1 berth and keep two berths operational at any time. If we do not have expansion of 170m, and decommission one berth then there will be an effective quay side of 484m operational for the duration of the construction period (4 years). This means only one larger or one smaller vessel will be able to berth at any time. Effectively reducing the number of TEUs handled at Pier 2 during this period by a third (or 12% in the port of Durban as these berths handle 37%) of the total container traffic base. This equates to 3 106 159 lost TEUs. This equates to a loss of direct spend of R16 653m, induced spend of R21 671m and port related employment loss of 5 547 jobs and total employment loss of 13 221 jobs over the four years.
In the short term the port is in the process of recovery and is yet to reach the volumes and growth that was being experienced at the peak of 2008. Thus, in the short term it is unlikely that this will cause any loss in trade. However, in the long term the opportunity cost increases substantially if the port is unable to accommodate increasing volumes of large vessels servicing the Africa-Far East trade and the Africa-Near East trade. Specifically, if the rate of change of 3% on vessel size upwards is applied, a loss in TEU handling of 284 108 is anticipated from 2018 to 2020 (after which time, it is assumed that the Dig-Out Port will be operational). The loss in handling capacity is due to the effective inability to berth three larger vessels simultaneously at these berths. It is anticipated that due to the additional draught requirements of these larger vessels they will not be easily accommodated within the port. While it may appear a small number of containers however this equates to a loss of direct spend of R554m, induced spend of R443m and port related employment loss of 185 jobs and total employment loss of 446 jobs over the three years before the Dig-Out Port comes on line. This rate of change in vessel size will grow more rapidly after 2025 and losses incurred due to the lack of extension could result in zero rate of traffic growth to the terminal before the full capacity of the proposed dig-out port is available.
No During this recovery period (continuing through construction Significant loss of TEU traffic (1 019 460 TEU) is anticipated from 2016

ECONOMIC IMPACT ASSESSMENT FOR THE EXPANSION OF BERTHS 203, 204 AND 205 AT THE DURBAN CONTAINER TERMINAL
27
development takes place
phase) this will not cause any loss in trade. The anticipated shift towards larger vessels is to occur in a five year time frame, at a changeover rate of 3% per annum on the Southern trades, therefore, no direct impact anticipated during construction on the loss of handling within the Port of Durban. However, and absolute loss off all anticipated impacts derived from the CAPEX phase occurs, this equates to a loss of:
R3050m to R5494m in new business sales
R1083m to R1952m in Gross Value Added
R963m to R535m in income multipliers locally (KZN)
5 222 to 9 406 temporary work opportunities created
through the port construction process.
to 2025 if the deepening of the berths is not undertaken. This ten year period reflects the anticipated short term transition to larger vessel stock in the Southern trades. This equates to a loss of handling capacity of 284 108 TEUS carried on vessels to large to be berthed if the depth at berths 203 – 205 is not increased in the short term, until available capacity at the dig-out port becomes available. Which has a direct spend loss impact of R1961m, induced spend of R1569m, port related employment loss of 852 jobs and total employment loss of 3530 over the period of 2016 – 2020.
NO DEVELOPMENT SCENARIO - LOSS DUE CHANGE IN VESSEL SIZE DURING OPERATIONAL PHASE ONLY
Year
TEU projections at Pier 2, Berths
203-205
First round port cluster spend (Rm)
Induced supporting
services spend (Rm)
Total (Rm) Port Cluster
Employment ( no of jobs)
Port Related Petroleum Industry
Employment (no of jobs)
Wider Economy
Employment (no of jobs)
Total Employment (no of jobs)
2016/17 78,688 422 337 759 141 9 186 335
2017/18 88,446 474 379 854 158 10 209 376
2018/19 95,522 512 410 922 171 10 226 407
2019/20 103,164 553 442 996 184 11 244 439
2020/21 111,417 597 478 1,075 199 12 263 474
2021/22 120,330 645 516 1,161 215 13 284 512
2022/23 129,957 697 557 1,254 232 14 307 553
2023/24 140,353 752 602 1,354 251 15 332 597
2024/25 151,582 813 650 1,463 271 16 358 645
TOTAL LOSS (NO DEV)
1,019,460 5,465 4,372 9,838 1,820 110 2,408 4,339

ECONOMIC IMPACT ASSESSMENT FOR THE EXPANSION OF BERTHS 203, 204 AND 205 AT THE DURBAN CONTAINER TERMINAL
28
3.5 Concluding Comments 1. The temporary benefits of the construction process have been shown to include:
R3050m to R5494m in new business sales
R1083m to R1952m in Gross Value Added
R963m to R535m in income multipliers locally (KZN)
5 222 to 9 406 temporary work opportunities created through the port construction
process.
2. The operational benefits of the expansion to year 2025 have been shown as follows:
Using the projections of TEU volumes from TNPA from 2012/13 – 2017/18 and a
medium term growth rate of 8% (post-recession growth) from 2017/18 – 2024/25, by
2025 TEU traffic projections on these berths reaches over 5 million TEU per annum. This
relates to spend of R27 088m first round and a further spend of R21 671 induced into
supporting services. Employment related to this traffic base is 21 506 persons.
3. The losses in benefits if the berths were only deepened but not lengthened by 170m were
shown to include:
a loss of direct spend of R16 653m, induced spend of R21 671m and port related
employment loss of 5 547 jobs and total employment loss of 13 221 jobs over the four
years of construction.
a loss of direct spend of R1 523m, induced spend of R2119m and port related
employment loss of 507 jobs and total employment loss of 1225 jobs over the
operational seven years. If the capacity for the Dig-Out Port comes on line, in
accordance with the anticipated planning horizon, by 2021 then this loss is reduced to: a
loss in direct spend of R554m, a loss in induced spend of R443m and port related
employment loss of 185 jobs and total employment loss of 446 jobs over the operational
three year period between the end of construction and the availability of initial capacity
at the dig-out port.
4. The losses in benefits if the expansion does not occur at all were shown to include:
No loss of trade for the first 5 years, absolute loss of all CAPEX investment benefit.
This equates to a loss of handling capacity of 284 108 TEUS carried on vessels too large to be berthed if the depth at berths 203 – 205 is not increased in the short term, until available capacity at the dig-out port becomes available.
Which has a direct spend loss impact of R1961m, induced spend of R1569m, port related employment loss of 852 jobs and total employment loss of 3530 over the period of 2016 – 2020.

ECONOMIC IMPACT ASSESSMENT FOR THE EXPANSION OF BERTHS 203, 204 AND 205 AT THE DURBAN CONTAINER TERMINAL
29
Section 4: Scoped Socio-Economic Impacts The impact on subsistence fishing, beach tourism, and traffic were flagged as part of the scoping
report and raised during public meetings by interested and affected parties. Each of these is
discussed in the following sections.
4.1 Subsistence Fishing (Includes Commercial and Recreational) An organisation called the KZN Subsistence Fisherman Forum has raised concern that the DCT
expansion is going to impact on their livelihoods. Eleven fishermen from the forum came forward,
however, it is uncertain how many subsistence fishermen are utilising the port; as Ezemvelo Wildlife
stated that there are no registered subsistence fishermen formally recorded on their register for the
eThekwini area. The closest registered and recognised subsistence fisher groups are located in
Umgababa (south coast) and Nonoti (north coast). Furthermore, officially, there is no port access
allowed to fishermen by the TNPA. Regardless, it seems that subsistence fishing is occurring within
the port and along the coast north and south of the port and there is a possibility that this may be
impacted by the expansion and deepening of berths 203-205. There is also a possibility that the
impact on the Durban port estuary habitat will affect fish populations along the east coast which
might also affect commercial and recreational fishers.
4.1.1 An overview of subsistence fishing in KZN and Durban Bay
True subsistence fishing is not a chosen activity but one carried out to obtain the basics for survival
when there are no alternatives. It can produce extra resources, which occasionally may be sold or
bartered, but the basic aim is not to sell the resources. The following description of subsistence
fishing is provided by Ezemvelo KZN Wildlife’s Craig Mulqueeny18.
Many communities in KZN have been formally identified, by Ezemvelo and MCM, as containing true
“subsistence fishers” and most of these have been formalized with permits issued and the fishing
monitored. No subsistence fishing licenses have been issued to fishermen within eThekwini’s
borders. According to Ezemvelo, in almost all cases identified so far, there has been a drastic decline
over the last few years in the numbers of people carrying out subsistence fishing. This is usually
ascribed to the advent of and improvement in social grants which now supply most of the poorest
people in the province with much of their basic needs. In 2011 approximately 6% of all shore anglers
in KZN could be considered true subsistence fishers (this translates to approximately 4 000 people)19.
Most of the difficulties with subsistence fishing have arisen where there is a blending of true
subsistence fishing and commercial interests. Where people really were trying to obtain their basic
needs these have now mostly been made available through the grants. There are serious challenges
due to the sale of resources collected under the “umbrella” of subsistence fishing as many of the
resources may not legally be sold and the resources cannot sustain increased use levels. If any
dispensation was to be made for these fishers then it could not be for “subsistence fishing” but for
a commercial enterprise20.
18
http://sancor.nrf.ac.za/newsletters/past-issues/issue-188/the-exclusion-of-subsistence-fishers-from-public-spaces-in-durban 19
Dunlop SW (2011) An assessment of the shore-based and off-shore boat linefishers of KwaZulu-Natal, South Africa, Unpublished thesis of UKZN 20
Ezemvelo KZN Wildlife, Craig MulQueeny, Sancor Newsletter

ECONOMIC IMPACT ASSESSMENT FOR THE EXPANSION OF BERTHS 203, 204 AND 205 AT THE DURBAN CONTAINER TERMINAL
30
4.1.2 Recreational and Commercial Fishing in KZN
According to research conducted by ORI over 2010/2011 there are approximately 70 000 shore
fishers in KZN and this number has remained fairly constant over the previous 10 to 15 years. They
all operate under recreational licenses. It is estimated that the total recreational shore catch per
annum in KZN is 250 tons. At R40 per ton this equates to R10 million per annum (Dunlop 2011)21.
However, due the recreational nature of this fishing, it is not expected that all of this catch is sold
(perhaps 50%). It should be noted that the value of recreational fishing due to tourism and retail
spend is significant. CIC International estimate that 30% of commercial catch is estuary-dependent
and that of this, 13% is attributable to the Durban Bay. This equates to R390 000.
Many anglers fish on the Durban beachfront throughout the year. It is a renowned venue for
recreational anglers from all the provinces of South Africa and overseas and good catches can still be
made from the beaches and piers. Monitoring shows that the most common species
caught, accounting for well over half the fish, is shad. Shad are a ‘recreational” list species which
may not be sold in KZN. Many thousands of visitors come to KZN annually to fish along the shore and
shad are the greatest drawcard. This industry is of immense importance to the economy of the
province and each shad caught effectively brings in much more revenue than would be obtained
from catching and selling the fish. Any marked reduction in shad abundance would undoubtedly
impact negatively on tourism22.
There are 52 commercial line boat rights available in KZN but only approximately 42 commercial line
boats currently operating on the KZN coast. It is estimated that 1487 metric tonnes of fish is caught
per annum by commercial line boats. Of this 457 tonnes is recreational, 245 by charter boats, and
785 is for commercial fishing (Dunlop 2011). The value of the total catch is approximately R60
million, and the value of the commercial catch alone is R31,4 million. It should be noted that the
value of recreational fishing due to tourism and retail spend is significant. CIC International estimate
that 45% of commercial catch is estuary-dependent and that of this, 13% is attributable to the
Durban Bay. This equates to R2 million.
4.1.3 Impact of the widening and extending of berths 203-205 on fishers in KZN
Based the above assessment we can conclude that there is little to no ‘true’ subsistence fishing in
the Durban area (albeit some in KZN) but that there is substantial commercial and recreational
fishing occurring. The proposed expansion could impact the line-fish population and bait harvests in
Durban Bay which would both have a negative impact on fishermen in the area and the economic
value of tourism to Durban. Furthermore, according to the CIC International Environmental
Resource Evaluation study all estuaries along the east coast form a metacommunitiy which relies on
each other to absorb shocks and provide breeding areas for fish. Therefore, any impact on the
Durban bay with impact proportionally (13%) on this East Coast metacommunity23. For these
reasons it is important to understand the impact that the widening and extending of berths 203-205
will have on line fish.
21
Dunlop SW (2011) An assessment of the shore-based and off-shore boat linefishers of KwaZulu-Natal, South Africa, Unpublished thesis of UKZN 22
Ezemvelo KZN Wildlife, Craig MulQueeny, Sancor Newsletter 23
CIC International (2007) Environmental Resource Economic Evaluation for Durban Bay

ECONOMIC IMPACT ASSESSMENT FOR THE EXPANSION OF BERTHS 203, 204 AND 205 AT THE DURBAN CONTAINER TERMINAL
31
According to the Estuarine Biodiversity Study conducted for this EIA, the central sand bank which will
be affected by the proposed project is particularly prevalent with high densities of sand prawn
Callianasa kraussi, higher than for most of the other sand banks in the Port (Newman et al. 2008).
These crustaceans are a very important food source for fish. Any destruction of the sandbank will
have a proportional impact on the fish in the estuary and therefore on the catch in the estuary and
along the coast. Furthermore, disturbance and/or displacement of linefish as a result of the
dredging operations is also considered likely. These effects may be reduced only by strict adherence
to a suite of proposed mitigation measures that include refilling/backfilling and enlarging of the
Centre Bank sand flat in addition to strict operating rules pertaining to dredging such that the extent
of any turbidity plumes are minimised and do not exceed specified threshold levels24.
Post construction, if mitigation measures are adopted in full and recreation of the habitat lost is
successful (specifically the offset created needs to fulfil the same function as the sand bank lost and
sand prawn in particular need to migrate effectively) then the resulting impact on line-fish will be
positive25. However, during construction, the disturbance created by dredging and other
construction will cause 50% of the linefish to be displaced within the extent of the dredge plume.
The impact on fishers within the bay will be medium to high during this time; however, the impact
outside of the plume extent is seen to be zero (Anchor Environmental).
4.2. Beach Tourism Interested and affected parties noted concern that there will be an impact on water quality and
wave size (turbidity and bed shear stress levels) which would affect prime beach areas at Ushaka and
Bluff. These beaches are used for various tourism activities and act as the major draw-card for
domestic tourism especially in Durban. Durban’s tourism industry provides an income for thousands
of people and contributes 4.8% to the city’s GVA. Any negative impact on the beaches would cause
a large knock-on effect in the economy of the city. The following sub-section discusses the value of
the beaches in Durban, to Durban’s economy.
EThekwini’s share of the national total tourism spend has increased from 5.7% in 2006 to 8.5% in
2011. Total tourism spend in 2011 for eThekwini was R14,647 million, this is up by 323 million from
2010 (current prices). In 2011, tourism contributed 4.8% to eThekwini’s GDP. This has declined by
0.5% since 2006. The total number of trips in eThekwini in 2011 was 2,751,342 trips. The number of
trips has decreased by 2.2% on average annually for the previous 5 years. The most severe decrease
in trips was in 2011 (-7.7%). The following graph shows that 69% of trips in 2011 in eThekwini were
visiting friends and relatives, leisure trips were 16%, while the contribution of business trips was 9%.
The only purpose that has shown growth over the previous 5 years has been leisure trips (1.5%).
24 Estuarine biodiversity specialist study for an eia for deepening, lengthening and widening of berth 203 to
205, pier 2, container terminal, in the port of Durban by Anchor Environmental 25 Estuarine biodiversity specialist study for an eia for deepening, lengthening and widening of berth 203 to
205, pier 2, container terminal, in the port of Durban by CSIR

ECONOMIC IMPACT ASSESSMENT FOR THE EXPANSION OF BERTHS 203, 204 AND 205 AT THE DURBAN CONTAINER TERMINAL
32
FIGURE 10: SPLIT OF PURPOSE OF VISIT TO ETHEKWINI, 2011
Source: Global Insight Regional Dataset, eThekwini Economic Review 2010/2011 (2012)
While the number of domestic trips to eThekwini has decreased over the previous 5 years, the
number of bednights has increased by 2.4% on average annually, which means that while domestic
tourists are making fewer trips, they are staying for longer when they do come. The number of
bednights did also decline in 2011, however (by 1%). The number of bednights spent in eThekwini in
2011 by domestic tourists was 14,633,403 and the number spent by international tourists was
2,635,884. This is an 85% to 15% split.
The figure below describes what the public feels are the greatest draw cards to Durban with regard
to tourism. Over 60% of all respondents said that the beachfront was the major factor drawing
people to Durban – this provides an indication of the value of the beach to Durban tourism.
FIGURE 11: THE IMPORTANCE OF THE BEACH IN DRAWING PEOPLE TO DURBAN
Source: Survey conducted as part of the uShaka Marine World Impact Assessment, 2012
Leisure / Holiday
16% Business 9%
Visits to friends and relatives
69%
Other (Medical, Religious, etc)
6%

ECONOMIC IMPACT ASSESSMENT FOR THE EXPANSION OF BERTHS 203, 204 AND 205 AT THE DURBAN CONTAINER TERMINAL
33
According to TKZN, approximately 44% of foreign tourists visit the beach during their stay and 58%
of domestic tourists visit the beach during their stay. This equates to approximately 181 588
foreigner trips that include a trip to the beach in a year and 1 356 411 domestic trips that include a
trip to the beach. If each foreigner spends R300 at the beach on their stay and each domestic tourist
spends R150 then the total value of the beach re tourism is R260 million approximately in one year.
This excludes spend by local day visitors, therefore, the total value would be far higher. Any impact
on the beaches would cut into this very large amount of money that is generated yearly through
beach tourism and local day visits.
The proposed works require dredging and dumping operations to be performed both inside and
outside the Port of Durban. The impact of localized bathymetric changes and resulting wave patterns
on beach stability has been assessed. Interaction between the following processes has been
assessed:
Water level variation due to tides Flow patterns within the port Wind and waves
The results of the study indicate that there will be no significant negative impacts during or after
completion of the works, either to the main sandbank within the Port or to the beaches and
coastline outside the Port, compared to the status quo26.
4.3 Traffic The Berth Deepening project is not a capacity increase project but addresses safety. However, this
project will also improve the water side (berth) efficiency; therefore, there will be an increase in the
number of containers handled at the berths and an increase in frequency of containers being
transported out of the container terminal. The result of this will be an increase in trucks. The
following table describes the number of trucks associated with the expected increase in TEUs
handled at pier 2 until the new dig-out port operation. This equates to increase of 182 trucks per
day in the first year and increases thereafter. These figures correlate with a study by ARUP in 2010
in which traffic count loops were laid on Langerburg Road for INBOUND Traffic Only. It was
calculated that on average there were 2700 trucks going into DCT on a daily basis in 201027.
Year TEUs Handled Number of Trucks Number of Trucks per Day
2012/13 1 977 010 1 109 103 3 039
2013/14 2 095 631 1 175 649 3 221
2014/15 2 244 411 1 259 115 3 450
2015/16 2 449 633 1 374 244 3 765
2016/17 2 622 929 1 471 463 4 031
2017/18 2 948 214 1 653 948 4 531
2018/19 3 184 071 1 786 264 4 894
Source: Urban-Econ estimates based on TNPA container projections
26
ZAA 1370-RPT-004 27 Mohamed Kajee, Traffic and Transport Engineer, Transport Planning, Arup

ECONOMIC IMPACT ASSESSMENT FOR THE EXPANSION OF BERTHS 203, 204 AND 205 AT THE DURBAN CONTAINER TERMINAL
34
However, because the existing landside stacks do not operate to their full design capacity, the
increase in capacity created by this project will be absorbed into the existing design capacity
shortfall. This means that, while there will be an increase in traffic, the original roads would have
been designed to accommodate the design capacity of the terminal.
Furthermore, Transnet will shortly be appointing consultants to undertake detailed designs and
environmental authorisation to upgrade the existing road network of Bayhead Road and Langeberge
road and also look at a proposed link road between the Port and the proposed eThekwini Freight
Corridor. These proposed projects have already been approved by TNPA and are scheduled for
completion by the time the Berth Deepening and other proposed developments are commissioned.
This will improve efficiency and safety of moving containers beyond current capacity.
It should be noted that these increased volumes in trucks are anticipated to have a positive knock-on
for new business opportunities in allied services like: insurance and financial services, automotive
maintenance, production of trucks and spares and other induced opportunities.

ECONOMIC IMPACT ASSESSMENT FOR THE EXPANSION OF BERTHS 203, 204 AND 205 AT THE DURBAN CONTAINER TERMINAL
35
Section 5: Integrated Impact Tables Nature (/Status)
The project could have a positive, negative or neutral impact on the environment.
Extent
Local - extend to the site and its immediate surroundings.
Regional - impact on the region but within the province.
National - impact on an interprovincial scale.
International - impact outside of South Africa.
Magnitude
Degree to which impact may cause irreplaceable loss of resources.
Low - natural and social functions and processes are not affected or minimally affected.
Medium - affected environment is notably altered; natural and social functions and processes
continue albeit in a modified way.
High - natural or social functions or processes could be substantially affected or altered to the
extent that they could temporarily or permanently cease.
Duration
Short term - 0-5 years.
Medium term - 5-11 years.
Long term - impact ceases after the operational life cycle of the activity either because of natural
processes or by human intervention.
Permanent - mitigation either by natural process or by human intervention will not occur in such
a way or in such a time span that the impact can be considered transient.

ECONOMIC IMPACT ASSESSMENT FOR THE EXPANSION OF BERTHS 203, 204 AND 205 AT THE DURBAN CONTAINER TERMINAL
36
Probability
Almost certain - the event is expected to occur in most circumstances.
Likely - the event will probably occur in most circumstances.
Moderate - the event should occur at some time.
Unlikely - the event could occur at some time.
Rare/Remote - the event may occur only in exceptional circumstances.
Significance
Provides an overall impression of an impact’s importance, and the degree to which it can be
mitigated. The range for significance ratings is as follows-
0 – Impact will not affect the environment. No mitigation necessary.
1 – No impact after mitigation.
2 – Residual impact after mitigation.
3 – Impact cannot be mitigated.
SOCIAL/ECONOMIC IMPACT AREA SUBSISTENCE FISHERMEN
Relevant Alternatives & Activities Impact on access and potential loss of livelihood
Project life-cycle Construction
Potential Impact Proposed Management Objectives / Mitigation Measures
The impact of the proposed development on subsistence fishing as a result of dredging disturbance to fish during construction.
During construction it is proposed that the extent of the dredge plume is
monitored to ensure minimal disturbance and that rest periods are instituted if
the habitat reaches a certain level of disturbance.
+/- Impacts Extent Magnitude Duration Probability
Significance on Environment
Before Mitigation negative local high short likely 2
After Mitigation negative local medium short likely 1
SOCIAL/ECONOMIC IMPACT AREA SUBSISTENCE FISHERMEN
Relevant Alternatives & Activities Impact on access and potential loss of livelihood
Project life-cycle Operation phase

ECONOMIC IMPACT ASSESSMENT FOR THE EXPANSION OF BERTHS 203, 204 AND 205 AT THE DURBAN CONTAINER TERMINAL
37
Potential Impact Proposed Management Objectives / Mitigation Measures
The impact of the proposed development on subsistence fishing as a result of a loss of habitat, particularly sand prawn habitat which line fish rely on as a major food source.
Mitigation as outlined in the biodiversity studies is to reconstruct the same area
of the sandbank lost and extend little lagoon. This will recreate the habitat for
prawns which are a major food source for fish. This depends on the ability to
recreate a habitat which fulfils the same function.
+/- Impacts Extent Magnitude Duration Probability
Significance on Environment
Before Mitigation negative local medium short-long likely 2
After Mitigation positive local low short-long likely 0
SOCIAL/ECONOMIC IMPACT AREA TRAFFIC
Relevant Alternatives & Activities Impact of increased container movements
Project life-cycle Operation phase
Potential Impact Proposed Management Objectives / Mitigation Measures
Increased traffic on eThekwini roads. Planning for this additional volume of road freight traffic on domestic roads adjacent the port precinct is mitigated by eThekwini’s freight plan and TNPAs projects to increase road capacity, which has taken into account projected growth in port traffic in line with Transnet’s projections.
+/- Impacts Extent Magnitude Duration Probability Significance
Before Mitigation negative regional Medium short-long likely 2
After Mitigation positive Regional low short-long likely 1
SOCIAL/ECONOMIC IMPACT AREA IMPACT ON BEACH TOURISM
Relevant Alternatives & Activities Impact of off-shore dumping
Project life-cycle Construction phase
Potential Impact Proposed Management Objectives / Mitigation Measures
Impact on water quality and wave size (turbidity and bed shear stress levels) would affect prime beach areas at Ushaka and Bluff.
According to specialist studies, no impact is associated with the off-shore dumping site; thus no mitigation required.
+/- Impacts Extent Magnitude Duration Probability
Significance on Environment
Before Mitigation neutral local low short likely 0
After Mitigation - - - - - -

ECONOMIC IMPACT ASSESSMENT FOR THE EXPANSION OF BERTHS 203, 204 AND 205 AT THE DURBAN CONTAINER TERMINAL
38
SOCIAL/ECONOMIC IMPACT AREA Job Creation
Relevant Alternatives & Activities Impact of Construction Phase and increased capacity handling
Project life-cycle Construction phase, operation phase
Potential Impact Proposed Management Objectives / Mitigation Measures
Increase in jobs caused by CAPEX and improved operational capacity at revitalised berths.
1. Use of local firms during construction and the inclusion of a “hire
local” share of labour would ensure greater local capture of these
benefits.
+/- Impacts Extent Magnitude Duration Probability
Significance on socio-economic
Environment
Before Mitigation Positive local Medium Long-term Likely 1
After Mitigation Positive local Medium Long-term Likely 3
SOCIAL/ECONOMIC IMPACT AREA Income levels
Relevant Alternatives & Activities Impact of Construction Phase and increased capacity handling
Project life-cycle Construction phase, operation phase
Potential Impact Proposed Management Objectives / Mitigation Measures
Increase in household income levels due to increased local employment captured through construction and improved operational capacity promoting higher TEU handling opportunities at revitalised berths.
1. Use of local firms during construction and the inclusion of a “hire local” share of labour would ensure greater local capture of these benefits.
+/- Impacts Extent Magnitude Duration Probability
Significance on Environment
Before Mitigation Positive local Medium Long-term Likely 1
After Mitigation Positive local Medium Long-term Likely 3
SOCIAL/ECONOMIC IMPACT AREA Business Sales
Relevant Alternatives & Activities Impact of Construction Phase and increased capacity handling
Project life-cycle Construction phase, operation phase
Potential Impact Proposed Management Objectives / Mitigation Measures

ECONOMIC IMPACT ASSESSMENT FOR THE EXPANSION OF BERTHS 203, 204 AND 205 AT THE DURBAN CONTAINER TERMINAL
39
Increase in business sales levels due to increased local demand generated by construction and improved operational capacity promoting higher TEU handling opportunities at revitalised berths.
1. Use of local firms during construction and the inclusion of a “hire local” share of labour would ensure greater local capture of these benefits.
+/- Impacts Extent Magnitude Duration Probability
Significance on Environment
Before Mitigation Positive local Medium Long-term Likely 1
After Mitigation Positive local Medium Long-term Likely 3
SOCIAL/ECONOMIC IMPACT AREA Gross Value Added (Regional Output)
Relevant Alternatives & Activities Impact of Construction Phase and increased capacity handling
Project life-cycle Construction phase, operation phase
Potential Impact Proposed Management Objectives / Mitigation Measures
Increase in regional output (GVA) levels due to increased local demand generated by construction and improved operational capacity promoting higher TEU handling opportunities at revitalised berths.
1. Use of local firms during construction and the inclusion of a “hire local” share of labour would ensure greater local capture of these benefits.
+/- Impacts Extent Magnitude Duration Probability
Significance on Environment
Before Mitigation Positive local Medium Long-term Likely 1
After Mitigation Positive local Medium Long-term Likely 3

ECONOMIC IMPACT ASSESSMENT FOR THE EXPANSION OF BERTHS 203, 204 AND 205 AT THE DURBAN CONTAINER TERMINAL
40
Section 6: Conclusion
6.1 Summary of Findings Productive industries (i.e. manufacturing, agriculture and mining) have shown recovery since the
2009 recession; hence exports and imports have recovered to 2008 levels and continue to show
strong growth (11%) placing increasing demand on the port. Volumes of containers handled have
increased by 7% on average annually, and also superseded 2008 levels in 2011. Evidence shows
continued growth in 2012. Berths 203-205 handle 37% of these containers and are therefore critical
to the port. It is therefore, evident that the volume of traffic at these berths is increasing.
Furthermore, regardless of demand for containers, ship sizes are increasing and will continue to do
so into the near future to a point where 3,000-6,000 TEU range ships are phased out and replaced
with medium and large sized vessels of 8,000-10,000TEUs. Currently, the terminal can only
accommodate ships up to 9,000TEUs (not fully laden) at high tide. If the expansion does not occur,
Durban Port will be unable to accommodate an increasing number of containerships and, thus,
regional competitiveness of KZN will be reduced. In the long term, this reduced competitiveness will
be significant and detrimental to trade in the province and will raise cost of exports by incurring an
additional feedering service to a port that can handle larger vessel sizes.
Therefore, if the expansion does not take place, a significant loss of handling capacity of 284 108
TEUS carried on vessels too large to be berthed if the depth at berths 203 – 205 is not increased in
the short term, until available capacity at the dig-out port becomes available. Which has a direct
spend loss impact of R1961m, induced spend of R1569m, port related employment loss of 852 jobs
and total employment loss of 3530 over the period of 2016 – 2020.
If the berths are only deepened but not lengthened by 170m there will only be the capacity for one
large vessel to berth at a time during the construction phase, resulting in the absolute loss of one
berth’s worth of TEUs (this loss will not be able to be absorbed in other areas of the port. This will
cause a loss of direct spend of R16 653m, induced spend of R21 671m and port related
employment loss of 5 547 jobs and total employment loss of 13 221 jobs over the four
construction years. In the long term, pier 2 will not be able to accommodate 3 large vessels if the
lengthening does not occur.
Due to the fact that vessels are expected to increase in size in substantial volumes, this will result in
a loss of direct spend of R554m, induced spend of R443m and port related employment loss of 185
jobs and total employment loss of 446 jobs over the operational three year period.
If the full expansion planned goes ahead there will be benefits during the construction phase and in
the long term. The temporary benefits of the construction process have been shown to include:
R3050m to R5494m in new business sales
R1083m to R1952m in Gross Value Added
R963m to R535m in income multipliers locally (KZN)
5 222 to 9 406 temporary work opportunities created through the port construction process.
Using the projections of TEU volumes from TNPA from 2012/13 – 2017/18 and a medium term
growth rate of 8% (post-recession growth) from 2017/18 – 2024/25, by 2025 TEU traffic projections
on these berths reaches over 5 million TEU per annum. This relates to spend of R27 088m first round

ECONOMIC IMPACT ASSESSMENT FOR THE EXPANSION OF BERTHS 203, 204 AND 205 AT THE DURBAN CONTAINER TERMINAL
41
and a further spend of R21 671 induced into supporting services. Employment related to this traffic
base is 21 506 persons.
6.2 Recommendations 1. The results of the Economic Impact Assessment show that the economic benefits for
extending and deepening the berths at Pier 2 are significant and, therefore, warrant full
development to go ahead.
2. The benefits are equal across the three construction types in the operational phase and the
variation between the three options during construction phase is not significant enough to
warrant a preference.