Economic History and Cliometrics Lab Working Paper # 9economia.uc.cl/docs/wp_9.pdf · Economic...
48
Economic History and Cliometrics Lab Working Paper # 9 Skill Premium in Chile: Studying Skill Upgrading in the South FRANCISCO A. GALLEGO This Version: May, 2010 www.ehcliolab.cl
Transcript of Economic History and Cliometrics Lab Working Paper # 9economia.uc.cl/docs/wp_9.pdf · Economic...
Economic History and Cliometrics Lab
Working Paper # 9
Skill Premium in Chile: Studying Skill Upgrading in the
South
FRANCISCO A. GALLEGO
This Version: May, 2010
www.ehcliolab.cl
Economic History and Cliometrics Laboratory Working Paper Series The EH Clio Lab WP series disseminates research developed by lab researchers and students quickly in order to generate comments and suggestions for revision or improvement before publication. They may have been presented at conferences or workshops already, but will not yet have been published in journals. The EH Clio Lab is a research group that applies economic tools –theory as well as quantitative tools applied in economics- to the study of economic history. The current two main research topics: (i) “The Republic in Numbers” and (ii) papers on more specific historical issues and problems, using data both from the República and other sources. The latter consists in the collection and construction of a large number of statistical series about Chile`s development process during the past two centuries. The EH Clio Lab receives funding from the Millenium Nuclei Research in Social Sciences, Planning Ministry (MIDEPLAN), Republic of Chile, ([email protected]).
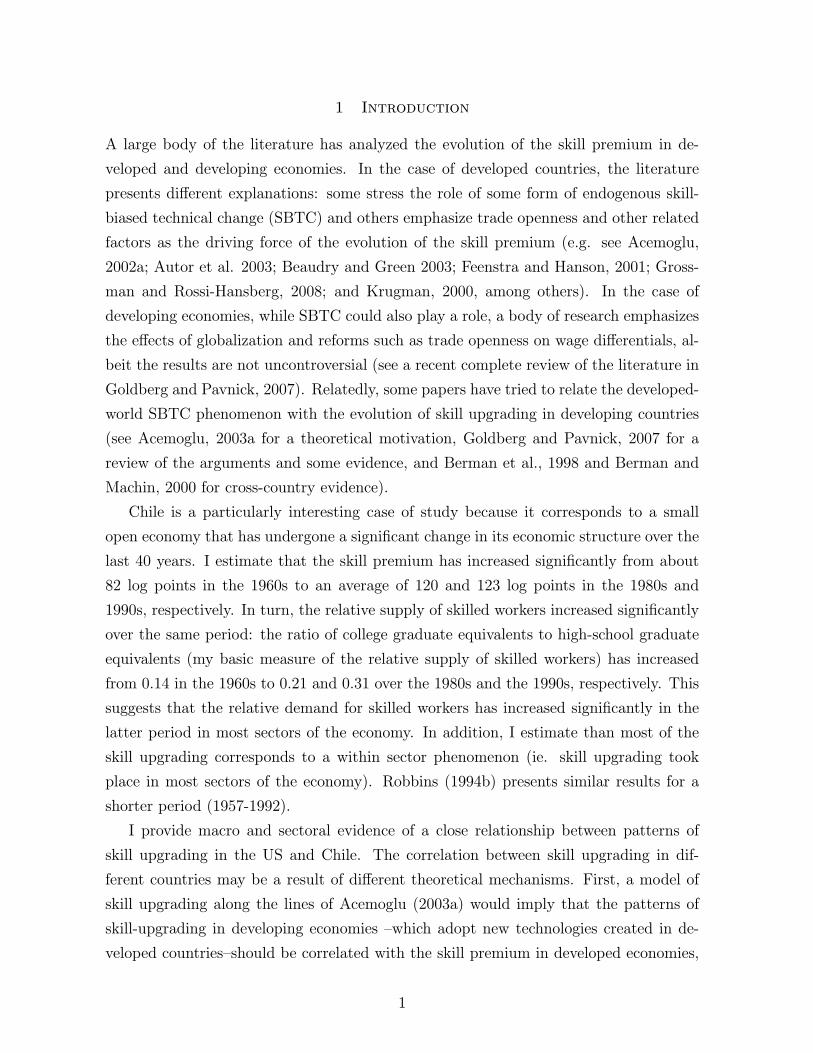
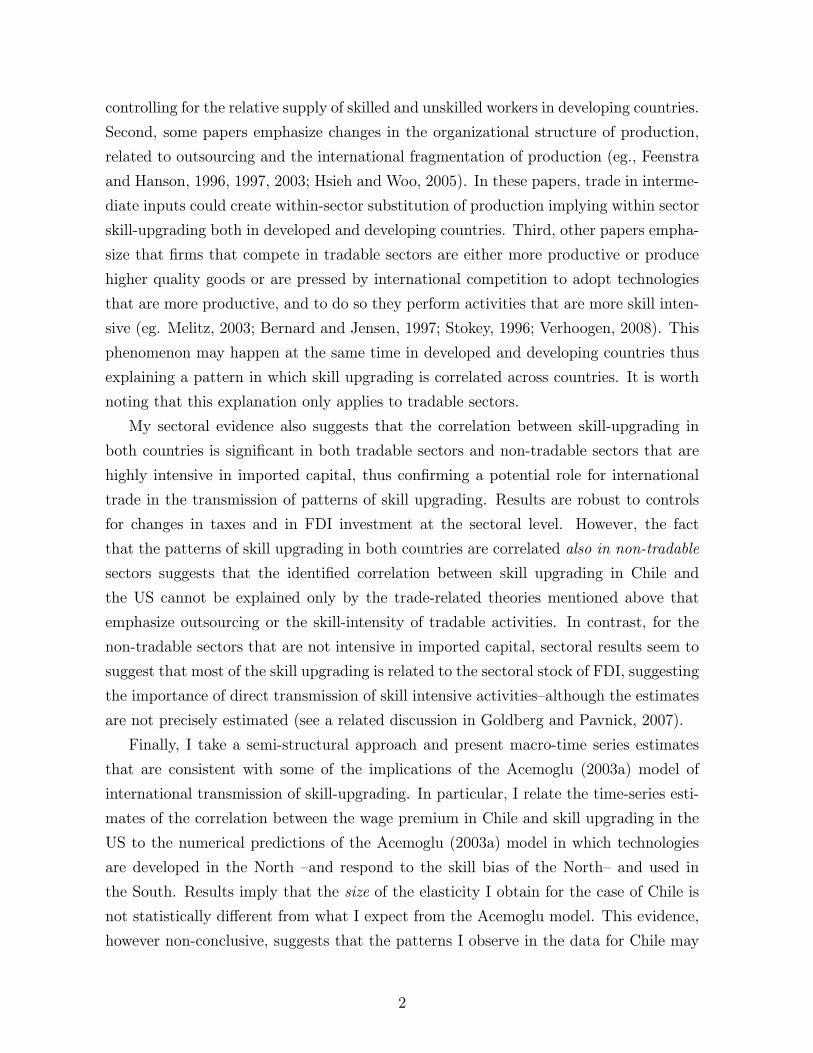
Skill Premium in Chile: Studying Skill Upgrading in the South Francisco A. Gallego Economic History and Cliometrics Lab Working Paper #9 May 2010 Abstract The evolution of the skill premium (i.e., the wage differential between skilled and unskilled workers) has interest from at least two perspectives: it is a rough measure of inequality among workers of different qualifications and provides information on the characteristics of the development process of the economy. In this paper, I investigate empirically the evolution of the skill premium in Chile over the last 40 years. After some fluctuations in the 1960s and 1970s, the skill premium increased in the 1980s and has remained roughly constant since then. The data suggest that this evolution is an outcome of a significant increase in relative demand for skilled workers in the 1980s and 1990s and a sizeable increase in the relative supply in the 1990s. Sectoral evidence shows that, after controlling for sector and time effects, (i) the relative demand increased faster in the same industries in Chile than in the US and (ii) the correlation is stronger for tradable industries and non-tradable industries that are intensive in imported capital, as expected. This result is consistent with a number of theories that link skill up- grading in developed and developing countries. To try to disentangle among these theories, I present time series evidence suggesting that, after controlling for other determinants of skill premium, not only there is a positive correlation between skill premium in Chile and in the US but also the size of the correlation is consistent with the Acemoglu (2003a) model of endogenous technological choice in which new technologies are produced in developed countries (like the US) and adopted in developing economies (like Chile). JEL Classification Number: O3, J31


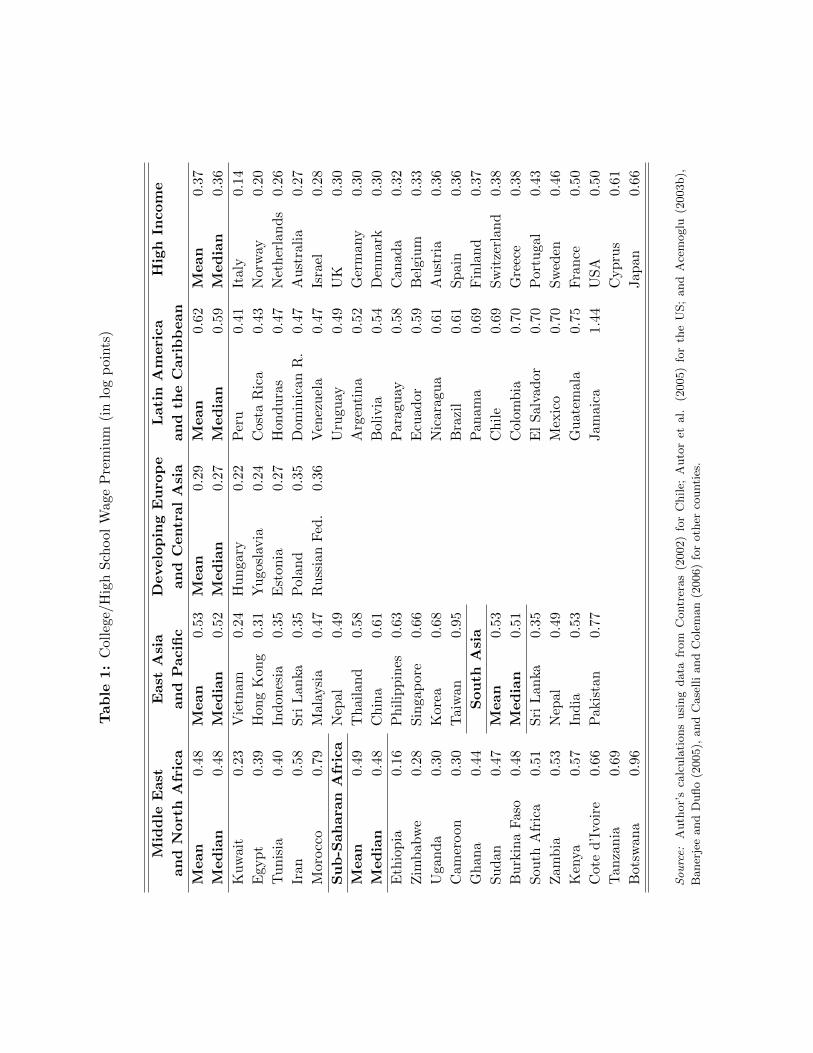
Table
1:College/H
ighSchoo
lWag
ePremium
(inlogpoints)
Middle
East
EastAsia
DevelopingEurope
Latin
America
High
Income
and
North
Africa
and
Pacific
and
CentralAsia
and
theCaribbean
Mean
0.48
Mean
0.53
Mean
0.29
Mean
0.62
Mean
0.37
Median
0.48
Median
0.52
Median
0.27
Median
0.59
Median
0.36
Kuw
ait
0.23
Vietnam
0.24
Hunga
ry0.22
Peru
0.41
Italy
0.14
Egy
pt
0.39
Hon
gKon
g0.31
Yugo
slavia
0.24
Costa
Rica
0.43
Norway
0.20
Tunisia
0.40
Indon
esia
0.35
Eston
ia0.27
Hon
duras
0.47
Netherlands
0.26
Iran
0.58
Sri
Lan
ka0.35
Polan
d0.35
Dom
inican
R.
0.47
Australia
0.27
Morocco
0.79
Malaysia
0.47
RussianFed
.0.36
Ven
ezuela
0.47
Israel
0.28
Sub-Saharan
Africa
Nep
al0.49
Urugu
ay0.49
UK
0.30
Mean
0.49
Thailand
0.58
Argentina
0.52
German
y0.30
Median
0.48
China
0.61
Bolivia
0.54
Den
mark
0.30
Ethiopia
0.16
Philippines
0.63
Parag
uay
0.58
Can
ada
0.32
Zim
bab
we
0.28
Singa
pore
0.66
Ecu
ador
0.59
Belgium
0.33
Uga
nda
0.30
Korea
0.68
Nicarag
ua
0.61
Austria
0.36
Cam
eroo
n0.30
Taiwan
0.95
Brazil
0.61
Spain
0.36
Ghan
a0.44
South
Asia
Pan
ama
0.69
Finland
0.37
Sudan
0.47
Mean
0.53
Chile
0.69
Switzerlan
d0.38
BurkinaFaso
0.48
Median
0.51
Colom
bia
0.70
Greece
0.38
Sou
thAfrica
0.51
Sri
Lan
ka0.35
ElSalvador
0.70
Portuga
l0.43
Zam
bia
0.53
Nep
al0.49
Mexico
0.70
Swed
en0.46
Kenya
0.57
India
0.53
Guatem
ala
0.75
France
0.50
Coted’Ivo
ire
0.66
Pak
istan
0.77
Jamaica
1.44
USA
0.50
Tan
zania
0.69
Cyp
rus
0.61
Botsw
ana
0.96
Japan
0.66
Sou
rce:
Author’s
calculationsusingdatafrom
Contreras(2002)forChile;Autoretal.
(2005)fortheUS;andAcemoglu
(2003b),
BanerjeeandDuflo(2005),andCaselliandColeman(2006)forothercounties.
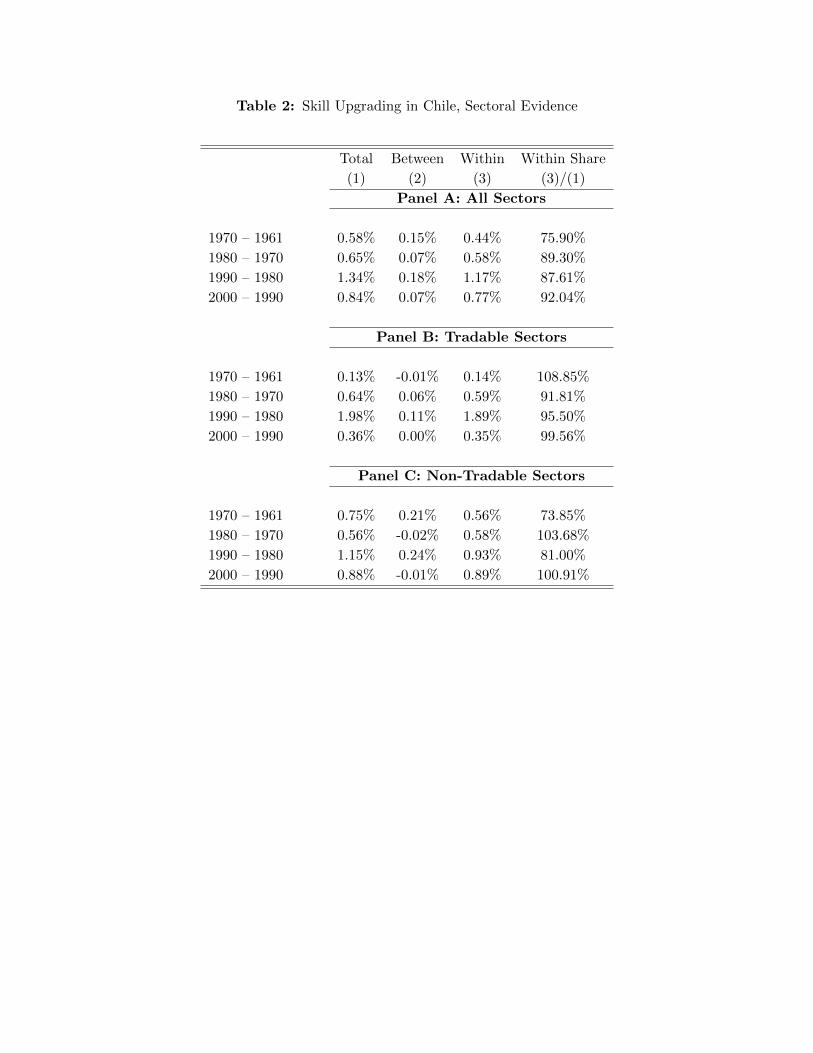
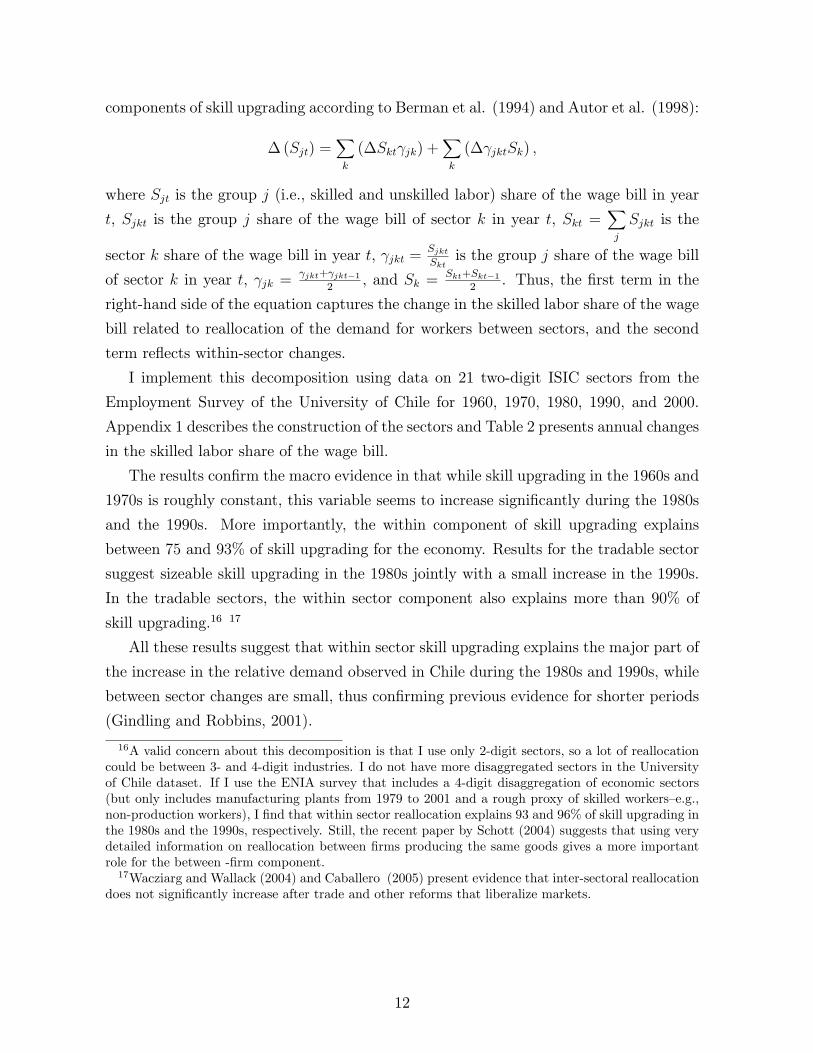
Table 2: Skill Upgrading in Chile, Sectoral Evidence
Total Between Within Within Share
(1) (2) (3) (3)/(1)
Panel A: All Sectors
1970 – 1961 0.58% 0.15% 0.44% 75.90%
1980 – 1970 0.65% 0.07% 0.58% 89.30%
1990 – 1980 1.34% 0.18% 1.17% 87.61%
2000 – 1990 0.84% 0.07% 0.77% 92.04%
Panel B: Tradable Sectors
1970 – 1961 0.13% -0.01% 0.14% 108.85%
1980 – 1970 0.64% 0.06% 0.59% 91.81%
1990 – 1980 1.98% 0.11% 1.89% 95.50%
2000 – 1990 0.36% 0.00% 0.35% 99.56%
Panel C: Non-Tradable Sectors
1970 – 1961 0.75% 0.21% 0.56% 73.85%
1980 – 1970 0.56% -0.02% 0.58% 103.68%
1990 – 1980 1.15% 0.24% 0.93% 81.00%
2000 – 1990 0.88% -0.01% 0.89% 100.91%
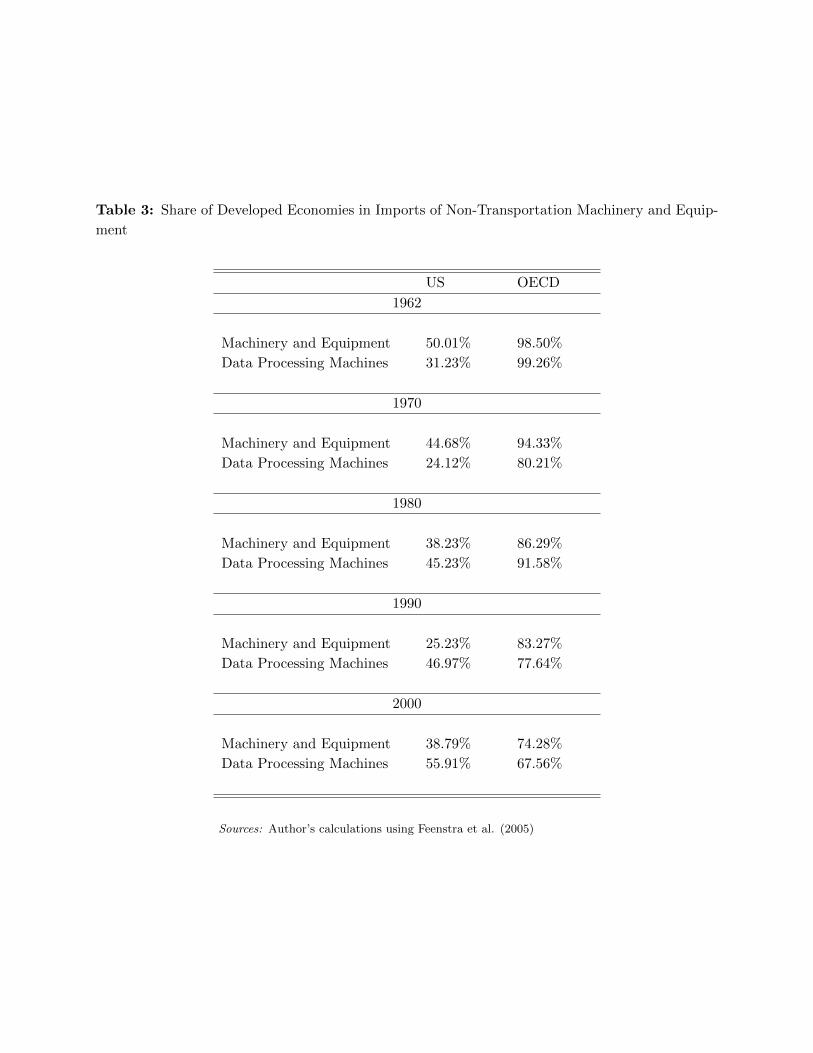
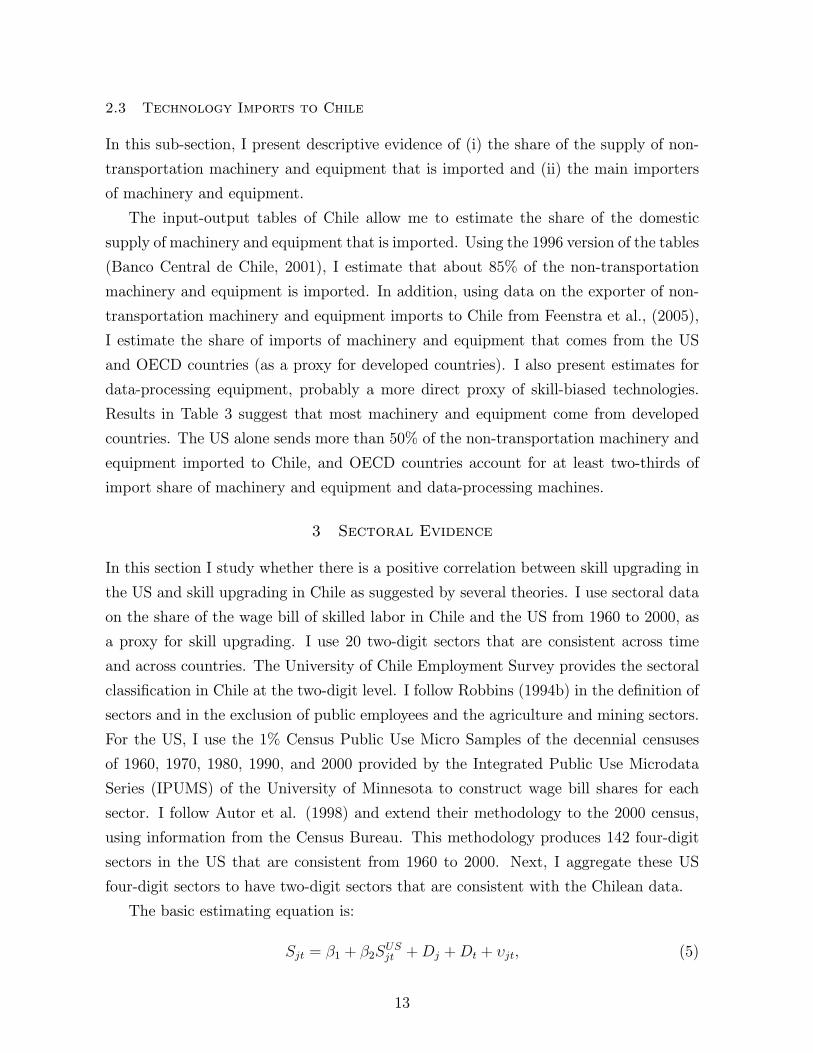
Table 3: Share of Developed Economies in Imports of Non-Transportation Machinery and Equip-
ment
US OECD
1962
Machinery and Equipment 50.01% 98.50%
Data Processing Machines 31.23% 99.26%
1970
Machinery and Equipment 44.68% 94.33%
Data Processing Machines 24.12% 80.21%
1980
Machinery and Equipment 38.23% 86.29%
Data Processing Machines 45.23% 91.58%
1990
Machinery and Equipment 25.23% 83.27%
Data Processing Machines 46.97% 77.64%
2000
Machinery and Equipment 38.79% 74.28%
Data Processing Machines 55.91% 67.56%
Sources: Author’s calculations using Feenstra et al. (2005)
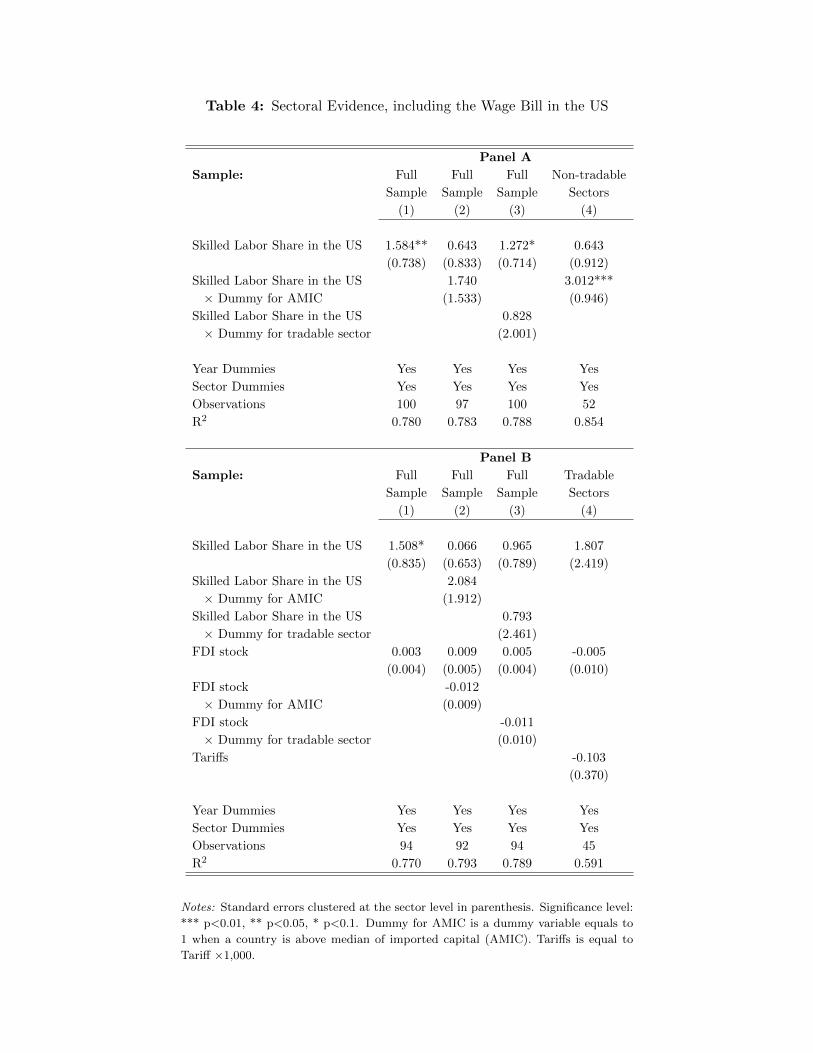
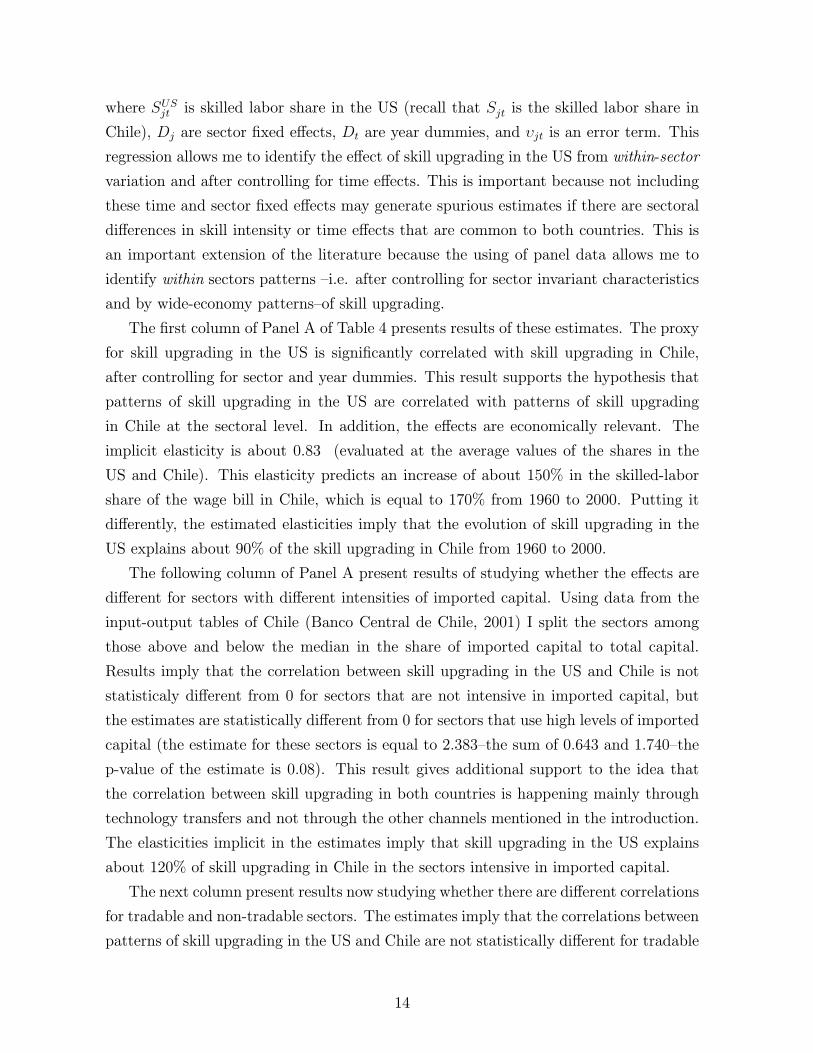
Table 4: Sectoral Evidence, including the Wage Bill in the US
Panel A
Sample: Full Full Full Non-tradable
Sample Sample Sample Sectors
(1) (2) (3) (4)
Skilled Labor Share in the US 1.584** 0.643 1.272* 0.643
(0.738) (0.833) (0.714) (0.912)
Skilled Labor Share in the US 1.740 3.012***
× Dummy for AMIC (1.533) (0.946)
Skilled Labor Share in the US 0.828
× Dummy for tradable sector (2.001)
Year Dummies Yes Yes Yes Yes
Sector Dummies Yes Yes Yes Yes
Observations 100 97 100 52
R2 0.780 0.783 0.788 0.854
Panel B
Sample: Full Full Full Tradable
Sample Sample Sample Sectors
(1) (2) (3) (4)
Skilled Labor Share in the US 1.508* 0.066 0.965 1.807
(0.835) (0.653) (0.789) (2.419)
Skilled Labor Share in the US 2.084
× Dummy for AMIC (1.912)
Skilled Labor Share in the US 0.793
× Dummy for tradable sector (2.461)
FDI stock 0.003 0.009 0.005 -0.005
(0.004) (0.005) (0.004) (0.010)
FDI stock -0.012
× Dummy for AMIC (0.009)
FDI stock -0.011
× Dummy for tradable sector (0.010)
Tariffs -0.103
(0.370)
Year Dummies Yes Yes Yes Yes
Sector Dummies Yes Yes Yes Yes
Observations 94 92 94 45
R2 0.770 0.793 0.789 0.591
Notes: Standard errors clustered at the sector level in parenthesis. Significance level:
*** p<0.01, ** p<0.05, * p<0.1. Dummy for AMIC is a dummy variable equals to
1 when a country is above median of imported capital (AMIC). Tariffs is equal to
Tariff ×1,000.

Table 5: Time-Series Evidence: Estimation in Levels
Dependent variable: Relative Demand
Variable (1) (2) (3)
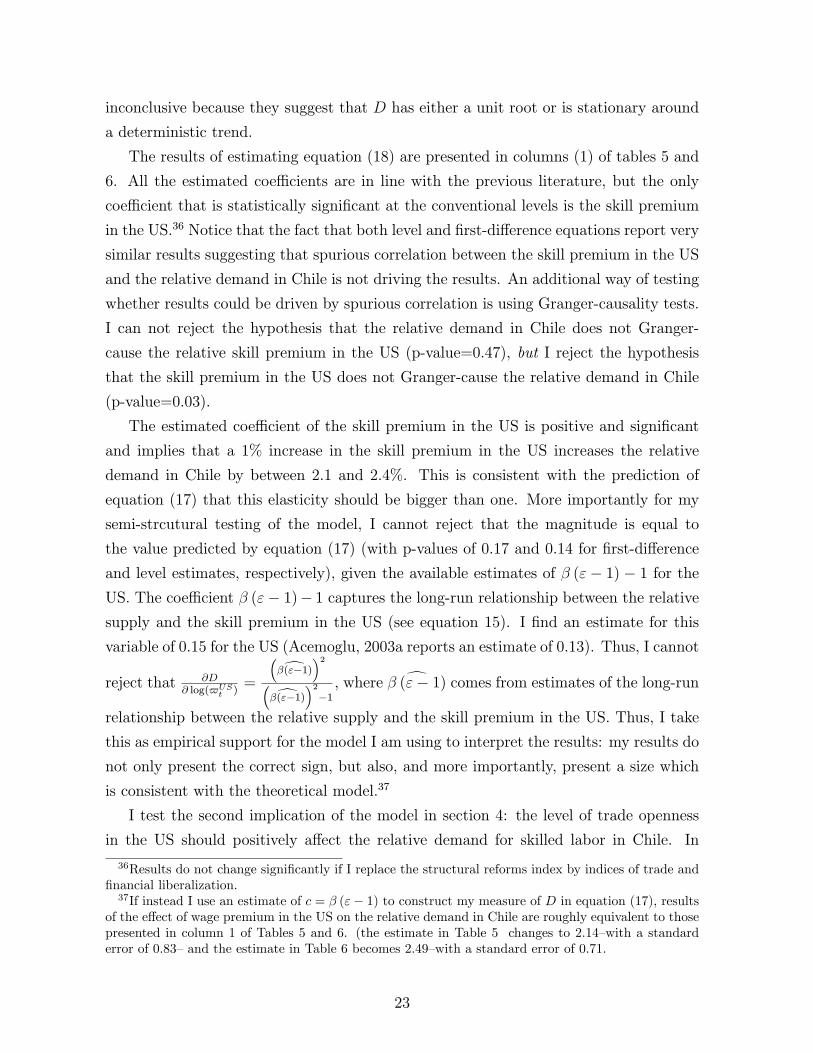
Wage Premium in the US 2.081 1.874
(0.828) (0.750)
Openness in the US 1.331 1.353
(0.421) (0.570)
Output Gap 0.674 0.454 0.563
(0.458) (0.553) (0.465)
Real Minimum Wage -0.294 -0.346 -0.499
(0.199) (0.198) (0.220)
Structural Reforms 0.371 0.243 0.941
(0.465) (0.330) (0.401)
Price of unskilled goods -0.275 -0.254 -0.329
(0.186) (0.146) (0.178)
Trend 0.001 0.019 -0.051
(0.012) (0.876) (0.023)
N 38 40 38
R2 0.853 0.876 0.883
ADF-test -4.629 -4.604 -5.677
Notes: Newey-West HAC standard errors in parenthesis.
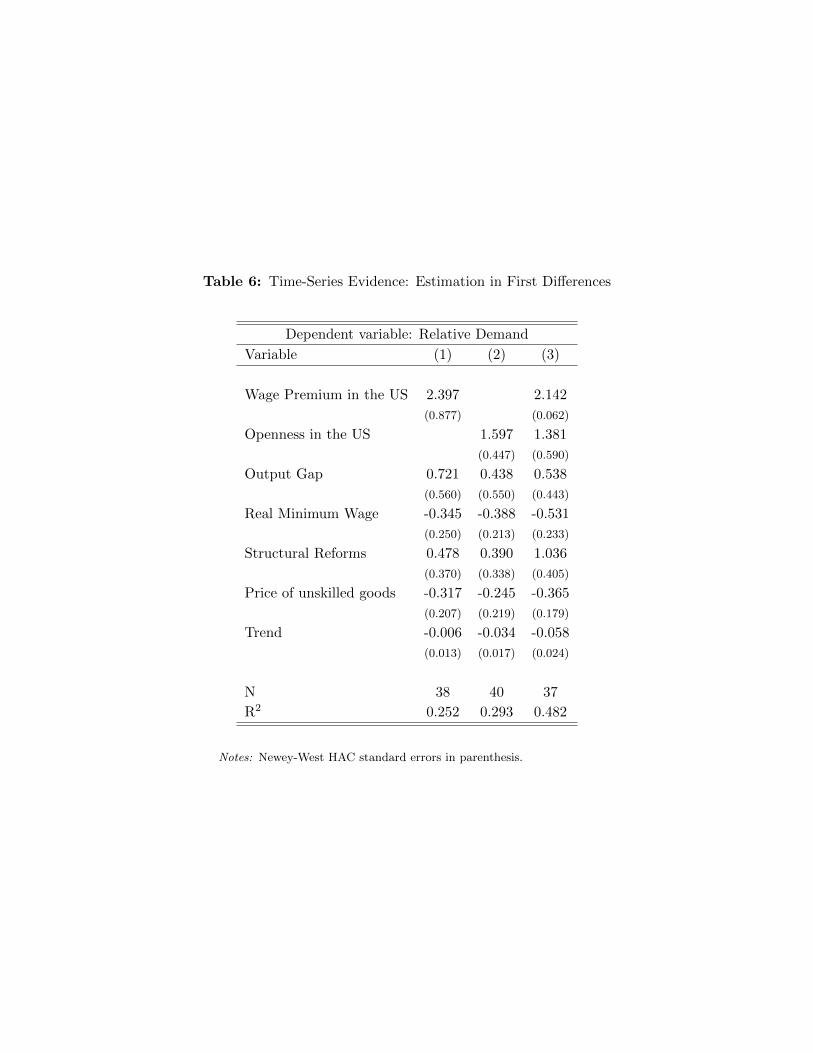
Table 6: Time-Series Evidence: Estimation in First Differences
Dependent variable: Relative Demand
Variable (1) (2) (3)
Wage Premium in the US 2.397 2.142
(0.877) (0.062)
Openness in the US 1.597 1.381
(0.447) (0.590)
Output Gap 0.721 0.438 0.538
(0.560) (0.550) (0.443)
Real Minimum Wage -0.345 -0.388 -0.531
(0.250) (0.213) (0.233)
Structural Reforms 0.478 0.390 1.036
(0.370) (0.338) (0.405)
Price of unskilled goods -0.317 -0.245 -0.365
(0.207) (0.219) (0.179)
Trend -0.006 -0.034 -0.058
(0.013) (0.017) (0.024)
N 38 40 37
R2 0.252 0.293 0.482
Notes: Newey-West HAC standard errors in parenthesis.
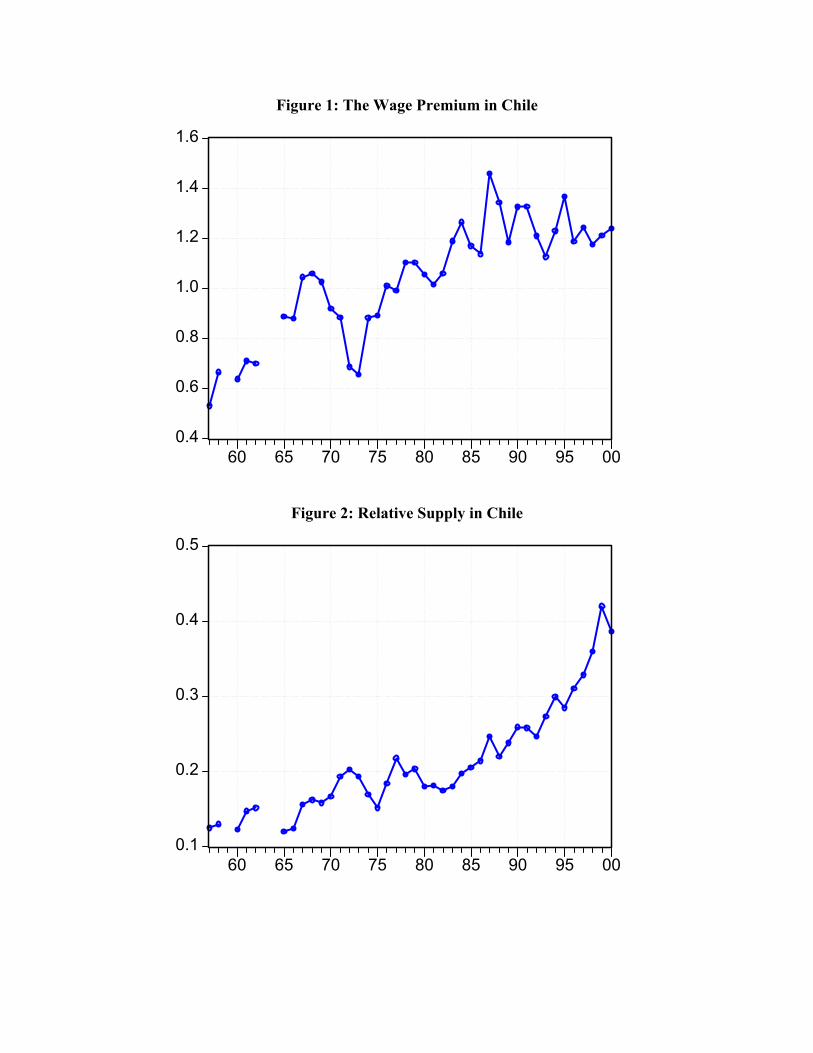
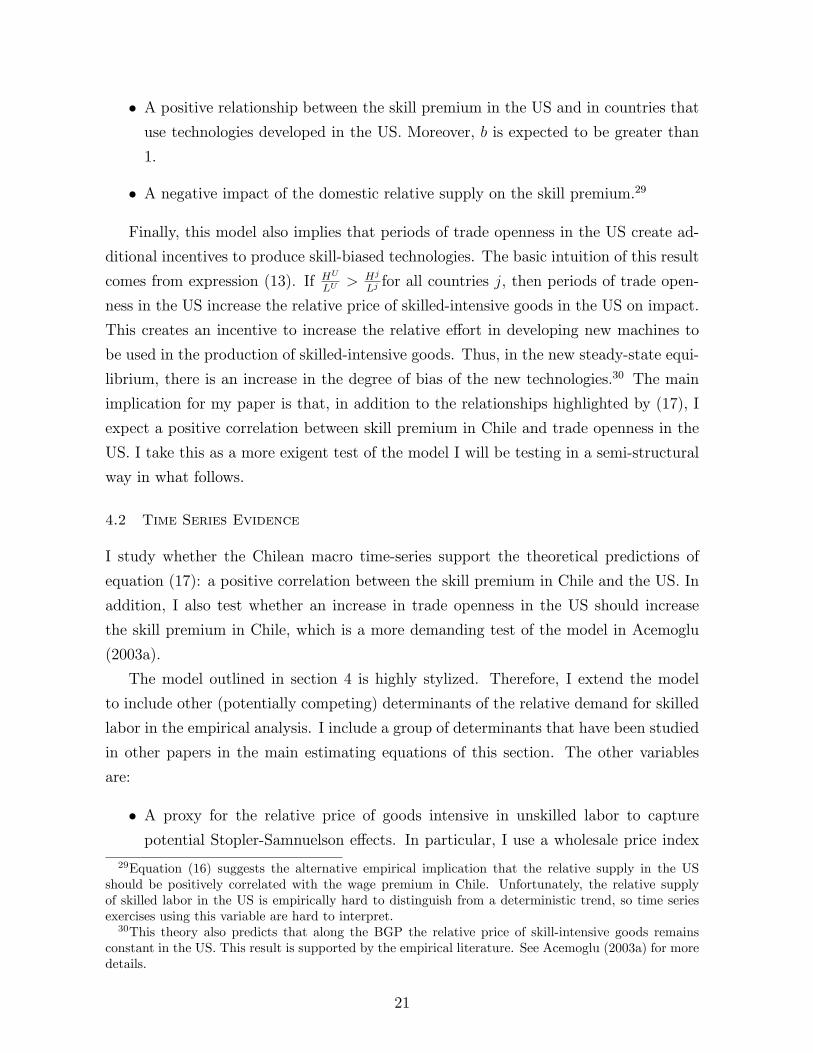
Figure 1: The Wage Premium in Chile
0.4
0.6
0.8
1.0
1.2
1.4
1.6
60 65 70 75 80 85 90 95 00
Figure 2: Relative Supply in Chile
0.1
0.2
0.3
0.4
0.5
60 65 70 75 80 85 90 95 00
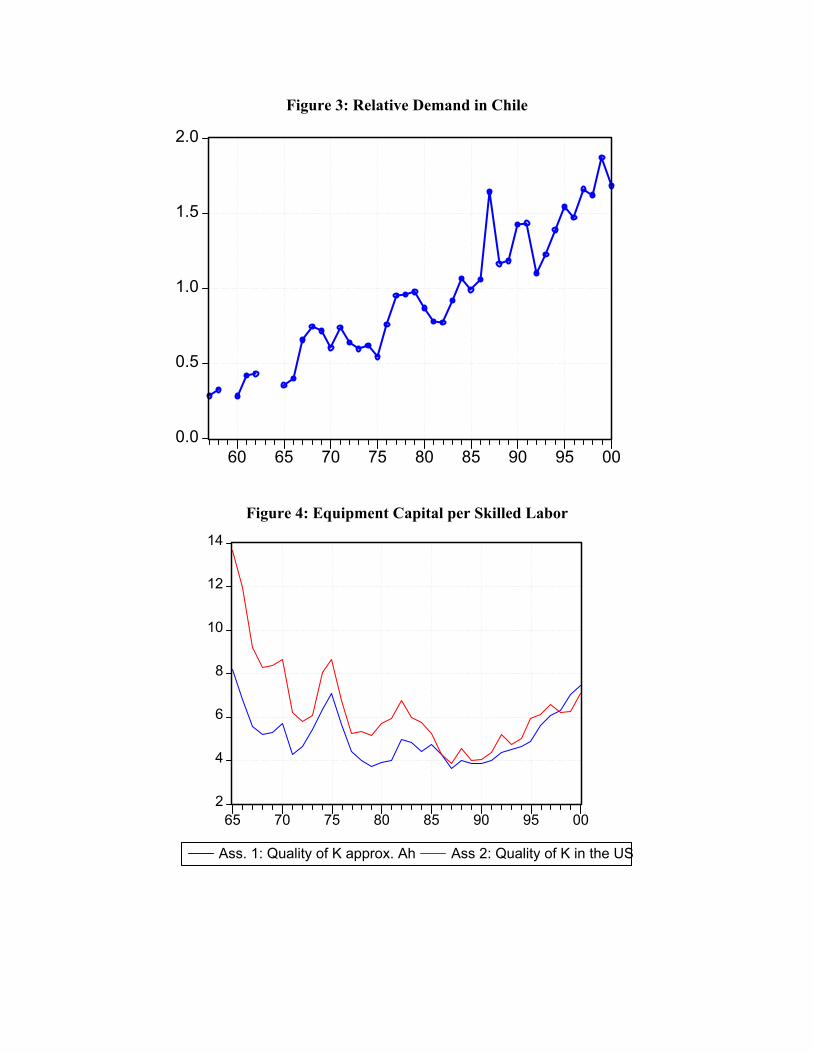
Figure 3: Relative Demand in Chile
0.0
0.5
1.0
1.5
2.0
60 65 70 75 80 85 90 95 00
Figure 4: Equipment Capital per Skilled Labor
2
4
6
8
10
12
14
65 70 75 80 85 90 95 00
Ass. 1: Quality of K approx. Ah Ass 2: Quality of K in the US
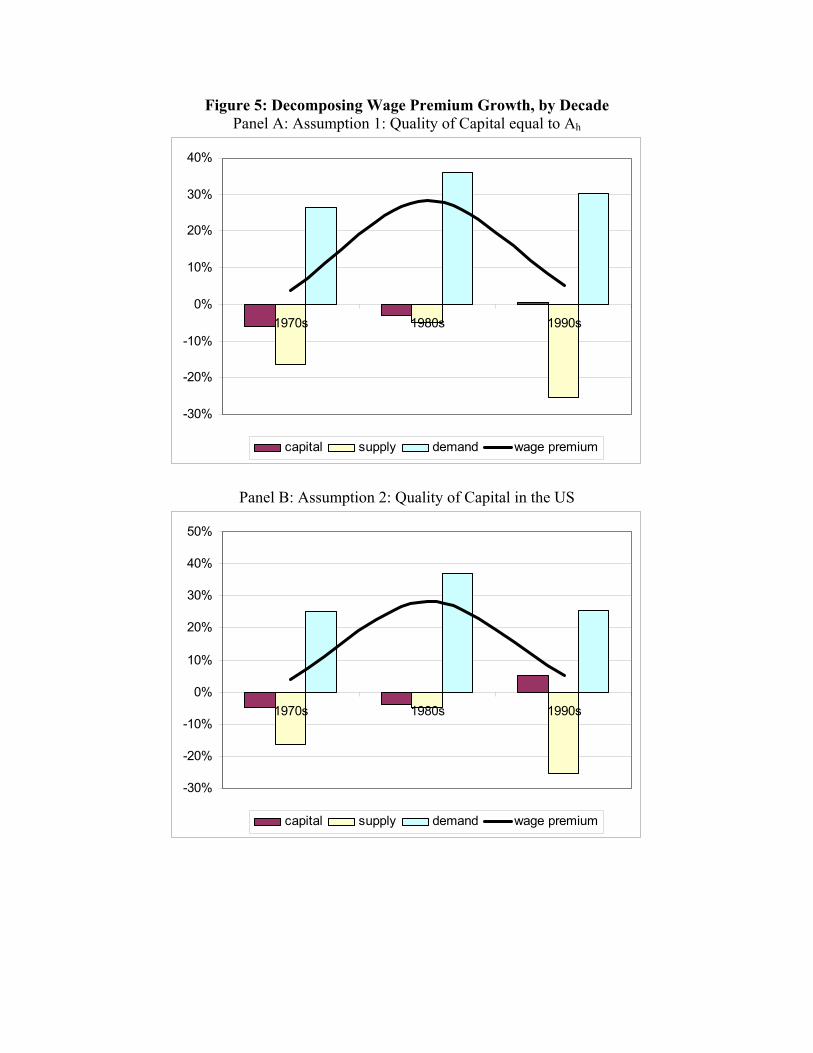
Figure 5: Decomposing Wage Premium Growth, by Decade Panel A: Assumption 1: Quality of Capital equal to Ah
-30%
-20%
-10%
0%
10%
20%
30%
40%
1970s 1980s 1990s
capital supply demand wage premium
Panel B: Assumption 2: Quality of Capital in the US
-30%
-20%
-10%
0%
10%
20%
30%
40%
50%
1970s 1980s 1990s
capital supply demand wage premium
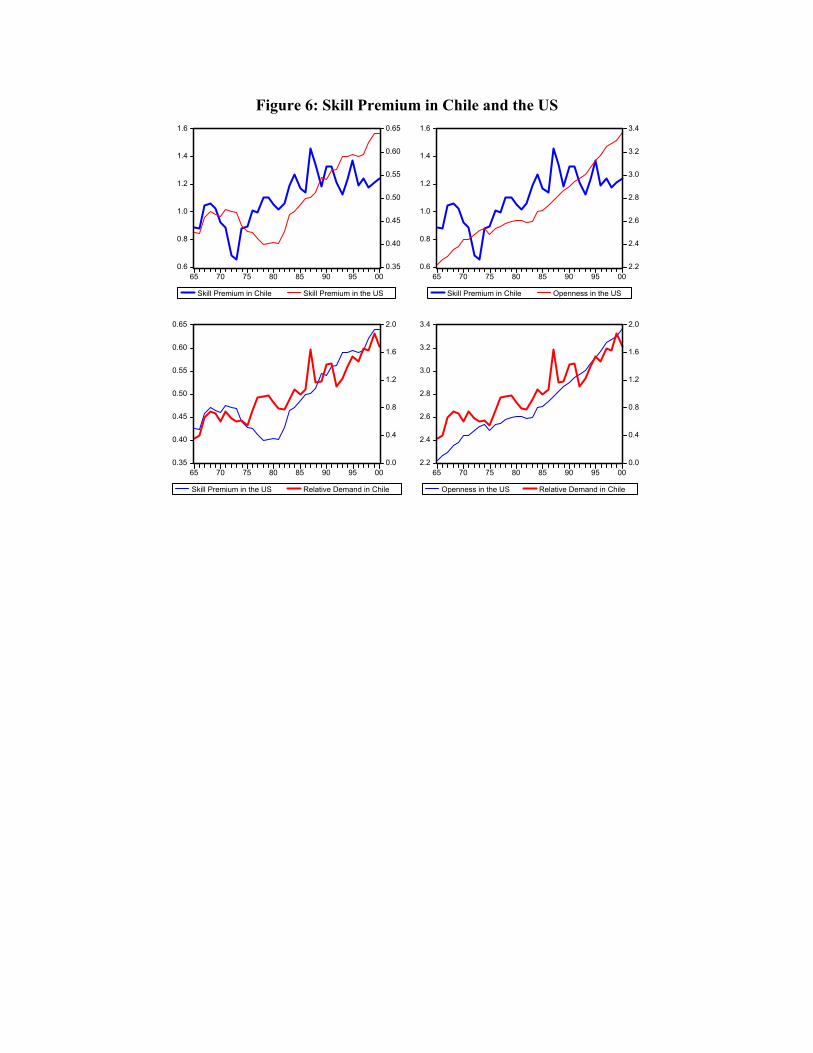
Figure 6: Skill Premium in Chile and the US
0.6
0.8
1.0
1.2
1.4
1.6
0.35
0.40
0.45
0.50
0.55
0.60
0.65
65 70 75 80 85 90 95 00
Skill Premium in Chile Skill Premium in the US
0.6
0.8
1.0
1.2
1.4
1.6
2.2
2.4
2.6
2.8
3.0
3.2
3.4
65 70 75 80 85 90 95 00
Skill Premium in Chile Openness in the US
0.35
0.40
0.45
0.50
0.55
0.60
0.65
0.0
0.4
0.8
1.2
1.6
2.0
65 70 75 80 85 90 95 00
Skill Premium in the US Relative Demand in Chile
2.2
2.4
2.6
2.8
3.0
3.2
3.4
0.0
0.4
0.8
1.2
1.6
2.0
65 70 75 80 85 90 95 00
Openness in the US Relative Demand in Chile
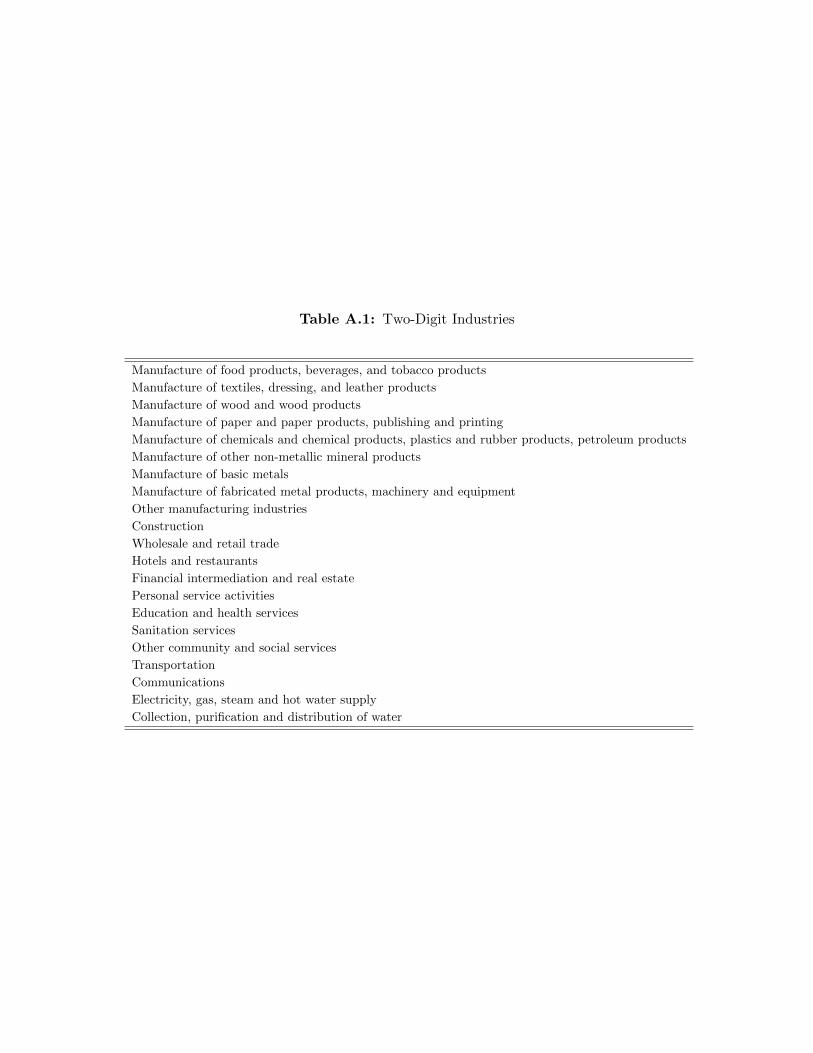
Table A.1: Two-Digit Industries
Manufacture of food products, beverages, and tobacco products
Manufacture of textiles, dressing, and leather products
Manufacture of wood and wood products
Manufacture of paper and paper products, publishing and printing
Manufacture of chemicals and chemical products, plastics and rubber products, petroleum products
Manufacture of other non-metallic mineral products
Manufacture of basic metals
Manufacture of fabricated metal products, machinery and equipment
Other manufacturing industries
Construction
Wholesale and retail trade
Hotels and restaurants
Financial intermediation and real estate
Personal service activities
Education and health services
Sanitation services
Other community and social services
Transportation
Communications
Electricity, gas, steam and hot water supply
Collection, purification and distribution of water
ECONOMIC HISTORY AND CLIOMETRICS LAB WORKING PAPER SERIES CERDA, RODRIGO: “The Impact of Government Spending on the Duration and the Intensity of Economic Crises: Latin America 1900-2000”. Economic History and Cliometrics Lab Working Paper #1, 2009. GALLEGO, FRANCISCO; WOODBERRY, ROBERT: “Christian Missionaries and Education in Former African Colonies: How Competition Mattered”. Economic History and Cliometrics Lab Working Paper #2, 2009. MATTA, JUAN JOSÉ: “El Efecto del Voto Obligatorio Sobre las Políticas Redistributivas: Teoría y Evidencia para un Corte Transversal de Países”. Economic History and Cliometrics Lab Working Paper #3, 2009 COX, LORETO: “Participación de la Mujer en el Trabajo en Chile: 1854-2000”. Economic History and Cliometrics Lab Working Paper #4, 2009 GALLEGO, FRANCISCO; WOODBERRY, ROBERt: “Christian Missionaries and Education in Former Colonies: How Institutions Mattered”. Economic History and Cliometrics Lab Working Paper #5, 2008. BRUHN, MIRIAM; GALLEGO, FRANCISCO: “Good, Bad and Ugly Colonial Activities: Do They Matter for Economic Development”. Economic History and Cliometrics Lab Working Paper #6, 2009. GALLEGO, FRANCISCO: “Historical Origins of Schooling: The Role of Democracy and Political Decentralization”. Economic History and Cliometrics Lab Working Paper #7, 2009. GALLEGO, FRANCISCO; RODRÍGUEZ, CARLOS; SAUMA, ENZO: “The Political Economy of School Size: Evidence from Chilean Rural Areas”. Economic History and Cliometrics Lab Working Paper #8, 2010. GALLEGO, FRANCISCO: “Skill Premium in Chile: Studying Skill Upgrading in the South”. Economic History and Cliometrics Lab Working Paper #9, 2010.