Economic Growth and Opportunity: Building New York City's Future in Lower Manhattan
43
Economic Growth and Opportunity: Building New York City’s Future in Lower Manhattan November 2015
-
Upload
alliance-for-downtown-new-york -
Category
Documents
-
view
216 -
download
0
description
The Downtown Alliance's report, Surging Ahead: Lower Manhattan's Economic Revival and What It Means for New York is based on the findings of an analysis conducted by Appleseed - a NYC-based consulting firm.
Transcript of Economic Growth and Opportunity: Building New York City's Future in Lower Manhattan

Economic Growth and Opportunity:
Building New York City’s Future in Lower Manhattan
November 2015
FINAL 1 Appleseed
Introduction
Lower Manhattan is where New York City was born nearly 400 years ago, and where the City has time and again reinvented itself. Having withstood the devastation wrought by the terrorist attacks of September 11, 2001, the economic consequences of the financial crisis of 2008 and the damage inflicted by Hurricane Sandy, Lower Manhattan is once again one of the City’s fastest-growing neighborhoods and business districts, and an increasingly important source of economic growth and opportunity for New Yorkers.
Downtown New York’s current success and its future potential as a community, a center of commerce and a place of opportunity are in no small measure due to the work of all those who during the past fourteen years have not only rebuilt Lower Manhattan but have also re-imagined what it could be. The redevelopment of the World Trade Center site, a surge in private investment in retail facilities, restaurants and hotels, continued residential development and public investments in infrastructure and community facilities have all had a part in this process.
As a result, Lower Manhattan in 2015 has begun a transition to a period of accelerated economic growth, marked by increased employment in some of New York’s highest-value, most dynamic industries, an increased contribution to the growth of the City’s gross domestic product and the growth of City tax revenues, and an expansion of economic opportunity for the City’s residents.
This report describes the economy of Lower Manhattan, its place in New York City’s economy, and how it will contribute to the growth of the City’s economy and the expansion of economic opportunity for New York City residents during the next five years. Part One of the report describes employment patterns in Lower Manhattan as of the fourth quarter of 2014 and how they have changed since 2001, analyzes Lower Manhattan’s contribution the City’s gross domestic product and assesses its contribution to New York City tax revenues.
Part Two of the report projects the growth of Lower Manhattan’s economy through 2019, and highlights both the underlying trends and specific developments contributing to that growth; and Part Three explores how Lower Manhattan’s continued growth during that period will contribute to the expansion of economic opportunity for New York City residents.
FINAL 2 Appleseed
Part One: Lower Manhattan in 2014 – jobs, GDP and taxes
Throughout New York City’s history, Lower Manhattan has been a major center of business and employment. As of the fourth quarter of 2014, 323,001 people were employed in wage-and-salary jobs in Lower Manhattan, of whom 227,069 (70.3 percent) were employed in the private sector and 95,932 (29.7 percent) in government.1
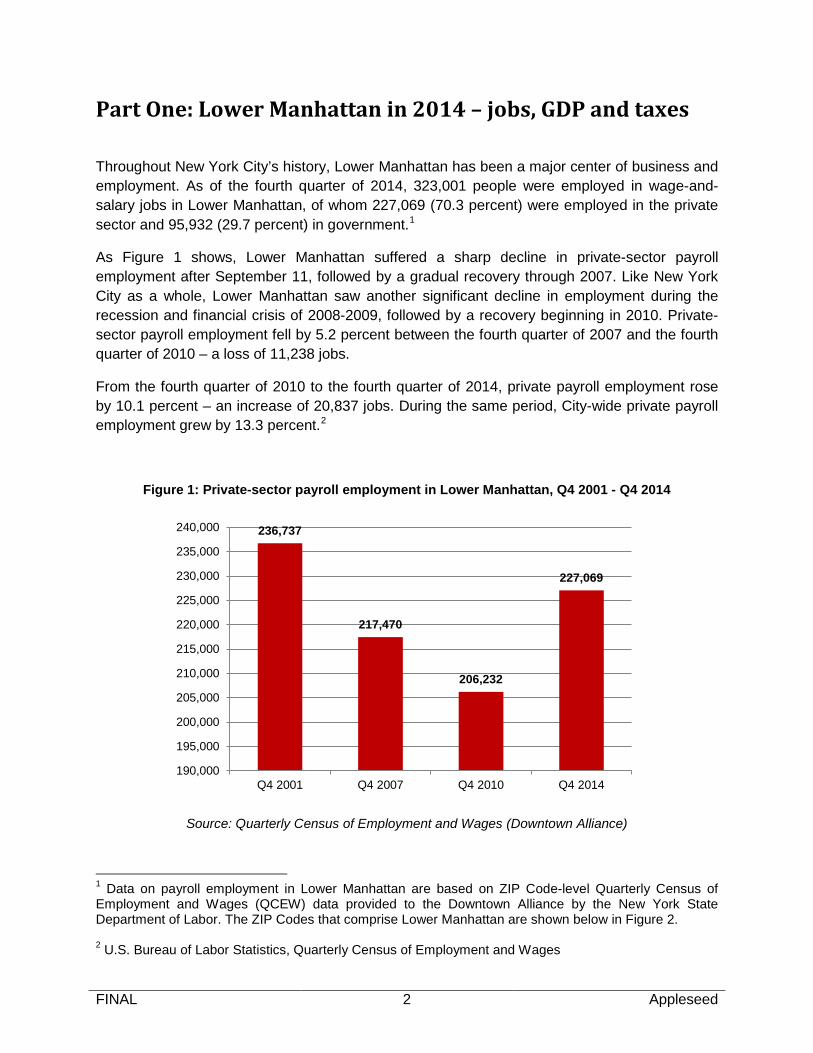
As Figure 1 shows, Lower Manhattan suffered a sharp decline in private-sector payroll employment after September 11, followed by a gradual recovery through 2007. Like New York City as a whole, Lower Manhattan saw another significant decline in employment during the recession and financial crisis of 2008-2009, followed by a recovery beginning in 2010. Private-sector payroll employment fell by 5.2 percent between the fourth quarter of 2007 and the fourth quarter of 2010 – a loss of 11,238 jobs.
From the fourth quarter of 2010 to the fourth quarter of 2014, private payroll employment rose by 10.1 percent – an increase of 20,837 jobs. During the same period, City-wide private payroll employment grew by 13.3 percent.2
Figure 1: Private-sector payroll employment in Lower Manhattan, Q4 2001 - Q4 2014
Source: Quarterly Census of Employment and Wages (Downtown Alliance)
1 Data on payroll employment in Lower Manhattan are based on ZIP Code-level Quarterly Census of Employment and Wages (QCEW) data provided to the Downtown Alliance by the New York State Department of Labor. The ZIP Codes that comprise Lower Manhattan are shown below in Figure 2. 2 U.S. Bureau of Labor Statistics, Quarterly Census of Employment and Wages
236,737
217,470
206,232
227,069
190,000
195,000
200,000
205,000
210,000
215,000
220,000
225,000
230,000
235,000
240,000
Q4 2001 Q4 2007 Q4 2010 Q4 2014

FINAL 3 Appleseed
Figure 2: Map of Lower Manhattan ZIP Codes*
*21 other individual building ZIP Codes are not shown on the map.
During the fourth quarter of 2014, Lower Manhattan accounted for 7.9 percent of total payroll employment, private and public – and 6.4 percent of all private-sector payroll jobs – in New York City.
FINAL 4 Appleseed
Private payroll employment in Lower Manhattan: composition by industry
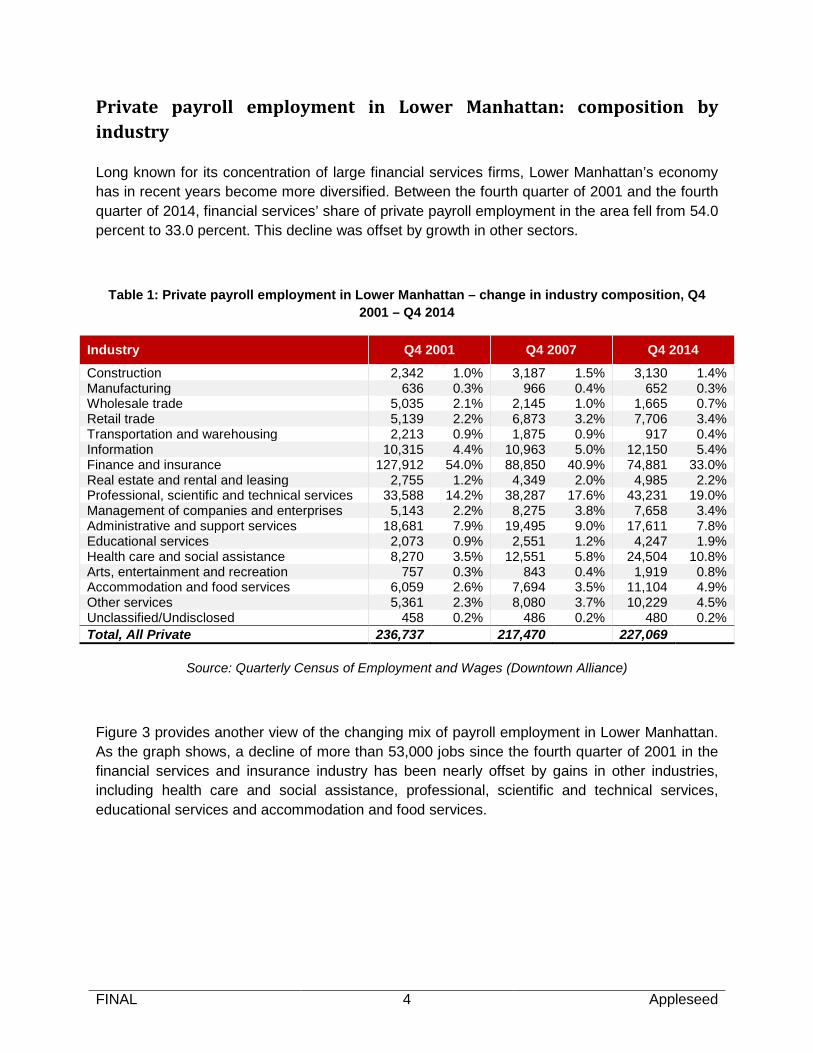
Long known for its concentration of large financial services firms, Lower Manhattan’s economy has in recent years become more diversified. Between the fourth quarter of 2001 and the fourth quarter of 2014, financial services’ share of private payroll employment in the area fell from 54.0 percent to 33.0 percent. This decline was offset by growth in other sectors.
Table 1: Private payroll employment in Lower Manhattan – change in industry composition, Q4 2001 – Q4 2014
Industry Q4 2001 Q4 2007 Q4 2014
Construction 2,342 1.0% 3,187 1.5% 3,130 1.4% Manufacturing 636 0.3% 966 0.4% 652 0.3% Wholesale trade 5,035 2.1% 2,145 1.0% 1,665 0.7% Retail trade 5,139 2.2% 6,873 3.2% 7,706 3.4% Transportation and warehousing 2,213 0.9% 1,875 0.9% 917 0.4% Information 10,315 4.4% 10,963 5.0% 12,150 5.4% Finance and insurance 127,912 54.0% 88,850 40.9% 74,881 33.0% Real estate and rental and leasing 2,755 1.2% 4,349 2.0% 4,985 2.2% Professional, scientific and technical services 33,588 14.2% 38,287 17.6% 43,231 19.0% Management of companies and enterprises 5,143 2.2% 8,275 3.8% 7,658 3.4% Administrative and support services 18,681 7.9% 19,495 9.0% 17,611 7.8% Educational services 2,073 0.9% 2,551 1.2% 4,247 1.9% Health care and social assistance 8,270 3.5% 12,551 5.8% 24,504 10.8% Arts, entertainment and recreation 757 0.3% 843 0.4% 1,919 0.8% Accommodation and food services 6,059 2.6% 7,694 3.5% 11,104 4.9% Other services 5,361 2.3% 8,080 3.7% 10,229 4.5% Unclassified/Undisclosed 458 0.2% 486 0.2% 480 0.2% Total, All Private 236,737 217,470 227,069
Source: Quarterly Census of Employment and Wages (Downtown Alliance)
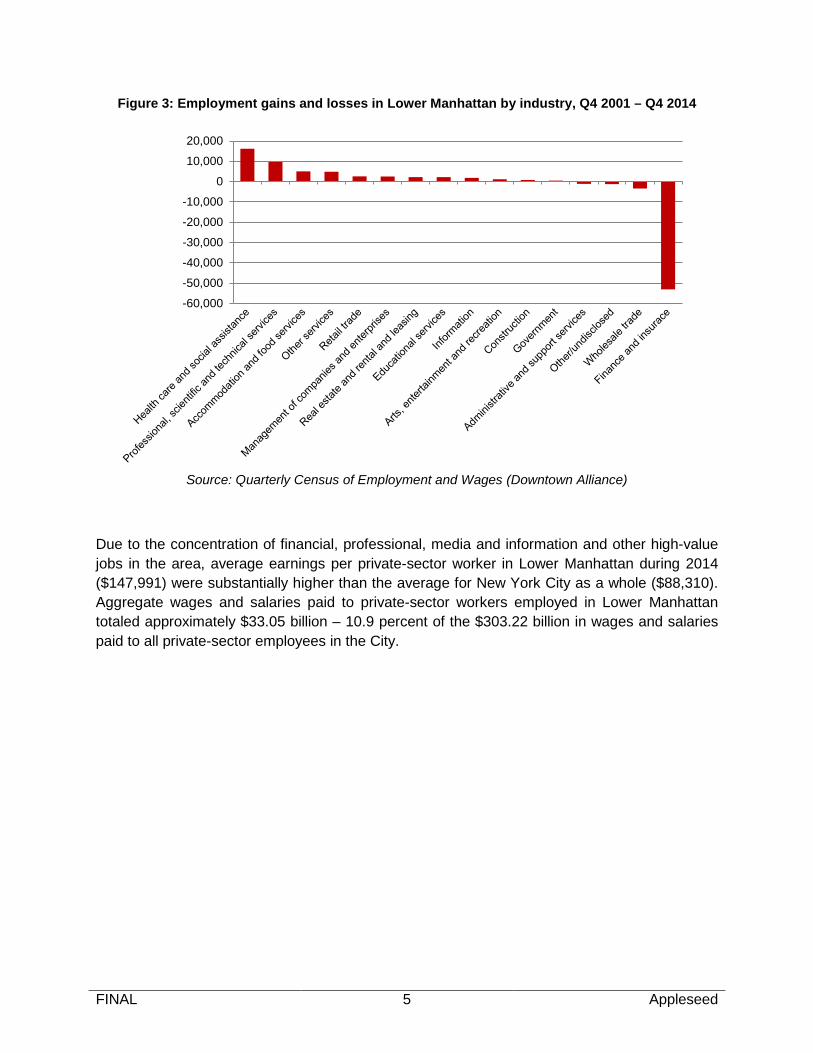
Figure 3 provides another view of the changing mix of payroll employment in Lower Manhattan. As the graph shows, a decline of more than 53,000 jobs since the fourth quarter of 2001 in the financial services and insurance industry has been nearly offset by gains in other industries, including health care and social assistance, professional, scientific and technical services, educational services and accommodation and food services.
FINAL 5 Appleseed
Figure 3: Employment gains and losses in Lower Manhattan by industry, Q4 2001 – Q4 2014
Source: Quarterly Census of Employment and Wages (Downtown Alliance)
Due to the concentration of financial, professional, media and information and other high-value jobs in the area, average earnings per private-sector worker in Lower Manhattan during 2014 ($147,991) were substantially higher than the average for New York City as a whole ($88,310). Aggregate wages and salaries paid to private-sector workers employed in Lower Manhattan totaled approximately $33.05 billion – 10.9 percent of the $303.22 billion in wages and salaries paid to all private-sector employees in the City.
-60,000
-50,000
-40,000
-30,000
-20,000
-10,000
0
10,000
20,000

FINAL 6 Appleseed
Figure 4: Average annual earnings per private-sector worker, by job location, 2014
Source: Quarterly Census of Employment and Wages (Downtown Alliance and BLS)
However, Lower Manhattan’s high average earnings per worker mask a wide variation across industries. As Table 2 shows, average earnings for 2014 ranged from $29,339 for workers in health and social services and $33,917 for hotel and food service workers to $200,114 in the management of companies and $272,476 in financial services.
Variations in workers’ earnings reflect not only the industries in which they work but also the particular mix of occupations within each industry, and the skills that these occupations require. While data on employment by occupation are generally not available below the county level, national-level data published by the Bureau of Labor Statistics provide a rough guide to the mix of occupations in each of Lower Manhattan’s major industries, and the levels of education that these occupations generally require.
Based on these data, we estimate that as of the fourth quarter of 2014, more than 100,000 of Lower Manhattan’s 227,069 private-sector wage-and-salary jobs were in occupations that do not require more than an associate’s degree.3
3 A more detailed analysis of the occupational mix and educational requirements for new private-sector jobs that will be created in Lower Manhattan between 2014 and 2019 is provided in Part Three.
$147,991
$118,417
$88,310
$0
$20,000
$40,000
$60,000
$80,000
$100,000
$120,000
$140,000
$160,000
Lower Manhattan Manhattan New York City

FINAL 7 Appleseed
Table 2: Average earnings per worker in Lower Manhattan, by industry, 2014
Industry Average earnings
Construction $94,052 Manufacturing $84,558 Wholesale trade $129,165 Retail trade $47,600 Transportation and warehousing $82,427 Information $111,952 Finance and insurance $272,476 Real estate and rental and leasing $119,451 Professional, scientific and technical services $116,474 Management of companies and enterprises $200,114 Administrative and support services $45,422 Educational services $54,298 Health care and social assistance $29,339 Arts, entertainment and recreation $46,389 Accommodation and food services $33,917 Other services $79,374 Government $65,145
Source: Quarterly Census of Employment and Wages (Downtown Alliance)
Proprietors’ employment in Lower Manhattan
Employment in Lower Manhattan is not limited to wage-and-salary workers. It also includes those whom the U.S. Bureau of Economic Analysis (BEA) classifies as proprietors. Such workers can include, for example, sole proprietors of small retail establishments, black car drivers, independently-practicing professionals ranging from accountants and attorneys to physical therapists to personal trainers, independent consultants, and partners in law firms or boutique investment banking firms.
Data on proprietors’ employment is generally not available below the county level. For 2013 (the most recent year for which data are available), BEA reported that there were 399,573 proprietors working in Manhattan – equal to about 15.6 percent of the total number of wage-and-salary workers in the borough. If we assume for purposes of this analysis that the ratio of proprietors to wage-and-salary workers is the same for Lower Manhattan as it is for the borough as a whole, we can estimate that in the fourth quarter of 2014, there were approximately 35,386 proprietors working in Lower Manhattan.
Proprietors’ employment is significant to Lower Manhattan for several reasons.
• Proprietors’ average earnings in Manhattan (approximately $112,600 in 2013) are higher than the average earnings of Manhattan’s wage-and-salary workers (approximately $100,700).

FINAL 8 Appleseed
• Proprietorships represent one of the fastest-growing segments of New York City’s economy. Between 2007 and 2013 (as shown below in Figure 5), the number of proprietors in New York City grew from 875,037 to 1,140,351 – an increase of 30.3 percent in six years. During the same period, employment of proprietors in Manhattan grew by 26.6 percent.
Given the relatively high concentration of financial and professional service workers in Lower Manhattan, it seems reasonable to assume that the average earnings of proprietors working in Lower Manhattan are at least equal to the average for Manhattan as a whole. Based on that assumption, we can estimate that in 2014, proprietors’ earnings in Lower Manhattan totaled $3.98 billion.
Figure 5: Proprietors employment in New York City, 2007 – 2013
Source: U.S. Bureau of Economic Analysis
Construction in Lower Manhattan: A major source of high-quality jobs
QCEW data on construction industry employment generally reflect the location of contractors rather than the location of construction sites. As a result, the data on construction industry employment shown in Table 2 reflect only a portion of construction industry activity in Lower Manhattan.
875,037 918,888 953,977 979,975
1,100,608 1,113,852 1,140,351
315,728 328,445 343,035 349,417 385,067 390,410 399,573
0
200,000
400,000
600,000
800,000
1,000,000
1,200,000
2007 2008 2009 2010 2011 2012 2013
New York City Manhattan

FINAL 9 Appleseed
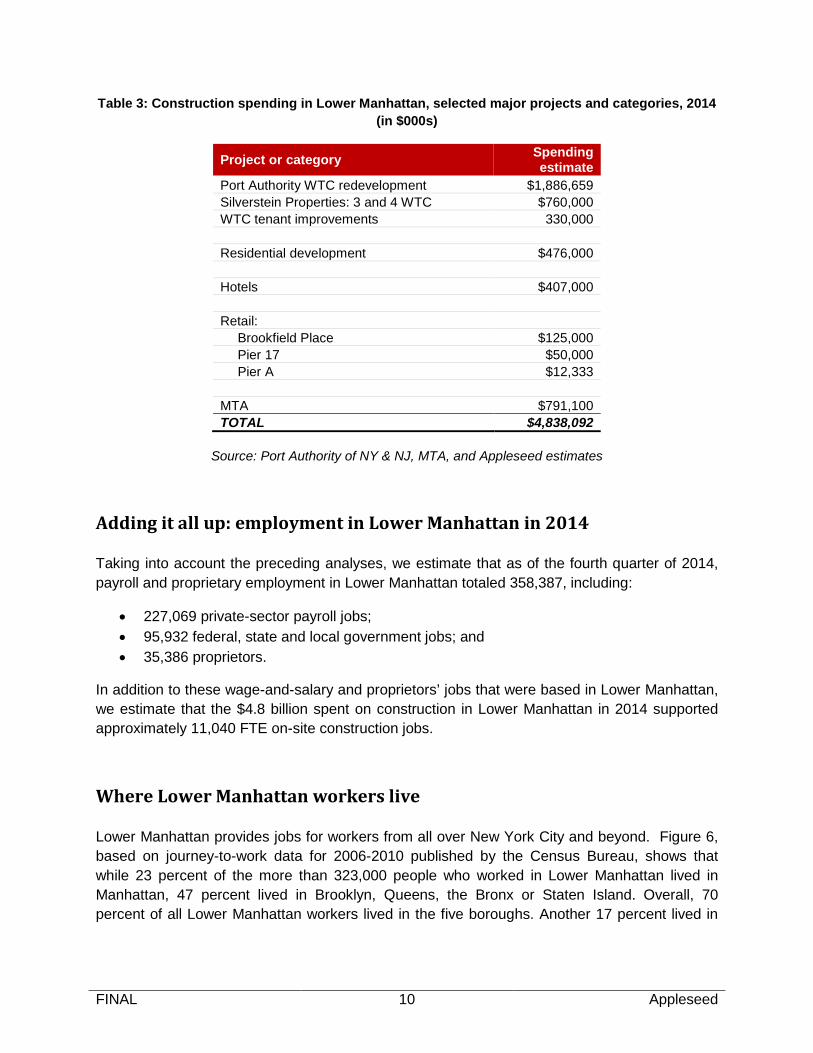
As Table 3 shows, Appleseed estimates that in 2014, total spending on construction projects in Lower Manhattan exceeded $4.8 billion.4 Construction spending in Lower Manhattan accounted for approximately 13.4 percent of City-wide construction spending in 2014. Assuming that “hard costs” (primarily contract construction) account for 80 percent of this spending and “soft costs” (architecture, engineering, environmental consultants, insurance, legal fees, etc.) 20 percent, we estimate that this spending directly supported:
• 12,988 full-time-equivalent (FTE) construction industry jobs in 2014, with aggregate earnings of $1.75 billion; and
• 4,974 FTE jobs in construction-related service industries, with aggregate earnings of $547 million.
If we further assume that on-site work accounted for 85 percent of construction industry employment, we can estimate that construction spending at the World Trade Center, Brookfield Place, South Street Seaport and elsewhere directly supported:
• 11,040 FTE on-site construction jobs in Lower Manhattan in 2014, with aggregate earnings of $1.49 billion; and
• 6,922 FTE off-site jobs in construction (primarily management, administrative and other office jobs), and in construction-related service industries – some located in Lower Manhattan, but many others located elsewhere in the City or the region – with aggregate earnings of $807 million.
Based on the BLS occupational data cited previously, we estimate that approximately 90 percent of all on-site construction employment in Lower Manhattan in 2014 – more than 9,900 FTE jobs – was in occupations requiring no more than an associate’s degree.
4 For the Port Authority and the MTA, estimates of 2014 spending in Lower Manhattan were obtained from those agencies. Estimates for Brookfield Place, Pier 17 and Pier A are based on publicly-reported estimates of the cost of those projects. Estimates of private-sector spending on office, residential and hotel construction were developed by Appleseed, based on square footage and number of units under construction. The $4.8 billion total shown in Table 3 probably understates total construction and related spending in Lower Manhattan in 2014, in that it does not include spending by public agencies other than the Port Authority and the MTA, spending on tenant improvements and other interior renovations, and spending on retail developments smaller than those listed.
FINAL 10 Appleseed
Table 3: Construction spending in Lower Manhattan, selected major projects and categories, 2014 (in $000s)
Project or category Spending estimate
Port Authority WTC redevelopment $1,886,659 Silverstein Properties: 3 and 4 WTC $760,000 WTC tenant improvements 330,000 Residential development $476,000 Hotels $407,000 Retail:
Brookfield Place $125,000 Pier 17 $50,000 Pier A $12,333
MTA $791,100 TOTAL $4,838,092
Source: Port Authority of NY & NJ, MTA, and Appleseed estimates
Adding it all up: employment in Lower Manhattan in 2014
Taking into account the preceding analyses, we estimate that as of the fourth quarter of 2014, payroll and proprietary employment in Lower Manhattan totaled 358,387, including:
• 227,069 private-sector payroll jobs; • 95,932 federal, state and local government jobs; and • 35,386 proprietors.
In addition to these wage-and-salary and proprietors’ jobs that were based in Lower Manhattan, we estimate that the $4.8 billion spent on construction in Lower Manhattan in 2014 supported approximately 11,040 FTE on-site construction jobs.
Where Lower Manhattan workers live
Lower Manhattan provides jobs for workers from all over New York City and beyond. Figure 6, based on journey-to-work data for 2006-2010 published by the Census Bureau, shows that while 23 percent of the more than 323,000 people who worked in Lower Manhattan lived in Manhattan, 47 percent lived in Brooklyn, Queens, the Bronx or Staten Island. Overall, 70 percent of all Lower Manhattan workers lived in the five boroughs. Another 17 percent lived in

FINAL 11 Appleseed
New Jersey, 7 percent on Long Island, 5 percent in the City’s northern suburbs, and 1 percent elsewhere.
Figure 6: Where Lower Manhattan workers live in the New York metropolitan area
Source: CTTP data, based on 2006-2010 5-Year ACS data
In some sectors of the Lower Manhattan economy, the percentage of workers who lived in the five boroughs was higher.
• Among those employed in wholesale and retail trade, transportation and utilities, 77 percent lived in the City, including 59 percent who lived in the boroughs outside Manhattan;
• Among those employed in the arts, entertainment, restaurants and hotels, 90 percent lived in the City, including 61 percent who lived in the boroughs outside Manhattan; and
• Among those employed in other services and government, 75 percent lived in the City, including 55 percent who lived in the boroughs outside Manhattan.
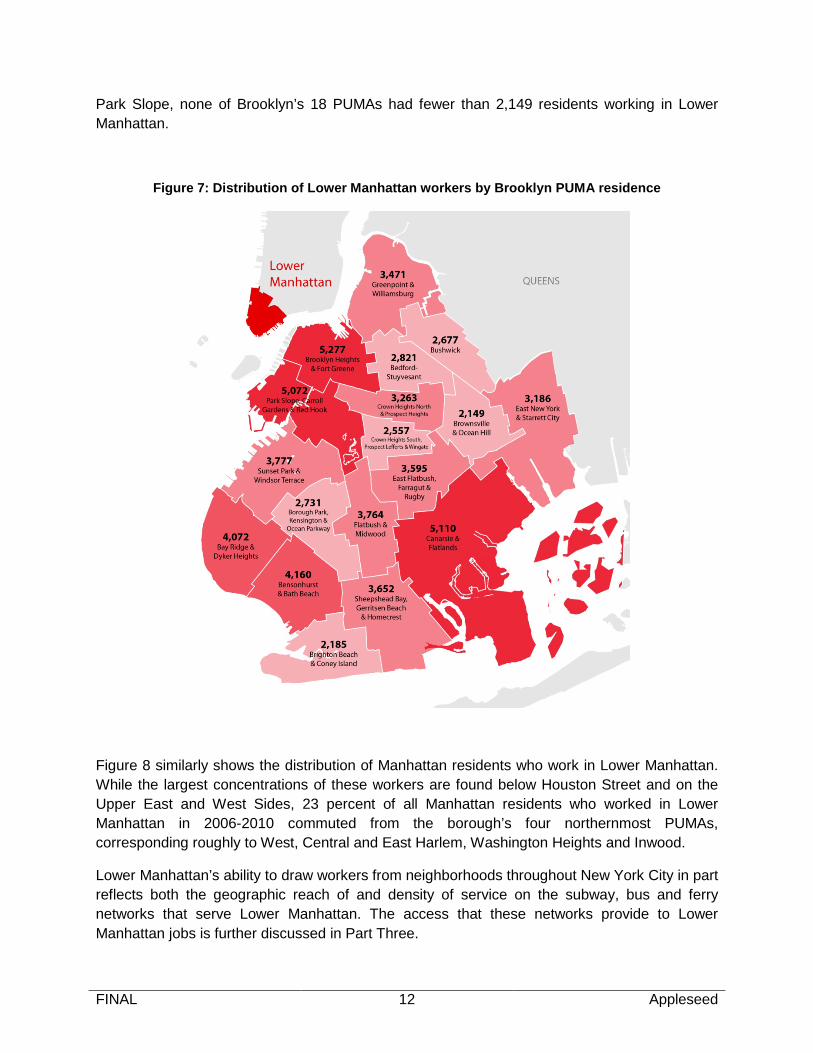
Lower Manhattan’s role in providing employment opportunities for people from neighborhoods throughout the City is perhaps even more evident when we focus on the communities within each borough where Lower Manhattan workers live. Figure 7 shows the estimated number of residents of each of Brooklyn’s 18 PUMAs (Public Use Microdata Areas, Census Bureau-defined areas that in New York City correspond roughly to community board districts) who worked in Lower Manhattan in 2006-2010. While there were particularly large concentrations of Lower Manhattan workers in neighborhoods such as Brooklyn Heights, Dumbo, Cobble Hill and
Manhattan 73,954 23%
Brooklyn 63,519 20%
Queens 51,218 16% Bronx
22,830 7%
Staten Island 13,792
4%
Long Island 22,597
7%
Westchester/ Rockland/ Putnam/ Fairfield 16,238
5%
New Jersey 54,536 17%
Other 4,434 1%
FINAL 12 Appleseed
Park Slope, none of Brooklyn’s 18 PUMAs had fewer than 2,149 residents working in Lower Manhattan.
Figure 7: Distribution of Lower Manhattan workers by Brooklyn PUMA residence
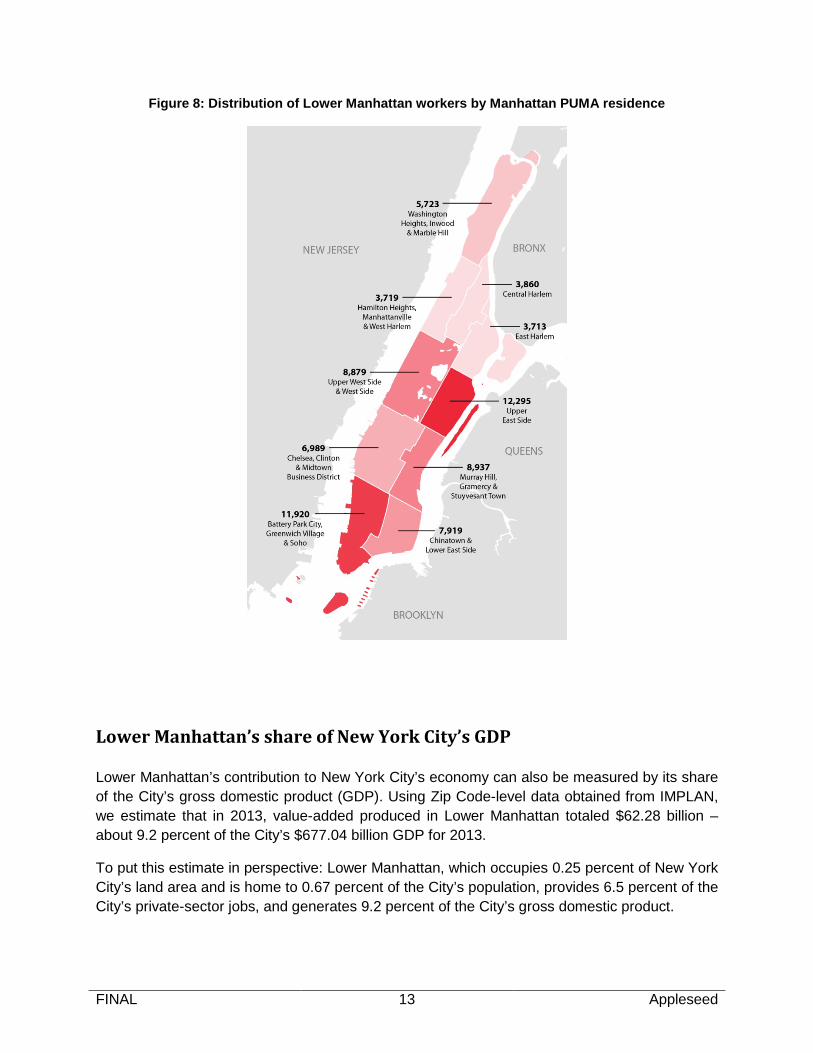
Figure 8 similarly shows the distribution of Manhattan residents who work in Lower Manhattan. While the largest concentrations of these workers are found below Houston Street and on the Upper East and West Sides, 23 percent of all Manhattan residents who worked in Lower Manhattan in 2006-2010 commuted from the borough’s four northernmost PUMAs, corresponding roughly to West, Central and East Harlem, Washington Heights and Inwood.
Lower Manhattan’s ability to draw workers from neighborhoods throughout New York City in part reflects both the geographic reach of and density of service on the subway, bus and ferry networks that serve Lower Manhattan. The access that these networks provide to Lower Manhattan jobs is further discussed in Part Three.
FINAL 13 Appleseed
Figure 8: Distribution of Lower Manhattan workers by Manhattan PUMA residence
Lower Manhattan’s share of New York City’s GDP
Lower Manhattan’s contribution to New York City’s economy can also be measured by its share of the City’s gross domestic product (GDP). Using Zip Code-level data obtained from IMPLAN, we estimate that in 2013, value-added produced in Lower Manhattan totaled $62.28 billion – about 9.2 percent of the City’s $677.04 billion GDP for 2013.
To put this estimate in perspective: Lower Manhattan, which occupies 0.25 percent of New York City’s land area and is home to 0.67 percent of the City’s population, provides 6.5 percent of the City’s private-sector jobs, and generates 9.2 percent of the City’s gross domestic product.

FINAL 14 Appleseed
Figure 9: Value added (gross regional product) in Lower Manhattan and New York City, 2013 (in $ millions)
Source: IMPLAN Group, LLC, IMPLAN System (data and software)
Lower Manhattan’s contribution to City and State revenues
In addition to being a leading (and growing) source of employment opportunities for New York City residents, Lower Manhattan is a major contributor to New York City and New York State tax revenues.
Lower Manhattan’s contribution to New York City tax revenues
Real property tax revenues
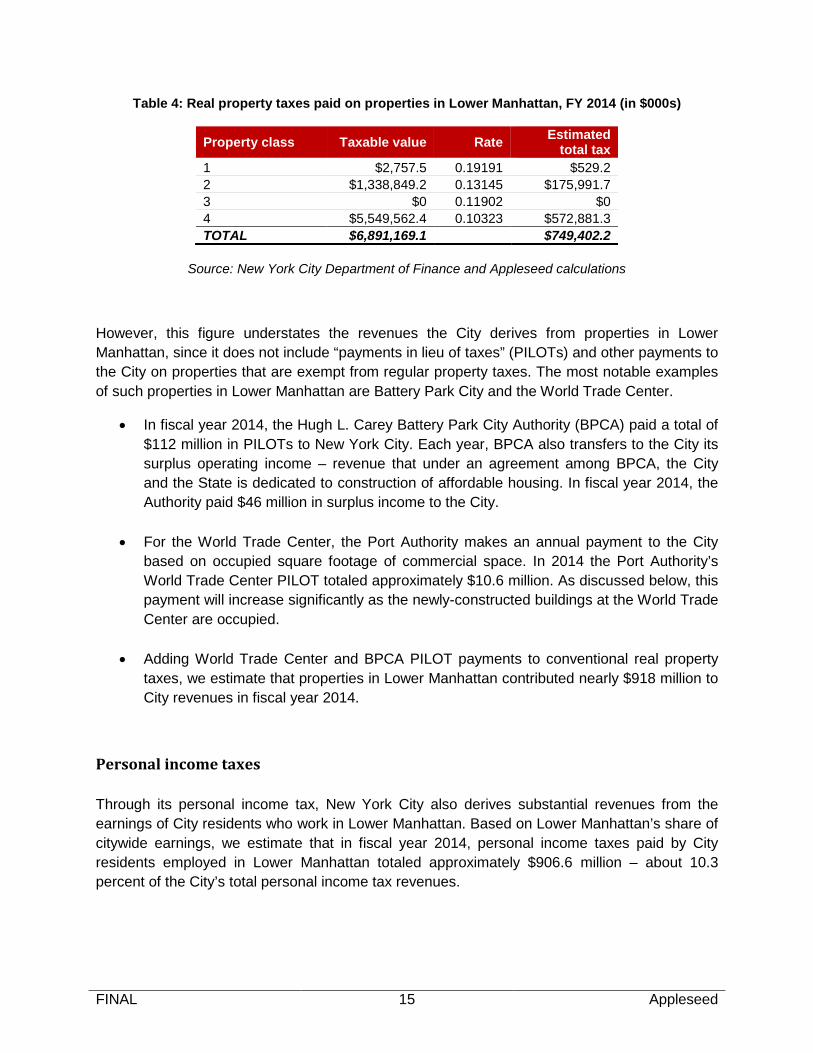
Based on data obtained from the New York City Department of Finance, we estimate that in fiscal year 2014, the taxable assessed value of all real property in Lower Manhattan totaled more than $6.463 billion – about 3.76 percent of the total taxable value of all property in New York City. Applying to this total the City’s fiscal year 2014 tax rates for each class of property, we estimate (as shown below in Table 4) that real property taxes paid in fiscal year 2014 on properties in Lower Manhattan totaled $749.4 million.
$62,284.1
$677,043.3
$0.0
$100,000.0
$200,000.0
$300,000.0
$400,000.0
$500,000.0
$600,000.0
$700,000.0
$800,000.0
Lower Manhattan New York City
FINAL 15 Appleseed
Table 4: Real property taxes paid on properties in Lower Manhattan, FY 2014 (in $000s)
Property class Taxable value Rate Estimated total tax
1 $2,757.5 0.19191 $529.2 2 $1,338,849.2 0.13145 $175,991.7 3 $0 0.11902 $0 4 $5,549,562.4 0.10323 $572,881.3 TOTAL $6,891,169.1 $749,402.2
Source: New York City Department of Finance and Appleseed calculations
However, this figure understates the revenues the City derives from properties in Lower Manhattan, since it does not include “payments in lieu of taxes” (PILOTs) and other payments to the City on properties that are exempt from regular property taxes. The most notable examples of such properties in Lower Manhattan are Battery Park City and the World Trade Center.
• In fiscal year 2014, the Hugh L. Carey Battery Park City Authority (BPCA) paid a total of $112 million in PILOTs to New York City. Each year, BPCA also transfers to the City its surplus operating income – revenue that under an agreement among BPCA, the City and the State is dedicated to construction of affordable housing. In fiscal year 2014, the Authority paid $46 million in surplus income to the City.
• For the World Trade Center, the Port Authority makes an annual payment to the City based on occupied square footage of commercial space. In 2014 the Port Authority’s World Trade Center PILOT totaled approximately $10.6 million. As discussed below, this payment will increase significantly as the newly-constructed buildings at the World Trade Center are occupied.
• Adding World Trade Center and BPCA PILOT payments to conventional real property taxes, we estimate that properties in Lower Manhattan contributed nearly $918 million to City revenues in fiscal year 2014.
Personal income taxes
Through its personal income tax, New York City also derives substantial revenues from the earnings of City residents who work in Lower Manhattan. Based on Lower Manhattan’s share of citywide earnings, we estimate that in fiscal year 2014, personal income taxes paid by City residents employed in Lower Manhattan totaled approximately $906.6 million – about 10.3 percent of the City’s total personal income tax revenues.

FINAL 16 Appleseed
Business and banking taxes
It is difficult to attribute business and banking taxes paid by companies and financial institutions in New York City to specific locations within the City. Yet it is clear that Lower Manhattan, with the second-largest concentration of business and financial activity in New York City, accounts for a significant share of these revenues. To simplify our analysis, we allocate to Lower Manhattan a share of the City’s bank tax revenues equivalent to its share of financial services employment; and a share of corporation and unincorporated business taxes equivalent to its share of non-financial private-sector employment.
In 2014, Lower Manhattan accounted for 19.8 percent of all private payroll employment in banking in New York City. Based on this share, we estimate that financial institutions in Lower Manhattan paid approximately $240 million in bank taxes in fiscal year 2014.
During the same period, Lower Manhattan accounted for 6.14 percent of all non-bank private-sector employment in the City. Based on this share, we estimate that businesses in Lower Manhattan paid approximately $272.0 million in corporation and unincorporated business taxes in fiscal year 2014.
Sales taxes
Taxable sales transactions in Lower Manhattan also generate tax revenues for New York City. For this analysis, we begin with the Downtown Alliance’s estimate of 4,396,542 square feet of retail space in Lower Manhattan. We assume that 60 percent of this space is occupied by retailers, 25 percent by restaurants and 15 percent by service businesses. We further assume that sales per square foot average $500.00; and that 100 percent of restaurant, 65 percent of retail and 50 percent of service business sales are taxable.
The results of this analysis are shown below in Table 5. We estimate that in fiscal year 2014, retail, restaurant and service businesses occupying retail space in Lower Manhattan generated $70.7 million in City sales taxes.
Table 5: Sales taxes generated by businesses occupying retail space in Lower Manhattan, FY 2014 (in $000s)
Square footage Sales Taxable
sales City sales
tax Retail stores 2,637,925 $1,318,962.5 $857,325.6 $38,579.6 Restaurants 1,099,136 $549,568.0 $549,568.0 $24,730.6 Services 659,481 $329,740.5 $164,870.3 $7,419.2 TOTAL 4,396,542 $2,198,271.0 $1,571,763.9 $70,729.4
Sources: NYC Office of Management and Budget, NYC Department of Finance and Appleseed calculations
FINAL 17 Appleseed
Hotel taxes
In addition to paying real property and taxes and generating personal income taxes from the salaries and wages paid to their employees, hotels in Lower Manhattan provide revenues for New York City through taxes paid on hotel rooms. These include the City’s regular sales tax of 4.5 percent, and an additional hotel tax of 5.875 percent. Based on average room charges and occupancy rates in Lower Manhattan hotels, we estimate that in fiscal year 2014, New York City collected approximately $41.5 million in sales and hotel taxes from hotels in Lower Manhattan.
Summing up
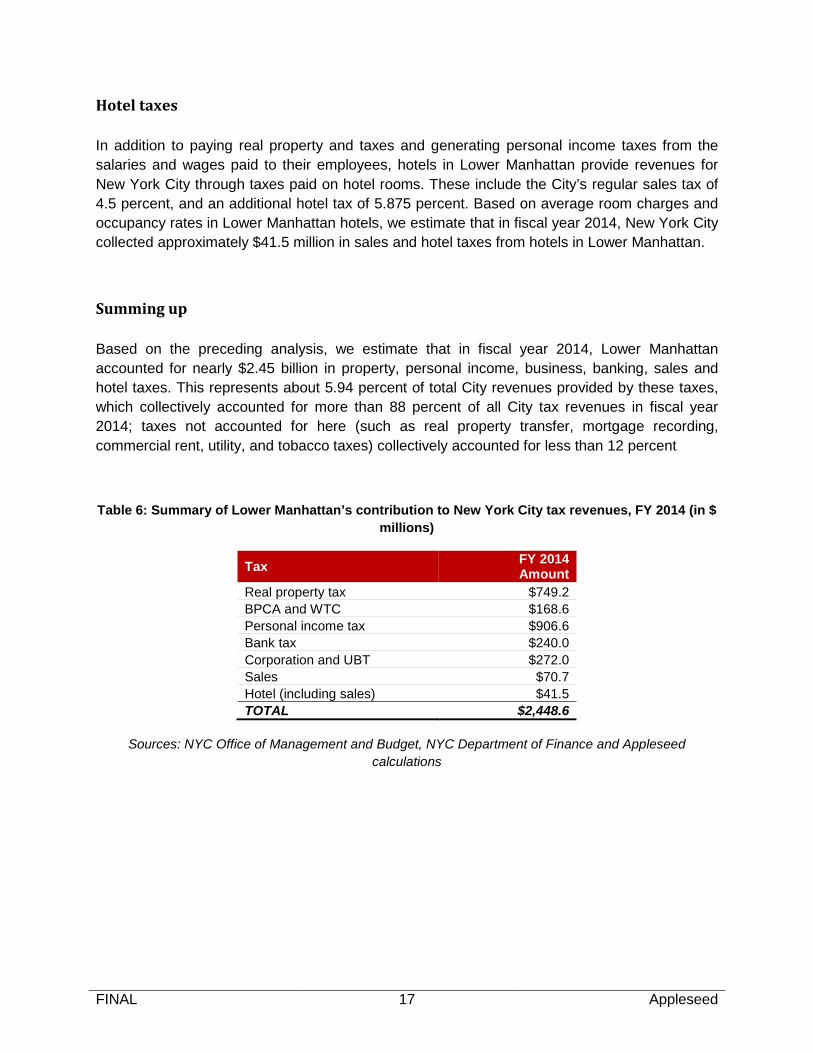
Based on the preceding analysis, we estimate that in fiscal year 2014, Lower Manhattan accounted for nearly $2.45 billion in property, personal income, business, banking, sales and hotel taxes. This represents about 5.94 percent of total City revenues provided by these taxes, which collectively accounted for more than 88 percent of all City tax revenues in fiscal year 2014; taxes not accounted for here (such as real property transfer, mortgage recording, commercial rent, utility, and tobacco taxes) collectively accounted for less than 12 percent
Table 6: Summary of Lower Manhattan’s contribution to New York City tax revenues, FY 2014 (in $ millions)
Tax FY 2014 Amount
Real property tax $749.2 BPCA and WTC $168.6 Personal income tax $906.6 Bank tax $240.0 Corporation and UBT $272.0 Sales $70.7 Hotel (including sales) $41.5 TOTAL $2,448.6
Sources: NYC Office of Management and Budget, NYC Department of Finance and Appleseed calculations
FINAL 18 Appleseed
Lower Manhattan’s contribution to New York State tax revenues
Personal income taxes
To a much greater extent than New York City, New York State depends primarily on a single tax; in fiscal year 2014, the personal income tax accounted for 63 percent of New York State tax revenues. Because the State taxes workers’ incomes at higher rates and because workers who live outside New York City are also subject to the State tax, Lower Manhattan generates substantially more in New York State personal income tax revenues than in City personal income tax revenues.
We estimate that in fiscal year 2014, the wages and salaries paid to workers employed in Lower Manhattan generated nearly $1.936 billion in New York State personal income taxes – about 4.51 percent of statewide personal income tax revenues.
Bank, insurance and corporation taxes
As with New York City’s bank, corporation and unincorporated business taxes, we attributed to Lower Manhattan a share of New York State’s bank and insurance taxes and corporate franchise tax equal to the areas share of statewide payroll employment in banking (11.29 percent) and insurance (8.84 percent), and private payroll employment other than banking and insurance (2.68 percent). We estimate that in fiscal year 2014, Lower Manhattan accounted for $391.4 million in New York State banking and insurance taxes, and $76.4 million in State corporate franchise taxes.
Sales taxes
Using the same estimate of store-based retail, restaurant and service business sales we used in calculating City sales taxes, we estimate that in fiscal year 2014, New York State sales taxes derived from sales in Lower Manhattan (including the portion of the sales tax dedicated to the MTA) totaled nearly $68.8 million.
Hotel taxes
The New York State sales tax is also applied to hotel room charges, along with an additional tax of $1.50 per room-night. Based on the same data used in calculating City taxes, we estimate that in fiscal year 2014, hotels in Lower Manhattan paid more than $19.4 million in State sales and hotel taxes.

FINAL 19 Appleseed
Summing up
Based on the preceding analysis, we estimate that in fiscal year 2014, Lower Manhattan accounted for nearly $2.4 billion in New York State personal income, corporate, banking and insurance, sales and hotel taxes. This represents about 3.87 percent of total State revenues provided by these taxes (which collectively account for nearly 91 percent of all New York State tax revenues).
Table 7: Summary of Lower Manhattan’s contribution to New York State tax revenues, FY 2014 (in $ millions)
Tax FY 2014 Amount
Personal income tax $1,935.8 Bank and insurance taxes $295.9 Corporate franchise tax $74.6 Sales $68.8 Hotel (including sales) $19.4 TOTAL $2,394.5
Sources: New York State Budget Division and Appleseed calculations

FINAL 20 Appleseed
Part Two: Contributing to the growth of New York City’s economy
Since 2002, major developments in Lower Manhattan – including the redevelopment of the World Trade Center site, the revitalization of Brookfield Place, new hotels, new residential development, investments in mass transit, and new schools and other community facilities – have laid the groundwork for sustained economic growth. In part as a result of these investments, Lower Manhattan will during the next several years be a major contributor to the growth of New York City’s economy. Growth in Lower Manhattan is likely to be driven by several factors.
Continued growth of New York City’s economy
Both the New York City Office of Management and Budget (OMB) and the City’s Independent Budget Office (IBO) have forecast continued job growth in New York City through 2019, although the rate of growth is expected to taper off gradually. As shown below in Figure 10, OMB expects employment to increase by 281,000 jobs during the forecast period, while IBO forecasts an increase of 318,800.
Figure 10: Projections for new job growth in New York City, 2014-2019 (in thousands)
Source: New York City Independent Budget Office
120.7
88.2 75.1
60.0 50.0
45.5
121.0
67.0 62.0 56.0
49.0 47.0
0.0
20.0
40.0
60.0
80.0
100.0
120.0
140.0
2014 2015 2016 2017 2018 2019
IBO OMB

FINAL 21 Appleseed
Lower Manhattan has in recent years demonstrated its attractiveness to some of the fastest-growing sectors of the City’s economy, including professional and business services, technology and media. This suggests that the area is well-positioned to capture a significant share of new growth through 2019.
Construction of new office space
Lower Manhattan’s ability to attract and grow office-based businesses will be enhanced by the addition of several million square feet of high-quality, technologically advanced office space at the World Trade Center. As Table 8 shows, 1 and 4 World Trade Center – both of which became available for occupancy in the fall of 2014 – include a total of 5.34 million rentable square feet of office space, of which about 63 percent was leased as of the second quarter of 2015.
In addition to buildings 1 and 4, 3 World Trade Center, with about 2.5 million rentable square feet of office space, is scheduled for completion and initial occupancy in 2018. Depending on the outcome of negotiations between Silverstein Properties Inc. and News Corporation/20th Century Fox, 2 World Trade Center – the last of the four office towers to be constructed on the original World Trade Center site – could be completed and ready for occupancy as early as 2020.
Table 8: Office space at buildings 1 through 4, World Trade Center (square feet in thousands)
Building Completed Rentable sq ft Notable tenants Available
sq ft 1 World Trade Center 2014 3,038 Conde Nast, GSA Vantone 1,086 4 World Trade Center 2014 2,300 PANYNJ, HRA, MediaMath 874 3 World Trade Center 2018 2,500 Group M 1,975 2 World Trade Center 2020 2,800 TBD N/A
Assuming that 1 and 4 World Trade Center will be approximately 90 percent occupied in 2019, and 3 World Trade Center approximately 60 percent occupied, we estimate that in 2019, the three towers will have a total of roughly 6.3 million square feet of occupied office space.
Using published estimates of number of people who will be employed by major tenants that have moved or will be moving into the World Trade Center, and assuming an average of 4.5 jobs per 1,000 square feet of occupied space for other new tenants, we estimate that by the end
FINAL 22 Appleseed
of 2019, World Trade Center tenants will have increased the number of people employed in office-based industries in Lower Manhattan by approximately 17,900.5
In addition to tenants who will be occupying newly-developed office space at the World Trade Center, other tenants will be moving into existing Lower Manhattan office space during the next five years. Major tenants who will be moving to the area from elsewhere in Manhattan include Time Inc. and Hudson’s Bay Company (both moving to Brookfield Place) and Macmillan Science and Education (moving to 1 New York Plaza). According to published estimates, these three companies will be moving a combined total of more than 6,000 jobs to Lower Manhattan.
Taking into account completion and partial occupancy of three of the World Trade Center’s four towers, the attraction of major new tenants to existing office space, and continued growth of employment in business and professional services, technology and media, we estimate that between the fourth quarter of 2014 and the end of 2019, the number of people working in office-based industries in Lower Manhattan will increase by 25,400.
In addition jobs in office-based industries, we estimate – based on jobs-per-1,000-square-feet ratios for other high-end office buildings now being developed in Manhattan – that development and occupancy of new and existing office space in Lower Manhattan will support the creation of approximately 750 jobs in building services.
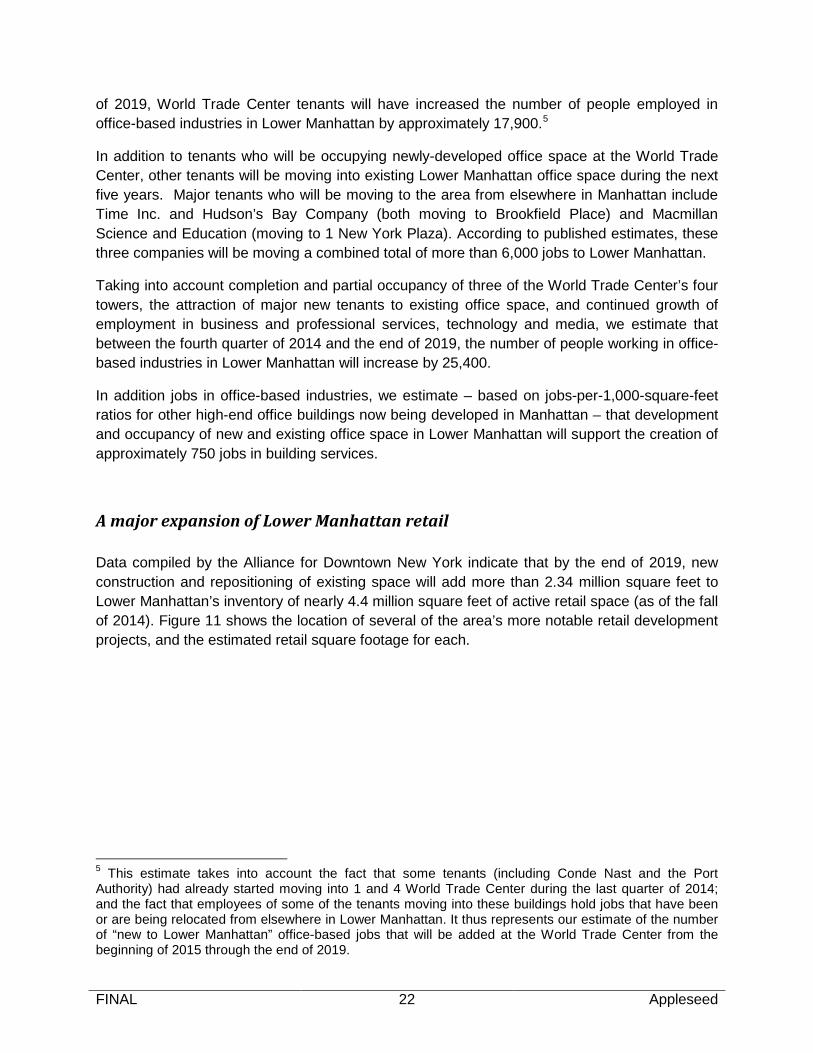
A major expansion of Lower Manhattan retail
Data compiled by the Alliance for Downtown New York indicate that by the end of 2019, new construction and repositioning of existing space will add more than 2.34 million square feet to Lower Manhattan’s inventory of nearly 4.4 million square feet of active retail space (as of the fall of 2014). Figure 11 shows the location of several of the area’s more notable retail development projects, and the estimated retail square footage for each.
5 This estimate takes into account the fact that some tenants (including Conde Nast and the Port Authority) had already started moving into 1 and 4 World Trade Center during the last quarter of 2014; and the fact that employees of some of the tenants moving into these buildings hold jobs that have been or are being relocated from elsewhere in Lower Manhattan. It thus represents our estimate of the number of “new to Lower Manhattan” office-based jobs that will be added at the World Trade Center from the beginning of 2015 through the end of 2019.
FINAL 23 Appleseed
Figure 11: Location of major retail development projects in Lower Manhattan
For this analysis, we have assumed that as of the end of 2019, this new or repositioned space will be 95 percent occupied, with retail stores taking 60 percent of the occupied space, restaurants 25 percent, and other service businesses (hair stylists, dry cleaners, etc.) taking 15 percent.
Based on ratios of 3.5 jobs per 1,000 square feet for retailers and service businesses and 7.0 for restaurants, we estimate that as of the end of 2019, this new and repositioned space will support approximately 4,620 additional retail jobs, 3,850 additional restaurant jobs and 1,105 additional jobs in other service businesses.
FINAL 24 Appleseed
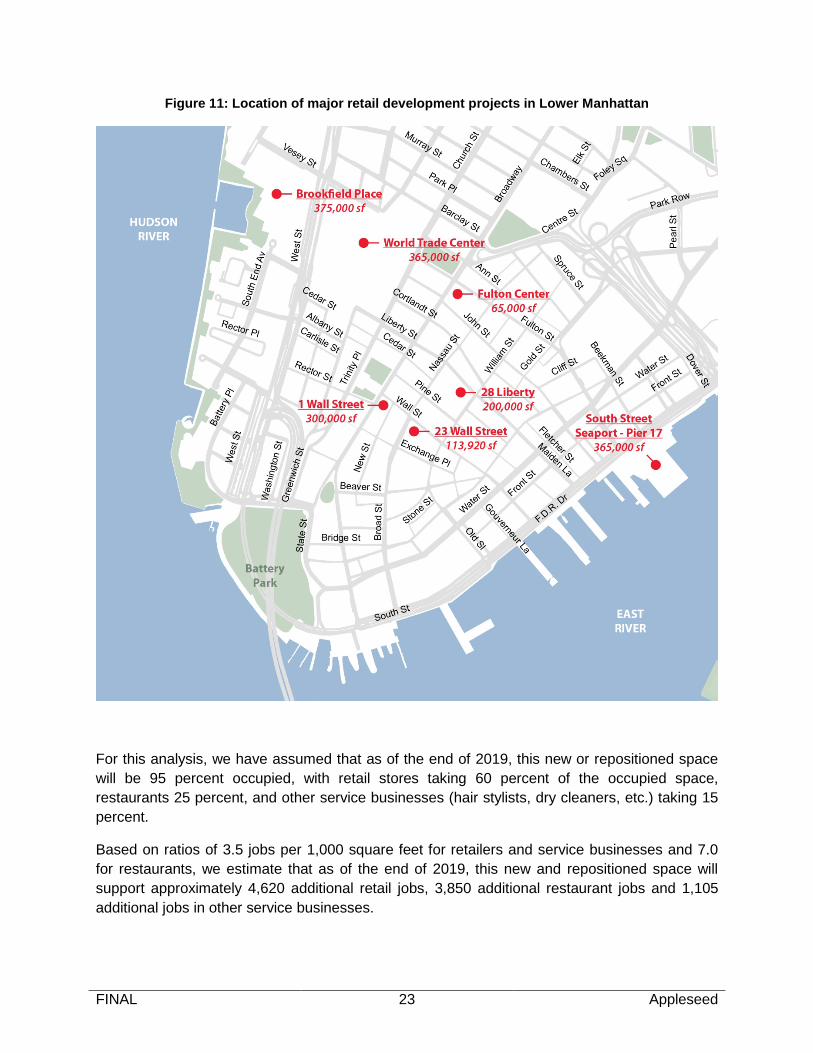
New hotel development
According to data compiled by the Alliance for Downtown New York, as of the third quarter of 2015 there were 23 new hotels scheduled to open in Lower Manhattan from 2015 through 2018, with a total of 3,941 rooms. Sixteen of these hotels were in various stages of construction in the third quarter of 2015, and six more were planned. Figure 12 shows the names and locations of the 23 hotels now in construction or being planned.
Figure 12: Location of new hotels in Lower Manhattan

FINAL 25 Appleseed
For this analysis, we assume that these new hotels will employ an average of 0.6 workers per room. This is slightly lower than the 0.7 employee-per-room average for all Manhattan hotels, reflecting our assumption that a somewhat larger share of the new hotel rooms being added in Lower Manhattan will be oriented primarily to tourists and business travelers rather than luxury hotel guests. Based on these assumptions, we estimate that by the end of 2019, new hotels that will have opened since the end of 2014 will add approximately 2,365 jobs to hotel industry employment in Lower Manhattan.
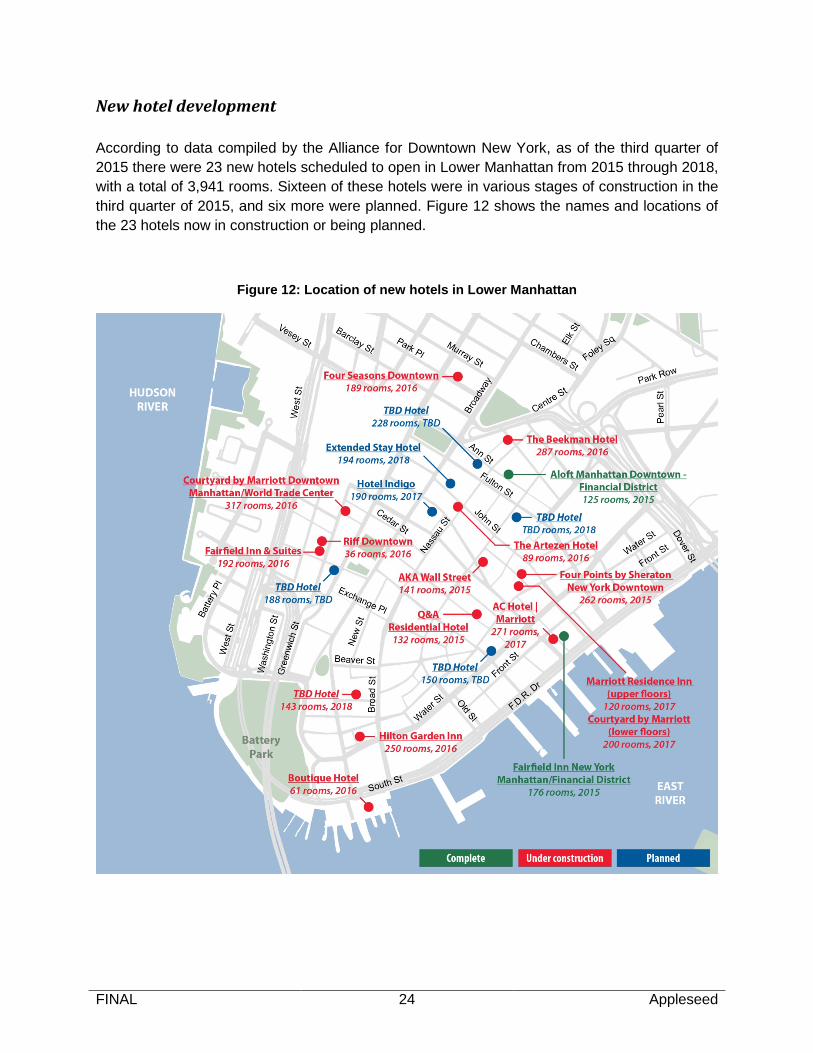
New residential development
Further residential development will also add to the vitality and diversity of Lower Manhattan’s economy. The Alliance for Downtown New York reports that as of the third quarter of 2015, there were 31 residential buildings scheduled for completion from 2015 through 2018, with a total of 5,227 units. These included 20 new construction projects with a total of more than 2,341 units, and 11 office building conversions with a total of more than 2,866 units. Figure 13 shows the location of residential projects now under construction or planned.
New residential development contributes in several ways to the vitality of Lower Manhattan’s economy.
• It enables the area to accommodate larger numbers of the highly-educated workers who help make Lower Manhattan an increasingly attractive location for employers in high-value industry, and reinforces the “live-work” character of the community.
• It supports job growth in industries that serve this growing resident population, including retail, restaurants, and personal services. (This growth is already reflected in the development projections cited above.) It will also increase demand for education, health and social services. We estimate that increased demand for such services will support approximately 1,000 additional jobs in Lower Manhattan by the end of 2019.
• Based on jobs-per-1,000-square-feet ratios for other residential buildings now being developed in New York City, we estimate that new residential development in Lower Manhattan between 2015 and 2019 will support the creation of approximately 310 jobs in building services, for doormen, porters, handymen and superintendents.
FINAL 26 Appleseed
Figure 13: Location of new residential development projects in Lower Manhattan

FINAL 27 Appleseed
Growth in visitor traffic
During the next five years Lower Manhattan will also benefit economically from continued growth in the number of visitors coming to the area. Audience Research & Analysis (ARA) has estimated that 12.4 million people visited various sites in Lower Manhattan in 2014. In surveys conducted for the Alliance for Downtown New York, ARA found that more than 88 percent of these visitors came from outside New York City, and 84 percent from outside the New York metropolitan area.
During the next five years the number of visitors to Lower Manhattan, the length of time they stay in the area and how much they spend are all likely to increase, for several reasons.
• Although the strengthening of the dollar against the euro and several other major currencies is likely to slow the strong growth in international visitor traffic that New York City has experienced in recent years, the City is nevertheless likely to see some continued growth in visitor traffic.
• The 9-11 Museum and One World Observatory are likely to draw increased numbers of visitors to Lower Manhattan. (The Museum was open only for the last seven months of 2014, and the Observatory opened in 2015.) In addition to increasing the number of unique visitors to Lower Manhattan, these major attractions are also likely to increase the amount of time (and money) visitors spend in Lower Manhattan.
• New retail developments at the World Trade Center, Brookfield Place, South Street Seaport and elsewhere, and the opening of new restaurants, will enhance Lower Manhattan’s attractiveness as a destination, both for New York-area residents and for visitors to New York City.
• Completion and tenanting of 1, 3 and 4 World Trade Center will increase the number of business travelers coming to Lower Manhattan; and a growing residential population will increase the number of “friends and family” visitors.
• The addition of more than 3,900 hotel rooms will increase the number of overnight visitors to New York City who stay in Lower Manhattan.
Most of the impact of increased visitor traffic is already accounted for in our estimates of the growth of retail, restaurant and hotel employment. We estimate that employment in Lower Manhattan in other visitor-oriented sectors – notably the arts, entertainment and recreation – will increase by 1,000 by the end of 2019.
As shown below in Table 9, we estimate that the developments described above will result in the addition of 40,400 jobs to Lower Manhattan’s employment base between the fourth quarter

FINAL 28 Appleseed
of 2014 and the end of 2019.6 This equates to an average annual increase of approximately 2.4 percent – well above the average annual growth rate projected by either the Office of Management and Budget (1.3 percent) or the Independent Budget Office (1.5 percent) for New York City as a whole. Viewing this increase in the context of Lower Manhattan’s recent history provides some further perspective. The 40,000 private-sector jobs we estimate will be added between the fourth quarter of 2014 and the end of 2019 is 82 percent greater than the 21,941 jobs that Lower Manhattan added between 2009 and 2014.
Table 9: Total payroll employment by industry in Lower Manhattan, Q4 2014 & 2019 Projections
Industry Q4 2014 Jobs Added 2019 Projections
Construction 3,130 1.0% 0 3,130 0.9% Manufacturing 652 0.2% 0 652 0.2% Wholesale trade 1,665 0.5% 500 2,165 0.6% Retail trade 7,706 2.4% 4,620 12,326 3.4% Transportation and warehousing 917 0.3% 0 917 0.3% Information 12,150 3.8% 9,000 21,150 5.8% Finance and insurance 74,881 23.2% 2,000 76,881 21.2% Real estate and rental and leasing 4,985 1.5% 500 5,485 1.5% Professional, scientific and technical services 43,231 13.4% 8,000 51,231 14.1% Management of companies and enterprises 7,658 2.4% 3,000 10,658 2.9% Administrative and support services 17,611 5.5% 1,000 18,611 5.1% Educational services 4,247 1.3% 500 4,747 1.3% Health care and social assistance 24,504 7.6% 500 25,004 6.9% Arts, entertainment and recreation 1,919 0.6% 1,000 2,919 0.8% Food services and drinking places 7,933 2.5% 3,850 11,783 3.2% Traveler accommodation 3,171 1.0% 2,365 5,536 1.5% Other services* 10,229 3.2% 3,165 13,394 3.7% Unclassified/Undisclosed 480 0.1% 0 480 0.1% Government 95,932 29.7% 400 96,332 26.5% Total, Private 227,069 70.3% 40,000 267,069 73.5% Total, All 323,001 40,400 363,401
*This includes 1,000 office-based jobs, 1,105 personal service jobs, and 1,060 building services jobs.
Sources: Quarterly Census of Employment and Wages (Downtown Alliance) and Appleseed estimates
6 Because our estimate of the number of jobs that will be added in Lower Manhattan through the end of 2019 is based in part on the volume of new office and retail space that will be coming on line during that period, it is likely to include proprietors – for example, owners of small retail businesses – as well as wage-and salary employees. Nevertheless, because the latter category is likely to account for most of the jobs added, and because it is easier to allocate payroll employment across industries, for purposes of this analysis we treat all of the added jobs as wage-and-salary jobs.

FINAL 29 Appleseed
Construction in Lower Manhattan: 2015-2019
As in our analysis of employment in Lower Manhattan in 2014, our estimate of total employment in Manhattan in 2019 also needs to take into account on-site construction employment.
The total value of Lower Manhattan construction activity that we are projecting for 2019 is significantly lower than our estimate of the value of Lower Manhattan construction in 2014. We estimate for purposes of this analysis that construction spending in the area will total more than $1.38 billion – about 28 percent of our estimate of total spending on Lower Manhattan construction projects in 2014, which exceeded $4.8 billion. This is so for several reasons.
• After 2015, planned Port Authority spending on construction at the World Trade Center site will decline sharply. In its most recent capital plan, the Port Authority estimates that in 2019 it will spend only $11.945 million on World Trade Center construction.
• Our estimate for 2019 does not include any allowance for MTA capital spending. While there is likely to be at least some investment in the area by the MTA in the years ahead, continuing uncertainty about funding of the agency’s capital program makes it difficult to project how much the MTA might be spending in Lower Manhattan in 2019.
• Our estimates of residential, hotel and retail construction spending in Lower Manhattan in 2019 include only those projects that were publicly announced and “in the pipeline” as of the first quarter of 2015. They do not include any allowance for projects that might be announced in 2015 or afterwards, and that might be under construction in 2019.
• Nor does our estimate of Lower Manhattan construction spending in 2019 include any of the major new projects that could potentially be getting under way by 2019, such as construction of a new building on Site 5 at the World Trade Center, construction of a performing arts center, or construction of a high-rise building at South Street Seaport.
Because it does not include any allowance for the MTA, for projects not yet announced or for which there are no firm plans, it is likely that the total shown in Table 10 significantly understates the value of construction work that will be done in Lower Manhattan in 2019.

FINAL 30 Appleseed
Table 10: Construction spending in Lower Manhattan, by major project or category, 2015-2019 (in $000s)
Project or category Spending estimate
Port Authority WTC redevelopment $11,945 Silverstein Properties: 2 WTC $1,025,000 Residential development $220,000 Hotels $75,500 Retail $50,000
MTA TBD TOTAL $1,382,445
Source: Appleseed estimates
Using the same methodology we used in Part One to estimate on-site construction employment in 2014, we estimate that in 2019, expenditures of more than $1.38 billion would support approximately 3,290 FTE on-site construction jobs in Lower Manhattan.
Contributing to the growth of the City’s GDP
Based on our estimates of job growth by industry in Lower Manhattan, we can use IMPLAN to estimate Lower Manhattan’s contribution to the growth of the City’s GDP between 2014 and 2019. We estimate that during this period, value-added in Lower Manhattan will increase (in 2014 dollars) by $7.18 billion – in real terms, an average annual increase of about 2.2 percent. During the same period, New York City OMB expects the City’s GDP to grow at an average annual rate of 1.8 percent.
Impact on City and State tax revenues
Between 2014 and 2019, New York City and New York State tax revenues generated in Lower Manhattan will increase significantly. These increases will be driven by two sets of factors:
• Overall increases in the value of taxable real property; salaries, wages and proprietary income; sales; and business income; and
• New commercial and residential development, new business activity and new jobs that will be added in the area between 2014 and 2019.

FINAL 31 Appleseed
Increased real property taxes and PILOTS
Based on revenue forecasts published by New York City OMB and the Independent Budget Office, we assume that assessed values on existing properties in Lower Manhattan will increase by an average of 3.5 percent annually between 2014 and 2019. We further assume that taxes on new residential and hotel development will be in line with current taxes per apartment (about $5,700) and hotel room (about $6,300), escalated through 2019 at 3.5 percent. Based on these assumptions, we estimate that by 2019, real property tax revenues generated by properties in Lower Manhattan will total $981.7 million.
Primarily as a result of increases in PILOT payments generated by new office and retail space at the World Trade Center, we estimate that payments by to the City from BPCA and the Port Authority will increase to $208.5 million.
Increased personal income taxes
Based on the projected increases in earnings per worker and the increase in aggregate earnings associated with the projected addition of 40,000 private-sector jobs in Lower Manhattan through 2019, we estimate Lower Manhattan will generate $1.19 billion in City personal income taxes in 2019 and $2.54 billion in New York State income taxes.
Increased sales taxes
For this analysis, we assume (based on Citywide OMB and IBO revenue projections) that between 2014 and 2019, sales by existing retail businesses in Lower Manhattan will grow at an average annual rate of 3.0 percent.
The increase in sales taxes generated by the major expansion of Lower Manhattan retailing described previously will of course depend on the level of sales achieved by new retail tenants. To estimate this increase, we used the same assumptions regarding the mix of stores, restaurants and service businesses and their respective percentages of taxable sales that we used above in estimating sales taxes generated in Lower Manhattan in 2014. However, we assumed significantly higher sales per square foot – from $750 per square foot for smaller retail locations to $2,000 per square foot for the World Trade Center Oculus.
Based on these assumptions, we estimate that the existing base of Lower Manhattan retail, restaurant and storefront service businesses, along with 2.34 million square feet of new or repositioned retail space, will generate approximately $179.2 million in New York City sales taxes, and $174.2 million in New York State and MTA sales taxes.

FINAL 32 Appleseed
Increased banking and business taxes
Using the same approach that was used in estimating City and State bank taxes generated in Lower Manhattan in 2014, and assuming an average annual increase of 2.0 percent, we estimate that by 2019, the projected growth of the financial services industry in Lower Manhattan would increase New York City bank tax revenues generated in Lower Manhattan to $273.4 million, and increase New York State banking and insurance taxes to $337.6 million.
Assuming that corporation and unincorporated business tax revenues generated by existing businesses in Lower Manhattan grow at an average annual rate of 3.0 percent, and taking into account the projected growth of non-bank businesses in the area, we estimate that by 2019, New York City general corporation tax and unincorporated business tax revenues will increase to approximately $375.5 million, and New York State corporate franchise tax revenues to $110.1 million.
Increased hotel taxes
Taking into account the projected increase in the supply of hotel rooms in Lower Manhattan, and assuming that taxes generated by existing hotels increase by an average of 2.5 percent annually, we estimate that in 2019, New York City hotel taxes (including sales taxes) generated in Lower Manhattan will total approximately $97.9 million, and New York State hotel taxes (including sales taxes) will total $39.4 million.
Summing up
Based on the preceding analysis, we estimate (as shown below in Tables 11 and 12) that:
• The projected growth in business activity and jobs in Lower Manhattan through 2019 will increase New York City property, personal income, sales, bank, business and hotel tax revenues generated in the area to more than $3.3 billion – an increase of 35.0 percent.
• Projected growth will increase New York State personal income, sales, banking and insurance and hotel tax revenues generated in Lower Manhattan in 2019 to more than $3.2 billion – an increase of 33.9 percent.

FINAL 33 Appleseed
Table 11: Summary of Lower Manhattan’s estimated contribution to New York City tax revenues, FY 2019 (in millions of 2014 dollars)
Tax FY 2019 amount
Real property tax $981.7 BPCA and WTC PILOT $208.5 Personal income tax $1,190.5 Bank tax $273.4 Corporation and UBT $375.5 Sales tax $179.2 Hotel (including sales) taxes $97.9 TOTAL $3,306.7
Sources: NYC Office of Management and Budget, NYC Department of Finance and Appleseed calculations
Table 12: Summary of Lower Manhattan’s estimated contribution to New York State tax revenues, FY 2019 (in $ millions)
Tax FY 2019 Amount
Personal income tax $2,544.0 Bank and insurance taxes $337.6 Corporate franchise tax $110.1 Sales tax $174.2 Hotel (including sales) taxes $39.4 TOTAL $3,205.3
Sources: New York State Budget Division and Appleseed calculations
FINAL 34 Appleseed
Lower Manhattan’s contribution to New York City’s growth
Between 2014 and 2019, the ongoing redevelopment of Lower Manhattan will contribute in several ways to the continued growth of New York City’s economy.
• During this five-year period, Lower Manhattan will attract billions of dollars in private investment – in new office space, retail facilities, housing and hotels. This investment will support thousands of full-time-equivalent jobs each year in construction and related industries.
• These investments, combined with public and private funds that have already been invested during the past decade, will support the addition of 40,400 jobs in Lower Manhattan between the fourth quarter of 2014 and the end of 2019.
• Not all of these jobs will (at least in the first instance) represent “net new” jobs in New York City; some of the new office space at the World Trade Center, and some existing space at Brookfield Place, will be occupied by firms (such as Conde Nast and Time Inc.) that will have relocated from Midtown. Nevertheless, based on what is known about planned relocations and new job-creating investments in retail, restaurants, hotels and other industries, we estimate that at least two-thirds of these 40,400 jobs are likely to represent net new jobs in New York City. Over time, firms that relocate to Lower Manhattan can also contribute to continued job growth in New York City – in some cases by adding jobs at their new locations, and in virtually all cases by freeing up space that can accommodate new growth elsewhere in the City.
• Beyond its immediate impact on employment, new office development in Lower Manhattan will provide high-quality, technologically advanced, attractive office space to companies in high-value, high-wage office-based industries. The availability of such space is essential to New York City’s long-term ability to attract and retain such companies, and support their continued growth.
• New residential development will help New York City attract and retain the highly-educated, highly-skilled workers on whom the continued growth of its economy depends.
• Investments in retail, restaurants, hotels and new attractions such as the One World Observatory will help sustain the continued growth of visitor traffic – not just in lower Manhattan but for New York City as a whole.
While much of the growth that will occur in Lower Manhattan during the next five years will be concentrated in high-value, high-wage industries, it is important to note that this growth will also provide new opportunities for New Yorkers at all skill levels. Part Three of the report explores these opportunities.

FINAL 35 Appleseed
Part Three: Creating opportunities for New York City residents
The addition of 40,000 private-sector jobs in Lower Manhattan by the end of 2019 will do more than boost the area’s total employment and GDP. It will create a wide range of new opportunities for New Yorkers. This part of the report examines three aspects of Lower Manhattan’s role as a major source of economic opportunity for New Yorkers:
• The diversity of new jobs that will be added in Lower Manhattan, creating opportunities for workers at all skill levels;
• Lower Manhattan’s unsurpassed transit access, which makes these jobs accessible to residents of neighborhoods throughout the City; and
• The concentration of higher education, training and employment services in the area.
Occupational mix of job growth in Manhattan
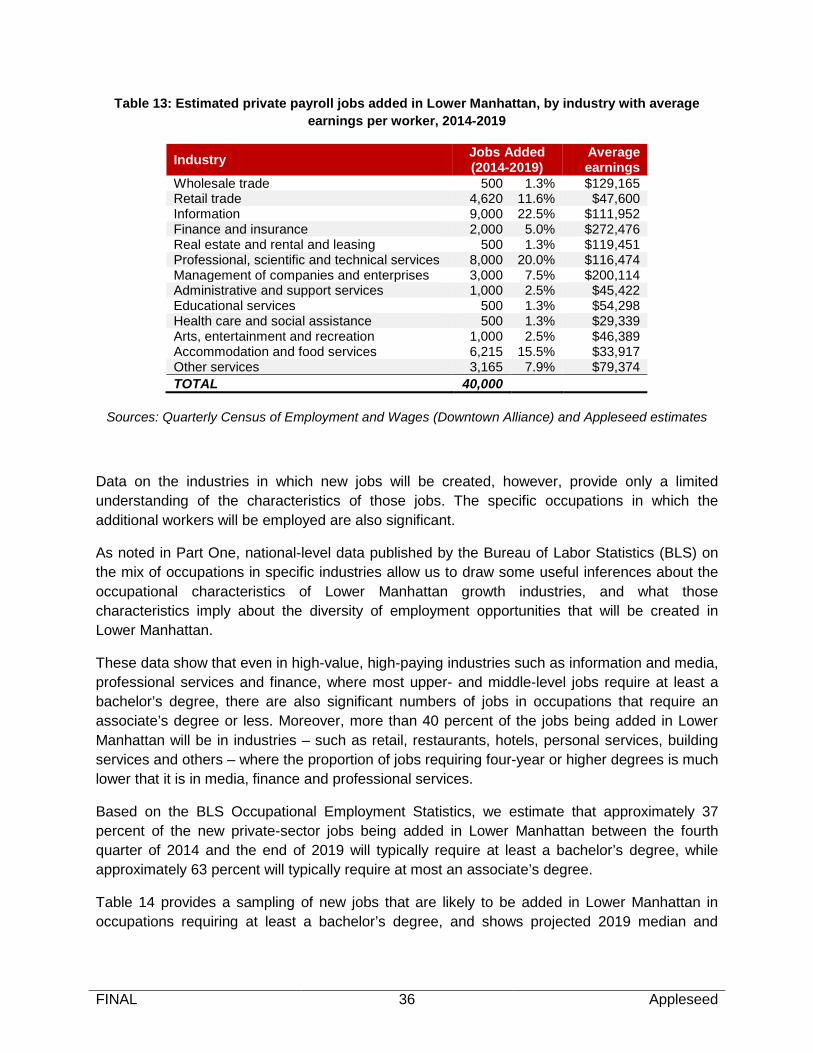
As the data presented in Table 13 indicate, the 40,000 new private-sector jobs being added in Lower Manhattan will be concentrated primarily in high-skill, high-value office-based industries – media and information, professional, business and financial services, real estate and the management of companies. In all of these industries – which together account for 58 percent of projected private-sector job growth in the area – average earnings per worker in Lower Manhattan in 2014 were well over $100,000.
FINAL 36 Appleseed
Table 13: Estimated private payroll jobs added in Lower Manhattan, by industry with average earnings per worker, 2014-2019
Industry Jobs Added (2014-2019)
Average earnings
Wholesale trade 500 1.3% $129,165 Retail trade 4,620 11.6% $47,600 Information 9,000 22.5% $111,952 Finance and insurance 2,000 5.0% $272,476 Real estate and rental and leasing 500 1.3% $119,451 Professional, scientific and technical services 8,000 20.0% $116,474 Management of companies and enterprises 3,000 7.5% $200,114 Administrative and support services 1,000 2.5% $45,422 Educational services 500 1.3% $54,298 Health care and social assistance 500 1.3% $29,339 Arts, entertainment and recreation 1,000 2.5% $46,389 Accommodation and food services 6,215 15.5% $33,917 Other services 3,165 7.9% $79,374 TOTAL 40,000
Sources: Quarterly Census of Employment and Wages (Downtown Alliance) and Appleseed estimates
Data on the industries in which new jobs will be created, however, provide only a limited understanding of the characteristics of those jobs. The specific occupations in which the additional workers will be employed are also significant.
As noted in Part One, national-level data published by the Bureau of Labor Statistics (BLS) on the mix of occupations in specific industries allow us to draw some useful inferences about the occupational characteristics of Lower Manhattan growth industries, and what those characteristics imply about the diversity of employment opportunities that will be created in Lower Manhattan.
These data show that even in high-value, high-paying industries such as information and media, professional services and finance, where most upper- and middle-level jobs require at least a bachelor’s degree, there are also significant numbers of jobs in occupations that require an associate’s degree or less. Moreover, more than 40 percent of the jobs being added in Lower Manhattan will be in industries – such as retail, restaurants, hotels, personal services, building services and others – where the proportion of jobs requiring four-year or higher degrees is much lower that it is in media, finance and professional services.
Based on the BLS Occupational Employment Statistics, we estimate that approximately 37 percent of the new private-sector jobs being added in Lower Manhattan between the fourth quarter of 2014 and the end of 2019 will typically require at least a bachelor’s degree, while approximately 63 percent will typically require at most an associate’s degree.
Table 14 provides a sampling of new jobs that are likely to be added in Lower Manhattan in occupations requiring at least a bachelor’s degree, and shows projected 2019 median and

FINAL 37 Appleseed
entry-level wages in New York City for each. Table 15 provides a similar sampling for jobs that typically require an associate’s degree or less.7
Table 14: Estimated private-sector jobs added in Lower Manhattan in selected occupations requiring a bachelor’s degree or higher, 2014-2019
Occupation Estimated jobs added
NYC annual wages: Median Entry
General and operations managers 1,156 $163,418 $84,432 Marketing managers 180 $186,716 $122,128 Sales managers 232 $202,663 $113,478 Computer and information systems managers 355 $168,009 $112,937 Financial managers 441 $198,646 $123,048 Architectural and engineering managers 100 $150,557 $105,813 Human resources specialists 246 $70,596 $47,461 Management analysts 577 $103,713 $63,830 Market research analysts and marketing specialists 577 $77,244 $49,183 Accountants and auditors 1,107 $91,610 $59,705 Financial analysts 231 $115,232 $73,573 Personal financial advisors 147 $128,191 $71,831 Loan officers 243 $112,894 $68,972 Computer systems analysts 502 $103,074 $68,918 Computer programmers 315 $97,466 $65,248 Software developers, applications 984 $116,163 $80,654 Software developers, systems software 393 $110,469 $78,359 Network and computer system administrators 312 $96,200 $65,270 Computer network architects 84 $127,429 $86,630 Architects, except landscape and naval 192 $83,014 $60,691 Civil engineers 349 $94,922 $69,330 Graphic designers 436 $69,882 $44,040 Producers and directors 538 $110,707 $55,927 Public relations specialists 277 $66,710 $42,059 Editors 537 $79,441 $46,768 Registered nurses 312 $93,071 $71,733 Securities/commodities/financial services sales agents 280 $167,554 $76,746 Lawyers 430 $175,522 $91,599 Other occupations requiring a bachelor’s degree or higher 3,089 N/A N/A TOTAL 14,624 $114,550 $71,393
Sources: QCEW (Downtown Alliance), OES (BLS and NYS DOL), Congressional Budget Office and Appleseed estimates
7 Entry-level and median annual wage estimates from 2014 have been adjusted to reflect increases in average earnings through 2019, as forecast by the Congressional Budget Office (an average of 1.6 percent annually); and have been further adjusted to reflect scheduled increases in New York State’s general minimum wage, and in minimum wages for fast-food workers and other tipped workers. For certain occupations wages have also been adjusted to reflect wages set by union contracts.

FINAL 38 Appleseed
Table 15: Estimated private-sector jobs added in Lower Manhattan in selected occupations requiring an associate’s degree or less, 2014-2019
Occupation Estimated jobs added
NYC annual wages: Median Entry
Some college or associate’s degree Web developers 131 $80,989 $47,299 Computer user support specialists 541 $63,051 $41,723 Computer network support specialists 187 $85,634 $53,080 Paralegals and legal assistants 223 $57,973 $43,098 Other occupations requiring some college/associate’s degree 288 N/A N/A
Postsecondary training and certification Hairdressers, hairstylists, cosmetologists 160 $26,026 $18,924 Other occupations requiring postsecondary training/certification 983 N/A N/A
High school diploma or equivalent Security guards (union) 108 $44,940 $44,940 Security guards (non-union) 108 $33,073 $21,089 First-line housekeeping and janitorial supervisors (union) 111 $52,100 $52,100 First-line housekeeping and janitorial supervisors (non-union) 49 $57,551 $40,240 Baggage porters and bellhops (union) 72 $35,620 $35,620 Baggage porters and bellhops (non-union) 48 $41,170 $28,710 Fitness trainers and instructors 303 $64,729 $29,447 First-line retail supervisors 352 $48,273 $30,811 Advertising sales agents 451 $74,288 $42,838 Bookkeeping, accounting and auditing clerks 731 $45,642 $29,891 Customer service representatives 1,640 $41,247 $27,162 Hotel desk clerks 392 $43,683 $24,207 Receptionists, information clerks 247 $32,381 $24,510 Legal secretaries 247 $70,542 $46,508 Secretaries and administrative assistants 809 $43,391 $29,804 General office clerks 995 $32,197 $20,624 General maintenance workers 769 $46,996 $29,403 Other occupations requiring a high school diploma 4,433 N/A N/A
Less than high school Fast food cooks 189 $20,883 $18,274 Restaurant cooks 493 $28,083 $22,096 Bartenders 271 $27,615 $21,900 Fast-food workers (covered by $15/hour minimum) 992 $32,589 $30,000 Fast-food workers (not covered by $15/hour minimum) 110 $19,898 $18,318 Waiters and waitresses 1,080 $25,071 $21,950 Dishwashers 213 $20,320 $18,339 Janitors and cleaners (union) 948 $47,780 $47,780 Janitors and cleaners (non-union) 224 $36,624 $22,442 Maids, hotel housekeepers (union) 414 $60,000 $60,000 Maids, hotel housekeepers (non-union) 207 $40,760 $24,607 Cashiers 1,239 $20,559 $18,469 Retail salespersons 1,508 $24,359 $18,404 Stock clerks, order fillers 515 $22,345 $18,545 Laborers, stock and material movers 406 $30,205 $20,104 Other occupations requiring less than high school 2,189 N/A N/A TOTAL 25,376 $43,195 $30,404
Sources: QCEW (Downtown Alliance), OES (BLS and NYS DOL), Congressional Budget Office, and Appleseed estimates

FINAL 39 Appleseed
The occupations listed in Table 15 vary widely in terms of the wages they offer. However, it is worth noting that of the estimated 25,376 jobs being added in occupations that typically require an associate’s degree or less, approximately 68 percent would be in occupations in which median New York City wages in 2019 are likely to exceed $15.00 per hour.
We can apply the same type of analysis to on-site construction employment. In Part Two we estimated that in 2019, expenditures of more than $1.38 billion would support approximately 3,290 FTE on-site construction jobs in Lower Manhattan. Based on the BLS data on the construction industry’s occupational mix, we estimate that approximately 90 percent of all on-site jobs in Lower Manhattan in 2019 – about 2,960 FTE jobs – will be in occupations requiring no more than an associate’s degree. Virtually all of these jobs would be in occupations in which median New York City wages in 2019 easily exceed $15.00 per hour.
Table 16: Estimated on-site construction jobs in Lower Manhattan in occupations requiring an associate’s degree or less, 2019
Occupation Estimated jobs
NYC annual wages: Median Entry
Postsecondary training and certification Heating and air conditioning mechanics and installers 126 $68,951 $37,296 Heavy truck drivers 63 $47,667 $30,031
High school diploma or equivalent Construction supervisors 248 $99,253 $63,657 Carpenters* 347 $65,606 $39,071 Operating engineers, construction equipment operators 145 $118,805 $73,866 Electricians* 286 $94,933 $51,261 Plumbers, pipefitters and steamfitters* 205 $78,640 $49,908 Structural iron and steel workers* 36 $97,878 $72,188 Helpers – Electricians 43 $38,476 $27,736 Helpers – Plumbers, pipefitters, steamfitters 33 $29,696 $23,124 Elevator installers and repairers* 12 $86,197 $60,680 Telecommunications line installers and repairers 27 $87,875 $47,342 General maintenance and repair workers 24 $46,996 $29,403 Welders, cutters, solderers and brazers 33 $41,290 $31,374 Crane and tower operators 11 $77,092 $47,050
Less than high school Cement masons and concrete finishers 96 $88,914 $44,376 Construction laborers 469 $56,891 $30,129 Painters, construction and maintenance 110 $59,478 $34,979 Laborers, stock and material movers 23 $30,205 $20,104
*Requires an apprenticeship.
Sources: QCEW (Downtown Alliance), OES (BLS and NYS DOL), Congressional Budget Office, and Appleseed estimates

FINAL 40 Appleseed
Jobs that are accessible from neighborhoods whose residents need them
One of the benefits New York City derives from the creation of new jobs in Lower Manhattan is the relative ease with which residents from all over the City – and in particular, residents of neighborhoods where the need for new opportunities is greatest – can reach these jobs.
An analysis of the Census Bureau’s American Community Survey data for 2009-2013 shows that approximately 80 percent of all New York City residents age 16 and older – about 5.3 million working-age New Yorkers – lived in census tracts in which the center point of the tract is located within half a mile (roughly a ten-minute walk) from a subway station. Of this group:
• About 2.3 million lived in census tracts in which the unemployment rate for 2009-2013 was higher than the City-wide rate for 2009-2013 (10.6 percent); and
• About 920,000 lived in census tracts in which the unemployment rate for 2009-2013 exceeded 150 percent of the City-wide rate for the same period – that is, 16.0 percent or higher.
Lower Manhattan’s continued growth as a major employment center thus serves the interests not only of those who live or do business in the area, but of the entire City. There are very few locations in New York City that offer comparable access to large and growing numbers of less-skilled but reasonably well-paid jobs.
Education, training and employment services
Both for those already working in the area and for other City residents, Lower Manhattan also offers easy access to a wide range of educational institutions, training programs and employment services. Institutions offering undergraduate, graduate and professional programs, for example, include:
• Borough of Manhattan Community College, offering associate’s degrees in fields as diverse as accounting, biotechnology, computer network technology, video arts and technology and small business entrepreneurship, as well as several certificate programs and non-credit continuing education programs;
• Pace University, a comprehensive independent university offering undergraduate and graduate degrees in business, computer science and information systems, health sciences and the arts, well as a wide range of continuing professional education programs;
• Cornell University, offering graduate degrees in urban planning and financial engineering;

FINAL 41 Appleseed
• New York University’s School of Continuing and Professional Studies, which offers several programs at the Woolworth Building;
• The New York Film Academy, with degree and certificate programs that prepare students for careers in film and television production.
Other training programs in Lower Manhattan also help students prepare for and secure employment in a variety of fields. They include, for example:
• The Institute of Culinary Education, a leading provider of both intensive career education programs and post-employment professional development for the restaurant and hospitality industries; the Institute moved to new facilities at Brookfield Place in 2015.
• Year Up, an intensive one-year program that provides training in information technology, corporate internships and extensive support services to low-income young adults ages 18 to 24.
• Fullstack Academy and the Flatiron School, both of which offer intensive, three-month programs that prepare students to work as software developers.
• The Center for Employment Opportunities, which provides pre-employment training, transitional employment, job placement and job retention services for adults who are on probation or parole.
• Futures and Options, an organization that connects students in schools that lack career guidance resources to internships with for-profit businesses and non-profit organizations in New York City.
FINAL 42 Appleseed
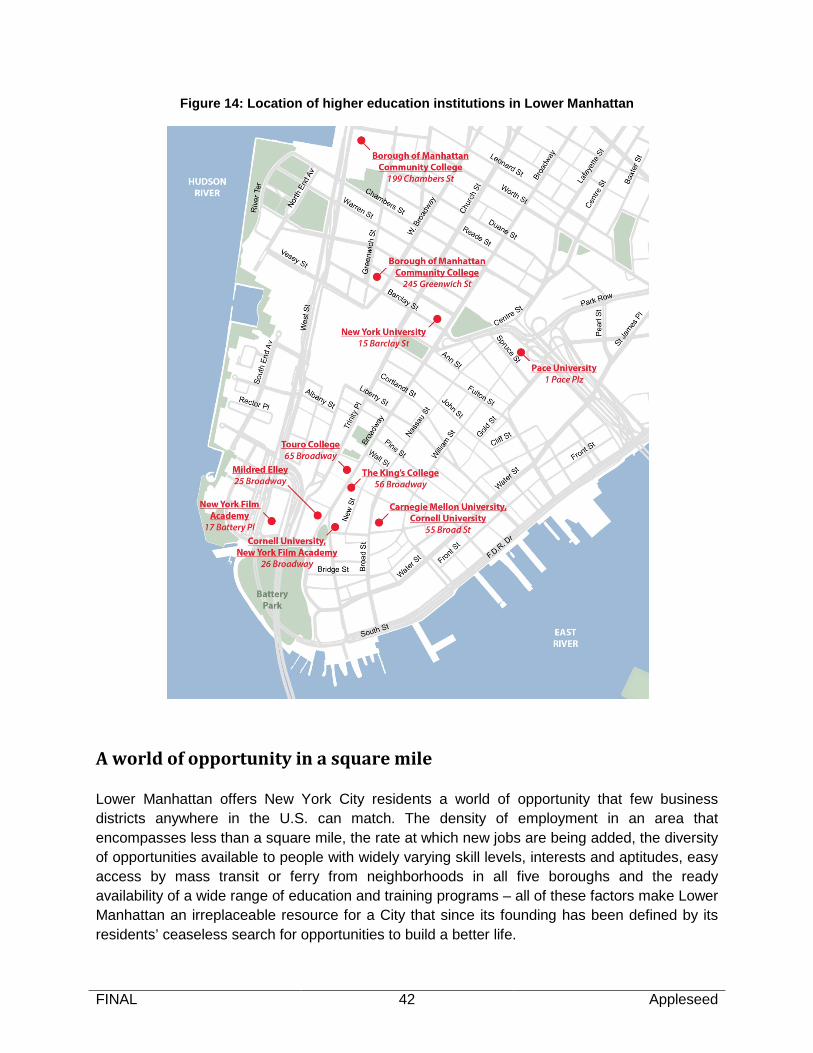
Figure 14: Location of higher education institutions in Lower Manhattan
A world of opportunity in a square mile
Lower Manhattan offers New York City residents a world of opportunity that few business districts anywhere in the U.S. can match. The density of employment in an area that encompasses less than a square mile, the rate at which new jobs are being added, the diversity of opportunities available to people with widely varying skill levels, interests and aptitudes, easy access by mass transit or ferry from neighborhoods in all five boroughs and the ready availability of a wide range of education and training programs – all of these factors make Lower Manhattan an irreplaceable resource for a City that since its founding has been defined by its residents’ ceaseless search for opportunities to build a better life.