Economic Goals for Vermont’s Comprehensive Economic Development Strategy Ken Jones, Economic...
26
Economic Goals for Vermont’s Comprehensive Economic Development Strategy Ken Jones, Economic Research Analyst Vermont Agency of C0mmerce and Community Development January 27, 2014
-
Upload
kristopher-mcdaniel -
Category
Documents
-
view
216 -
download
1
Transcript of Economic Goals for Vermont’s Comprehensive Economic Development Strategy Ken Jones, Economic...

Economic Goals for Vermont’s Comprehensive Economic
Development Strategy
Ken Jones, Economic Research AnalystVermont Agency of C0mmerce and Community
DevelopmentJanuary 27, 2014

CEDS – A Strategy for Vermont
Productivity (GDP and
GPI)
Labor
Capital
Consumption

Broad Goal – Increase GDP
1997 1998 1999 2000 2001 2002 2003 2004 2005 2006 2007 2008 2009 2010 2011 20120
2,000,000
4,000,000
6,000,000
8,000,000
10,000,000
12,000,000
14,000,000
16,000,000
18,000,000
0
5,000
10,000
15,000
20,000
25,000
30,000
State and National GDP
US GDP VT GDP
Millions of Chained 2006 dollars – real growth
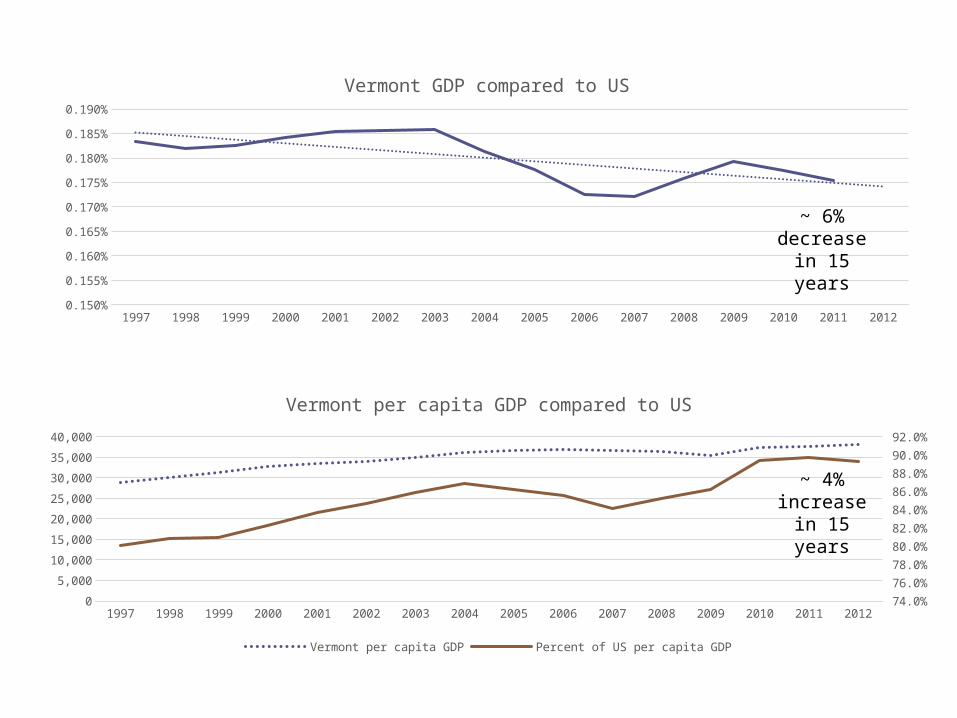
1997 1998 1999 2000 2001 2002 2003 2004 2005 2006 2007 2008 2009 2010 2011 20120.150%
0.155%
0.160%
0.165%
0.170%
0.175%
0.180%
0.185%
0.190%
Vermont GDP compared to US
1997 1998 1999 2000 2001 2002 2003 2004 2005 2006 2007 2008 2009 2010 2011 20120
5,000
10,000
15,000
20,000
25,000
30,000
35,000
40,000
74.0%
76.0%
78.0%
80.0%
82.0%
84.0%
86.0%
88.0%
90.0%
92.0%
Vermont per capita GDP compared to US
Vermont per capita GDP Percent of US per capita GDP
~ 6% decrease
in 15 years
~ 4% increase in 15 years

The Vermont Economy
2001 2003 2005 2007 2009 20110
5000000000
10000000000
15000000000
20000000000
25000000000Total State GDP
Other Services
Construction
Educational Services
Transportation and Utili-ties
Information
Professional and business services
Leisure and hospitality
Financial Activities (Minus Real Estate)
Health care and social assistance
Manufacturing
Real estate
Natural resources and mining
Government
Trade
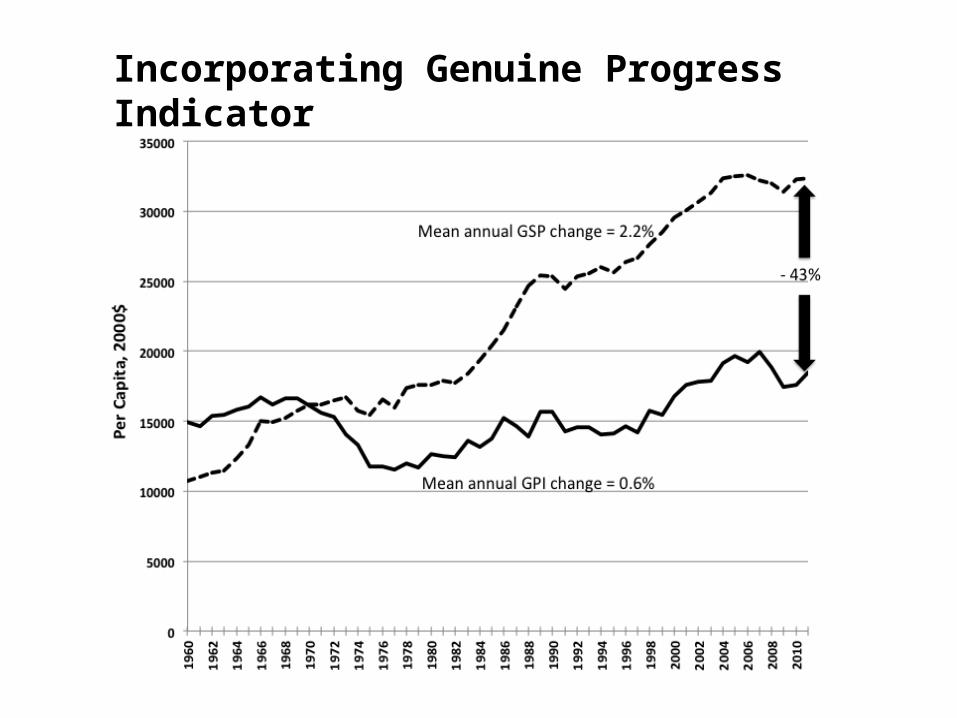
Incorporating Genuine Progress Indicator

Factors that influence GPI
•Starts with consumer purchases, like GDP•Non renewable energy depletion (-$3.6
billion)•Value of housework (+$3.5 billion)•Income inequality (-$3.2 billion)•Value of higher education (+$2.3 billion)•Loss of farmland (-$1.4 billion)•Climate change and ozone depletion (-$1.8
bill.)•Commuting cost and car crashes (-$.65
billion)•Cost of underemployment (-$.5 billion)
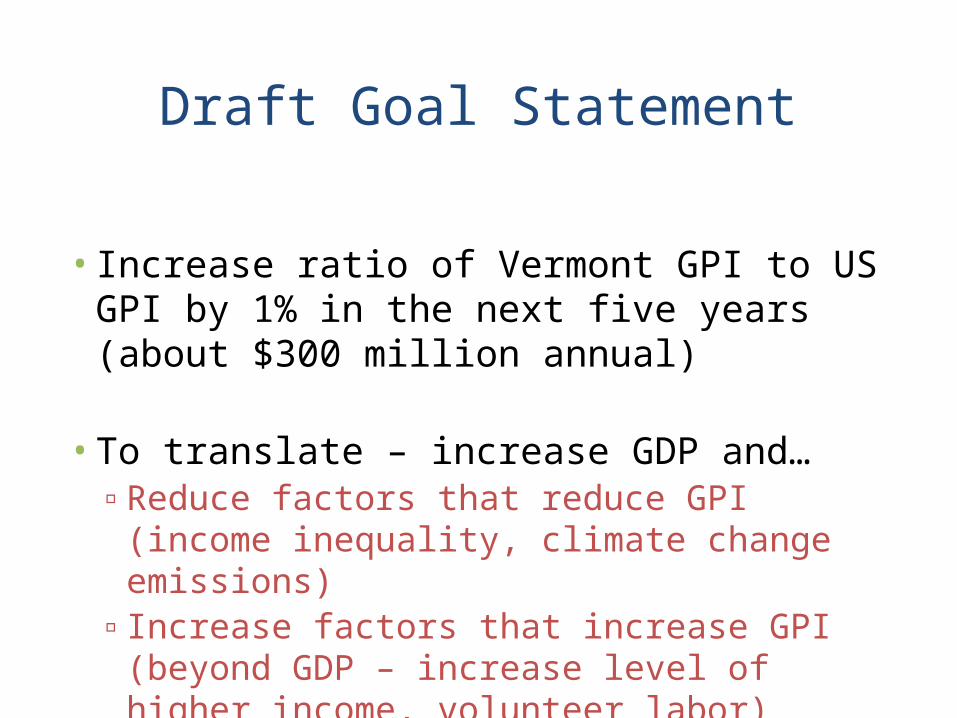
Draft Goal Statement
•Increase ratio of Vermont GPI to US GPI by 1% in the next five years (about $300 million annual)
•To translate – increase GDP and…▫Reduce factors that reduce GPI (income
inequality, climate change emissions)▫Increase factors that increase GPI (beyond
GDP – increase level of higher income, volunteer labor)

CEDS – A Strategy for Vermont
Labor+
CapitalProduction (GPI)Magic
BusinessEnvironment
Workforce Development and
Education
Public Infrastructure
Capital Finance
InnovationWorking Lands and Tourism

Labor
•Number of employed and self –employed•Wages and salaries of employed and self
employed•GDP output per employee (labor
efficiency)

The Vermont Economy
2000 2001 2002 2003 2004 2005 2006 2007 2008 2009 2010 2011 20120
50000
100000
150000
200000
250000
300000
350000Employment
Working Lands
Other
Housing
Transportation
Services
Education
Healthcare
Tourism
Retail/Wholesale
Government
Manufacturing
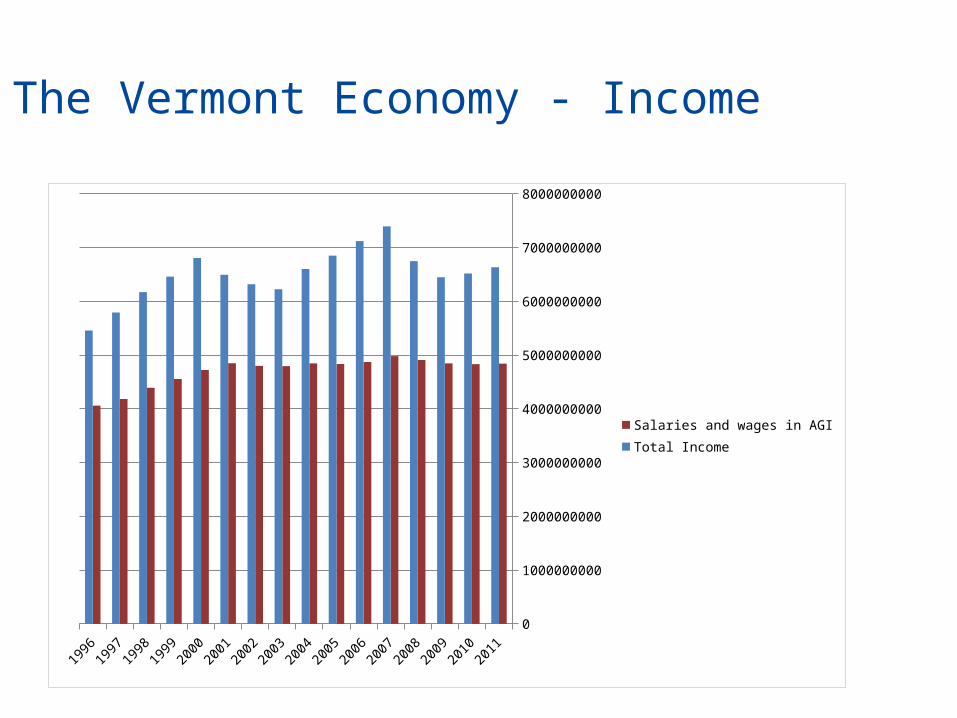
The Vermont Economy - Income
2011
2010
2009
2008
2007
2006
2005
2004
2003
2002
2001
2000
1999
1998
1997
1996
0
1000000000
2000000000
3000000000
4000000000
5000000000
6000000000
7000000000
8000000000
Salaries and wages in AGITotal Income

18-24 25-34 35-44 45-64 65+0
10000
20000
30000
40000
50000
60000Education by Age in Vermont Females
Less than 9th grade
9th to 12th grade, no diploma
High school graduate, GED, or alter-native
Some college, no degree
Associate's degree
Bachelor's degree
Graduate or professional degree
18-24 25-34 35-44 45-64 65+0
10000
20000
30000
40000
50000
60000 Education by Age in Vermont Males
Less than 9th grade
9th to 12th grade, no diploma
High school graduate, GED, or alternative
Some college, no degree
Associate's degree
Bachelor's degree
Graduate or professional degree
(45-64 data divided by 2)

Draft Goal Statement - Labor
•Increase worker output 1% in the next five years above national increases
▫(Via workforce development and education)

Capital
•Direct Foreign Investment (EB-5)
•Venture Capital
•Vermont in traditional equity markets
•New capital sources

Draft Goal Statement – Private Capital
•Increase capital investment by $1 billion in next five years

Draft Goal Statement – Public Infrastructure
• Increase number of communities with adequate water and wastewater for growth by z
• Transportation
• Broadband
• Energy (incorporate the 90% by 2050 goals of the Comprehensive Energy Plan)

CEDS – A Strategy for Vermont
Labor+
CapitalProductivity
BusinessEnvironment
Workforce Development and
Education
Public Infrastructure
Capital Finance
InnovationWorking Lands and Tourism

Draft Goal Statement – Business Environment
•Increase business survival rate x% in the next five years
•Increase business growth y% in the next five years
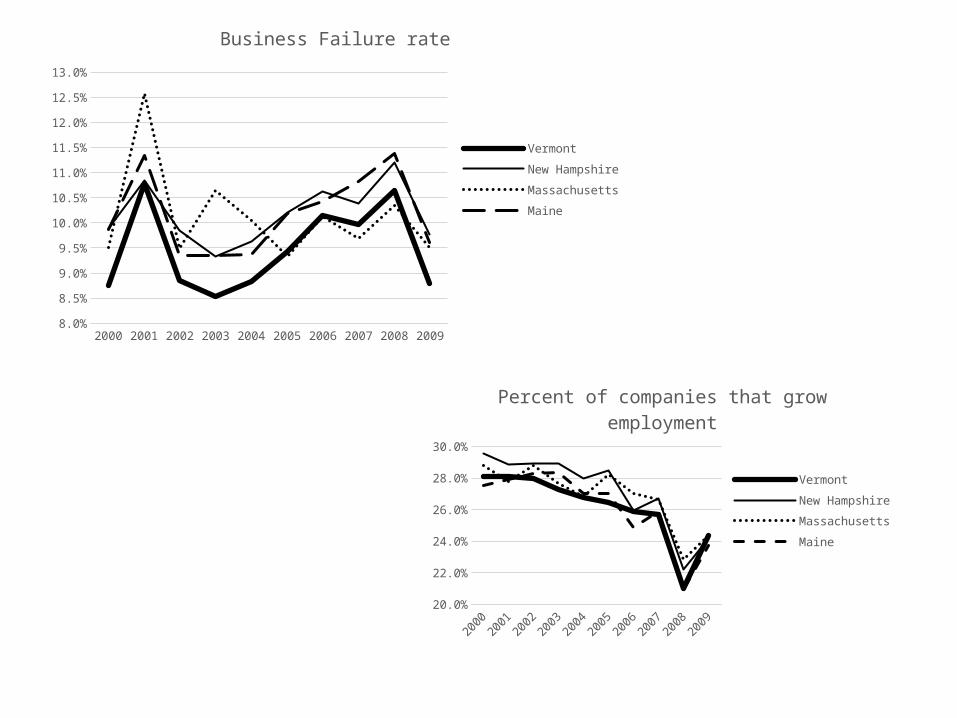
2000 2001 2002 2003 2004 2005 2006 2007 2008 20098.0%
8.5%
9.0%
9.5%
10.0%
10.5%
11.0%
11.5%
12.0%
12.5%
13.0%
Business Failure rate
Vermont
New Hampshire
Massachusetts
Maine
2000
2001
2002
2003
2004
2005
2006
2007
2008
2009
20.0%
22.0%
24.0%
26.0%
28.0%
30.0%
Percent of companies that grow employment
Vermont
New Hampshire
Massachusetts
Maine

Draft Goal Statement – Other bucket groups
•Innovation
•Working Lands and Tourism

TimelineToday – Add flesh to the initiatives • Who can take responsibility for specific actions?• What data and analysis will support the initiative?
February - March –• Draft action plan matrix including intiatives• Finalize data documents• Draft CEDS document for review• Targeted review workshops
April –• Get administration approval, add final details• Public review period
May – Preparation and delivery of final CEDS document
June 1 – Report completed
Fall, 2014 – Economic Development Summit • Review baseline information • Report progress in workplan implementation

CEDS Report outlineCharacterize Vermont economy
Production, Labor, CapitalFor each Bucket Area
GoalsInitiatives (as work plans)
Topics (not incorporated in bucket areas)PovertyResilienceCommunity Development and HousingSectors of particular interest

10:00am-10:15am Welcome by Commissioner Lisa Gosselin
10:15am-10:45am Presentation: Goal areas and Initiatives: Ken Jones
10:45am-11:00am Join Groups: Personal Introductions.
11:00am-11:30amRead Initiatives and make notes: All participants will have time to privately read through the initiatives for their chosen goal area, and make notes about improvements.
11:30am-12:30pm
Review Initiatives: The Team Leader(s) will invite participants to consider initiatives and bucket goals. Groups will contribute their ideas about improvements/additional information for the initiatives. The improvements will be captured on computer by a Recorder assigned to each group. (Allow 10-20 minutes for each initiative)
12:30pm -1:30pm Working Lunch
1:30pm-2:15pmReview Initiatives: (Continued) and consider any gaps or new initiatives.
2:15pm-3:45pm Report back: (allow 5-6 minutes per group)
3:45pm-4:00pm Conclusions/Next steps: Commissioner Lisa Gosselin
4.00pm Close

In your work groups:
a)Read through the initiatives.
b)Make private notes.
c) Indicate to the facilitator/recorder which initiatives you would like to contribute to.
d)Prioritize – start work on those with the most contributors/or which people regard as the most important.
e)Focus on completing fewer initiatives rather adding minor improvements to them all.
Time to get to work.