Economic Globalization and Income Inequality: Cross ... 391 - Sovna Mohanty - Final.pdf · ECONOMIC...
27
Economic Globalization and Income Inequality: Cross-country Empirical Evidence Sovna Mohanty
-
Upload
nguyenmien -
Category
Documents
-
view
216 -
download
0
Transcript of Economic Globalization and Income Inequality: Cross ... 391 - Sovna Mohanty - Final.pdf · ECONOMIC...

Economic Globalizationand Income Inequality:Cross-country EmpiricalEvidence
Sovna Mohanty

ISBN 978-81-7791-247-0
© 2017, Copyright Reserved
The Institute for Social and Economic Change,Bangalore
Institute for Social and Economic Change (ISEC) is engaged in interdisciplinary researchin analytical and applied areas of the social sciences, encompassing diverse aspects ofdevelopment. ISEC works with central, state and local governments as well as internationalagencies by undertaking systematic studies of resource potential, identifying factorsinfluencing growth and examining measures for reducing poverty. The thrust areas ofresearch include state and local economic policies, issues relating to sociological anddemographic transition, environmental issues and fiscal, administrative and politicaldecentralization and governance. It pursues fruitful contacts with other institutions andscholars devoted to social science research through collaborative research programmes,seminars, etc.
The Working Paper Series provides an opportunity for ISEC faculty, visiting fellows andPhD scholars to discuss their ideas and research work before publication and to getfeedback from their peer group. Papers selected for publication in the series presentempirical analyses and generally deal with wider issues of public policy at a sectoral,regional or national level. These working papers undergo review but typically do notpresent final research results, and constitute works in progress.
Working Paper Series Editor: Marchang Reimeingam

ECONOMIC GLOBALIZATION AND INCOME INEQUALITY:
CROSS-COUNTRY EMPIRICAL EVIDENCE
Sovna Mohanty∗
Abstract
Widening income inequality has limited the growth potential of economies in the past few decades. This paper analyses the effect of economic globalization on income inequality in both cross-country and country-specific framework using panel data techniques and policy simulations. The sample comprises of developed, developing and least-developed countries in the post-liberalization period. The results show that on the whole, globalization has helped in reducing inequality in the advanced economies but has the opposite effect in low-income economies. Trade and FDI have offsetting experiences; trade worsens income distribution whereas FDI is beneficial in all the economies and helps to reduce income inequality. FDI is found to have a greater impact on reducing income inequality. The policy simulations prove that India can reduce its income inequality by adopting the strategies of high income and middle-income nations. Keywords: Globalization, Inequality, Trade Openness, FDI, ICT
JEL Classification: F15, F63, O15
Introduction In the past few years, most countries have experienced the effects of economic globalization which has
resulted in increasing economic growth (Baddeley 2006; Rao and Vadlamannati 2011). However, the
degree of economic globalization and its consequences is heterogeneous across countries and regions
with varying levels of development (Heshmati 2007; McMillan and Rodrik 2011). The rise of economic
globalization has benefited economic growth at the cost of income inequality within countries (Bergh
and Nilsson 2010). Widening income inequality is the most defining challenge of our time as the
benefits of rising income are not shared equally across all the segments of the population. The
problems posed by income inequality have resulted in a debate about its implications within, and
between countries (Dabla-Norris et al 2015). The anti-globalization argument is widening the gap
between haves and haves-not (Mazur 2000). The pro-globalization argument claims that globalization
has promoted equality and reduced poverty (Dollar and Kraay 2002).
Reducing inequality is the key to achieving a more egalitarian society and also addresses the
welfare concerns of the individuals. If the pie grows, but the share of the poorest in the pie falls, there
is no assurance that they will benefit (Im and McLaren 2015).Inequality limits the growth potential of
the economies by reducing the productive capacity, with the poor unable to exploit the opportunities of
economic globalization (Jaumotte et al 2013). Understanding the causes of inequality is fundamental to
devising the policy measures that enhances the ability of the economy to benefit from economic
globalization.
∗ PhD Scholar, Centre for Economic Studies and Policy, Institute for Social and Economic Change (ISEC), Bangalore,
India. Email: [email protected] paper is based on the author’s ongoing PhD work at the ‘Institute for Social and Economic Change’ on the ‘ICSSR Institutional Doctoral Fellowship’ scheme. The author is grateful to her thesis supervisor Prof M R Narayana for his constant guidance and suggestions. Thanks are also due to anonymous referees for their comments. However, usual disclaimers apply.
2
Economic Globalization is a multidimensional concept and has been defined and measured variously
over the years. The KOF Index of Globalizationi by ETH Zurich was introduced in 2002 (Dreher2006).
Trade Openness, FDI and ICT are used to measure economic globalization based on the first index of
the economic globalization. Following Norris (2000) and Keohane and Nye Jr (2000), the KOF index
defines globalization to be the process of creating networks of connections among actors at multi-
continental distances, mediated through a variety of flows including people, information, ideas, capital
and goods. More specifically, the three dimensions of the KOF index are economic globalization, political
globalization, and social globalization. Broadly, economic globalization has two dimensions. The first
index includes actual economic flows which are data on trade, FDI and portfolio investment. The second
index refers to restrictions on trade and capital using hidden import barriers, mean tariff rates, taxes on
international trade (as a share of current revenue) and an index of capital controls.
Assessing the impact of globalization on income inequality could help in drawing meaningful
policy conclusions for income distribution and poverty reduction. The paper assesses two dimensions.
The first is examining the empirical association of economic globalization indicators on income inequality
for a sample of economies, belonging to various levels of economic development. The second is
conducting policy simulations to look at the impact on income inequality in a cross–country as well as in
a country-specific framework, particularly for India.
Review of Related Literature The empirical research on the impact of economic globalization on income inequality is divided into two
strands; one, which looks at the impact of economic globalization on income inequality using
decomposition techniques and the other looks at the relation between economic globalization on
inequality using decomposition techniques empirically.
There are some studies which look at the impact of economic globalization on income
inequality directly (Dreher and Gaston 2008; Ezcurra and Rodríguez-Pose 2013; Heshmati 2007; Wade
2004). Wade (2004) finds that economic integration has widened the absolute income gaps. Dreher and
Gaston (2008) and Ezcurra and Rodríguez-Pose (2013) study the impact using KOF globalization index
and support the evidence. However, Heshmati (2007) uses A.T. Kearney indexii and relates low-income
inequality with high globalization.Thus, the results are mixed and inconclusive. To get a clear picture,
the literature which explains the impact at varying levels of economic development and also looks at the
sub-components of economic globalization separately is discussed below.
Jaumotte et al (2013) and Milanovic (2005) have analysed the impact of globalization on
income inequality at various stages of economic development. Milanovic (2005) studies the effects of
globalization on income distribution within rich and developing countries and finds that at low average
income level, it is the rich who benefit from openness. Openness makes income distribution worse
before making it better and that the effect of openness on country’s income distribution depends on
initial income level. Jaumotte et al (2013) find that lower income inequality is associated with trade
liberalization whereas higher inequalityis related to financial openness.
Few studies have looked at the different sub-components of economic globalization affecting
income inequality (Asteriou et al 2014; Baddeley 2006; Jaumotte et al 2013). Baddeley (2006) studies

3
the impact of globalization on growth and income inequality in less developed countries and provides
evidence that increase in global income inequality is related to globalization of trade and finance.
Asteriou et al (2014) investigate the relationship between income inequality and globalization, with both
trade and financial variables for the European Union countries. The results suggest that while trade
openness exerts an equalizing effect, financial globalization through FDI, capital account openness and
stock market capitalization is the driving force of inequality. The highest contribution to inequality stems
from FDI.
Several studies have looked at the impact of trade on income distribution (Anderson 2005;
Meschi and Vivarelli 2009) in developing countries. Meschi and Vivarelli (2009) estimate the impact of
trade on within-country income inequality in developing countries (DCs). Their results suggest that
trade with high-income countries worsen income distribution in DCs. Imports and exports from/to
industrialized nations significantly worsen income distribution in middle-income countries. Anderson
(2005) suggests that increased openness affects income distribution within developing countries by
changing factor-price ratios, asset inequalities and the amount of income redistribution. Greater
openness reduces inequality in developing countries and increases inequality in developed countries.
The results do not confirm Stolper-Samuelson Theorem as they obtain a positive sign for the effect of
trade liberalization on inequality for the developing economies.
There are some studies which have looked at the impact of FDI on income inequality
(Chintrakarn et al 2012; Choi 2006; Herzer and Nunnenkamp 2013; Sylwester 2005). Choi (2006) finds
a negative relationship between bilateral FDI and income inequality between countries. Outward FDI
rather than inward FDI has a more detrimental effect on income distribution. Chintrakarn et al (2012)
and Herzer and Nunnenkamp (2013) investigate the relationship between inward FDI and income
inequality in the United States and Europe respectively. The results indicate that the short-run effects of
FDI on income inequality are insignificant, or weakly significant and negative. In the long run, FDI
exerts a significant and negative effect on income inequality in both United States and Europe.
Sylwester (2005) examines the effects of foreign direct investment (FDI) on economic growth and
income distribution in less developed countries (LDCs). FDI has a positive association with economic
growth, but there is no evidence that FDI is increasing income inequality within this group of LDCs.
Several studies have highlighted the role of financial development, knowledge, human capital,
structural change in income inequality. Adelman and Morris (1973) and Ahluwalia (1976) have tested
the cross-country evidence between development and inequality and have established inverted U curve.
Jaumotte et al (2013) and Asteriou et al (2014) emphasize the importance of education and structural
change for studying the relation between economic globalization and income inequality. While
employment shares have mixed results, reduction of inequality is also subject to education as it
improves the proportion of the high skill activities. Chu (2010) and Jones and Williams (2000) find that
stimulating research and development investment increases the income inequality by raising the return
on assets.
The second strand explains the decomposition of income inequality. Different methods have
been developed to decompose inequality (Fields and Yoo 2000; Morduch and Sicular 2002; Pyatt 1976;
Shorrocks 1980, 1982 and 1984). Inequality is decomposed by various subgroups, income sources and
4
other socio-demographic characteristics and at different levels of aggregation. The modern inequality
decomposition literature originates from Shorrocks (1980, 1982 and 1984). The decomposition of
inequality is examined by income sources: by population sub-groups or by sub-aggregates of
observations which share common characteristics. He shows that a broad class of inequality measures
can be decomposed into components reflecting only the size, mean and inequality value of each
population subgroup or income source. Fields and Yoo 2000; Morduch and Sicular 2002 proposed
regression-based methods of decomposition of inequality by income sources. These methods involve
estimation of standard income generating equations written regarding covariance. The size of the
coefficient determines the contribution of the explanatory variables to the distributional changes.
Of the two strands of literature review elaborated above, there are clear advantages of
estimating of globalization on inequality empirically. At the outset, income inequality has both income
and non-income dimensions. The above decomposition based methods explain income inequality by the
factor sources of income. The non-income dimension of income inequality which could account for
health, education, welfare, skills, etc., are equally important and drive inequality as can be seen in the
first strand of literature are left unaccounted. The first approach gives the flexibility to choose variables
which aid in determining the relation between globalization and income inequality. Secondly, several
studies have established a non-linear relationship between globalization and development (Adelman and
Morris 1973; Ahluwalia1976; Ezcurra and Rodríguez-Pose 2013) which cannot be done using the
decomposition approach.
The literature review identifies four research gaps in the existing literature. Firstly, the roles of
international trade and FDI and various other factors are studied intensively but mostly separately.
Secondly, in contrast to most studies that focuses on income inequality in a particular country or region,
this paper concentrates on the within-country variation in inequality and controls for the differences
across countries. The studies that focus on within-countryvariation have centered mostly on developed
countries, and very few studies have investigated the relation between the least developed countries
(Baddeley 2006; Sylwester 2005). Thirdly, the current study is different from previous studies also as it
accounts for the problem of endogeneity. Fourthly, the lack of comparable Gini coefficients, both
between countries and overtime, has been a major obstacle in inequality research. The Standardized
World Income Inequality Database (SWIID) created by Solt (2016) has been used to handle the
problem of few and non-comparable Gini measures. The SWIID database makes the estimation results
more reliable.
Against this background, there are three objectives in the study. Firstly, the estimation of the
impact of economic globalization on income inequality is studied using a comprehensive set of
explanatory variables which includes both globalization indicators and control variables. Secondly, to
gain an insight into how the factors differ in their contribution to income inequality across the various
income categories, inequality is decomposed to show the contribution of globalization variables and
other factors based on the dynamic panel regression results. Thirdly, policy simulations on income
inequality are done.

5
Methodology Estimation of the effect of globalization on income inequality involves three steps. In the first step, the
impact of economic globalization on income inequality is analyzed. In the second step, the
decomposition of the contribution of the various globalization indicators and other factors to income
inequality is studied. Policy simulations evaluate the impact of globalization on income inequality in the
third step.
Empirical Framework The econometric model for capturing the globalization effect on income inequality takes the following
form:
(1)
Where represents globalization variables, represents control variables and represents
the random disturbance which is assumed to be normal and identically distributed with
0 And .
Decomposition of inequality to show the contribution of globalization variables and other
factors based on the panel regression results. The contribution to the overall annual percentage change
of the income inequality of each variable is computed as the average annual change in the variable
times the regression coefficient of the variable from the GMM.
AAGRGini= AAGRglobalization*(coefficients of globalization variables) +,AAGRcontrol variables *(coefficient
of control variables) (2)
Where, AAGR=Average annual growth rate.
Equation (1) is estimated using panel regression models using both static and dynamic panel
methods. Firstly, thestatic panel approach (fixed and random effects) is estimated. Secondly, we repeat
the estimation by usingGeneralized Method of Moments (GMM) by Arellano and Bond (1991) to
eliminate endogeneity bias and to capture dynamic effects.
The static panel data model for estimation of the determinants of TFP is specified as follows,
(3)
Where TO, tradeopenness,FDI is the foreign direct investment as a percentage of GDP, the
internet is the number of internet users, the patent applications measure knowledge, and education by
the expenditure on education, health is measured by health expenditure, =number of countries,
=timeperiod.
In a dynamic setting, equation (3) is written as
6
(4)
Following the KOF globalization index, Trade Openness, FDI, and internet are used as
explanatory variables to assess the relationship between economic globalization and income inequality.
The indicators are measured as given in the KOF globalization index. Trade Openness is measured as a
ratio of exports plus imports over GDP. FDI is measured as percentage net inflows of FDI to GDP. ICT is
measured by taking the number of internet users in an economy.
Adelman and Morris (1973) and Ahluwalia (1976) have tested the cross-country evidence
between development and inequality, and have established inverted U curve. Dreher and Gaston (2008)
and Ezcurra and Rodríguez-Pose (2013) found that economic integration increases income inequality.
Meschi and Vivarelli (2009) concluded that trade with high-income countries worsens income
distribution in developing countries. Anderson (2005) results do not confirm Stolper-Samuelson
Theorem as they obtain a positive sign for the effect of trade liberalization on inequality for the
developing economies. Stolper-SamuelsonTheoremiii expects the coefficient of trade to depend on
factor-abundance, if the country is labor-abundant<0, capital–abundant>0. Jaumotte et al (2013)
suggest that increased financial openness is associated with higher inequality. Asteriou et al (2014)
financial globalization through FDI, capital account openness and stock market capitalization is the
driving force of inequality. Accordingly, the predicted signs of the coefficients are as following:: >0,
<0, 0 for high income countries (HIC) 0 0for upper middle income countries (UMIC)
and 0 for low income countries (LIC), 0, 0.
The control variables chosen for this analysis are financial development, knowledge, human
capital, structural change based on previous empirical and theoretical literature. Jaumotte et al (2013)
and Asteriou et al (2014) emphasize the importance of education and structural change for studying the
relation between economic globalization and income inequality. Education is essential to improve the
adaptability of innovations that are introduced due to foreign investments and lead to a reduction of
income inequality. The role of education in income differences is based on the work of Becker (1962)
and Schultz (1961) and leads to skill deepening. Greater access to education reduces income inequality
by creating job opportunities and allowing a larger proportion of the population to be engaged in high-
skill activities. The study uses the gross enrolment of secondary education as an indicator of education.
In developing countries, a move away from agricultural sector is expected to improve income
distribution by increasing the income of the low –earning group. The increase in relative productivity of
agriculture is supposed to reduce income disparities by increasing the income of those employed in this
sector. Kuznets (1955) find that as countries develop, it is anticipated that there will be a change in the
inter-sectoral composition of output, with the rise in shares of industries and service and fall in the
share of agriculture in the total output. The paper uses employment in agriculture and industry as
indicators of structural change.
Jones and Williams (2000) underline the importance of research and development. Stimulating
research and development investment increases the income inequality by raising the return on assets.

7
Patents are taken as an indicator of research and development in the paper. Thus the predicted signs of
the coefficients can be written as: >0, <0, 0, <0, <0.
Financial development may reduce income inequality by increasing access to the capital to the
poor. Motonishi (2006) finds that the effect of financial development on income inequality is mixed.
More developed financial services enable the poor to borrow from rich and leads to a decrease in
income inequality, while financial services are not available to the poor due to constraints in the credit
market.
The main hypothesis of this study is:
i. The Kuznets hypothesis expects per capita GDP >0 and per capita GDP sq<0.
ii. Stolper-SamuelsonTheorem assumes the coefficient of trade to depend on factor-abundance, If
the country is labor-abundant<0, capital –abundant>0.Thus, trade is expected to have a
positive relationship in HIC and negative correlation in LIC. Though, in middle-income
economies, the results could be positive or negative ( 0 for HIC 0 0for UMIC
and 0 for LIC).
iii. FDI increases income inequality across all levels of economic development ( 0).
iv. ICT also increases income inequality across all levels of economic development ( 0).
Technique of Estimation A sample of 115 countries is chosen which comprise of HIC (43), UMIC (28) and LIC (44) over the
period 1993-2012. The list of sample countries along with their income group is given in the Appendix in
Table A.1.
Equation (4) is estimated using static panel data approach.The fixed effect model assumes that
the unobservable country-specific effects are fixed parameters to be estimated along with the
coefficients of the model while the random effects model assumes the unobservable country-specific
effects to be a random disturbance. Diagnostic tests such as Lagrangian Multiplier (LM) and Hausman
tests are used to choose between the panel data models. A high value of LM favors FE model or RE
model over pooled OLS. Further, the statistical significance of Hausman specification test suggests that
estimation by using FE is preferable to RE model.
One of the limitations of the static panel data model is that it assumes exogeneity of all the
explanatory variables. However, the disturbances contain unobservable, time-invariant country effects
that may be correlated with explanatory variables. Dynamic panel data model allows for such
endogeneity by employing the instrumental variable technique (Baltagi 2008)
Arellano and Bond (1991) have suggested a generalized method of moment (GMM) procedure
in which the orthogonality conditions, which exist between the lagged dependent variable and the
disturbances , is utilized to obtain additional instruments. The GMM estimator uses the lagged values
of the endogenous explanatory variables as instruments to address the endogeneity problem. Equation
(4) is estimated using Arellano and Bond (1991) and Blundell and Bond (1998) GMM framework, and
applying a two-step GMMiv with robust standard error proposed by Windmeijer (2005) to estimate
equation. As compared to one-step system-GMM, two-step system GMM is asymptotically more efficient.

8
Source and Description of Data Dependent Variable: Among the most commonly used measures of inequality are the Gini
coefficients. For completely egalitarian income distributions in which the whole population has the same
income, the Gini coefficient takes a value of 0. A value of 1 indicates that all incomesare concentrated in
one person. Gini coefficients can be calculated in several ways: for gross income (before taxes and
transfers), net income (after taxes and transfers), and consumption expenditure. Furthermore, the unit
of analysis can be individuals or households. The lack of comparable Gini coefficients both between
countries and overtime is a major obstacle in inequality research. Many consider the Luxembourg
Income Study (LIS) to be the best option, as it is based on reliable microdata from national household
income surveys. Unfortunately, LIS data are available for only thirty countries, almost exclusively rich
ones, and contain few observations from before 1990.
As a second best solution, many scholars resort to the World Income Inequality Database
(WIID), created by the World Institute for Development Economics Research of the United Nations
University (UNU-WIDER) which is an updated and expanded version of the Deininger and Squire (1996)
dataset. The WIID contains a large set of inequality statistics from several sources including OECD
Income Distribution Database, the Socio-Economic Database for Latin America and the Caribbean,
generated by CEDLAS and the World Bank, Eurostat, the World Bank’s PovcalNet, the UN Economic
Commission for Latin America and the Caribbean, national statistical offices around the world, totaling
over 5000 observations from 176 countries. However, the observations are rarely comparable across
countries or over time within a single country. The Standardized World Income Inequality Database
(SWIID) created by Solt (2016) has attempted to handle the problem of few and non-comparable Gini
measures. The WIID database is standardized, and data from WIID and other sources mentioned above
are taken into account while minimizing reliance on problematic assumptions by using as much
information as possible from proximate years within the same country. The data collected by the
Luxembourg Income Study is employed as the standard. The SWIID currently incorporates comparable
Gini indices of net and market income inequality for 176 countries.
The database aims to improve data availability and comparability for cross-national research by
exploiting the fact that different types of Gini coefficients display systematic relationships. The Gini
coefficient of gross income is typically larger than the coefficient of net income, which in turn is greater
than the Gini coefficient of expenditure. Similarly, Gini coefficients for households are lower than
coefficients calculated on an individual basis. Gini net is used in our analysis.
The variables are defined as follows:
• Gininet: Estimate of Gini index of inequality in household disposable (post-tax, post-transfer)
income, using Luxembourg Income Study data as the standard.
• Ginimarket: Estimate of Gini index of inequality in household market (pre-tax, pre-transfer)
income, using Luxembourg Income Study data as the standard.
Independent variables: The independent variables are sourced from World Development Indicators,
World Bank. The measurement of variables is given in Table 1 below.

9
Table 1: Measurement of Variables
Variables Measurement Source
Gini Estimate of Gini index of inequality in household disposable (post-tax, post-transfer) income, using Luxembourg Income Study data as the standard
SWIID
Globalization Variables
Trade Openness
Ratio of (exports of goods and services (constant 2005 US$)+imports of goods and services (constant 2005 US $) to GDP)
WDI
FDI Ratio of Foreign direct investment, net inflows to GDP WDI
ICT Internet Users (per 100 people) WDI
Control Variables
Knowledge Logarithm of Patent applications, residents WDI
Human Capital
Gross enrolment ratio, secondary, both sexes (%) WDI
Structural Change
Employment in agriculture (% of total employment) WDI
Employment in industry (% of total employment) WDI
Financial Development
Domestic credit to private sector (% of GDP) WDI
GDP
per capita GDP per capita (constant 2010 US$) WDI
Source: Author’s Compilation
Policy Simulation The effects of globalization on income inequality are studied by conducting policy simulations and
comparing the actual income inequality and predicted income inequality in India. The predicted Gini is
calculated by multiplying the coefficient of the variable with the average of the variables over the
income group. Then a summation of the product estimated in the first step is taken. The policy
simulation can be described as following:
For the year for India,
_ _ _ (5)
Where , are the coefficients obtained in the dynamic panel data model regressions (full
model) for HIC given in Table A.3 for globalization indicators and control variables and _ are the

observ
values
The a
coeffic
coeffic
for so
countr
group,
lower
has ve
China
countr
Sourc
Figure
Sourc
ved values of
s of the control
average of the
cients of som
cients in Figure
ome select eco
ries like Bangla
, has greater
level of inequa
ery high level o
after the yea
ries which belo
Figu
ce: Author’s co
e 2: Gini Coef
ce: Author’s co
globalization in
variables for I
e Gini coefficie
e select econ
e 1, inequality i
onomies such
adesh belong t
income inequa
ality, whereas B
of inequality co
ar 2000. Thus
ng to different
re 1: Average
mpilation base
fficients of Se
mpilation base
ndicators for I
ndia for the ye
Results anents by count
nomies is ana
s consistently
as UK, USA a
to the LIC gro
ality than mos
Bangladesh and
ompared to the
s, there are s
income countr
e of Country G
ed on the data o
elect Econom
ed on the data o
10
India for the y
ear .
nd Discusstry groups ove
alyzed. Based
higher in the U
and China wh
oups. India, de
st economies.
d China, etc. h
ese countries, t
significant regi
ry groups.
Gini Coefficie
obtained from
mies
obtained from
year and
sion er the period
on the obse
UMIC and LIC.
hich belong to
espite belongin
Countries cha
ave a highersta
though the ineq
ional and cou
ents by Incom
SWIID
SWIID
are th
1993-2012 an
rved moveme
Figure 2 obser
HIC and UM
g to lower-mid
racterized by
andard of ineq
quality remains
ntry difference
me Groups
he observed
nd the Gini
nts of Gini
rves the Gini
MIC whereas
ddle income
HIC have a
uality. India
s lower than
es amongst
11
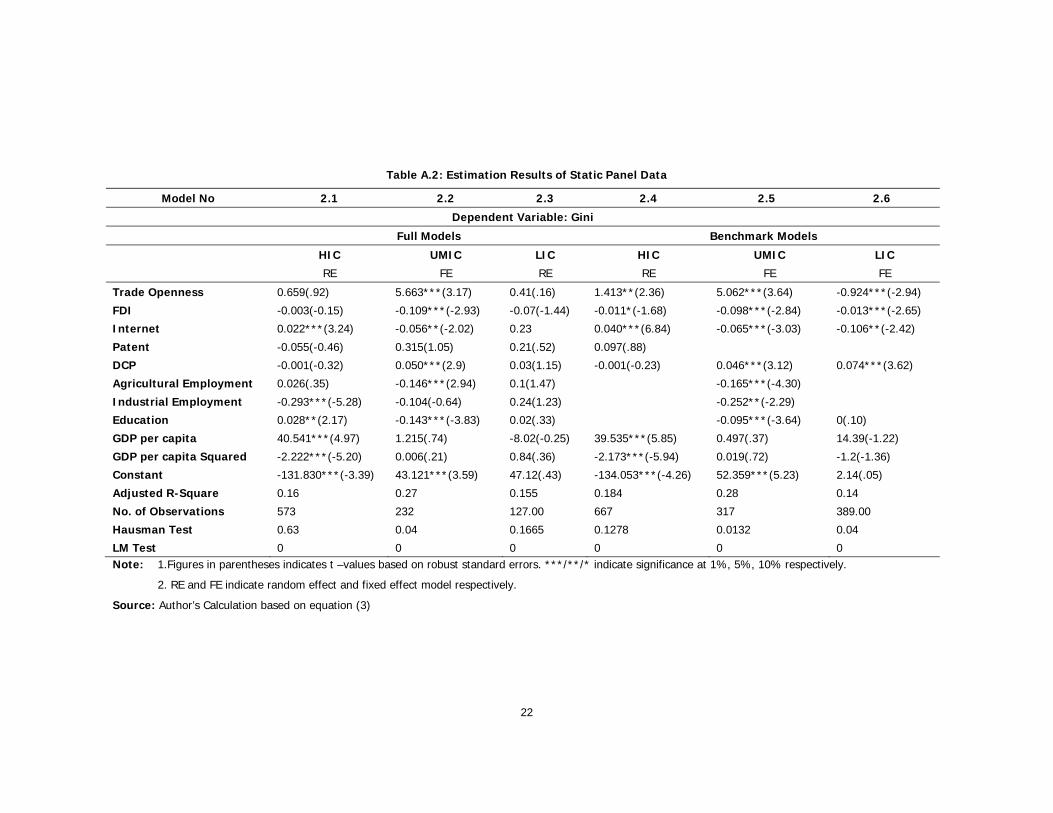
The results of the empirical estimationof the static panel data model are given in Table A.2.
The dependent variable of all the regressions is the Gini coefficient. Therefore, a positive coefficient
indicates an increase in inequality. The results suggest that globalization indicators are primarily
responsible for reducing inequality except for trade openness. Trade Openness has a positive and
significant coefficient in most of the categories. For reasons of robustness and endogeneity, the
estimation procedure is repeated by the country group with the use of Generalized Method of Moments
(GMM) by Arellano and Bond (1991). The results presented in Table A.2 and TableA.3are explained in
greater detail below.
The results show that the globalization indicators have a significant impact on income
inequality. All the globalization indicators except trade openness increase inequality. Interestingly, trade
and FDI have an opposing impact on inequality.
The coefficient of trade is positive and statistically significant for the HIC and UMIC and
negative for LIC which implies that trade openness worsens income distribution for the advanced
economies but reduces inequality for developing economies. Thus, it is safe to say that more open the
economies, more unequal the income distribution is.
FDI has reduced in all the categories of development, but the results differ in the magnitude of
the coefficients. The strongest effect of FDI is in the case of UMIC and LIC and the least affected is HIC.
Thus, FDI is important for reducing inequality in the developing and least developed economies as it
helps in generating employment and boosting economic growth.
ICT also has reduced income inequality in the developing and least developed economies.
Education is against the predicted sign in the hypothesis because completion of education at the
secondary level may not be enough to find job opportunities in HIC’s. They require high skill labor and
access to tertiary education helps in finding employment. Since education is measured using gross
enrolment ratio at the secondary level, education may not lead to improvement in productivity.
Education is also reducing income inequality in the UMIC and is insignificant in the other categories.
Financial development measured by domestic credit to private sector has increased inequality. This
result is supported by the Jaumotte et al (2013) who explain that the benefits of enhanced deepening
may accrue to the rich, who have more collateral income.
The benchmark models are given in the static panel data models. The benchmark models
provide the best results for every income category. In the case of HICs, there is an improvement in the
explanatory powers and significance levels when employment and education are removed from the full
model. In the case of LICs, the model without employment and patents gives the best results. Since,
employment data is not continuously available especially for LICs, removing the structural change
variables would increase the number of observations and also provide results with higher explanatory
powers. The R-square is relatively higher for the LIC in the benchmark model, whereas for UMIC and
HIC, the explanatory powers have remained the same. The diagnostic tests carried out also show
satisfactory results. The Hausman and LM test indicate that most of the models are random effects.
The estimation procedure is repeated with the use of the GMM methods of Arellano and Bond
(1991) to address the problems of endogeneity and any dynamic effects. The model is carried out using
dynamic panel data approach, and the results are given in Table A.3 below. The effect of past level of

12
Gini is statistically significant at 1% level with lag 1. Therefore, part of present Gini attributes to its
initial conditions significantly. The presence of lagged level of Gini in the explanatory variables increases
the magnitude of some of the globalization variables and some control variables.
The results show that trade openness reduced inequality in UMIC and increased it in HIC and
LIC. The evidence is supported by Feenstraand Hanson (1997) which says that greater openness raises
overall income inequality in all the countries. However,Lundbergand Squire (2003) finds that the effect
of openness on income distribution varies as a function of the level of development. Our result is
against the predicted signs for LIC and does not confirm to the Stolper-Samuelson theorem which
issupported by Anderson (2005) and Çelikand Basdas (2010). FDI is reducing income inequality in all
the categories though the magnitude is lowest in LIC. This result goes against the evidence given by
Asteriou et al (2014) and Jaumotte et al (2013). However, it finds support in Sylwester (2005) who finds
no evidence that FDI is increasing income inequality within this group of LDCs. ICT has also reduced
income inequality in the advanced economies. Industrial employment is also reducing income inequality
in the advanced economies. Education is reducing income inequality in the low economies as is shown
in the full model.
To gain a deeper insight into how the factors differ in their contribution across the various
income categories, we have decomposed data to show the contribution of trade and financial
globalization variables based on the final GMM panel regression results. The contribution to the overall
annual percentage change of the TFP of each variable was computed as the average annual change in
the variable times the regression coefficient of the variable from the GMM. The results of the empirical
analysis imply that the primary factors responsible for reducing Gini across the economies are FDI and
ICT. Further, Giniis decomposed into the different sub-components of economic globalization and other
factors for all the income categories. The results are presented in figures3, 4, 5, for HIC, UMIC, and LIC
respectively.
The change in Gini indicates the average percentage change in gini in a year over the given
period. It is observed that the change in Ginihas been positive for HIC and UMIC, whereas it is negative
for LIC. Thus, the advanced economies have seen an increase in inequality over the years. HIC found
the highest increase of .59% on an average per year over the period.In thecase of UMIC, the increase
is .26% on an average per year over the period.However, LIC have seen a .12% decrease in inequality
on an average per year over the period.Although Gini has fallen in the LIC, the most adverse impact of
economic globalization is on advanced economies.
The results show that impact of economic globalization on inequality differs amongst the HIC,
UMIC, and LIC. In the advanced regions, globalization has resulted in reducing income inequality
whereas, in LIC, globalization hasincreasedinequality.In HIC, globalization is driven by other factors and
trade openness whereas FDI and ICT have decreased inequality. In UMIC, trade openness and FDI have
reduced inequality whereas, in LIC, FDI alone helps in reducing inequality. Of the three globalization
indicators, FDI has contributed the most in reducing inequality in all the three categories. The result of
UMIC show that most of the globalization indicators have reduced inequality. Trade openness has the
maximum impact amongst the indicators to reduce inequality. In LIC, even though inequality has
reduced, it is mostly factors such as education and FDI which have contributed towards it and

globali
presen
inequa
catego
inequa
LIC ar
its ben
Sourc
Sourc
ization has af
nted in Table A
Thus, on th
ality in LIC. FD
ories. FDI has
ality in HIC only
e gradually cat
nefits in develo
ce: Author’s Ca
ce: Author’s Ca
ffected inequa
A.3.
e whole, globa
DI is the only i
resulted in the
y. HIC have a
tching up. It is
ping countries
alculation based
F
alculation based
lity adversely.
alization has re
ndicator which
e highest reduc
high proportio
also important
would be expe
Figure 3: De
d on equation (
Figure 4: Dec
d on equation (
13
The results a
duced inequali
h has consisten
ction in HIC an
n of internet a
t to note that I
erienced in the
composition:
(2)
composition:
(2)
are in line wi
ty in advanced
ntly decreased
nd lowest in LI
mongst the thr
ICT operates w
future.
: HIC
UMIC
ith the empiri
d economies an
inequality in a
IC. ICT is redu
ree groups, an
with a lag effec
cal analysis
nd increased
all the three
cing income
d UMIC and
ct and hence

Sourc
From
globali
by glo
belong
implica
inequa
derive
India.
inequa
other
broad-
econo
simula
Gini is
the av
the pro
income
groups
Bangla
income
a lowe
has ve
China
income
ce: Author’s Ca
Indiathe empirical
ization has red
balization. Indi
gs to the lowe
ations from th
ality and thus c
In this secti
policy lessons
Firstly, broad
ality decompos
factors in inco
-based econom
mic globalizatio
ations are carri
s estimated in a
verage of the v
oduct estimate
Figure 1 cl
e inequality th
s. Countries s
adesh belong
e inequality tha
er level of ineq
ery high level o
after the year
Figure 6 co
e inequality. In
alculation based
’s Growthanalysis and d
uced income in
ia is positioned
er middle grou
he advanced e
create a sustain
ion, India’s ine
s from advance
trends of Indi
sition of India
ome inequality
mic reforms. It
on or other fa
ed out to com
a two-step pro
variables over
ed in the first st
early in the p
han HIC. Figur
such as UK, U
to the LIC gr
an most econo
quality, wherea
of inequality co
2000.
mpares India’s
ndia’s globaliza
Figure 5: De
d on equation (
Decompodecomposition
nequality in ad
d as one of the
up. Hence, In
economies to
nable economic
equality situatio
ed economies
a’s inequality a
is conducted w
. There is an
t is important
actors to derive
pare the actua
ocess. In the fi
the income gr
tep.
previous sectio
re 2 shows the
USA, and Chin
roups. India, w
mies. As can b
s Bangladesh a
ompared to the
s integration w
tion, as is give
14
ecomposition:
(2)
osition andexercises carr
vanced econom
fastest growin
dia can serve
help India an
c growth.
on is analyzed,
which can lea
and growth wi
which looks in
increase in th
to see wheth
e policy lesson
al inequality an
rst step, the c
roup. The seco
n clearly show
e countries wh
na belong to
which belongs
be seen in figur
and China, etc
ese countries, t
with the world e
en by the KOF g
: LIC
d Policy Siried out above
mies, whereas
ng economies in
as an interes
d other low-in
and policy sim
ad to globalizat
th globalization
nto the contrib
e inequality of
her the inequa
ns for income d
nd predicted G
oefficient of th
ond step involv
ws that the UM
hich belong to
HIC and UMI
to the low-in
re 2, countries
c. have a great
though the ineq
economy with
globalization in
imulation , it can be ob
LIC are advers
n the world eve
sting case to
ncome nations
mulations are ca
tion reducing i
n are observed
bution of globa
f India after a
lity in India is
distribution. Fi
ini of India. Th
he variable is m
ves taking a su
MIC and LIC h
o different inco
IC whereas co
ncome group,
characterized b
terlevel of ineq
quality remains
the economic
ndex, is compa
bserved that
sely affected
en though it
draw policy
s reduce its
arried out to
inequality in
d. Secondly,
alization and
adopting the
s caused by
nally, policy
he predicted
multiplied by
ummation of
have higher
ome country
ountries like
has greater
by HIC have
uality. India
s lower than
growth and
red with the

GDP g
increas
Sourc
Sourc
annua
globali
Ezcurr
distrib
marke
indicat
educat
growth rates an
sed, and incom
Figure 6: In
ce: Author’s co
ce: Author’s Ca
Figure 7 sh
l increase in in
ization isa prim
ra and Rodrígu
ution depends
et in many de
tors, trade ope
tion and GDP in
nd Gini coefficie
me inequality ha
ndia’s Compa
mpilation base
F
alculation based
hows the inequ
ncome inequalit
mary contributo
uez-Pose (201
s on the level
eveloping coun
enness has th
n other factors
ent. With an in
as decreased.
arison of Glob
ed on the data f
Figure 7: Dec
d on equation (
uality decompo
ty in India is 0.
ory factor in in
3) who find t
of developme
ntries still has
he highest imp
s group have a
15
crease in econ
balization, Gr
from WDI and
composition:
(2)
osition for India
.51% for India
creasing incom
that the effec
ent of the cou
s the potentia
pact in increas
negative impa
nomic globalizat
rowth and Inc
SWIID
India
a. The results
. The graph cle
me inequality. T
t of economic
untries and de
al to grow. A
sing income in
ct on income in
tion, economic
come Inequa
indicate that t
early shows tha
The result is su
c globalization
egree of the i
Amongst the g
nequality. Facto
nequality.
c growth has
lity
the average
at economic
upported by
on income
nternational
globalization
ors such as

Sourc
India.T
predict
enhan
India.
actualG
predict
UMIC
respec
Gini_U
the ine
and U
lower
some o
import
followe
FDI ha
simula
experi
implem
the ec
of bot
F
ce: Author’s Ca
Policy simu
The coefficient
ting India’s G
cing India’s gro
Figure 8 sho
Predicted Gini
Gini refers to t
ted Gini coeffic
as is obtained
ctively.
The results
UMIC and Gini_
equality for Ind
MIC. The pred
than actual Gi
of the advance
The dynam
tance of globa
ed by HICand
as played a sig
ations carried
enced a stro
mented in a ma
It can be in
conomic gap w
th sound eco
igure 8: Polic
alculation based
lations are car
t ofglobalizatio
Gini coefficient
owth.
ows the policy
iis based on th
the observed G
cient in India r
d in Table A.3
show that Gin
_HIC show tha
dia could decre
dicted values o
ini. Thus, India
ed economies in
ic panel data m
alizationin red
is minuscule fo
gnificant role i
out above als
nger effect o
anner in which
nferred that the
ith advanced n
onomic policies
cy Simulation
d on the equat
rried out to se
n variables is
t could help
simulations th
he estimation
Ginicoefficient in
relates to the e
3. The predict
ni coefficient fo
at the inequalit
easeif the glob
of India accord
a belonging to
n the period of
model estimate
ucing income
or LIC. The dec
in reducing ine
so indicate tha
of FDI. Thus,
the impact of
estrategies ado
nations. The st
s and institut
16
n for India on
ion (5)
ee the inequal
stronger for H
in bringing a
hat are carried
result of HIC a
n India and is i
estimated Gini
ted Gini in Ind
or Indiahas inc
tyfor India is r
balization effec
ding to the hig
o thelower mid
f economic glob
ed above and d
inequality. FD
composition of
equality in the
at inequality is
FDI policies
FDI on product
opted by the de
rategies of the
tional arrangem
Income Ineq
ity effects of e
HIC and UMIC
bout importan
out and the ac
and UMIC as i
indicated as Gi
according to t
dia isknown a
creased over t
educing signifi
cts were as stro
h-income coeff
dle-income gro
balization.
decomposition
DI has the hi
Gini results pr
e HICand UMIC
s lesser for th
in India sho
tivity is maxim
eveloped econo
e rich and adva
ments. Export
quality
economic glob
than LIC. In t
nt policy impl
ctual and pred
s given in Tab
ni_India in the
he coefficients
sGini_HIC and
the given perio
icantlywhich in
ong as in the
ficients have s
oup has fared
of inequalityhi
ghest coefficie
resented above
C. Interestingly
he economies
ould be encou
ized.
omies can help
anced economi
t-oriented indu
alization for
this context,
ications for
icted Gini of
ble A.3. The
e figure. The
s of HIC and
d Gini_UMIC
od.However,
ndicates that
case of HIC
shown to be
worse than
ighlights the
ent for HIC
e shows that
y, the policy
which have
uraged and
p India close
es comprise
ustrialization

17
strategies are the reason for achieving a high rate of success in many economies, especially in East
Asia.Broader access to education will allow LIC to develop necessary skills to absorb the benefits of
globalization and would help reduce inequality and poverty at a faster rate.
Conclusion Theoretically, globalization would make a developing country more egalitarian by raising the wage of its
abundant low-income unskilled labor.However, our evidence suggests that low-income regions are the
losers and advanced economies are the winners.
To look at the impact of economic globalization on income inequality, a panel data approach is
used for the period 1993-2012for 115 economies. This is followed by decomposition exercises and
policy simulations for evaluating the impact of economic globalization on income inequality.
Using a reliable data set suggests that the rise in income inequality across the various
categories of development is primarily attributable to economic globalization. While trade has increased
income inequality in the HIC and LIC, FDI continues to reduce income inequality.
The decomposition exercises indicate that low-income economies have the greatest adverse
impact of economic globalization on income inequality. Our findings also suggest that except low-
income economies, all other economies are reaping the benefits of globalization to some extent. FDI
has far-reaching effects of reducing income inequality in all the categories, though the magnitude is
very marginal in the low-income economies. FDI contributes more in developed countries which have
the technical absorptive capability and the desired level of human capital. The policy simulations
indicate that globalization has worsened income distribution and India, belonging to the low-income
category of economies, can fare better if we adopt the strategies of advanced economies.
Notes
i The KOF Index of Globalisation is an index of the degree of globalisation of 122 countries. It was conceived by Axel Dreher at the Konjunkturforschungsstelle of ETH Zurich, in Switzerland.
ii Kearney, A T (2003) explain the A.T. Kearney/Foreign Policy Magazine Globalization Index makes use of several indicators spanning information technology , finance, trade, personal communication, politics, and travel to determine a country's ranking. They provide a multifaceted view of a country's level of global integration by combining these indicators into four subcategories: economic integration, technology, personal contact, and political engagement.
iii The Stolper-Samuelson theorem asserts an increase in the domestic price of a commodity, brought about by a higher tariff or additional protection, will raise the price of the factor of production that is used relatively intensively in producing the commodity (Stolper and Samuelson 1941).
iv For estimating system GMM, we use the xtabond2 package in STATA developed by (Roodman, 2006).
18
Reference Adelman, I and Morris, C T (1973). Economic Growth and Social Equity in Developing Countries.
Stanford University Press.
Ahluwalia, M S (1976). Inequality, Poverty and Development. Journal of Development Economics, 3 (4):
307-42.
Anderson, E (2005). Openness and Inequality in Developing Countries: A Review of Theory and Recent
Evidence. World Development, 33 (7): 1045-63.
Arellano, M and Bond, S (1991). Some Tests of Specification for Panel Data: Monte Carlo Evidence and
an Application to Employment Equations. The Review of Economic Studies, 58 (2): 277-97.
Asteriou, D, Dimelis, S and Moudatsou, A (2014). Globalization and Income Inequality: A Panel Data
Econometric Approach for the EU27 Countries. Economic Modelling, 36: 592-99.
Baddeley, M (2006). Convergence or Divergence? The Impacts of Globalisation on Growth and
Inequality in Less Developed Countries. International Review of Applied Economics, 20 (3):
391-410.
Baltagi, B (2008). Econometric Analysis of Panel Data. John Wiley & Sons.
Becker, G S (1962). Investment in Human Capital: A Theoretical Analysis. Journal of Political Economy,
70 (5, Part 2): 9-49.
Bergh, A and Nilsson, T (2010). Do Liberalization and Globalization Increase Income Inequality?
European Journal of Political Economy, 26 (4): 488-505.
Blundell, R and Bond, S (1998). Initial Conditions and Moment Restrictions in Dynamic Panel Data
Models. Journal of Econometrics, 87 (1): 115-43.
Çelik, S and Basdas, U (2010). How Does Globalization Affect Income Inequality? A Panel Data Analysis.
International Advances in Economic Research, 16 (4): 358-70.
Chintrakarn, P, Herzer, D and Nunnenkamp, P (2012). FDI and Income Inequality: Evidence from a
Panel of US States. Economic Inquiry, 50 (3): 788-801.
Choi, C (2006). Does Foreign Direct Investment Affect Domestic Income Inequality? Applied Economics
Letters, 13 (12): 811-14.
Chu, A C (2010). Effects of Patent Policy on Income and Consumption Inequality in a R & D Growth
Model. Southern Economic Journal, 77 (2): 336-50.
Dabla-Norris, M E, Kochhar, M K, Suphaphiphat, M N, Ricka, M F and Tsounta, E (2015). Causes and
Consequences of Income Inequality: A Global Perspective. International Monetary Fund.
Deininger, K and Squire, L (1996). A New Data Set Measuring Income Inequality. The World Bank
Economic Review, 10 (3): 565-91.
Dollar, D and Kraay, A (2002). Growth is Good for the Poor. Journal of Economic Growth, 7 (3): 195-
225.
Dreher, A (2006). Does Globalization Affect Growth? Evidence from a New Index of Globalization.
Applied Economics, 38 (10): 1091–1110.
Dreher, A and Gaston, N (2008). Has Globalization Increased Inequality? Review of International
Economics, 16 (3): 516-36.

19
Ezcurra, R and Rodríguez-Pose, A (2013). Does Economic Globalization Affect Regional Inequality? A
Cross-country Analysis. World Development, 52: 92-103.
Feenstra, R C and Hanson, G H (1997). Foreign Direct Investment and Relative Wages: Evidence from
Mexico’s Maquiladoras. Journal of International Economics, 42 (3): 371-93.
Fields, G S and Yoo, G (2000). Falling Labor Income Inequality in Korea’s Economic Growth: Patterns
and Underlying Causes. Review of Income and Wealth, 46 (2): 139-59.
Herzer, D and Nunnenkamp, P (2013). Inward and Outward FDI and Income Inequality: Evidence from
Europe. Review of World Economics, 149 (2): 395-422.
Heshmati, A (2007). The Relationship between Income Inequality, Poverty and Globalization. In The
Impact of Globalization on the World’s Poor. Springer. Pp 59-93.
Im, H and McLaren, J (2015). Does Foreign Direct Investment Raise Income Inequality in Developing
Countries? A New Instrumental Variables Approach. Korea International Economic Association
Winter Conference, 2015, 34–34.
Jaumotte, F, Lall, S and Papageorgiou, C (2013). Rising Income Inequality: Technology, or Trade and
Financial Globalization? IMF Economic Review, 61 (2): 271–309.
Jones, C I and Williams, J C (2000). Too Much of a Good Thing? The Economics of Investment in R&D.
Journal of Economic Growth, 5 (1): 65-85.
Keohane, R O and Nye Jr, J S (2000). Globalization: What’s New? What’s Not? (And so what?). Foreign
Policy, 104-19.
Kuznets, S (1955). Economic Growth and Income Inequality. The American Economic Review, 1-28.
Lundberg, M and Squire, L (2003). The Simultaneous Evolution of Growth and Inequality. The Economic
Journal, 113 (487): 326-44.
Mazur, J (2000). Labor’s New Internationalism. Foreign Affairs, 79-93.
McMillan, M S and Rodrik, D (2011). Globalization, Structural Change and Productivity Growth. National
Bureau of Economic Research. Retrieved from http://www.nber.org/papers/w17143
Meschi, E and Vivarelli, M (2009). Trade and Income Inequality in Developing Countries. World
Development, 37 (2): 287-302.
Milanovic, B (2005). Can We Discern the Effect of Globalization on Income Distribution? Evidence from
Household Surveys. The World Bank Economic Review, 19 (1): 21-44.
Morduch, J and Sicular, T (2002). Rethinking Inequality Decomposition, with Evidence from Rural China.
The Economic Journal, 112 (476): 93-106.
Motonishi, T (2006). Why has Income Inequality in Thailand Increased?: An Analysis Using Surveys
from 1975 to 1998. Japan and the World Economy, 18 (4): 464-87.
Norris, P (2000). Global Governance and Cosmopolitan Citizens. Governance in a Globalizing World, 156.
Pyatt, G (1976). On the Interpretation and Disaggregation of Gini Coefficients. The Economic Journal,
86 (342): 243-55.
Rao, B B and Vadlamannati, K C (2011). Globalization and Growth in the Low Income African Countries
with the Extreme Bounds Analysis. Economic Modelling, 28 (3): 795-805.
Roodman, D (2006). How to Do Xtabond2: An Introduction to Difference and System GMM in Stata.
Schultz, T W (1961). Investment in Human Capital. The American Economic Review, 1-17.

20
Shorrocks, A F (1980). The Class of Additively Decomposable Inequality Measures. Econometrica:
Journal of the Econometric Society, 613-25.
————— (1982). Inequality Decomposition by Factor Components. Econometrica: Journal of the
Econometric Society, 193-211.
————— (1984). Inequality Decomposition by Population Subgroups. Econometrica: Journal of the
Econometric Society, 1369-85.
Stolper, W F and Samuelson, P A (1941). Protection and Real Wages. The Review of Economic Studies,
9 (1): 58-73.
Solt, F (2016). The Standardized World Income Inequality Database. Social Science Quarterly. Retrieved
from http://onlinelibrary.wiley.com/doi/10.1111/ssqu.12295/full
Sylwester, K (2005). Foreign Direct Investment, Growth and Income Inequality in Less Developed
Countries. International Review of Applied Economics, 19 (3): 289-300.
Wade, R H (2004). Is Globalization Reducing Poverty and Inequality? World Development, 32 (4): 567-
89.
Windmeijer, F (2005). A Finite Sample Correction for the Variance of Linear Efficient Two-step GMM
Estimators. Journal of Econometrics, 126 (1): 25-51.

21
Appendix Table A.1: Sample of Countries
HIC UMIC LIC
Australia Albania Armenia
Austria Argentina Bangladesh
Belgium Azerbaijan Bolivia
Canada Belarus Burkina Faso
Chile Brazil Cambodia
Croatia Bulgaria Cameroon
Cyprus China Cote d'Ivoire
Czech Republic Colombia Egypt, Arab Rep.
Denmark Costa Rica El Salvador
Estonia Dominican Republic Ethiopia
Finland Ecuador Guatemala
France Hungary Honduras
Germany Kazakhstan India
Greece Macedonia, FYR Indonesia
Hong Kong SAR, China Malaysia Kenya
Iceland Mauritius Kyrgyz Republic
Ireland Mexico Lao PDR
Israel Namibia Lesotho
Italy Panama Madagascar
Japan Peru Malawi
Korea, Rep. Romania Mali
Latvia South Africa Mauritania
Lithuania Thailand Moldova
Luxembourg Tunisia Mongolia
Malta Turkey Morocco
Netherlands Venezuela, RB Mozambique
New Zealand Nepal
Norway Nicaragua
Poland Pakistan
Portugal Paraguay
Russian Federation Philippines
Singapore Senegal
Slovak Republic Sierra Leone
Slovenia Sri Lanka
Spain Swaziland
Sweden Tajikistan
Switzerland Tanzania
Trinidad and Tobago Uganda
United Kingdom Ukraine
United States Vietnam
Uruguay Zambia
Zimbabwe
22
Table A.2: Estimation Results of Static Panel Data
Model No 2.1 2.2 2.3 2.4 2.5 2.6
Dependent Variable: Gini
Full Models Benchmark Models
HIC UMIC LIC HIC UMIC LIC
RE FE RE RE FE FE
Trade Openness 0.659(.92) 5.663***(3.17) 0.41(.16) 1.413**(2.36) 5.062***(3.64) -0.924***(-2.94)
FDI -0.003(-0.15) -0.109***(-2.93) -0.07(-1.44) -0.011*(-1.68) -0.098***(-2.84) -0.013***(-2.65)
Internet 0.022***(3.24) -0.056**(-2.02) 0.23 0.040***(6.84) -0.065***(-3.03) -0.106**(-2.42)
Patent -0.055(-0.46) 0.315(1.05) 0.21(.52) 0.097(.88)
DCP -0.001(-0.32) 0.050***(2.9) 0.03(1.15) -0.001(-0.23) 0.046***(3.12) 0.074***(3.62)
Agricultural Employment 0.026(.35) -0.146***(2.94) 0.1(1.47)
-0.165***(-4.30)
Industrial Employment -0.293***(-5.28) -0.104(-0.64) 0.24(1.23) -0.252**(-2.29)
Education 0.028**(2.17) -0.143***(-3.83) 0.02(.33) -0.095***(-3.64) 0(.10)
GDP per capita 40.541***(4.97) 1.215(.74) -8.02(-0.25) 39.535***(5.85) 0.497(.37) 14.39(-1.22)
GDP per capita Squared -2.222***(-5.20) 0.006(.21) 0.84(.36) -2.173***(-5.94) 0.019(.72) -1.2(-1.36)
Constant -131.830***(-3.39) 43.121***(3.59) 47.12(.43) -134.053***(-4.26) 52.359***(5.23) 2.14(.05)
Adjusted R-Square 0.16 0.27 0.155 0.184 0.28 0.14
No. of Observations 573 232 127.00 667 317 389.00
Hausman Test 0.63 0.04 0.1665 0.1278 0.0132 0.04
LM Test 0 0 0 0 0 0 Note: 1.Figures in parentheses indicates t –values based on robust standard errors. ***/**/* indicate significance at 1%, 5%, 10% respectively.
2. RE and FE indicate random effect and fixed effect model respectively.
Source: Author’s Calculation based on equation (3)

23
Table A.3: Estimation Results of Dynamic Panel Data
Model No 3.1 3.2 3.3 3.4 3.5 3.6
Dependent Variable: Gini
Full Models Benchmark Models
HIC UMIC LIC HIC UMIC LIC
L.Gini 1.019***(6.81) -0.245(-0.62) 0.577***(3.53) 0.985***(10.18) 0.631***(2.87) 0.850***(4.01)
Trade Openness 0.039(.18) -8.334**(-2.50) 2.54(1.08) 0.248*(1.79) -2.73*(-1.94) 0.06*(1.83)
FDI -0.022(-1.04) -0.11(-1.61) 0.05(1.22) -0.025*(-1.74) -0.082**(-2.53) -0.002**(2.54)
Internet 0.00855 0.1719 0.01(.12) -0.007***(-2.97) -0.081***(-4.25) 0.01(.31)
Patent -0.031(-1.04) -0.004(-0.01) 0.12(.61) -0.015(-0.51)
DCP 0.004**(2.15) 0.121**(2.82) 0.02(.99) 0.004**(2.53) 0.045*(1.77) 0.034*(1.88)
Agricultural Employment 0.008(.18) -0.320**(-2.28) -0.06(-0.78) 0.004(.12) -0.066(-1.50)
Industrial Employment -0.004(-0.05) -0.382**(-2.21) -0.3(-1.40) -0.022*(-1.85) '-0.175*(-1.71)
Education 0.004(-.64) 0.3956 -0.094**(-2.29) -0.02(-0.55)
GDP per capita -6.257(-0.95) 6.760**(2.63) -2.99(-0.17) -4.43*(-1.86) 2.05(1.01) 2.54(.37)
GDP per capita Squared 0.311(.87) -0.045(-1.06) 0.35(.26) 0.213*(1.72) 0.004(.042) -0.17(.38)
Constant 30.36(1.31) 37.408(1.25) 32.5(.52) 24.25*(1.85) 5.491(.52) -2.49(-.15)
F Statistic 213.62 17.35 88.13 236.26 331.8 161.74
No. of Obs. 550 223 125.00 616 367 385.00
AR(2) 0.217 0.635 0.57 0.164 0.544 0.55
Hansen 0.406 0.451 0.88 0.406 0.515 0.87
No of Instruments 13 14 14.00 15 18 13.00
No of Groups 39 21 18.00 40 28 42.00 Note: Figures in parentheses indicate t –values based on robust standard errors. ***/**/* indicate significance at 1%, 5%, 10% respectively.
Source: Author’s Calculation based on equation (4)

329 Identifying the High Linked Sectors forIndia: An Application of Import-AdjustedDomestic Input-Output MatrixTulika Bhattacharya and Meenakshi Rajeev
330 Out-Of-Pocket (OOP) Financial RiskProtection: The Role of Health InsuranceAmit Kumar Sahoo and S Madheswaran
331 Promises and Paradoxes of SEZs Expansionin IndiaMalini L Tantri
332 Fiscal Sustainability of National FoodSecurity Act, 2013 in IndiaKrishanu Pradhan
333 Intergrated Child Development Servicesin KarnatakaPavithra Rajan, Jonathan Gangbar and K Gayithri
334 Performance Based Budgeting:Subnational Initiatives in India and ChinaK Gayithri
335 Ricardian Approach to Fiscal Sustainabilityin IndiaKrishanu Pradhan
336 Performance Analysis of National HighwayPublic-Private Partnerships (PPPs) in IndiaNagesha G and K Gayithri
337 The Impact of Infrastructure Provisioningon Inequality: Evidence from IndiaSumedha Bajar and Meenakshi Rajeev
338 Assessing Export Competitiveness atCommodity Level: Indian Textile Industryas a Case StudyTarun Arora
339 Participation of Scheduled CasteHouseholds in MGNREGS: Evidence fromKarnatakaR Manjula and D Rajasekhar
340 Relationship Between Services Trade,Economic Growth and ExternalStabilisation in India: An EmpiricalInvestigationMini Thomas P
341 Locating the Historical Past of the WomenTea Workers of North BengalPriyanka Dutta
342 Korean Media Consumption in Manipur: ACatalyst of Acculturation to KoreanCultureMarchang Reimeingam
343 Socio-Economic Determinants of EducatedUnemployment in IndiaIndrajit Bairagya
344 Tax Contribution of Service Sector: AnEmpirical Study of Service Taxation inIndiaMini Thomas P
345 Effect of Rural Infrastructure onAgricultural Development: District-LevelAnalysis in KarnatakaSoumya Manjunath and Elumalai Kannan
346 Moreh-Namphalong Border TradeMarchang Reimeingam
Recent Working Papers347 Emerging Trends and Patterns of India’s
Agricultural Workforce: Evidence from theCensusS Subramanian
348 Estimation of the Key EconomicDeterminants of Services Trade: Evidencefrom IndiaMini Thomas P
349 Employment-Export Elasticities for theIndian Textile IndustryTarun Arora
350 Caste and Care: Is Indian HealthcareDelivery System Favourable for Dalits?Sobin George
351 Food Security in Karnataka: Paradoxes ofPerformanceStacey May Comber, Marc-Andre Gauthier,Malini L Tantri, Zahabia Jivaji and Miral Kalyani
352 Land and Water Use Interactions:Emerging Trends and Impact on Land-useChanges in the Tungabhadra and TagusRiver BasinsPer Stalnacke, Begueria Santiago, Manasi S, K VRaju, Nagothu Udaya Sekhar, Maria ManuelaPortela, António Betaâmio de Almeida, MartaMachado, Lana-Renault, Noemí, Vicente-Serranoand Sergio
353 Ecotaxes: A Comparative Study of Indiaand ChinaRajat Verma
354 Own House and Dalit: Selected Villages inKarnataka StateI Maruthi and Pesala Busenna
355 Alternative Medicine Approaches asHealthcare Intervention: A Case Study ofAYUSH Programme in Peri Urban LocalesManasi S, K V Raju, B R Hemalatha,S Poornima, K P Rashmi
356 Analysis of Export Competitiveness ofIndian Agricultural Products with ASEANCountriesSubhash Jagdambe
357 Geographical Access and Quality ofPrimary Schools - A Case Study of South24 Parganas District of West BengalJhuma Halder
358 The Changing Rates of Return to Educationin India: Evidence from NSS DataSmrutirekha Singhari and S Madheswaran
359 Climate Change and Sea-Level Rise: AReview of Studies on Low-Lying and IslandCountriesNidhi Rawat, M S Umesh Babu andSunil Nautiyal
360 Educational Outcome: Identifying SocialFactors in South 24 Parganas District ofWest BengalJhuma Halder
361 Social Exclusion and Caste Discriminationin Public and Private Sectors in India: ADecomposition AnalysisSmrutirekha Singhari and S Madheswaran
362 Value of Statistical Life: A Meta-Analysiswith Mixed Effects Regression ModelAgamoni Majumder and S Madheswaran

363 Informal Employment in India: An Analysisof Forms and DeterminantsRosa Abraham
364 Ecological History of An Ecosystem UnderPressure: A Case of Bhitarkanika in OdishaSubhashree Banerjee
365 Work-Life Balance among WorkingWomen – A Cross-cultural ReviewGayatri Pradhan
366 Sensitivity of India’s Agri-Food Exportsto the European Union: An InstitutionalPerspectiveC Nalin Kumar
367 Relationship Between Fiscal DeficitComposition and Economic Growth inIndia: A Time Series EconometricAnalysisAnantha Ramu M R and K Gayithri
368 Conceptualising Work-life BalanceGayatri Pradhan
369 Land Use under Homestead in Kerala:The Status of Homestead Cultivationfrom a Village StudySr. Sheeba Andrews and Elumalai Kannan
370 A Sociological Review of Marital Qualityamong Working Couples in BangaloreCityShiju Joseph and Anand Inbanathan
371 Migration from North-Eastern Region toBangalore: Level and Trend AnalysisMarchang Reimeingam
372 Analysis of Revealed ComparativeAdvantage in Export of India’s AgriculturalProductsSubhash Jagdambe
373 Marital Disharmony among WorkingCouples in Urban India – A SociologicalInquityShiju Joseph and Anand Inbanathan
374 MGNREGA Job Sustainability and Povertyin SikkimMarchang Reimeingam
375 Quantifying the Effect of Non-TariffMeasures and Food Safety Standards onIndia’s Fish and Fishery Products’ ExportsVeena Renjini K K
376 PPP Infrastructure Finance: An EmpiricalEvidence from IndiaNagesha G and K Gayithri
377 Contributory Pension Schemes for thePoor: Issues and Ways ForwardD Rajasekhar, Santosh Kesavan and R Manjula
378 Federalism and the Formation of States inIndiaSusant Kumar Naik and V Anil Kumar
379 Ill-Health Experience of Women: A GenderPerspectiveAnnapuranam Karuppannan
380 The Political Historiography of ModernGujaratTannen Neil Lincoln
381 Growth Effects of Economic Globalization:A Cross-Country AnalysisSovna Mohanty
382 Trade Potential of the Fishery Sector:Evidence from IndiaVeena Renjini K K
383 Toilet Access among the Urban Poor –Challenges and Concerns in BengaluruCity SlumsS Manasi and N Latha
384 Usage of Land and Labour under ShiftingCultivation in ManipurMarchang Reimeingam
385 State Intervention: A Gift or Threat toIndia’s Sugarcane Sector?Abnave Vikas B and M Devendra Babu
386 Structural Change and Labour ProductivityGrowth in India: Role of Informal WorkersRosa Abraham
387 Electricity Consumption and EconomicGrowth in KarnatakaLaxmi Rajkumari and K Gayithri
388 Augmenting Small Farmers’ Incomethrough Rural Non-farm Sector: Role ofInformation and InstitutionsMeenakshi Rajeev and Manojit Bhattacharjee
389 Livelihoods, Conservation and ForestRights Act in a National Park: AnOxymoron?Subhashree Banerjee and Syed Ajmal Pasha
390 Womanhood Beyond Motherhood:Exploring Experiences of VoluntaryChildless WomenChandni Bhambhani and Anand Inbanathan
Price: ` 30.00 ISBN 978-81-7791-247-0
INSTITUTE FOR SOCIAL AND ECONOMIC CHANGEDr V K R V Rao Road, Nagarabhavi P.O., Bangalore - 560 072, India
Phone: 0091-80-23215468, 23215519, 23215592; Fax: 0091-80-23217008E-mail: [email protected]; Web: www.isec.ac.in