Economic Evaluation of Drying of Soot Sludge and Sawdust ...
17
chemengineering Article Economic Evaluation of Drying of Soot Sludge and Sawdust Mixture at Low Temperatures Using the Characteristic Drying Curve Method † Tiina Myllymaa *, Henrik Holmberg and Pekka Ahtila Department of Mechanical Engineering, School of Engineering, Aalto University, Sähkömiehentie 4 J, P.O. Box 14400, FI-00076 Aalto, Finland; Henrik.Holmberg@aalto.fi (H.H.); Pekka.Ahtila@aalto.fi (P.A.) * Correspondence: Tiina.Myllymaa@aalto.fi † This paper is an extended version of the paper presented in Nordic Baltic Drying Conference 2019. Received: 23 October 2019; Accepted: 9 January 2020; Published: 12 January 2020 Abstract: Soot sludge is a waste stream formed in the fuel oil gasification of formic acid and hydrogen peroxide production. The soot sludge has a high moisture content (95%) and is presently combusted with heavy fuel oil in order to dispose of the sludge. Experimental tests earlier conducted by the authors have shown that the sludge can be convectively dried with sawdust in a fixed bed. By upgrading the sludge from waste to fuel, the utilization of oil can be decreased. In this study, characteristic drying curves (CDC) are determined for the sludge and sawdust mixture. The CDCs are further used to evaluate the economy of the mixture drying in a belt dryer by using the payback period method. Results show that the linear CDCs of the mixture can be used to extrapolate drying data from specific drying conditions to another when the bed height is 200 or 300 mm, and the inlet air temperature 40–100 ◦ C. The economic analysis shows that drying is economical for all inlet air temperatures if the oil price is ≥350 €/t-oil. Sensitivity analyses reveal that the heat, sawdust and emission prices have no remarkable influence on the economy of drying if the oil price does not fall below c. 300 €/t-oil. Keywords: carbon black; carbon soot; characteristic drying curve; constant drying curve; payback period 1. Introduction The production plant of the Eastman Chemical Company [1] forms a waste stream called soot sludge. This stream is waste generated in a production process of formic acid and hydrogen peroxide. The soot sludge has an extremely high moisture content (c. 95% wb) as well as a sticky and viscous nature. The soot sludge is currently disposed of by combusting it in a combined heat and power plant (CHP) by mixing fuel oil with the soot sludge in order to combust it. In Eastman’s production plant, moist soot sludge is formed approximately 20 t wb /d. The moisture content of waste sludges can be reduced by removing water without vaporization (e.g., mechanical dewatering) [2,3] or using thermal drying [4–9]. A previous study by the authors [5] experimentally examined the ways soot sludge could be upgraded from waste to fuel by drying it at low temperatures (below 100 ◦ C) before combustion. Drying tests were conducted in a fixed bed. In practice, drying pure soot sludge in a fixed bed is impossible; therefore, sawdust was mixed with it before the drying. Drying curves were determined for bed heights of 200 and 300 mm, inlet air temperatures of 40, 80, and 100 ◦ C, and for air velocities of 0.75 and 0.9 m/s. The previous study showed that the most optimal mixture ratio of soot sludge and sawdust is 50% soot sludge and 50% sawdust (vol. %). The previous study [5] also studied ChemEngineering 2020, 4, 6; doi:10.3390/chemengineering4010006 www.mdpi.com/journal/chemengineering
Transcript of Economic Evaluation of Drying of Soot Sludge and Sawdust ...
chemengineering
Article
Economic Evaluation of Drying of Soot Sludge andSawdust Mixture at Low Temperatures Using theCharacteristic Drying Curve Method†
Tiina Myllymaa *, Henrik Holmberg and Pekka Ahtila
Department of Mechanical Engineering, School of Engineering, Aalto University, Sähkömiehentie 4 J,P.O. Box 14400, FI-00076 Aalto, Finland; [email protected] (H.H.); [email protected] (P.A.)* Correspondence: [email protected]† This paper is an extended version of the paper presented in Nordic Baltic Drying Conference 2019.
Received: 23 October 2019; Accepted: 9 January 2020; Published: 12 January 2020�����������������
Abstract: Soot sludge is a waste stream formed in the fuel oil gasification of formic acid and hydrogenperoxide production. The soot sludge has a high moisture content (95%) and is presently combustedwith heavy fuel oil in order to dispose of the sludge. Experimental tests earlier conducted bythe authors have shown that the sludge can be convectively dried with sawdust in a fixed bed.By upgrading the sludge from waste to fuel, the utilization of oil can be decreased. In this study,characteristic drying curves (CDC) are determined for the sludge and sawdust mixture. The CDCsare further used to evaluate the economy of the mixture drying in a belt dryer by using the paybackperiod method. Results show that the linear CDCs of the mixture can be used to extrapolate dryingdata from specific drying conditions to another when the bed height is 200 or 300 mm, and the inletair temperature 40–100 ◦C. The economic analysis shows that drying is economical for all inlet airtemperatures if the oil price is ≥350 €/t-oil. Sensitivity analyses reveal that the heat, sawdust andemission prices have no remarkable influence on the economy of drying if the oil price does not fallbelow c. 300 €/t-oil.
Keywords: carbon black; carbon soot; characteristic drying curve; constant drying curve; paybackperiod
1. Introduction
The production plant of the Eastman Chemical Company [1] forms a waste stream called sootsludge. This stream is waste generated in a production process of formic acid and hydrogen peroxide.The soot sludge has an extremely high moisture content (c. 95% wb) as well as a sticky and viscousnature. The soot sludge is currently disposed of by combusting it in a combined heat and power plant(CHP) by mixing fuel oil with the soot sludge in order to combust it. In Eastman’s production plant,moist soot sludge is formed approximately 20 twb/d. The moisture content of waste sludges can bereduced by removing water without vaporization (e.g., mechanical dewatering) [2,3] or using thermaldrying [4–9].
A previous study by the authors [5] experimentally examined the ways soot sludge could beupgraded from waste to fuel by drying it at low temperatures (below 100 ◦C) before combustion.Drying tests were conducted in a fixed bed. In practice, drying pure soot sludge in a fixed bed isimpossible; therefore, sawdust was mixed with it before the drying. Drying curves were determinedfor bed heights of 200 and 300 mm, inlet air temperatures of 40, 80, and 100 ◦C, and for air velocitiesof 0.75 and 0.9 m/s. The previous study showed that the most optimal mixture ratio of soot sludgeand sawdust is 50% soot sludge and 50% sawdust (vol. %). The previous study [5] also studied
ChemEngineering 2020, 4, 6; doi:10.3390/chemengineering4010006 www.mdpi.com/journal/chemengineering

ChemEngineering 2020, 4, 6 2 of 17
other mixture ratios for soot sludge and sawdust mixture. The goal was to find a mixture ratio thatminimizes the use of sawdust but does not increase drying time too much. When the amount of sootsludge was higher (70% soot sludge and 30% sawdust) drying times became approximately three timeshigher than in the case of 50%:50%. When the amount of soot sludge was just 30% in a mixture dryingtime was shorter than in the case of 50%:50% (1.5 h vs. 2.3 h) but it was at the same magnitude andtherefore the mixture ratio of 50:50 was chosen.
Usually, it is necessary to know the drying time in order to design a dryer. One option is touse drying models to define the drying time. Unfortunately, drying models may sometimes yieldextremely inaccurate estimates of the real drying time. Experimental drying tests usually evaluatedrying times more precisely. However, large amounts of measurements are needed to define dryingcurves under various drying conditions. Experimental drying tests are usually time consuming andthey can even be costly. A single drying curve, called a characteristic drying curve (CDC), can beformed by normalizing measured drying curves with respect to the constant drying rate and criticalmoisture content. A characteristic drying curve can be used to extrapolate drying data from one set ofexternal conditions to another. This reduces the number of measurements. Furthermore, a single curvealso describes the drying rate over a wide range of different drying conditions. [10,11].
Recently, characteristic drying curves have been defined in several studies. Many of those studiesfocus on convective air drying of fruits, plants and vegetables in fixed beds as ginger roots [12],eucalyptus [13], banana [14], green sweet pepper [15], cactus [16], spearmint [17], prickly pear fruit [18],rosemary leaves [19], and cellulosic fibres from citrus fruits [20]. Characteristic drying curves havealso been formed for wood-based materials, such as granulated cork (bark) [21], softwood timber [22],bark [11], and wood fibres (MDF) [23]. Characteristic drying curves have also been defined forsardine [24], and plaster [25]. In this study, characteristic drying curves are determined for a soot sludgeand sawdust mixture which has been dried in fixed beds at different bed heights and air temperatures.To be able to define the constant drying rate in various drying conditions, a volumetric heat transfercoefficient is also defined for the mixture. In addition, characteristic drying curves are used in aneconomic analysis in which the profitability is evaluated of the soot sludge drying before combustion.
2. Materials and Methods
2.1. Generation of the Soot Sludge
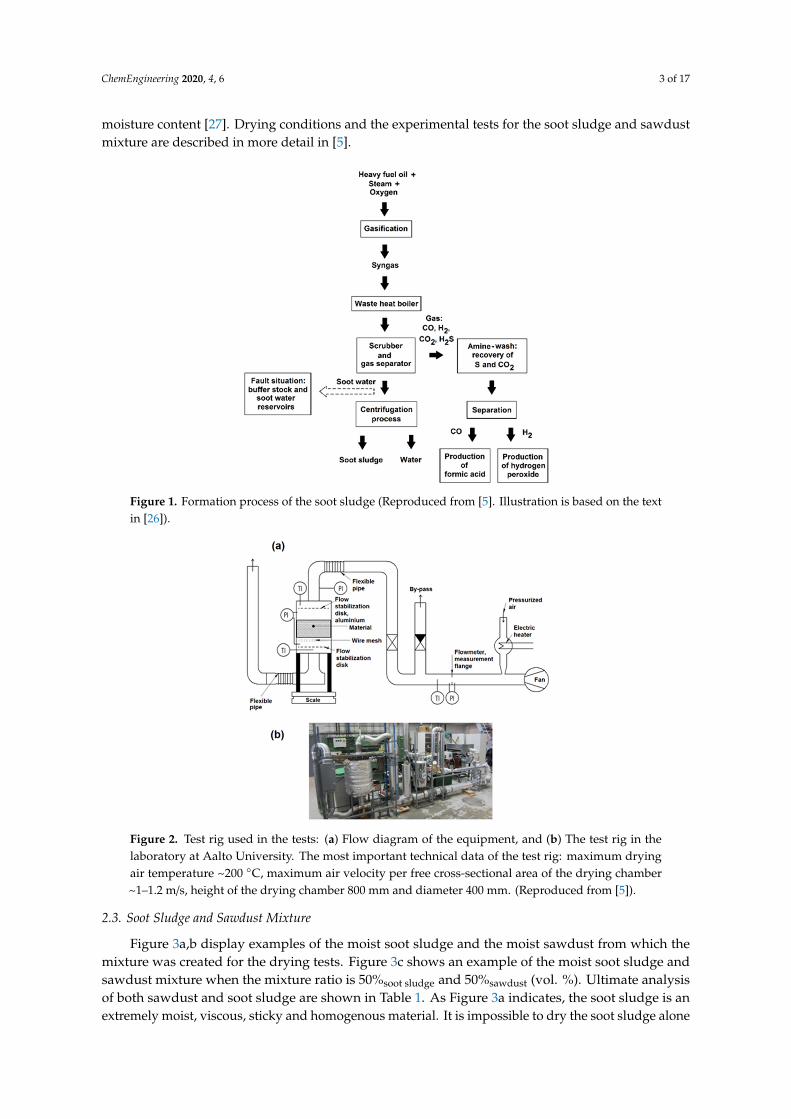
Figure 1 shows the formation process of the soot sludge. Syngas is formed in the gasificationprocess of heavy fuel oil with oxygen (partial oxidation) and steam at high pressure. The syngascontains carbon soot 1–2% of the amount of the used heavy fuel oil. The syngas is led for cooling in awaste heat boiler. Then, it is scrubbed with water, and the gas (CO, H2, CO2, H2S) and soot water areseparated. The soot water is led into a centrifugation process from which the soot sludge is obtained.After an amine-wash of the gas (recovery of sulphur and CO2), the gas is led into a separation processin which CO and H2 are separated for the production of formic acid and hydrogen peroxide [26].
2.2. Experimental Test Equipment
Figure 2 presents the experimental test equipment which has been used in drying tests. The dryeris a fixed-bed batch dryer where heat transfers convectively from drying air to the material.Hot pressurized air is mixed with the indoor air in an air duct. By adjusting the temperatureof the pressurized air and the mass flow rate of the indoor air, a desired air temperature and velocityare achieved before the bed. The mass flow rate of the indoor air is adjusted by changing the rotationspeed of the fan. The drying air moves through the bed from top to bottom. The drying time of thesample is defined using a direct method: the whole drying chamber lays on a scale which measuresand saves the mass of the mixture sample on the computer at 10 s intervals. When the sample dries,its mass decreases. Drying curves can then be defined on the basis of the mass change and initial
ChemEngineering 2020, 4, 6 3 of 17
moisture content [27]. Drying conditions and the experimental tests for the soot sludge and sawdustmixture are described in more detail in [5].ChemEngineering 2020, 4, x 3 of 18
Figure 1. Formation process of the soot sludge (Reproduced from [5]. Illustration is based on the text in [26]).
Figure 2. Test rig used in the tests: (a) Flow diagram of the equipment, and (b) The test rig in the laboratory at Aalto University. The most important technical data of the test rig: maximum drying air temperature ~200 °C, maximum air velocity per free cross-sectional area of the drying chamber ~1–1.2 m/s, height of the drying chamber 800 mm and diameter 400 mm. (Reproduced from [5]).
2.3. Soot Sludge and Sawdust Mixture
Figure 3a,b display examples of the moist soot sludge and the moist sawdust from which the mixture was created for the drying tests. Figure 3c shows an example of the moist soot sludge and sawdust mixture when the mixture ratio is 50%soot sludge and 50%sawdust (vol. %). Ultimate analysis of both sawdust and soot sludge are shown in Table 1. As Figure 3a indicates, the soot sludge is an extremely moist, viscous, sticky and homogenous material. It is impossible to dry the soot sludge alone in a fixed bed, because the drying air cannot evenly move through the material bed. When sawdust was mixed with the soot sludge (Figure 3c), the air could flow evenly through the bed enabling drying [5]. The total moisture content and the bulk density of the mixture of 50%soot sludge and 50%sawdust are 84% (wet basis) and 116 kgdb/bulk-m3, respectively.
Figure 1. Formation process of the soot sludge (Reproduced from [5]. Illustration is based on the textin [26]).
ChemEngineering 2020, 4, x 3 of 18
Figure 1. Formation process of the soot sludge (Reproduced from [5]. Illustration is based on the text in [26]).
Figure 2. Test rig used in the tests: (a) Flow diagram of the equipment, and (b) The test rig in the laboratory at Aalto University. The most important technical data of the test rig: maximum drying air temperature ~200 °C, maximum air velocity per free cross-sectional area of the drying chamber ~1–1.2 m/s, height of the drying chamber 800 mm and diameter 400 mm. (Reproduced from [5]).
2.3. Soot Sludge and Sawdust Mixture
Figure 3a,b display examples of the moist soot sludge and the moist sawdust from which the mixture was created for the drying tests. Figure 3c shows an example of the moist soot sludge and sawdust mixture when the mixture ratio is 50%soot sludge and 50%sawdust (vol. %). Ultimate analysis of both sawdust and soot sludge are shown in Table 1. As Figure 3a indicates, the soot sludge is an extremely moist, viscous, sticky and homogenous material. It is impossible to dry the soot sludge alone in a fixed bed, because the drying air cannot evenly move through the material bed. When sawdust was mixed with the soot sludge (Figure 3c), the air could flow evenly through the bed enabling drying [5]. The total moisture content and the bulk density of the mixture of 50%soot sludge and 50%sawdust are 84% (wet basis) and 116 kgdb/bulk-m3, respectively.
Figure 2. Test rig used in the tests: (a) Flow diagram of the equipment, and (b) The test rig in thelaboratory at Aalto University. The most important technical data of the test rig: maximum dryingair temperature ~200 ◦C, maximum air velocity per free cross-sectional area of the drying chamber~1–1.2 m/s, height of the drying chamber 800 mm and diameter 400 mm. (Reproduced from [5]).
2.3. Soot Sludge and Sawdust Mixture
Figure 3a,b display examples of the moist soot sludge and the moist sawdust from which themixture was created for the drying tests. Figure 3c shows an example of the moist soot sludge andsawdust mixture when the mixture ratio is 50%soot sludge and 50%sawdust (vol. %). Ultimate analysisof both sawdust and soot sludge are shown in Table 1. As Figure 3a indicates, the soot sludge is anextremely moist, viscous, sticky and homogenous material. It is impossible to dry the soot sludge alone

ChemEngineering 2020, 4, 6 4 of 17
in a fixed bed, because the drying air cannot evenly move through the material bed. When sawdust wasmixed with the soot sludge (Figure 3c), the air could flow evenly through the bed enabling drying [5].The total moisture content and the bulk density of the mixture of 50%soot sludge and 50%sawdust are 84%(wet basis) and 116 kgdb/bulk-m3, respectively.
In general, the sawdust should be as dry as possible to reduce the water content of the mixture.Unfortunately, it is not always possible to get dry sawdust. The moisture content depends on wherethe sawdust comes from. For example, the sawdust used in these tests came directly from the sawmill,and therefore it’s moisture content was at the same magnitude as the moisture content of fresh wood.
ChemEngineering 2020, 4, x 4 of 18
In general, the sawdust should be as dry as possible to reduce the water content of the mixture. Unfortunately, it is not always possible to get dry sawdust. The moisture content depends on where the sawdust comes from. For example, the sawdust used in these tests came directly from the sawmill, and therefore it’s moisture content was at the same magnitude as the moisture content of fresh wood.
Figure 3. (a) Moist soot sludge (95% wb), (b) moist sawdust (56% wb), (c) moist soot sludge and sawdust mixture (mixture ratio in vol. %: 50% soot sludge and 50% sawdust). (Reproduced from [5]).
Table 1. Ultimate analysis of soot sludge and sawdust [5].
Material Moisture Content (% w.b.) C (% in d.b.) H N S O Cl Ash
Soot Sludge 95 65.9 0.66 0.35 1.34 4.50 - 27.2 Sawdust 56 48–50 6–6.5 0.5–2.3 0.05 38–42 <0.01 0.4–0.6
2.4. Characteristic Drying Curve
The characteristic drying curve corresponds to the relative drying rate as a function of the relative moisture content. The relative drying rate (𝑚 ) is defined using the following equation: 𝑚 = , (1)
where 𝑚 is the drying rate at the time t and 𝑚 is the drying rate during the constant drying rate period. The relative moisture content (𝑋 ) is defined as follows:
Figure 3. (a) Moist soot sludge (95% wb), (b) moist sawdust (56% wb), (c) moist soot sludge andsawdust mixture (mixture ratio in vol. %: 50% soot sludge and 50% sawdust). (Reproduced from [5]).
Table 1. Ultimate analysis of soot sludge and sawdust [5].
Material Moisture Content(% w.b.) C (% in d.b.) H N S O Cl Ash
Soot Sludge 95 65.9 0.66 0.35 1.34 4.50 - 27.2
Sawdust 56 48–50 6–6.5 0.5–2.3 0.05 38–42 <0.01 0.4–0.6

ChemEngineering 2020, 4, 6 5 of 17
2.4. Characteristic Drying Curve
The characteristic drying curve corresponds to the relative drying rate as a function of the relativemoisture content. The relative drying rate (mR) is defined using the following equation:
mR =mm0
, (1)
where m is the drying rate at the time t and m0 is the drying rate during the constant drying rate period.The relative moisture content (XR) is defined as follows:
XR =X −Xeq
Xcr −Xeq, (2)
where X is the moisture content at the time t, Xeq denotes the equilibrium moisture content, and Xcr
is the critical moisture content. Critical moisture content is a moisture content at which the constantdrying rate period ends and the falling drying rate period begins. In many cases, approaches 0 andEquation (2) results in:
XR =X
Xcr. (3)
When the characteristic drying curve is used the drying rate is expressed as follows [10]:
m = m0 f (XR), (4)
where m0 is the drying rate in period of constant drying rate and f (XR) is the characteristic dryingcurve. The change of the moisture content of the bed over a small time interval becomes:
m = −dXdτ
. (5)
Substituting Equation (4) into (5) and integrating the equation, the drying time can be calculatedas follows:
τ = −Xcr
m0
∫ XR2
XR1
dxR
f (xR), (6)
where Xcr is the critical moisture content. In this paper, the constant drying rate m0 is always given perdry mass of the bed [kgH2O/(kgdb s)].
If Equation (6) can be integrated, the drying time can be analytically calculated. If Equation (6)cannot be integrated, the drying time must be numerically solved. When Equation (6) is used for thefixed bed, the constant drying rate can be calculated as follows:
m0 =αaρbulk·lv
·tair, in − tair, out
ln tair,in−twbtair, out−twb
, (7)
where twb is the surface temperature of the material during the constant drying rate period, whichis the same as the wet bulb temperature [◦C], tair, in is the temperature of air before the bed, tair, outrepresents the temperature of air after the bed, ρbulk is the bulk density of dry material [kgdb/m3], and lvis the vaporization heat of water at twb [J/kg]. In Equation (7), the product αa represents the volumetricheat transfer coefficient. A rough approximation for the volumetric heat transfer coefficient of the sootsludge and sawdust mixture is defined in Section 3.2.
2.5. Economic Analysis
The economic analysis assesses whether it is economical to dry the soot sludge in a fixed bedbelt dryer before the combustion. Drying of the soot sludge is an energy efficiency investment. The
ChemEngineering 2020, 4, 6 6 of 17
economy of the energy efficiency investment is typically evaluated using the payback period withoutinterest (Equation (8)). The characteristic drying curve is used for calculation of the drying time of thespecific drying process in an economic analysis. The payback period for the dryer is
PBP =Itot, dryer
Snet, (8)
in which Itot,dryer is the total investment costs [€], and Snet is the annual net savings when the sootsludge and sawdust mixture is dried, instead of the direct combustion of moist soot sludge [€/years].Savings result from reduced heavy fuel consumption and lower CO2 emissions. Operational costsof the dryer and purchased cost of sawdust result in some additional expenses. When savings andadditional expenses are taken into account, net savings become
Snet = Psavings, f uel + Psavings, CO2 − Poper − Psawdust. (9)
The total investment costs of the dryer (Itot,dryer,) are calculated using the following equation [28]:
Itot,dryer = Adryer·
[−3095 ln
(Adryer
480
)+ 5838
], (10)
where Adryer is the cross-sectional area of a continuous-working belt dryer [m2]. When the residencetime of the material inside the dryer (τ, [s]) is known, the cross-sectional area of the dryer (Adryer) canbe approximately defined as follows:
Adryer =
.mdb·τ
ρbulkZ, (11)
where.
mdb is the mass flow rate of dry material [kgdb/s], ρbulk denotes the bulk density of dry material[kgdb/m3] and Z is the bed height [m]. The savings, in Equation (9), are calculated as follows:
Psavings, f uel + Psavings, CO2 = ∆.
m f uel·γ·C f uel + ∆.
m f uel·γ·qoil·SCO2·CCO2, (12)
where ∆.
m f uel is the reduced heavy fuel oil consumption [kg/h], γ is the annual operating time of thedryer [h/a], C f uel represents the price of the heavy fuel oil [€/t-oil], qoil denotes the heating value ofheavy fuel oil [MJ/kg-oil], SCO2 is CO2 emission factor of heavy fuel oil [kg-CO2/MWh] and CCO2 isthe price of the CO2 emissions [€/t-CO2]. The reduced heavy fuel oil consumption is calculated asfollows [5]:
∆.
m f uel =(u1 − u2)·2.443 + r·qsawdust − 2.443·r·u2
qoil·
.msoot (13)
where.
msoot is the mass flow rate of the soot sludge [kgdb/s], u1 is the moisture content of the moist sootsludge [kgH2O/kgdb], u2 is the moisture content of the soot sludge and sawdust mixture after drying,r denotes the mass ratio (dry basis) of sawdust to soot sludge in the mixture [-] (This value is knownfrom the drying data) and qsawdust is the lower heating value of the sawdust [MJ/kgdb]. The term 2.443represents the vaporization heat of water at 25 ◦C.
The annual operational costs of the dryer (Poper, Equation (9)) include both the electricity and theheat costs.
Poper = Pelec·Celec·γ+∅·Cheat·γ, (14)
where Pelec is the electricity consumption of the dryer’s fans [MW], ∅ represents the heat consumptionof the dryer (heating of the drying air) [MW], Celec is the price of the electricity, Cheat is price of the heat[€/MWh] and γ is the annual operational time of the dryer. The electricity consumption is calculated asfollows:
Pelec =v·Adryer·∆Ppres
η f an, (15)

ChemEngineering 2020, 4, 6 7 of 17
where v is the velocity of air before the fan(s) [m/s], ∆Ppres is the total pressure drop over the dryerconfiguration [Pa] and η f an denotes the efficiency of the fan(s). It is assumed that the fan(s) are situatedbefore the heat exchanger(s) in the dryer configuration. The total pressure drop ∆Ppres is the sum ofthe pressure drops over the material bed, the plate heat exchanger(s), and the air duct system (i.e.,∆Ppres = ∆Pmaterial + ∆Phe+ad). The heat consumption is calculated as
∅ =.
mda·(hout − hin) = v·Adryer·δda·(hout − hin), (16)
where.
mda is the mass flow of dry air [kgda/s], δda is the density of dry air [kgda/m3] and h denotes theenthalpy of humid air before and after the heat exchanger [kJ/kgda]. The enthalpy of humid air iscalculated as follows:
h = cp,da·t + x(cp,w·t + 2501
)(17)
in which cp,da is the specific heat capacity of dry air [kJ/kg◦C], t is temperature of drying air [◦C], x ismoisture content of air [kg/kgda] and cp,w represents specific heat capacity of water vapour [kJ/kg◦C].The annual cost of the sawdust is determined as follows:
Psawdust =.
msawdust·γ·Csawdust·qsawdust, (18)
where.
msawdust is the mass flow rate of the sawdust into the dryer [kgdb/s] and Csawdust is the price ofthe sawdust [€/MWh].
3. Results and Discussion
3.1. Determination of Characteristic Drying Curves
Figure 4 shows the characteristic drying curves for soot sludge and sawdust mixture for the bedheights of 200 and 300 mm, and air temperatures of 40, 80 and 100 ◦C. Figure 4 reveals that the shape ofthe characteristic drying curve is almost linear for both bed heights, regardless of the temperature level.This indicates that the relative drying rate is independent of the level of the inlet air temperature overthe temperature range of 40–100 ◦C. Furthermore, results indicate that characteristic drying curvesfor the bed heights of 200 mm and 300 mm could also be used to define the drying time when the airtemperature is to some extent over 100 ◦C. Figure 5 presents an almost linear characteristic dryingcurve for the air velocities of 0.75 and 0.9 m/s. It is reasonable to conclude that the relative drying ratesare quite independent of the air velocity over the velocity range used in this study for the bed height of200 mm.
The accuracy of the characteristic drying curves (Equations (19)–(21)) was evaluated by comparingthe drying times calculated using the characteristic drying curves (Equation (22)), and experimentallymeasured drying times from earlier studies of the authors [5]. In the drying time calculations,the constant drying period was taken into account as Equation (22) shows. The critical moisturecontents (Xcr) and the constant drying rates (m0) were defined for every bed height and air temperaturecombination from the original drying curves [5].
f (xR) = 0.9559xR + 0.0495 (19)
f (xR) = 0.9958xR − 0.0064 (20)
f (xR) = 0.9804xR + 0.0248 (21)
τ = −Xcr
m0
∫ XR2
XR1
dxR
f (xR)= −
Xcr
m0·
[∫ 1
XR1
dxR +
∫ XR2
1
dxR
f (xR)
](22)

ChemEngineering 2020, 4, 6 8 of 17
ChemEngineering 2020, 4, x 7 of 18
where 𝑚 is the mass flow rate of the sawdust into the dryer [kgdb/s] and 𝐶 is the price of the sawdust [€/MWh].
3. Results and Discussion
3.1. Determination of Characteristic Drying Curves
Figure 4 shows the characteristic drying curves for soot sludge and sawdust mixture for the bed heights of 200 and 300 mm, and air temperatures of 40, 80 and 100 °C. Figure 4 reveals that the shape of the characteristic drying curve is almost linear for both bed heights, regardless of the temperature level. This indicates that the relative drying rate is independent of the level of the inlet air temperature over the temperature range of 40–100 °C. Furthermore, results indicate that characteristic drying curves for the bed heights of 200 mm and 300 mm could also be used to define the drying time when the air temperature is to some extent over 100 °C. Figure 5 presents an almost linear characteristic drying curve for the air velocities of 0.75 and 0.9 m/s. It is reasonable to conclude that the relative drying rates are quite independent of the air velocity over the velocity range used in this study for the bed height of 200 mm.
Figure 4. Characteristic drying curves for the bed heights of 200 mm and 300 mm. Air velocity 0.75 m/s in all cases. Mixture ratio 50%soot:50%sawdust.
Figure 4. Characteristic drying curves for the bed heights of 200 mm and 300 mm. Air velocity 0.75 m/sin all cases. Mixture ratio 50%soot:50%sawdust.
ChemEngineering 2020, 4, x 8 of 18
Figure 5. Characteristic drying curve for the air velocities of 0.75 and 0.9 m/s. Bed height 200 mm and air temperature 80 °C in both cases. Mixture ratio 50%soot:50%sawdust.
The accuracy of the characteristic drying curves (Equations (19)–(21)) was evaluated by comparing the drying times calculated using the characteristic drying curves (Equation (22)), and experimentally measured drying times from earlier studies of the authors [5]. In the drying time calculations, the constant drying period was taken into account as Equation (22) shows. The critical moisture contents (𝑋 ) and the constant drying rates (𝑚 ) were defined for every bed height and air temperature combination from the original drying curves [5]. 𝑓(𝑥 ) = 0.9559𝑥 + 0.0495 (19) 𝑓(𝑥 ) = 0.9958𝑥 − 0.0064 (20) 𝑓(𝑥 ) = 0.9804𝑥 + 0.0248 (21)
𝜏 = − 𝑋𝑚 𝑑𝑥𝑓(𝑥 ) = − 𝑋𝑚 ∙ 𝑑𝑥 + 𝑑𝑥𝑓(𝑥 ) (22)
Table 2 shows the results of the comparison. The relative errors between the drying times vary from 0.5 and 2.7% when the characteristic drying curves have been used for the bed heights of 200 mm and 300 mm. For air velocities of 0.75 and 0.9 m/s, the relative errors between the drying times range from 2.6 to 3.8%. In general, these results signify that the characteristic drying curves (Equations (19)–(21)) estimate drying times with a good accuracy. Table 2 also shows the critical moisture contents of the specific drying processes used in CDC calculations. The values for the term 𝑚 can be seen in Tables 3 and 4.
Table 2. The comparison of the experimentally measured drying times (DC), and the calculated drying times using the characteristic drying curves (CDC). Initial and final moisture contents have been 5.3 (84% wb) and 0.7 kgH2O/kgdb (41% wb) in all cases.
The Comparison of the Drying Times 200 mm 300 mm
Drying Time, DC [s]
Drying Time, CDC [s]
* Relative Error
Drying Time, DC [s]
Drying Time, CDC [s]
* Relative Error
40 °C 17,870 18,347 2.7 27,930 28,308 1.4 80 °C 7840 7790 0.6 13,010 13,219 1.6
100 °C 6650 6526 1.9 10,360 10,408 0.5 0.75 m/s;
80 °C 7840 8137 3.8
0.9 m/s; 80 °C 7650 7453 2.6
The Critical Moisture Contents 𝑿𝒄𝒓 [kgH2O/kgdb]
Figure 5. Characteristic drying curve for the air velocities of 0.75 and 0.9 m/s. Bed height 200 mm andair temperature 80 ◦C in both cases. Mixture ratio 50%soot:50%sawdust.
Table 2 shows the results of the comparison. The relative errors between the drying times varyfrom 0.5 and 2.7% when the characteristic drying curves have been used for the bed heights of200 mm and 300 mm. For air velocities of 0.75 and 0.9 m/s, the relative errors between the dryingtimes range from 2.6 to 3.8%. In general, these results signify that the characteristic drying curves(Equations (19)–(21)) estimate drying times with a good accuracy. Table 2 also shows the criticalmoisture contents of the specific drying processes used in CDC calculations. The values for the termm0 can be seen in Tables 3 and 4.

ChemEngineering 2020, 4, 6 9 of 17
Table 2. The comparison of the experimentally measured drying times (DC), and the calculated dryingtimes using the characteristic drying curves (CDC). Initial and final moisture contents have been 5.3(84% wb) and 0.7 kgH2O/kgdb (41% wb) in all cases.
The Comparison of the Drying Times
200 mm 300 mm
DryingTime, DC [s]
Drying Time,CDC [s]
* RelativeError
DryingTime, DC [s]
Drying Time,CDC [s]
* RelativeError
40 ◦C 17,870 18,347 2.7 27,930 28,308 1.480 ◦C 7840 7790 0.6 13,010 13,219 1.6
100 ◦C 6650 6526 1.9 10,360 10,408 0.5
0.75 m/s;80 ◦C 7840 8137 3.8
0.9 m/s;80 ◦C 7650 7453 2.6
The Critical Moisture Contents Xcr [kgH2O/kgdb]
200 mm; 0.75 m/s 300 mm; 0.75 m/s
40 ◦C 4.50 4.1680 ◦C 5.04 4.34
100 ◦C 4.30 4.46
200 mm; 0.9 m/s
80 ◦C 4.51
* Relative error = |1 − TimeCDC/TimeDC| × 100.
Table 3. The calculated values for the term αa for the bed height of 200 mm. Bulk density of mixture116 kgdb/m3 in all cases.
Air Velocity:v [m/s] tair,in [◦C] tair,out [◦C] xin
[kgH2O/kgda] twb [◦C] m0[kgH2O/(kgdbs)]
αa[W/(m3K)]
0.75 m/s 40.9 21.3 0.0057 19.4 0.000461 16,1600.75 m/s 81.4 31.1 0.0026 27.6 0.001190 18,2740.75 m/s 101.7 37.4 0.0055 32.9 0.001249 14,895
Average: 16,443
0.9 m/s 81.5 34.5 0.0041 28.4 0.001177 15,309
Table 4. The calculated values for the term αa for the bed height of 300 mm. Bulk density of mixture116 kgdb/m3 and air velocity 0.75 m/s in all cases.
tair, in [◦C] tair, out [◦C] xin [kgH2O/kgda] twb [◦C] m0 [kgH2O/(kgdbs)] αa [W/(m3K)]
40.7 20.0 0.0046 18.5 0.000308 11,43580.0 31.3 0.0031 27.6 0.000685 10,534103.4 35.1 0.0055 33.2 0.000893 13,266
Average: 11,745
3.2. Determination of the Volumetric Heat Transfer Coefficient
A value for the term αa can be calculated from the experimental data. Measuring the outlet airtemperature during the constant drying rate period, and assuming that the surface temperature ofthe particles in the bed is the wet bulb temperature, the term αa can be solved from the Equation (7).Tables 3 and 4 show the volumetric heat transfer coefficients for the bed heights of 200 and 300 mm,respectively, when the inlet air temperatures have been 40, 80, and 100 ◦C. The air temperatures beforethe bed (tair, in) and after the mixture bed (tair, out) have been experimentally measured, and the valueshave been taken as average values when the drying has been in the period of the constant drying rate.

ChemEngineering 2020, 4, 6 10 of 17
The average values of the term αa can be used to calculate the constant drying rate (m0, Equation (7))for the soot sludge and sawdust mixture in a fixed bed when the inlet air temperature is ≤100 ◦C. Theaverage αa value can also be used to estimate the constant drying rate although the inlet temperatureis slightly higher than 100 ◦C if more accurate data is not available.
The results show that the volumetric heat transfer coefficient becomes lower when the bed heightincreases. The obvious reason for this is that vapor from the drying air condenses in the bottom partof the bed (air moves from top to down). Therefore, the drying rate (m0) remains lower for higherbed heights. In fact, there is no constant drying rate period over the whole bed when the bed heightis 300 mm. In general, this is a quite normal behaviour in the fixed beds when the bed heights aresufficiently high and mass transfer resistances from the material to air are low.
3.3. Economic Analysis
3.3.1. Base Case
The economic analysis was only conducted for the bed height of 200 mm. All drying times weredefined using the characteristic drying curve shown in Figure 4 or the actual drying curves if they wereavailable. The bed height of 200 mm has been found to be the most optimal one in a previous study [5]of the authors. Inlet air temperatures in the economic analysis were 40, 60, 80, 100 and 120 ◦C. It isassumed in the economic analysis that the moist soot sludge is dried with sawdust in a continuous beltdryer, and the dried mixture is combusted in a boiler. As a result of drying, heavy fuel consumption inthe boiler is reduced. The initial moisture content of the soot sludge and sawdust mixture was 84% (wb)in all calculations. The final moisture content of the mix was selected to be 41% because with this finalmoisture content, the mixture could be properly combusted in a boiler without any remarkable dustingproblem. Payback periods were first calculated for the base case study. The payback periods werecalculated for the air temperatures of 40, 80, and 100 ◦C using the drying times from the experimentaldata obtained earlier [5]. For air temperatures of 60 and 120 ◦C, the characteristic drying curve wasused to define the drying time (Equations (19) and (22)). When the characteristic drying curve wasused, the critical moisture content was 4.6162 kgH2O/kgdb, and the outlet air temperature (Equation (7),tair,out) was calculated as follows: tair,out = twb + 3.3 ◦C. Both values have been extracted from theexperimental data [5]. Table 5 summarizes all the initial values for the economic analysis.
Table 5. The initial values for the economic analysis.
Parameters Initial Value
Volume ratio of the sludge and sawdust mixture 50%soot sludge:50%sawdust
Bed height of the mixture inside the dryer 200 mm
Inlet air velocity before the bed 0.75 m/s
Mass flow rate of moist soot sludge 20 t/d
Moisture content of pure soot sludge 95% wb
Mass flow rate of moist sawdust 7.8 t/d
Moisture content of pure sawdust 56% wb
Initial moisture content of the mixture 5.3 kgH2O/kgdb (84% wb)
Final moisture content of the mixture after drying 0.7 kgH2O/kgdb (41% wb)
Bulk density of the mixture 116 kgdb/m3
Total pressure drop of the dryer for the bed height of200 mm
318 Pa (from the drying data, average value betweenthe pressure drops in the beginning and at the end ofthe tests [5])
Total pressure drop over the heat exchanger and airduct 400 Pa
ChemEngineering 2020, 4, 6 11 of 17
Table 5. Cont.
Parameters Initial Value
Drying air temperature before the fans and beforeheating it to the desired drying air temperature 15 ◦C
Moisture content of air 0.004 kgH2O/kgda (average value from the dryingtests [5])
Efficiency of the fan (η) 0.8
Heating value of heavy fuel oil 41 MJ/kg
Emission factor of heavy fuel oil 284 kgCO2/MWh
Price of the CO2 ton 13 €/tCO2 (current price [29], base case)
Lower heating value of dry sawdust 19 MJ/kgdb
Lower heating value of dry soot sludge 22.65 MJ/kgdb
Mass ratio of sawdust to soot sludge in the mixture (r) 3.4 kgdb, sawdust/kgdb,soot sludge
Price of electricity 40 €/MWh
Price of heat 5 €/MWh (base case)
Price of sawdust 19 €/MWh (current price in Finland [30], base case)
Operating time of the chemical plant and the dryer 8000 h/year
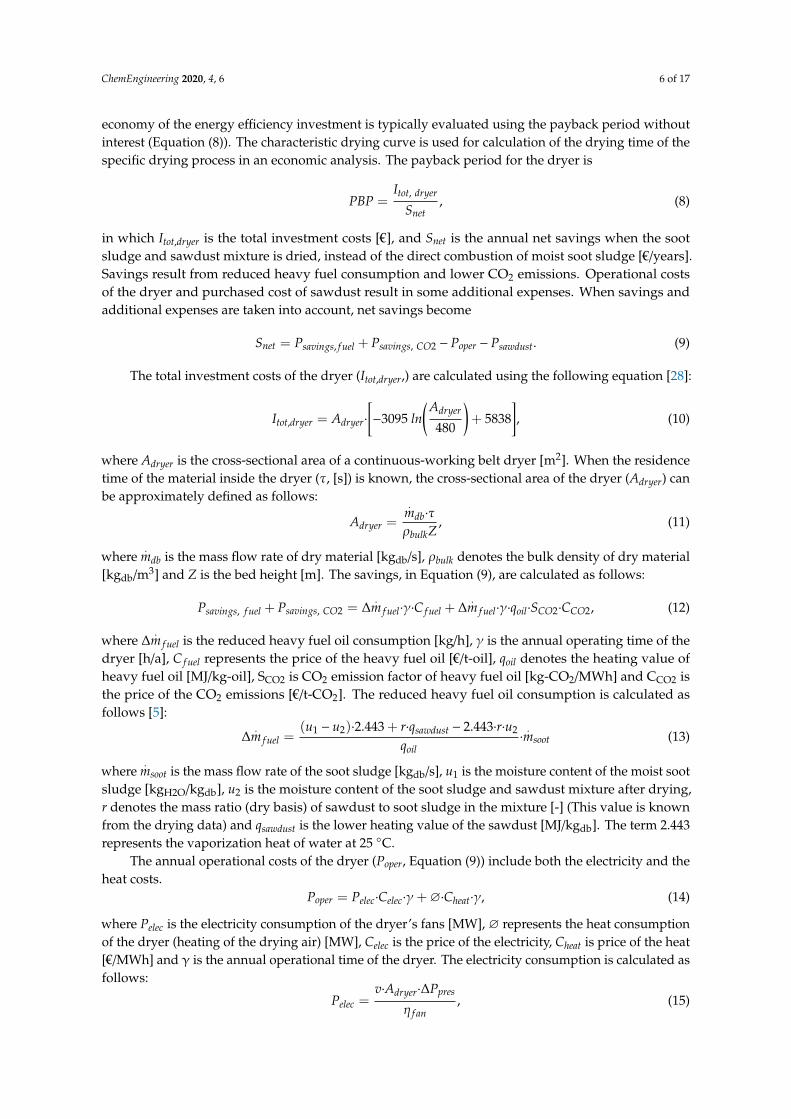
Figure 6 shows the base case results. Table 6 shows the payback period calculations for the basecase when the current import price of the heavy fuel oil (410 €/t-oil, [31]) has been used. Usually, energyefficiency investments are seen as cost-effective if the payback period is 2–3 years or less. Figure 6shows that the drying of the soot sludge and sawdust mixture is profitable (payback period is 3 yearsor less) when the inlet air temperature is 80 ◦C or more, and the heavy fuel oil price is at least 250 €/t-oil.However, drying with air temperatures of 40 and 60 ◦C is also profitable when the heavy fuel oilprice is at least 350 €/t-oil. At the current import price of heavy fuel oil (410 €/t-oil), the drying of thesoot sludge and sawdust mixture is economical for all inlet air temperatures. Table 6 shows that thepayback period ranges from 1.0 to 2.4 years, when the current price of the heavy fuel oil is used in thecalculations. Figure 6 also confirms that there is no reason to use a higher drying air temperature than80 ◦C, because the payback periods of the air temperatures from 80 to 120 ◦C are at the same magnitude.ChemEngineering 2020, 4, x 12 of 18
Figure 6. The payback periods for the soot sludge and sawdust mixture dryers when the inlet air temperatures are 40, 60, 80, 100 and 120 °C. All initial values are shown in Table 5.
Table 6. The payback period calculations for the base case when the current import price of the heavy fuel oil (410 €/t-oil, [31]) has been used (The term €/a represents the term €/years).
40 °C 60 °C 80 °C 100 °C 120 °C Cross-sectional area of the dryer 39 m2 24 m2 17 m2 15 m2 13 m2 Investment cost 535,131 € 359,705 € 278,879 € 244,024 € 219,992 € Savings in heavy fuel oil costs 346,256 €/a 346,256 €/a 346,256 €/a 346,256 €/a 346,256 €/a Savings in CO2 emissions 35,510 €/a 35,510 €/a 35,510 €/a 35,510 €/a 35,510 €/a Cost of sawdust 114,391 €/a 114,391 €/a 114,391 €/a 114,391 €/a 114,391 €/a Cost of electricity 8492 €/a 5117 €/a 3726 €/a 3160 €/a 2783 €/a Cost of heat 33,355 €/a 34,007 €/a 33,738 €/a 35,417 €/a 36,571 €/a Payback period 2.4 years 1.6 years 1.2 years 1.1 years 1.0 years
3.3.2. Sensitivity Analysis: Influence of the Heat Price
Heat sources for drying process can be divided into primary and secondary heat sources. The temperature of primary heat (e.g., process steam) is usually high. Secondary heat sources, which are also called excess heat, are heat flows recovered from different processes. The price of heat depends on several factors, such as the production method of heat, temperature level of the heat, and fuel prices. When the heat is fairly priced, the price should always depend on the temperature level of the heat source: a higher heat price for a higher temperature. Nevertheless, this is not always the case: the price does not always depend on the temperature level. For this reason, the price was kept at a constant in the base case (Section 3.3.1), despite the variation in air temperatures. However, in this section, the influence of the heat price on the payback period is evaluated using the heat prices of 1, 5, 10 and 15 €/MWh. Figures 7 and 8 show the results of the sensitivity analysis of the heat price for the drying process with inlet air temperatures of 80 °C and 60 °C, respectively. In both figures, the curve with the heat price of 15 €/MWh ends at the heavy fuel oil price of 250 €/t-oil, because the operational costs exceed the savings with the lower prices of the heavy fuel oil.
Figure 6. The payback periods for the soot sludge and sawdust mixture dryers when the inlet airtemperatures are 40, 60, 80, 100 and 120 ◦C. All initial values are shown in Table 5.

ChemEngineering 2020, 4, 6 12 of 17
Table 6. The payback period calculations for the base case when the current import price of the heavyfuel oil (410 €/t-oil, [31]) has been used (The term €/a represents the term €/years).
40 ◦C 60 ◦C 80 ◦C 100 ◦C 120 ◦C
Cross-sectional area of the dryer 39 m2 24 m2 17 m2 15 m2 13 m2
Investment cost 535,131 € 359,705 € 278,879 € 244,024 € 219,992 €Savings in heavy fuel oil costs 346,256 €/a 346,256 €/a 346,256 €/a 346,256 €/a 346,256 €/aSavings in CO2 emissions 35,510 €/a 35,510 €/a 35,510 €/a 35,510 €/a 35,510 €/aCost of sawdust 114,391 €/a 114,391 €/a 114,391 €/a 114,391 €/a 114,391 €/aCost of electricity 8492 €/a 5117 €/a 3726 €/a 3160 €/a 2783 €/aCost of heat 33,355 €/a 34,007 €/a 33,738 €/a 35,417 €/a 36,571 €/a
Payback period 2.4 years 1.6 years 1.2 years 1.1 years 1.0 years
3.3.2. Sensitivity Analysis: Influence of the Heat Price
Heat sources for drying process can be divided into primary and secondary heat sources. Thetemperature of primary heat (e.g., process steam) is usually high. Secondary heat sources, which arealso called excess heat, are heat flows recovered from different processes. The price of heat depends onseveral factors, such as the production method of heat, temperature level of the heat, and fuel prices.When the heat is fairly priced, the price should always depend on the temperature level of the heatsource: a higher heat price for a higher temperature. Nevertheless, this is not always the case: the pricedoes not always depend on the temperature level. For this reason, the price was kept at a constant inthe base case (Section 3.3.1), despite the variation in air temperatures. However, in this section, theinfluence of the heat price on the payback period is evaluated using the heat prices of 1, 5, 10 and 15€/MWh. Figures 7 and 8 show the results of the sensitivity analysis of the heat price for the dryingprocess with inlet air temperatures of 80 ◦C and 60 ◦C, respectively. In both figures, the curve with theheat price of 15 €/MWh ends at the heavy fuel oil price of 250 €/t-oil, because the operational costsexceed the savings with the lower prices of the heavy fuel oil.ChemEngineering 2020, 4, x 13 of 18
Figure 7. The payback periods when the heat prices of 1, 5, 10, and 15 €/MWh are used. The inlet air temperature of the drying air is 80 °C. All other initial values are shown in Table 5.
Figure 8. The payback periods when the heat prices of 1, 5, 10, and 15 €/MWh are used. The inlet air temperature of the drying air is 60 °C. All other initial values are shown in Table 5.
Figure 7 shows that the soot sludge and sawdust mixture drying is profitable (maximum payback period 3 years) with all heat prices when the heavy fuel oil price is at least 330 €/t-oil. Furthermore, Figure 8 shows that the drying is profitable (payback period max 3 years) with all heat prices when the heavy fuel oil price is at least 360 €/t-oil. These results indicate that it is economical to dry the soot sludge with the current oil price (410 €/t-oil) despite the relatively high heat price. The heat price of 15 €/MWh is a rather typical price level for process steam in the industry. Waste heat is usually much cheaper. Results with varying heat prices also show that there is no reason to use higher drying air temperatures than 60–80 °C because drying is always economic with current oil price even if the heat price was 15 €/MWh. If there are several heat sources with varying heat prices available, cases should be analysed in more detailed to find the optimal drying temperature. Low drying temperatures with low heat prices result in high investment costs (dryer size + heat exchanger areas) but low operational costs and vice versa when drying temperatures are high. This is a classic optimization problem that has been studied for example by Holmberg et al. [32].
3.3.3. Sensitivity Analysis: Influence of the CO2 Emission Price
This section evaluates the influence of the CO2 emission price on the payback period when emission prices are 3, 7, 11, and 15 €/t-CO2. Between the years of 2013 and 2018, the price of the CO2 emission has varied from 3 to 14 €/t-CO2 within the European Union [29]. Figure 9 shows the results of the sensitivity analysis of emission price for the drying process with an inlet air temperature of 80
Figure 7. The payback periods when the heat prices of 1, 5, 10, and 15 €/MWh are used. The inlet airtemperature of the drying air is 80 ◦C. All other initial values are shown in Table 5.
Figure 7 shows that the soot sludge and sawdust mixture drying is profitable (maximum paybackperiod 3 years) with all heat prices when the heavy fuel oil price is at least 330 €/t-oil. Furthermore,Figure 8 shows that the drying is profitable (payback period max 3 years) with all heat prices when theheavy fuel oil price is at least 360 €/t-oil. These results indicate that it is economical to dry the sootsludge with the current oil price (410 €/t-oil) despite the relatively high heat price. The heat price of15 €/MWh is a rather typical price level for process steam in the industry. Waste heat is usually muchcheaper. Results with varying heat prices also show that there is no reason to use higher drying air

ChemEngineering 2020, 4, 6 13 of 17
temperatures than 60–80 ◦C because drying is always economic with current oil price even if the heatprice was 15 €/MWh. If there are several heat sources with varying heat prices available, cases shouldbe analysed in more detailed to find the optimal drying temperature. Low drying temperatures withlow heat prices result in high investment costs (dryer size + heat exchanger areas) but low operationalcosts and vice versa when drying temperatures are high. This is a classic optimization problem thathas been studied for example by Holmberg et al. [32].
ChemEngineering 2020, 4, x 13 of 18
Figure 7. The payback periods when the heat prices of 1, 5, 10, and 15 €/MWh are used. The inlet air temperature of the drying air is 80 °C. All other initial values are shown in Table 5.
Figure 8. The payback periods when the heat prices of 1, 5, 10, and 15 €/MWh are used. The inlet air temperature of the drying air is 60 °C. All other initial values are shown in Table 5.
Figure 7 shows that the soot sludge and sawdust mixture drying is profitable (maximum payback period 3 years) with all heat prices when the heavy fuel oil price is at least 330 €/t-oil. Furthermore, Figure 8 shows that the drying is profitable (payback period max 3 years) with all heat prices when the heavy fuel oil price is at least 360 €/t-oil. These results indicate that it is economical to dry the soot sludge with the current oil price (410 €/t-oil) despite the relatively high heat price. The heat price of 15 €/MWh is a rather typical price level for process steam in the industry. Waste heat is usually much cheaper. Results with varying heat prices also show that there is no reason to use higher drying air temperatures than 60–80 °C because drying is always economic with current oil price even if the heat price was 15 €/MWh. If there are several heat sources with varying heat prices available, cases should be analysed in more detailed to find the optimal drying temperature. Low drying temperatures with low heat prices result in high investment costs (dryer size + heat exchanger areas) but low operational costs and vice versa when drying temperatures are high. This is a classic optimization problem that has been studied for example by Holmberg et al. [32].
3.3.3. Sensitivity Analysis: Influence of the CO2 Emission Price
This section evaluates the influence of the CO2 emission price on the payback period when emission prices are 3, 7, 11, and 15 €/t-CO2. Between the years of 2013 and 2018, the price of the CO2 emission has varied from 3 to 14 €/t-CO2 within the European Union [29]. Figure 9 shows the results of the sensitivity analysis of emission price for the drying process with an inlet air temperature of 80
Figure 8. The payback periods when the heat prices of 1, 5, 10, and 15 €/MWh are used. The inlet airtemperature of the drying air is 60 ◦C. All other initial values are shown in Table 5.
3.3.3. Sensitivity Analysis: Influence of the CO2 Emission Price
This section evaluates the influence of the CO2 emission price on the payback period whenemission prices are 3, 7, 11, and 15 €/t-CO2. Between the years of 2013 and 2018, the price of the CO2
emission has varied from 3 to 14 €/t-CO2 within the European Union [29]. Figure 9 shows the results ofthe sensitivity analysis of emission price for the drying process with an inlet air temperature of 80 ◦C.Figure 9 reveals that the price of the CO2 emission does not have any remarkable influence on theprofitability. The drying is economical (payback period is less than 3 years) with all emission priceswhen the heavy fuel oil price is at least 300 €/t-oil.
ChemEngineering 2020, 4, x 14 of 18
⁰C. Figure 9 reveals that the price of the CO2 emission does not have any remarkable influence on the profitability. The drying is economical (payback period is less than 3 years) with all emission prices when the heavy fuel oil price is at least 300 €/t-oil.
Figure 9. The payback periods when the CO2 emission prices of 3, 7, 11 and 15 €/t-CO2 are used. The inlet air temperature of the drying air is 80 °C. All other initial values are shown in Table 5.
3.3.4. Sensitivity Analysis: Influence of the Sawdust Price
This section studies the influence of the sawdust price on the payback period when sawdust prices of 11, 15, 19, and 23 €/MWh are used. For example, in Finland, the price of the sawdust has varied from 17 to 20 €/MWh between the years 2015 to 2018 [30]. Figure 10 displays the results of the sensitivity analysis when the inlet air temperature is 80 °C. Figure 10 shows that the sawdust price does not have any remarkable influence on the profitability: the drying is profitable (payback period is maximum of 3 years) with all sawdust prices when the heavy fuel oil price is at least 275 €/t-oil.
Figure 10. The payback periods when the sawdust prices of 11, 15, 19 and 23 €/MWh are used. The inlet air temperature of the drying air is 80 °C. All other initial values are shown in Table 5.
4. Conclusions
Soot sludge is a waste stream formed in the production process of formic acid and hydrogen peroxide. At present, the moist soot sludge is directly combusted in a boiler with heavy fuel oil in order to enable its combustion. Drying the mixture consisting of the soot sludge and sawdust before burning it in a boiler can result in a decrease of heavy fuel oil consumption. In this study, the characteristic drying curves for the soot sludge and sawdust mixture have been produced in order to evaluate the economy of the soot sludge and sawdust mixture drying in a continuous belt dryer. This economy has been evaluated by calculating the payback period for the dryer investment.
Figure 9. The payback periods when the CO2 emission prices of 3, 7, 11 and 15 €/t-CO2 are used. Theinlet air temperature of the drying air is 80 ◦C. All other initial values are shown in Table 5.

ChemEngineering 2020, 4, 6 14 of 17
3.3.4. Sensitivity Analysis: Influence of the Sawdust Price
This section studies the influence of the sawdust price on the payback period when sawdustprices of 11, 15, 19, and 23 €/MWh are used. For example, in Finland, the price of the sawdust hasvaried from 17 to 20 €/MWh between the years 2015 to 2018 [30]. Figure 10 displays the results of thesensitivity analysis when the inlet air temperature is 80 ◦C. Figure 10 shows that the sawdust pricedoes not have any remarkable influence on the profitability: the drying is profitable (payback period ismaximum of 3 years) with all sawdust prices when the heavy fuel oil price is at least 275 €/t-oil.
ChemEngineering 2020, 4, x 14 of 18
⁰C. Figure 9 reveals that the price of the CO2 emission does not have any remarkable influence on the profitability. The drying is economical (payback period is less than 3 years) with all emission prices when the heavy fuel oil price is at least 300 €/t-oil.
Figure 9. The payback periods when the CO2 emission prices of 3, 7, 11 and 15 €/t-CO2 are used. The inlet air temperature of the drying air is 80 °C. All other initial values are shown in Table 5.
3.3.4. Sensitivity Analysis: Influence of the Sawdust Price
This section studies the influence of the sawdust price on the payback period when sawdust prices of 11, 15, 19, and 23 €/MWh are used. For example, in Finland, the price of the sawdust has varied from 17 to 20 €/MWh between the years 2015 to 2018 [30]. Figure 10 displays the results of the sensitivity analysis when the inlet air temperature is 80 °C. Figure 10 shows that the sawdust price does not have any remarkable influence on the profitability: the drying is profitable (payback period is maximum of 3 years) with all sawdust prices when the heavy fuel oil price is at least 275 €/t-oil.
Figure 10. The payback periods when the sawdust prices of 11, 15, 19 and 23 €/MWh are used. The inlet air temperature of the drying air is 80 °C. All other initial values are shown in Table 5.
4. Conclusions
Soot sludge is a waste stream formed in the production process of formic acid and hydrogen peroxide. At present, the moist soot sludge is directly combusted in a boiler with heavy fuel oil in order to enable its combustion. Drying the mixture consisting of the soot sludge and sawdust before burning it in a boiler can result in a decrease of heavy fuel oil consumption. In this study, the characteristic drying curves for the soot sludge and sawdust mixture have been produced in order to evaluate the economy of the soot sludge and sawdust mixture drying in a continuous belt dryer. This economy has been evaluated by calculating the payback period for the dryer investment.
Figure 10. The payback periods when the sawdust prices of 11, 15, 19 and 23 €/MWh are used. Theinlet air temperature of the drying air is 80 ◦C. All other initial values are shown in Table 5.
4. Conclusions
Soot sludge is a waste stream formed in the production process of formic acid and hydrogenperoxide. At present, the moist soot sludge is directly combusted in a boiler with heavy fuel oil in orderto enable its combustion. Drying the mixture consisting of the soot sludge and sawdust before burningit in a boiler can result in a decrease of heavy fuel oil consumption. In this study, the characteristicdrying curves for the soot sludge and sawdust mixture have been produced in order to evaluate theeconomy of the soot sludge and sawdust mixture drying in a continuous belt dryer. This economy hasbeen evaluated by calculating the payback period for the dryer investment.
The results obtained show that the shape of the characteristic drying curves is almost linear forboth bed heights (200 and 300 mm) regardless of the temperature level (40–100 ◦C). This indicatesthat the relative drying rate is independent of the inlet air temperature over the temperature range of40–100 ◦C. Furthermore, the results indicate that the characteristic drying curves for both bed heightsmay also be used to calculate drying times when the inlet air temperature is a little higher than 100 ◦C.When real drying times are compared with those calculated by the characteristic drying curves, therelative error varies from 0.5% to 3.8%. This denotes that the characteristic drying curves approximatethe real drying times with good accuracy.
The results of the economic analysis (base case) show that the drying of the soot sludge andsawdust mixture is economical (payback period is 3 years or less) when the inlet air temperature is80 ◦C or more, and the heavy fuel oil price is at least 250 €/t-oil. However, it can be concluded thatthere is no reason to use a higher drying air temperature than 80 ◦C, due to the payback periods of theair temperatures from 80 to 120 ◦C being at the same magnitude. Drying is also economical for inlet airtemperatures of 40 ◦C and 60 ◦C if the price of the heavy fuel oil is at least 350 €/t-oil. The current priceof heavy fuel oil is c. 410 €/t-oil resulting in the drying of the soot sludge and sawdust mixture beingcost-effective for all inlet air temperatures (40–120 ◦C). It is also improbable that the price of the heavyfuel oil would be as low as ~200–300 €/t-oil.
ChemEngineering 2020, 4, 6 15 of 17
The sensitivity analyses show that the heat, sawdust and emission prices do not have anyremarkable influence on the economy of drying if the heavy fuel oil price does not fall belowc. 300 €/t-oil. The payback period is less than three years for most cases in the sensitivity analyses.
In conclusion, the results indicate that the drying of the soot sludge and sawdust mixture in a beltdryer is a cost-effective method to upgrade the soot sludge stream to fuel. However, the sticky propertyof the moist soot sludge and the dustiness of the dry soot may cause some additional challenges.
Author Contributions: Conceptualization, T.M., H.H. and P.A.; formal analysis, T.M.; investigation, T.M.; datacuration, T.M.; writing—original draft preparation, T.M.; writing—review and editing, T.M. and H.H.; supervision,P.A. All authors have read and agreed to the published version of the manuscript.
Funding: This research received no external funding.
Acknowledgments: This study has been produced with support from the Doctoral Program in Energy Efficiencyand Systems (EES), Finnish Foundation for Technology Promotion, and Foundation of Heikki and Hilma Honkanen.
Conflicts of Interest: The authors declare no conflict of interest. The funders had no role in the design of thestudy; in the collection, analyses, or interpretation of data; in the writing of the manuscript, or in the decision topublish the results.
Nomenclature
Adryer cross-sectional area of a continuous-working belt dryer [m2]a specific volumetric heat transfer area/evaporation surface [m2/m3]CCO2 price of the CO2 emissions [€/t-CO2]Celec price of the electricity [€/MWh]C f uel price of the heavy fuel oil [€/t-oil]Cheat price of the heat [€/MWh]Csawdust price of the sawdust [€/MWh]cp,da specific heat capacity of dry air [kJ/kg◦C]cp,w specific heat capacity of water vapor [kJ/kg◦C]h enthalpy of humid air [kJ/kgda]Itot,dryer total investment costs of the dryer [€]lv vaporization heat [J/kg]m0 drying rate during the constant drying period [kgH2O/(kgdbs)].
mda mass flow rate of dry air [kgda/s].
mdb mass flow rate of material [kgdb/s].
msawdust mass flow rate of sawdust [kgdb/s].
msoot mass flow rate of the soot sludge [kgdb/s]∆
.m f uel reduced heavy fuel oil consumption [kg/h]
Pelec electricity consumption of the dryer’s fans [MW]Poper annual operational costs [€/years]Psavings,CO2 annual savings from reduced CO2-emissions [€/years]Psavings, f uel annual savings in fuel consumption [€/years]Psawdust annual costs of sawdust [€/years]∆Phe+ad pressure drop over the plate heat exchanger(s) and the air duct system [Pa]∆Pmaterial pressure drop over the material bed [Pa]∆Ppres total pressure drop over the dryer configuration/pressure difference [Pa]qoil heating value of heavy fuel oil [MJ/kg-oil]qsawdust lower heating value of sawdust [MJ/kgdb]r mass ratio (dry basis) of sawdust to soot sludge in the mixture [-]SCO2 CO2 emission factor of heavy fuel oil [kg-CO2/MWh]Snet annual net savings [€/years]T air temperature [K]t air temperature [◦C]twb wet bulb temperature [◦C]u moisture content of material [kgH2O/kgdb]

ChemEngineering 2020, 4, 6 16 of 17
u1 moisture content of the moist soot sludge [kgH2O/kgdb]u2 moisture content of the soot sludge and sawdust mixture after drying [kgH2O/kgdb]v velocity of air before the fan(s) [m/s]x moisture content of air [kg/kgda]Xcr critical moisture content [kgH2O/kgdb]Z bed height of material inside the dryer [m]
αheat transfer coefficient for the heat transfer between the bed and drying air in theboundary layer (convective) [W/m2K]
δda density of dry air [kgda/m3]ρbulk bulk density of dry material [kgdb/m3]τ residence time of material inside the dryer/drying time [s]γ annual operating time of the dryer [h/years]∅ heat consumption of the dryer [MW]η f an efficiency of the fan(s) [-]CDC Characteristic Drying CurveCHP Combined Heat and Power plantda dry airdb dry basisDC drying curvePBP payback period without interest [years]wb wet basisvol-% volume-%
References
1. Eastman Chemical Company. Available online: www.eastman.com (accessed on 10 November 2018).2. Chen, G.; Yue, P.L.; Mujumdar, A.S. Sludge dewatering and drying. Dry. Technol. 2002, 20, 883–916.
[CrossRef]3. Tunçal, T.; Uslu, O. A review of dehydration of various industrial sludges. Dry. Technol. 2014, 32, 1642–1654.
[CrossRef]4. Hippinen, I.; Ahtila, P. Drying of activated sludge under partial vacuum conditions—An experimental study.
Dry. Technol. 2004, 22, 2119–2134. [CrossRef]5. Myllymaa, T.; Holmberg, H.; Arhippainen, P.; Ahtila, P. Upgrading of soot sludge from waste to fuel by
means of low temperature drying in fixed beds. Fuel Process. Technol. 2015, 138, 509–519. [CrossRef]6. Kudra, T.; Gawrzynski, Z.; Glaser, R.; Stanislawski, J.; Poirier, M. Drying of pulp and paper sludge in a
pulsed fluid bed dryer. Dry. Technol. 2002, 20, 917–933. [CrossRef]7. Grimm, A.; Elustondo, D.; Mäkelä, M.; Segerström, M.; Kalén, G.; Fraikin, L.; Léonard, A.; Larsson, S.H.
Drying recycled fiber rejects in a bench-scale cyclone: Influence of device geometry and operationalparameters on drying mechanisms. Fuel Process. Technol. 2017, 167, 631–640. [CrossRef]
8. Adamiec, J. Drying of waste sludges in a fluidized bed dryer with a mixer. Dry. Technol. 2002, 20, 839–853.[CrossRef]
9. San José, M.J.; Alvarez, S.; López, R. Drying of industrial sludge waste in a conical spouted bed dryer. Effectof air temperature and air velocity. Dry. Technol. 2019, 37, 118–128. [CrossRef]
10. Keey, R.B. Drying: Principles and Practice. International Series of Monographs in Chemical Engineering; Pergamon:Oxford, NY, USA, 1972; p. 193.
11. Holmberg, H.; Ahtila, P.; Ahtila, O. Experimental study on drying of bark in fixed beds. Dry. Technol. 2011,29, 953–960. [CrossRef]
12. Jannot, Y.; Batsale, J.-C.; Ahouannou, C.; Kanmogne, A.; Talla, A. Measurement errors processing bycovariance analysis for an improved estimation of drying characteristic curve parameters. Dry. Technol. 2002,20, 1919–1939. [CrossRef]
13. Kouhila, M.; Kechaou, N.; Otmani, M.; Fliyou, M.; Lahsasni, S. Experimental study of sorption isothermsand drying kinetics of Moroccan eucalyptus globulus. Dry. Technol. 2002, 20, 2027–2039. [CrossRef]
14. Jannot, Y.; Talla, A.; Nganhou, J.; Puiggali, J.-R. Modeling of banana convective drying by the dryingcharacteristic curve (DCC) method. Dry. Technol. 2004, 22, 1949–1968. [CrossRef]
ChemEngineering 2020, 4, 6 17 of 17
15. Pal, U.S.; Khan, M.K.; Mohanty, S.N. Heat pump drying of green sweet pepper. Dry. Technol. 2008, 26,1584–1590. [CrossRef]
16. Lahsasni, S.; Kouhila, M.; Mahrouz, M.; Ait Mohamed, L.; Agorram, B. Characteristic drying curve andmathematical modeling of thin-layer solar drying of prickly pear cladode (Opuntia ficus indica). J. Food ProcessEng. 2004, 27, 103–117. [CrossRef]
17. Ayadi, M.; Ben Mabrouk, S.; Zouari, I.; Bellagi, A. Kinetic study of the convective drying of spearmint.J. Saudi Soc. Agric. Sci. 2014, 13, 1–7. [CrossRef]
18. Lahsasni, S.; Kouhila, M.; Mahrouz, M.; Jaouhari, J.T. Drying kinetics of prickly pear fruit (Opuntia ficusindica). J. Food Eng. 2004, 61, 173–179. [CrossRef]
19. Mghazli, S.; Ouhammou, M.; Hidar, N.; Lahnine, L.; Idlimam, A.; Mahrouz, M. Drying characteristics andkinetics solar drying of Moroccan rosemary leaves. Renew. Energy 2017, 108, 303–310. [CrossRef]
20. Langrish, T.A.G. Characteristic drying curves for cellulosic fibres. Chem. Eng. J. 2008, 137, 677–680. [CrossRef]21. Madaleno, R.O.; Castro, L.M.; Coelho Pinheiro, M.N. Drying kinetics of granulated cork: Effect of air drying
stream conditions and granule size. Biomass Bioenergy 2017, 107, 8–19. [CrossRef]22. Langrish, T.A.G. An assessment of the use of characteristic drying for the high-temperature drying of
softwood timber. Dry. Technol. 1999, 17, 991–998. [CrossRef]23. Fritzell, E.; Melander, O.; Rasmuson, A. The drying kinetics and equilibrium moisture content of MDF fibers.
Dry. Technol. 2009, 27, 993–998. [CrossRef]24. Bellagha, S.; Amami, E.; Farhat, A.; Kechaou, N. Drying kinetics and characteristic drying curve of lightly
salted sardine (Sardinella aurita). Dry. Technol. 2002, 20, 1527–1538. [CrossRef]25. Derdour, L.; Desmorieux, H.; Andrieu, J. A contribution to the characteristic drying curve concept: Application
to the drying of plaster. Dry. Technol. 2000, 18, 237–260. [CrossRef]26. Decision for the Environmental Licence Application. Pohjois-Pohjanmaan Ympäristökeskus 2007,
PPO-2005-Y-1-111 2007. Available online: https://www.google.fi/url?sa=t&rct=j&q=&esrc=s&source=
web&cd=2&ved=0ahUKEwiKh7CfyOPXAhVkJpoKHUbEBiIQFgguMAE&url=http%3A%2F%2Fwww.ymparisto.fi%2Fdownload%2Fnoname%2F%257BF5A71E5F-1300-47F5-BC13-C64649E0192E%257D%2F88395&usg=AOvVaw0qAKdVuFr257X5bctTKnaa (accessed on 29 November 2017).
27. Myllymaa, T.; Holmberg, H.; Hillamo, H.; Laajalehto, T.; Ahtila, P. Wood chip drying in fixed beds: Dryingkinetics and economics of drying at a municipal combined heat and power plant site. Dry. Technol. 2015, 33,205–215. [CrossRef]
28. Myllymaa, T.; Holmberg, H.; Ahtila, P. Techno-Economic Evaluation of Biomass Drying in Moving Beds: TheEffect of Drying Kinetics on Drying Costs. Dry. Technol. 2019, 37, 1201–1214. [CrossRef]
29. CO2 European Emission Allowances. MarketsInsider. 2018. Available online: http://markets.businessinsider.com/commodities/CO2-emissionsrechte (accessed on 3 September 2018).
30. Sawdust Price in Finland. 2018. Metsäkustannus. Available online: https://www.metsalehti.fi/puunhinta/
metsaenergian-kayttopaikkahinnat/ (accessed on 3 September 2018).31. Oil Price, 2018. Statistics Finland, Energy Prices, ISSN=1799-800X. 4th Quarter 2017, Appendix Figure 1.
Import Prices of Oil, Helsinki. Available online: http://www.stat.fi/til/ehi/2017/04/ehi_2017_04_2018-03-13_kuv_001_en.html (accessed on 3 September 2018).
32. Holmberg, H.; Isaksson, J.; Lahdelma, R. Minimization of total drying costs for a continuous packed-bedbiomass dryer operating at an integrated chemical pulp and paper mill. Biomass Bioenergy 2014, 71, 431–442.[CrossRef]
© 2020 by the authors. Licensee MDPI, Basel, Switzerland. This article is an open accessarticle distributed under the terms and conditions of the Creative Commons Attribution(CC BY) license (http://creativecommons.org/licenses/by/4.0/).