Economic Effects of Carbon Pricing in Washington State · Economic Effects of Carbon Pricing in...
30
Carbon Emissions Task Force Revised September 23, 2014 Economic Effects of Carbon Pricing in Washington State Presented by Forecasting and Research Division, OFM 1
Transcript of Economic Effects of Carbon Pricing in Washington State · Economic Effects of Carbon Pricing in...

Carbon Emissions Task Force
Revised September 23, 2014
Economic Effects of Carbon Pricing in Washington State
Presented by Forecasting and Research Division, OFM
1

Analysis Objectives
To support the Carbon Emissions Reduction Taskforce evaluate potential economic impacts of a market-based carbon dioxide emissions pricing system. This analysis was done in consultation with the Governor’s office consultant team at ICF. Economic analysis was carried out by the forecasting and research team at the Washington State Office of Financial Management..
The key analysis questions: What effects will a market-based policy to reduce
carbon and other emissions have on the economy? What sectors will experience job growth or loss? What transition effects will result due to the switch from
more carbon intensive processes to a greener economy? How might the revenues from a carbon price policy be
best used to create jobs or income or both?
2

Approach • Costs • Revenue Recycling • Indicators
o Level of emission reductions limits by 2020 and 2035
o Price changes for energy and fuel sectors o Changes in Washington’s job market o Changes in Washington State Gross
Domestic Product o Changes in Washington State personal
income
3

5
9
4
5
5
4
10
15
8
5
~40
0 5 10 15 20 25 30 35
Chemicals
Food Production
Government
Manufacturing
Metals
Minerals
Petroleum and Natural Gas Systems
Power Plants
Pulp and Paper
Refineries
Transportation Fuel Suppliers
MMt CO2e
Figure 1. 2011 GHG Emissions from Sectors Likely to be Regulated Under a Washington Cap-and-Trade Program. Covered sectors with average emissions (2010 – 2013) that exceed 25,000 MTCO2e/year. Number of individual
facilities in each sector shown inside each bar. The number of transportation fuel suppliers is approximate. Suppliers of marine, rail , and aviation fuels and heating oil are not included (or are very spotty). For individual
facility information see: http://ghgdata.epa.gov Source: Washington Department of Ecology.
4

Figure 2. Location of Stationary Facilities in Washington State Likely to be Regulated Under a Cap-and-Trade Program. Fuel suppliers not included in figure. For county-level information on
precise facility locations see: http://ghgdata.epa.gov Number of facilities are approximate and may not match data provided in Figure 1.
5

6
100% auction off all allowances No trading of allowances, offsets or other opportunities
to reduce compliance costs No additional innovation assumed following price
increases Additional complementary policies excluded Additional emissions reductions from spending excluded
Assumptions & Limitations

7
Economic: The net effect of both scenarios on Washington state jobs, GDP and personal income is slightly different from baseline.
Revenue recycling: Industry effects shown are partially a function of the revenue recycling assumptions used.
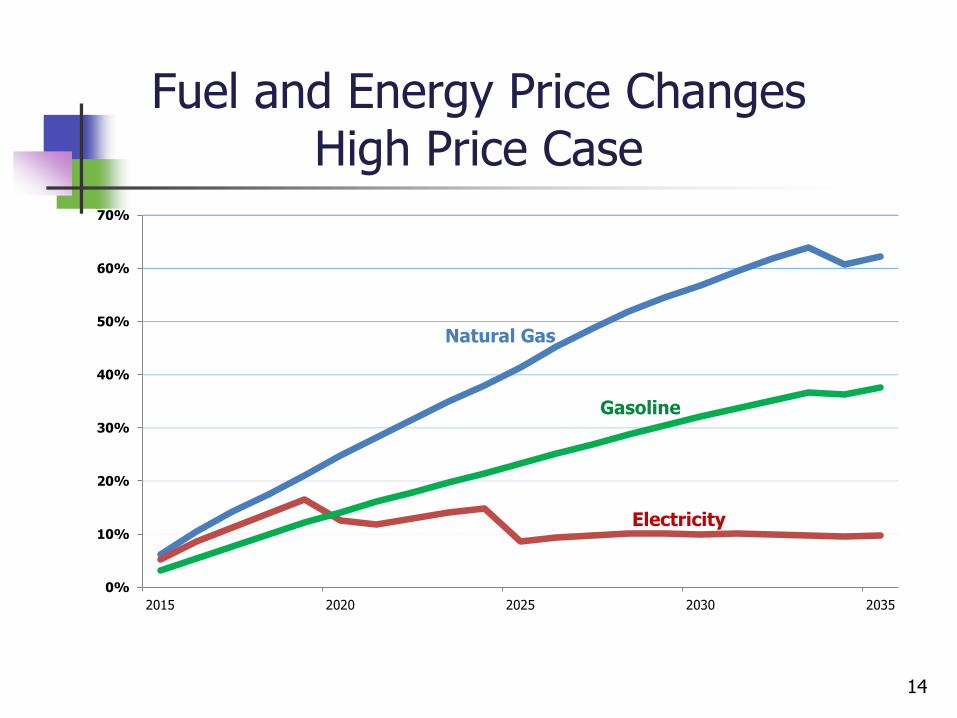
Fuel and Energy Prices: Increasing but at different rates; natural gas the most, electricity the least.
Emissions Low Price Scenario: Under the low price scenario we do not get to the 2020 or 2035 emissions reduction limits.
Emissions High Price Scenario: Under the high price scenario we hit both limits because the carbon price was chosen to meet the limits.
Key Findings
8
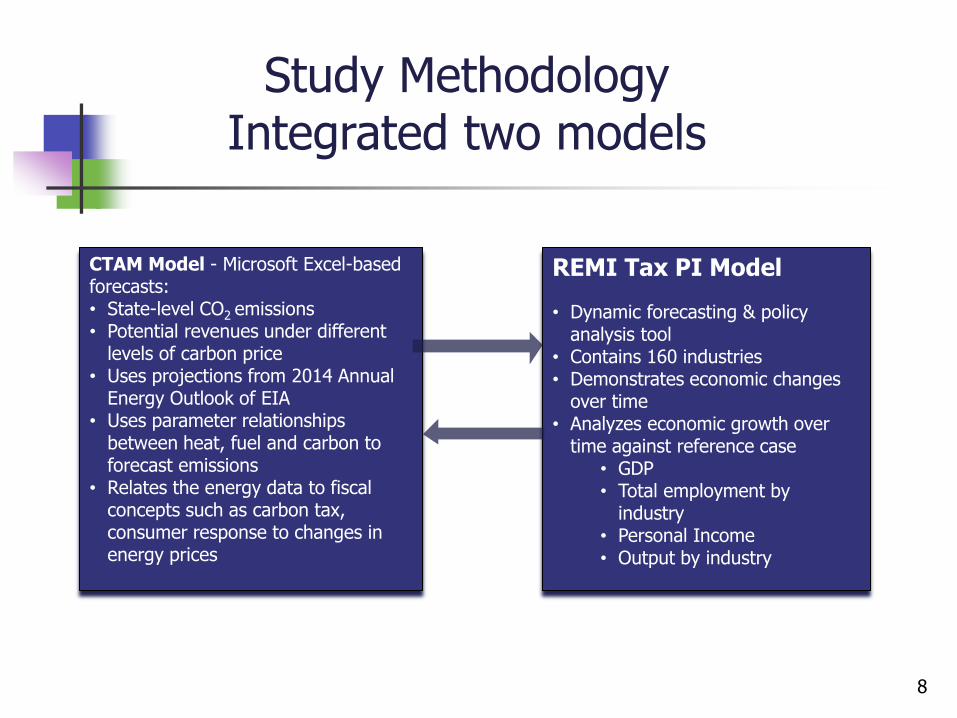
CTAM Model - Microsoft Excel-based forecasts: • State-level CO2 emissions • Potential revenues under different
levels of carbon price • Uses projections from 2014 Annual
Energy Outlook of EIA • Uses parameter relationships
between heat, fuel and carbon to forecast emissions
• Relates the energy data to fiscal concepts such as carbon tax, consumer response to changes in energy prices
REMI Tax PI Model
• Dynamic forecasting & policy analysis tool
• Contains 160 industries • Demonstrates economic changes
over time • Analyzes economic growth over
time against reference case • GDP • Total employment by
industry • Personal Income • Output by industry
Study Methodology Integrated two models
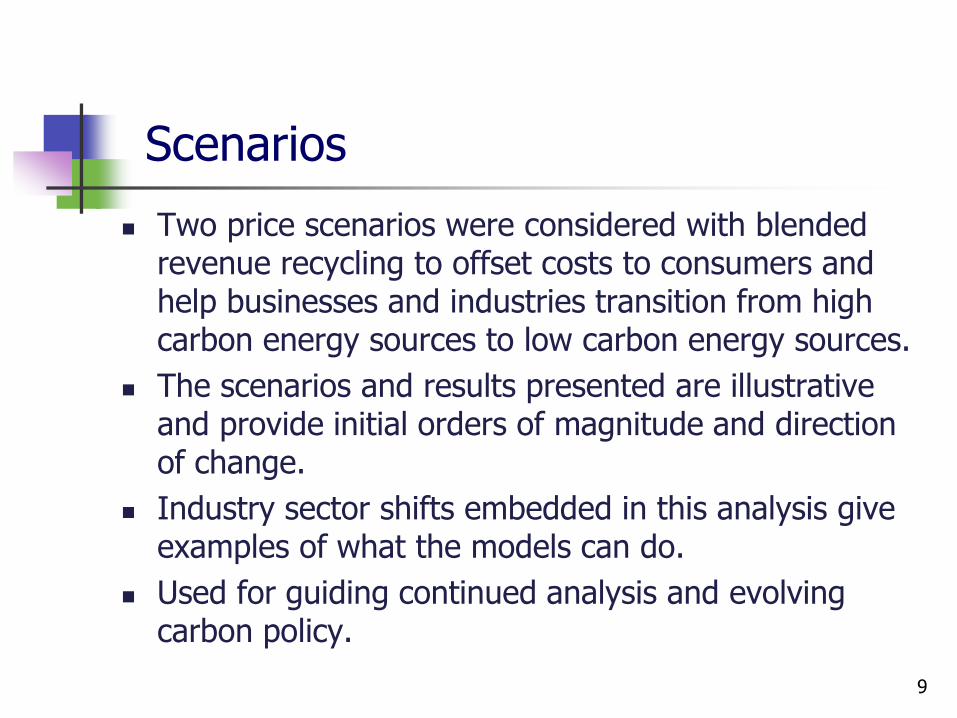
Scenarios
Two price scenarios were considered with blended revenue recycling to offset costs to consumers and help businesses and industries transition from high carbon energy sources to low carbon energy sources.
The scenarios and results presented are illustrative and provide initial orders of magnitude and direction of change.
Industry sector shifts embedded in this analysis give examples of what the models can do.
Used for guiding continued analysis and evolving carbon policy.
9
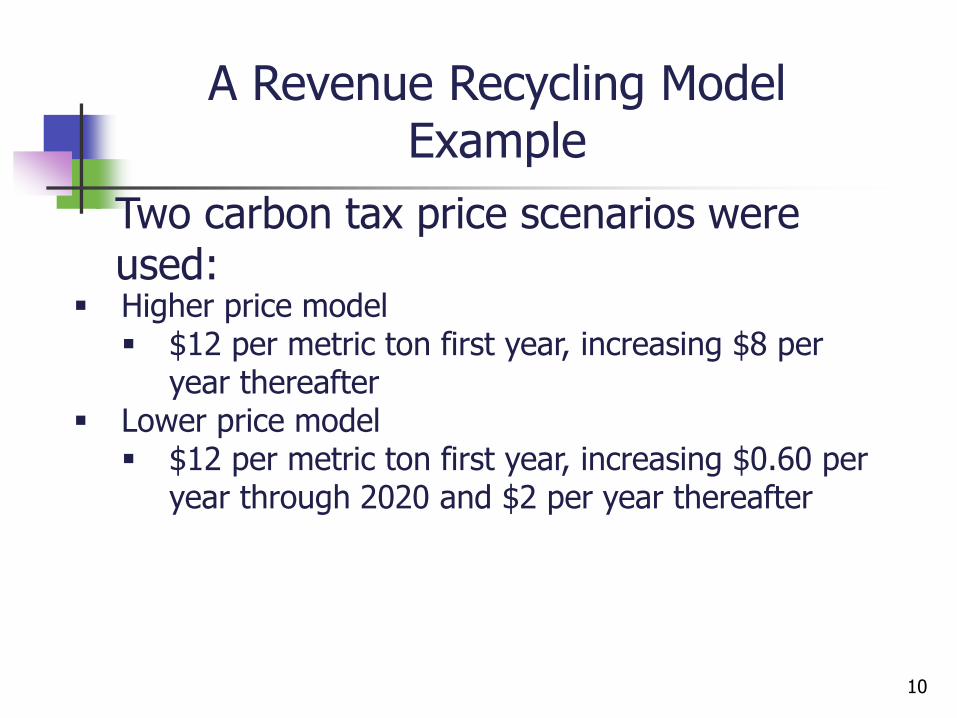
A Revenue Recycling Model Example
Higher price model $12 per metric ton first year, increasing $8 per
year thereafter Lower price model
$12 per metric ton first year, increasing $0.60 per year through 2020 and $2 per year thereafter
Two carbon tax price scenarios were used:
10

Emissions Compared to Business as Usual in relation to 2020 & 2035 Limits:
Low Price Scenario
50
55
60
65
70
75
2005 2010 2015 2020 2025 2030 2035 2040
mill
ion
MTC
O2
1990 Emissions
BAU Emissions
Adjusted Emissions2035 target
2020 target
11

12
Emissions Compared to Business as Usual in relation to 2020 & 2035 Limits:
High Price Scenario
49
54
59
64
69
74
2005 2010 2015 2020 2025 2030 2035 2040
mill
ion M
TCO
2
1990 Emissions
BAU Emissions
Adjusted Emissions 2035 target

13
Fuel and Energy Price Changes, Low Carbon Price Case
0%
2%
4%
6%
8%
10%
12%
14%
16%
18%
2015 2020 2025 2030 2035
Natural Gas
Gasoline
Electricity
14
Fuel and Energy Price Changes High Price Case
0%
10%
20%
30%
40%
50%
60%
70%
2015 2020 2025 2030 2035
Natural Gas
Gasoline
Electricity
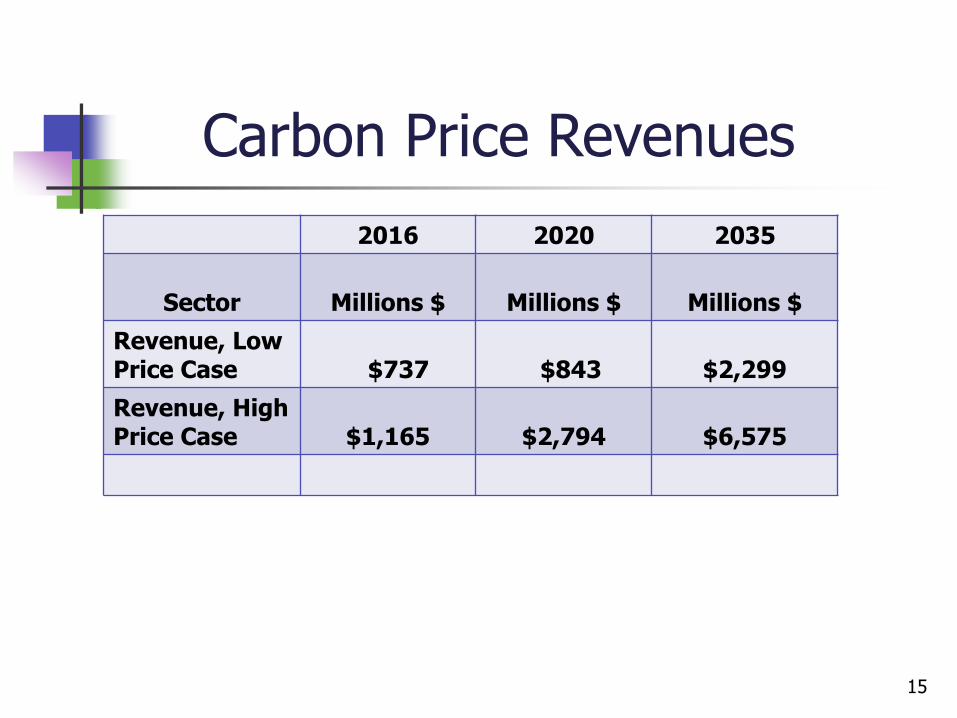
Carbon Price Revenues
2016 2020 2035
Sector
Millions $
Millions $
Millions $
Revenue, Low Price Case
$737
$843
$2,299
Revenue, High Price Case
$1,165
$2,794
$6,575
15

A revenue recycling model example
30% to Working Families Tax Credit 15% B&O tax cut to trade exposed
industries 40% B&O tax cut to construction sector 10% B&O tax cut to electric power
generation, transmission, and distribution 5% to state General Fund
Carbon tax revenues were apportioned as follows:
16

17
2015 2016 2017 2018 2019 2020 2021 2022 2023 2024 2025 2026 2027 2028 2029 2030 2031 2032 2033 2034 2035
Employment Blnded Low Pr 4,076 4,160 4,223 4,260 4,293 4,320 4,346 4,373 4,400 4,429 4,456 4,482 4,508 4,536 4,563 4,592 4,618 4,652 4,684 4,718 4,750
Baseline 4,074 4,157 4,218 4,255 4,287 4,314 4,340 4,366 4,392 4,420 4,446 4,472 4,497 4,525 4,551 4,578 4,604 4,636 4,668 4,701 4,733
3,800.00
3,900.00
4,000.00
4,100.00
4,200.00
4,300.00
4,400.00
4,500.00
4,600.00
4,700.00
4,800.00
Th
ou
sa
nd
s
Washington Employment, Blended Allocation Small Price Increase

18
2015 2016 2017 2018 2019 2020 2021 2022 2023 2024 2025 2026 2027 2028 2029 2030 2031 2032 2033 2034 2035
Personal Inc Blnd Low Pr 362.0 384.7 406.1 426.1 446.2 466.9 488.6 510.5 533.2 556.5 580.5 605.9 632.5 660.0 688.8 718.4 747.4 777.5 809.1 842.5 876.9
Baseline 361.9 384.6 405.9 425.7 445.8 466.4 488.1 510.0 532.5 555.8 579.7 605.0 631.4 658.9 687.5 716.9 745.8 775.7 807.1 840.4 874.7
$0
$100
$200
$300
$400
$500
$600
$700
$800
$900
$1,000
Bil
lio
ns
of
cu
rre
nt
do
lla
rs
Washington Nominal Personal Income, Blended Allocation Small Price Increase

19
Washington Real GDP, Blended Small Price Increase
2015 2016 2017 2018 2019 2020 2021 2022 2023 2024 2025 2026 2027 2028 2029 2030 2031 2032 2033 2034 2035
GDP Blnded Low Pr 382. 397. 410. 421. 432. 442. 452. 462. 473. 484. 495. 506. 517. 529. 542. 554. 566. 578. 590. 602. 615.
Baseline 382. 397. 410. 421. 431. 441. 452. 462. 472. 483. 494. 505. 516. 528. 540. 553. 564. 576. 588. 600. 613.
$0
$100
$200
$300
$400
$500
$600
$700
Bil
lio
ns o
f fi
xe
d 2
00
9 d
oll
ars

20
2015 2016 2017 2018 2019 2020 2021 2022 2023 2024 2025 2026 2027 2028 2029 2030 2031 2032 2033 2034 2035
Tot Emp High Pr 4,07 4,16 4,22 4,26 4,30 4,32 4,35 4,38 4,41 4,44 4,47 4,49 4,52 4,55 4,58 4,61 4,63 4,67 4,70 4,73 4,76
Baseline 4,07 4,15 4,21 4,25 4,28 4,31 4,34 4,36 4,39 4,42 4,44 4,47 4,49 4,52 4,55 4,57 4,60 4,63 4,66 4,70 4,73
3,800.00
3,900.00
4,000.00
4,100.00
4,200.00
4,300.00
4,400.00
4,500.00
4,600.00
4,700.00
4,800.00
4,900.00
Th
ou
sa
nd
s
Washington Employment: Blended Allocation High Price Increase

21
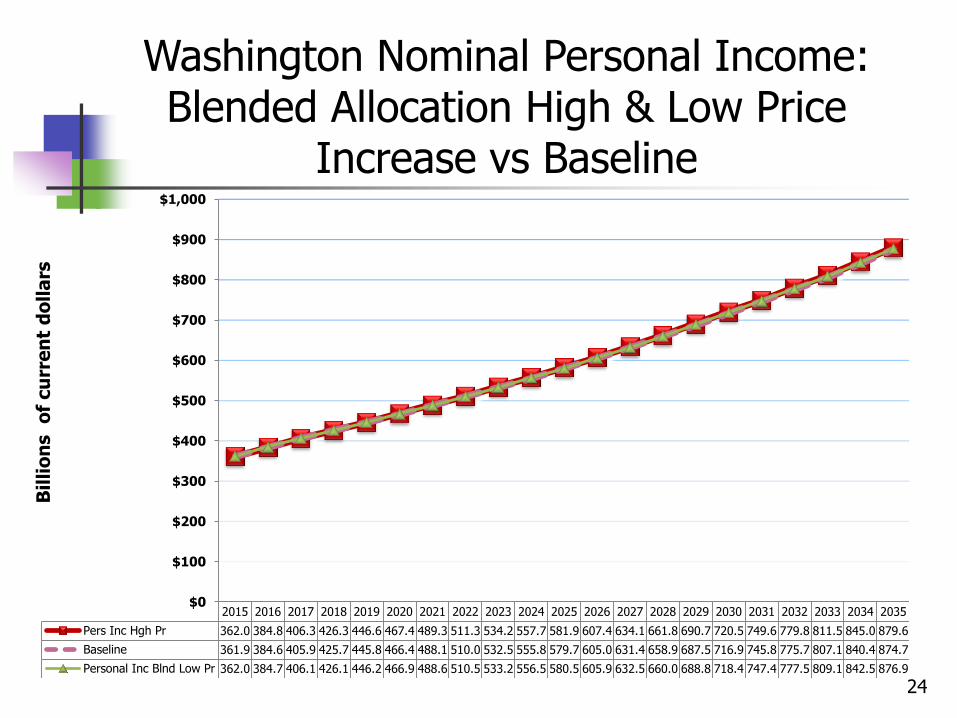
Washington Nominal Personal Income: Blended Allocation High Price Increase
2015 2016 2017 2018 2019 2020 2021 2022 2023 2024 2025 2026 2027 2028 2029 2030 2031 2032 2033 2034 2035
Pers Inc Hgh Pr 362. 384. 406. 426. 446. 467. 489. 511. 534. 557. 581. 607. 634. 661. 690. 720. 749. 779. 811. 845. 879.
Baseline 361. 384. 405. 425. 445. 466. 488. 510. 532. 555. 579. 605. 631. 658. 687. 716. 745. 775. 807. 840. 874.
$0
$100
$200
$300
$400
$500
$600
$700
$800
$900
$1,000
Bil
lio
ns
of
cu
rre
nt
do
lla
rs

22
Washington Real GDP: Blended Allocation High Price Increase
2015 2016 2017 2018 2019 2020 2021 2022 2023 2024 2025 2026 2027 2028 2029 2030 2031 2032 2033 2034 2035
GDP High Pr 382. 398. 411. 422. 432. 443. 453. 464. 475. 485. 496. 508. 520. 532. 544. 557. 569. 581. 593. 605. 618.
Baseline 382. 397. 410. 421. 431. 441. 452. 462. 472. 483. 494. 505. 516. 528. 540. 553. 564. 576. 588. 600. 613.
$0
$100
$200
$300
$400
$500
$600
$700
GDP, Blended High Price Increase
Bil
lio
ns o
f fi
xe
d 2
00
9 d
oll
ars

23
2015 2016 2017 2018 2019 2020 2021 2022 2023 2024 2025 2026 2027 2028 2029 2030 2031 2032 2033 2034 2035
Tot Emp High Pr 4,07 4,16 4,22 4,26 4,30 4,32 4,35 4,38 4,41 4,44 4,47 4,49 4,52 4,55 4,58 4,61 4,63 4,67 4,70 4,73 4,76
Baseline 4,07 4,15 4,21 4,25 4,28 4,31 4,34 4,36 4,39 4,42 4,44 4,47 4,49 4,52 4,55 4,57 4,60 4,63 4,66 4,70 4,73
Employment Blnded Low Pr 4,07 4,16 4,22 4,26 4,29 4,32 4,34 4,37 4,40 4,42 4,45 4,48 4,50 4,53 4,56 4,59 4,61 4,65 4,68 4,71 4,75
3,800.00
3,900.00
4,000.00
4,100.00
4,200.00
4,300.00
4,400.00
4,500.00
4,600.00
4,700.00
4,800.00
4,900.00
Th
ou
sa
nd
s
Washington Employment: Blended Allocation High & Low Price Increase
vs Baseline
24
2015 2016 2017 2018 2019 2020 2021 2022 2023 2024 2025 2026 2027 2028 2029 2030 2031 2032 2033 2034 2035
Pers Inc Hgh Pr 362.0 384.8 406.3 426.3 446.6 467.4 489.3 511.3 534.2 557.7 581.9 607.4 634.1 661.8 690.7 720.5 749.6 779.8 811.5 845.0 879.6
Baseline 361.9 384.6 405.9 425.7 445.8 466.4 488.1 510.0 532.5 555.8 579.7 605.0 631.4 658.9 687.5 716.9 745.8 775.7 807.1 840.4 874.7
Personal Inc Blnd Low Pr 362.0 384.7 406.1 426.1 446.2 466.9 488.6 510.5 533.2 556.5 580.5 605.9 632.5 660.0 688.8 718.4 747.4 777.5 809.1 842.5 876.9
$0
$100
$200
$300
$400
$500
$600
$700
$800
$900
$1,000
Bil
lio
ns
of
cu
rre
nt
do
lla
rs
Washington Nominal Personal Income: Blended Allocation High & Low Price
Increase vs Baseline

25
Washington Real GDP: Blended Allocation High & Low Price
Increase vs Baseline
2015 2016 2017 2018 2019 2020 2021 2022 2023 2024 2025 2026 2027 2028 2029 2030 2031 2032 2033 2034 2035
GDP Blnded Low Pr 382.9 397.8 410.8 421.6 432.2 442.4 452.8 462.9 473.6 484.1 495.0 506.2 517.8 529.8 542.2 554.9 566.4 578.3 590.3 602.8 615.6
Baseline 382.7 397.5 410.4 421.1 431.6 441.7 452.1 462.2 472.8 483.2 494.0 505.1 516.6 528.5 540.7 553.3 564.6 576.5 588.4 600.8 613.6
GDP High Pr 382.9 398.0 411.1 422.1 432.9 443.3 453.9 464.2 475.2 485.9 496.9 508.3 520.1 532.2 544.6 557.5 569.1 581.1 593.3 605.9 618.7
$0
$100
$200
$300
$400
$500
$600
$700
Mill
ion
s o
f f
ixe
d 2
00
9 d
olla
rs
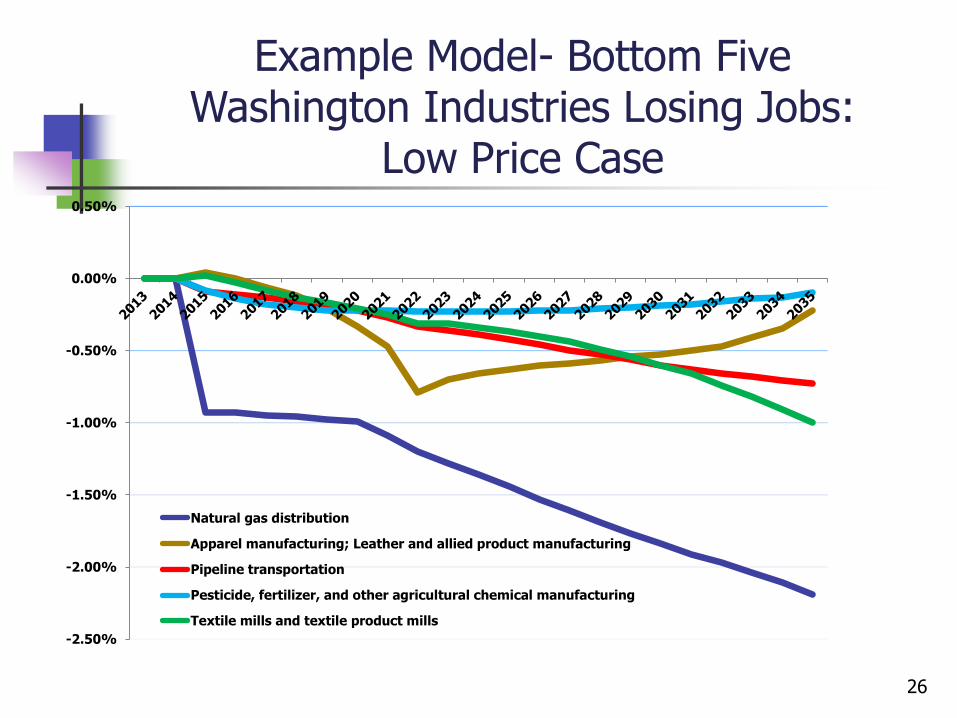
Example Model- Bottom Five Washington Industries Losing Jobs:
Low Price Case
-2.50%
-2.00%
-1.50%
-1.00%
-0.50%
0.00%
0.50%
Natural gas distribution
Apparel manufacturing; Leather and allied product manufacturing
Pipeline transportation
Pesticide, fertilizer, and other agricultural chemical manufacturing
Textile mills and textile product mills
26

Example model- Top Five Washington Industries Gaining Jobs: Low Price Case
0%
1%
2%
3%
4%
5%
6%
7%
Basic chemical manufacturing
Electric power generation, transmission, and distribution
Support activities for mining
Iron and steel mills and ferroalloy manufacturing
Dairy product manufacturing
27

Example Model- Bottom Five Washington Industries Losing Jobs:
High Price Case
-6.00%
-5.00%
-4.00%
-3.00%
-2.00%
-1.00%
0.00%
1.00%
Natural gas distribution
Pesticide, fertilizer, and other agricultural chemical manufacturing
Petroleum and coal products manufacturing
Water transportation
Textile mills and textile product mills
28

Example Model – Top Five Washington Industries Gaining Jobs:
High Price Case
0.00%
5.00%
10.00%
15.00%
20.00%
25.00%
Basic chemical manufacturing
Electric power generation, transmission, and distribution
Support activities for mining
Iron and steel mills and ferroalloy manufacturing
Construction
29

Wrap up
30
Statewide economic effects on Washington’s jobs, GDP and personal income are small.
Results vary at the industries level. Fuel and Energy Prices increase but at different rates;
natural gas the most, electricity increasing at the slowest rate.
Under the low price scenario we do not hit either the 2020 or 2035 emissions reduction limits.
Under the high price scenario we hit both limits because the carbon price was chosen so that the limits were met.