Economic Dynamics in the Malthusian Era: Evidence · PDF fileEconomic Dynamics in the...
45
Economic Dynamics in the Malthusian Era: Evidence from the 1609 Spanish Expulsion of the Moriscos * Short title: Economic Dynamics in the Malthusian Era Eric Chaney and Richard Hornbeck May 2015 Abstract We investigate economic dynamics in the Malthusian era using the 1609 expulsion of Moriscos from Spain. Sharp population declines in former-Morisco districts were ac- companied by decreased output and increased per capita output. While these short-run results are consistent with standard Malthusian predictions, Malthusian convergence was delayed through 1786 in former-Morisco districts. Archival sources and historical accounts suggest extractive institutions and cultural differences may have contributed to delayed convergence in population and output per capita. This historic episode provides an unusually rich setting to examine Malthusian dynamics, highlighting the potential for sustained differences in per capita output in the Malthusian era. For the millennia prior to the demographic transition, models of economic growth focus on capturing “Malthusian dynamics.” In this Malthusian era, technological growth or popu- lation declines are predicted to cause temporary increases in output per capita that dissipate as population grows and the land-to-labor ratio declines. Scholars have generally found empirical support for the traditional Malthusian predic- tions. In a recent contribution, Ashraf and Galor (2011) show that both land productivity and technology were historically related to population density rather than income per capita. Impacts of the European Black Death are also consistent with this framework (e.g., Phelps- Brown and Hopkins, 1981; Hatcher, 1996; Clark, 2005), although population and wages appear to converge slowly following this large population shock. * Eric Chaney, [email protected], Littauer Center, Harvard University, Cambridge, MA, 02138. Richard Hornbeck, [email protected], Littauer Center, Harvard University, Cambridge, MA, 02138. For comments and suggestions, we thank Morten Ravn and anonymous referees, Daron Acemoglu, Quamrul Ashraf, Eli Berman, Venkataraman Bhaskar, Raj Chetty, Greg Clark, Melissa Dell, Oded Galor, Paola Giuliano, Ed Glaeser, Phil Hoffman, Pete Klenow, Marti Mestieri, Nathan Nunn, Caroline Thomas, Jordi Vidal-Robert, Andrea Vindigni, Joachim Voth, David Weil, conference participants at Brown and UCLA, and seminar participants at IAS Princeton, IMT Lucca, and Sciences Po. For sharing data and for numerous helpful discussions, we thank Manuel Ardit. For facilitating data work, we thank the archival staff at the Archive of the Catedral de Val` encia. For financial research support, we thank the Weatherhead Center. 1
Transcript of Economic Dynamics in the Malthusian Era: Evidence · PDF fileEconomic Dynamics in the...
Economic Dynamics in the Malthusian Era:
Evidence from the 1609 Spanish Expulsion of the Moriscos∗
Short title: Economic Dynamics in the Malthusian Era
Eric Chaney and Richard Hornbeck
May 2015
Abstract
We investigate economic dynamics in the Malthusian era using the 1609 expulsionof Moriscos from Spain. Sharp population declines in former-Morisco districts were ac-companied by decreased output and increased per capita output. While these short-runresults are consistent with standard Malthusian predictions, Malthusian convergencewas delayed through 1786 in former-Morisco districts. Archival sources and historicalaccounts suggest extractive institutions and cultural differences may have contributedto delayed convergence in population and output per capita. This historic episodeprovides an unusually rich setting to examine Malthusian dynamics, highlighting thepotential for sustained differences in per capita output in the Malthusian era.
For the millennia prior to the demographic transition, models of economic growth focus
on capturing “Malthusian dynamics.” In this Malthusian era, technological growth or popu-
lation declines are predicted to cause temporary increases in output per capita that dissipate
as population grows and the land-to-labor ratio declines.
Scholars have generally found empirical support for the traditional Malthusian predic-
tions. In a recent contribution, Ashraf and Galor (2011) show that both land productivity
and technology were historically related to population density rather than income per capita.
Impacts of the European Black Death are also consistent with this framework (e.g., Phelps-
Brown and Hopkins, 1981; Hatcher, 1996; Clark, 2005), although population and wages
appear to converge slowly following this large population shock.
∗Eric Chaney, [email protected], Littauer Center, Harvard University, Cambridge, MA, 02138.Richard Hornbeck, [email protected], Littauer Center, Harvard University, Cambridge, MA, 02138.For comments and suggestions, we thank Morten Ravn and anonymous referees, Daron Acemoglu, QuamrulAshraf, Eli Berman, Venkataraman Bhaskar, Raj Chetty, Greg Clark, Melissa Dell, Oded Galor, PaolaGiuliano, Ed Glaeser, Phil Hoffman, Pete Klenow, Marti Mestieri, Nathan Nunn, Caroline Thomas, JordiVidal-Robert, Andrea Vindigni, Joachim Voth, David Weil, conference participants at Brown and UCLA,and seminar participants at IAS Princeton, IMT Lucca, and Sciences Po. For sharing data and for numeroushelpful discussions, we thank Manuel Ardit. For facilitating data work, we thank the archival staff at theArchive of the Catedral de Valencia. For financial research support, we thank the Weatherhead Center.
1
The Malthusian era can be more nuanced, however. Many historical civilizations sus-
tained incomes significantly above subsistence, at least for an elite subset of the population.
In addition, recent research has argued that large population shocks could lead to sustained
increases in incomes by changing the demographic regime (Voigtlander and Voth, 2009,
2013b,a). Although such nuance can be reconciled with an augmented Malthusian frame-
work, empirical identification of deviations from the canonical model can be challenging.
Such identification issues have often limited empirical analysis in the Malthusian era more
generally. For example, efforts to identify the effects of population shocks have generally
been hampered by the tendency for disease-driven population shocks to affect entire regions
and often reoccur, making it difficult to quantify how the area would have changed in the
absence of a one-time population shock.1
In this paper, we use the expulsion of Spain’s converted Muslims (Moriscos) to estimate
dynamic responses to a population shock in the Malthusian era. In 1609, the Spanish Crown
suddenly and unexpectedly expelled Spain’s roughly 300,000 Moriscos. Our empirical anal-
ysis focuses on the Kingdom of Valencia, which lost 130,000 Moriscos or roughly one-third
of its pre-expulsion population. This loss of population is roughly similar in magnitude to
the Black Death in Europe. Importantly, however, there was substantial local variation in
the severity of the population shock that allows us to use an identification strategy simi-
lar to that used in estimating labor market dynamics in the modern economy (e.g., Card,
1990; Hunt, 1992; Carrington and de Lima, 1996; Friedberg, 2001). To our knowledge, the
Moriscos’ expulsion provides advantages for empirical estimation that are unprecedented in
a Malthusian setting.
We begin by estimating relative changes in population, output, and output per capita
for districts with a greater initial population share of Moriscos, controlling for differential
changes associated with districts’ geographic characteristics (distance to the City of Valen-
cia, distance to the coast, terrain ruggedness, latitude and longitude, average rainfall, and
agricultural suitability). By comparing changes in former-Morisco areas to changes in nearby
areas, the identification assumption is that these areas would have changed similarly if not
for the Moriscos’ expulsion.
Our regression estimates provide additional empirical support for the short-run predic-
tions of the Malthusian model: the Moriscos’ expulsion led to a sharp relative decline in
population and an increase in output per capita in former-Morisco areas. The long-run re-
sponse in former-Morisco areas, however, may deviate from textbook Malthusian predictions
in the sense that output per capita and population remain differentially higher and lower,
1For example, in the canonical case of the Black Death, the initial population shock was followed by manysubsequent plague outbreaks (Voigtlander and Voth, 2013b).
2
respectively, for 177 years through the end of our sample.
We then investigate whether our results simply reflect slow general convergence rates in
the Malthusian era. Indeed, following the Black Death, population levels in England had not
fully recovered over a similar time frame (Clark, 2005, 2010). To investigate this possibility,
we exploit our district-level panel data to estimate convergence rates for population, output,
and per capita output (a la Barro and Sala-i-Martin, 1992). These regressions provide direct
evidence that population and per capita output converged abnormally slowly in former-
Morisco areas following the expulsion, relative to former-Christian areas in our sample.
Finally, we consider why the expulsion of the Moriscos may have had such long-lasting
impacts on population levels and output per capita. The existing literature suggests two
main possibilities, though we briefly explore others. A first interpretation emphasizes the
role of institutions. Prior to the expulsion, Morisco populations were subject to a harsh
institutional framework. This institutional framework is generally thought to have persisted
in former-Morisco areas, and may have become harsher in some respects (e.g., Casey, 1971,
p. 32). These institutions may have restricted population growth and maintained higher pre-
tax per capita output, both by discouraging further Christian in-migration and by preventing
in-migrants from retaining surplus income.
A second interpretation emphasizes the role of cultural differences between Christians
and Moriscos (e.g., Ardit, 2009a). Prior to the Moriscos’ expulsion, Christian contemporaries
claimed that Moriscos survived on less, married younger, and had more children than their
Christian counterparts. This interpretation attributes the results to a cultural shift toward
smaller families and increased incomes following the expulsion.
We do not formally distinguish these interpretations, and both may have been in play
simultaneously, although we do provide new quantitative evidence on the persistence of
extractive institutions. We gather data on the institutional framework in 1786 and document
that former-Morisco areas were more likely to be controlled by the nobility (and, in Valencia,
noble control was associated with a harsher institutional framework). Similarly, data on a
revolt against the nobility in 1693 shows that all rebel leaders were from former-Morisco
areas. Historical depictions of the poverty of Christian in-migrants, and nobles’ efforts to
restrict their mobility, suggest that high tax rates had a role in discouraging population
growth and maintaining higher pre-tax output per capita in former-Morisco districts.
Of independent interest is the persistence of extractive institutions in former-Morisco
areas, despite the scarcity of labor in the aftermath of the Morisco’s expulsion. Acemoglu
and Wolitzky (2011) develop a theoretical framework to understand how coercive labor
institutions respond to labor scarcity. A key feature is how much initial institutions allow
workers to leverage their improved outside options during periods of labor scarcity (North
3
and Thomas, 1971), compared to how much labor scarcity raises landowners’ returns from
labor coercion (Domar, 1970). We discuss how the Valencian nobility, their creditors, and
the Spanish Crown worked together at the expense of peasants to restrict subsequent labor
mobility and support the extractive institutional framework. In this sense, institutional
responses in Valencia had more in common with the increases in coercion in Eastern Europe
following the Black Death (Brenner, 1976) rather than the declines in serfdom in Western
Europe following the Black Death (Habakkuk, 1958; Le Roy Ladurie, 1977). This historical
case of sudden labor scarcity created an historical “critical juncture” that pushed institutions
in one of two directions, depending on the initial institutions and the distribution of political
power (Acemoglu and Robinson, 2012). This episode helps to understand how conditions
in the Malthusian era can influence the historical development of institutions, which can
impact institutions and economic outcomes even today (e.g., Engerman and Sokoloff, 1997;
Acemoglu, Johnson and Robinson, 2001, 2002; Banerjee and Iyer, 2005; Dell, 2010).
The main empirical results are consistent with accounts of the Moriscos’ expulsion having
a large and long-lasting impact on Valencia, though they are less consistent with a classical
view emphasizing the importance of a permanent loss of agricultural human capital following
the Moriscos’ expulsion (e.g., Janer, 1857, pp. 47-48). In particular, our estimated recovery
in output suggests that Christian in-migrants were able to return to pre-expulsion levels
of output relatively quickly and with fewer workers. This recovery in output might reflect
Christian migrants’ adaptation to local geography and their accumulation of location-specific
human capital, and/or agricultural adaptation to labor scarcity similar to that in the modern
growth era (Hornbeck and Naidu, 2014).
Our analysis of delayed Malthusian dynamics relates to theories of the transition from the
Malthusian era to the modern growth era (see, e.g., Galor and Weil, 1996, 1999, 2000; Jones,
2001; Galor and Moav, 2002; Hansen and Prescott, 2002; Clark, 2007; Galor, 2011). Many
of these theories explore how endogenous shifts in cultural practices, particularly related to
fertility behavior, could cause a transition from the Malthusian era. Others have explored
how output per capita could increase, even within the Malthusian era, if surpluses encourage
elites to wage war and spread disease (see, e.g., Voigtlander and Voth, 2013b). Our study
complements these literatures, as our results demonstrate that higher output per capita can
be sustained through the Malthusian era.
1 Historical Background
1.1 Muslims in the Kingdom of Valencia
Islamic forces invaded the Iberian Peninsula in 711 CE and, over the following 700 years,
Muslim and Christian forces fought for control in a series of wars known collectively as
4
the Reconquista. Many areas prospered economically under Muslim rule, however, and the
Muslim City of Valencia was one of the largest cities in Western Europe. In 1238, the Muslim
City of Valencia surrendered to the army of King Jaume I of Aragon, and remained afterward
under Christian control.
Immediately following the conquest of Islamic Valencia, Christians in-migrants were a
small minority in much of the Kingdom and were separated by linguistic and cultural barri-
ers from the Muslim majority (Ciscar, 1994, p. 134). During the 50 years after the Christian
conquest, Islamic society lost many political and cultural elites through failed rebellions
and emigration. There appears to have been limited cultural convergence within Valencia,
however, and there remained differences in social structures between the Islamic and Chris-
tian communities within the Kingdom. For example, Valencia’s Muslim communities were
characterized by tribal social structures based on clans and marriage between first cousins
(Meyerson, 1991, p. 254).
Institutional changes occurred more quickly in the decades following the conquest, as
Islamic governmental structures were replaced by “feudal” institutional arrangements (Mey-
erson, 1991, p. 226). Following the conquest, much of the Kingdom was ceded by the King
to the nobility as payment for military or financial aid.2 The King also ceded much legal ju-
risdiction over those living on the land, allowing nobles to shape the institutional framework
in their domains.
Nobles exploited their Muslim vassals, forcing them to provide labor services and a large
share of their harvests. Muslims in Valencia had little alternative but to pay these high
costs, though labor scarcity following medieval plagues may have improved Muslims’ outside
options and lightened extractive pressure (Meyerson, 1991, pp. 112-113, 179-180).
The nobility was forced to grant relatively favorable conditions to attract Christian mi-
grants to the region, who paid little more than the church tithe and seignorial dues (Febrer
Romaguera, 2000, p. 40). These favorable conditions were difficult to modify, once codified,
and persisted with the political protection of Christians by the Church and the King. By
the 16th century, the Christian population had increased from a religious minority to become
roughly two-thirds of the Kingdom of Valencia.
Nobles continued to exert considerable influence on local institutions, even after the
Spanish monarchy unified the country in the late 15th and early 16th centuries. Local elites
maintained autonomy over municipal-level institutions and influenced the overall manage-
ment of the Kingdom of Valencia. Although a high-ranking noble from outside Valencia
2By the end of the Middle Ages, the Crown had alienated roughly three-quarters of the kingdom to thenobility and other elites, such as the church and merchant classes (Febrer Romaguera, 2000, p. 16). Thenobility controlled the majority of these alienated lands.
5
was generally appointed viceroy to act on behalf of the King in overseeing the Kingdom of
Valencia, he was aided in his task by a tribunal that was staffed by lawyers from Valencia’s
merchant class (Canet, 1986). In addition, the King had councils of advisers in Madrid, who
were drawn from the tribunal of Valencia and other regions (Casey, 2008, p. 189).
1.2 Moriscos in the Kingdom of Valencia
Nobles’ exploitation of Muslims persisted through the forced conversion of Valencia’s Mus-
lim population to Christianity in 1525. The former-Muslim population became known as
Moriscos, who initially hoped that their involuntary conversion would free them of the forced
labor services and higher tax rates. These hopes were not realized, however, and contempo-
raries noted the challenge for Moriscos to “live like Christians and pay like Muslims” (Ciscar,
1977, p. 122). The Valencian tribunal later recalled that Valencia’s Muslims “were as slaves”
prior to their baptism and that “at the time of their baptism it was agreed that the Moriscos
would have to pay the same that they paid when they were Muslims” (ACA, CA, leg. 221,
8/9).3
Like their Muslim predecessors, the Morisco population continued to be exploited by the
Valencian nobility. Nobles received a share of the Moriscos’ harvest that could reach as high
as 40%. Moriscos were also required to present annual gifts and free labor services to the
nobility, in addition to purchasing items at above-market prices from stores owned by nobles
and grinding their grain in nobles’ mills (Ciscar, 1977, pp. 228-235). One contemporary
noted that “to say that the Moriscos are slaves of their lords is not appropriate because
they are much more than slaves,” while another exclaimed that the Moriscos “drink a jug
of water and eat a handful of raisins and everything else is for their lords” (Torres, 1969, p.
135). This extractive relationship was reflected in the popular saying: “quien tiene moro,
tiene oro” or “he who has a Muslim has gold” (Braudel, 1995, p. 789).
In comparison, the Moriscos’ Christian neighbors generally did not perform labor services
and their payments continued to be limited to a tithe and seignorial dues (Ciscar, 1993, p.
200). The Moriscos may have been subject to even harsher conditions than their Muslim
ancestors, as population growth in the 16th century throughout the Mediterranean appears
to have decreased Moriscos’ outside options and contributed to more-extractive institutions
(Meyerson, 1991, pp. 112-113, 180).
Valencia’s nobility strove to maintain local Morisco populations and supported the contin-
uation of Islamic social structures and practices, despite pressures by the Spanish Inquisition
3Throughout this paper, all archival sources from the Archive of the Crown of Aragon (ACA) are drawnfrom the unidad entitled Consejo de Aragon (CA). The number following leg. provides the legajo. Followingthis, the first number after the comma provides the number and that after the slash provides the documentwithin that number.
6
to eradicate these differences. The nobility are thought to have undermined these attempts
at cultural assimilation because Moriscos’ continued covert Islamicism served to justify their
economic exploitation (Ciscar, 1977, p. 68). Beginning in the 1570s, Valencia’s nobility
successfully resisted growing pressure to expel the Morisco population (Benıtez, 2001).
The Spanish Crown renewed efforts to expel Moriscos in the early 17th century. The
King’s council noted, however, that “the greatest difficulty that we might face in this en-
deavor is the resistance of the lords of morisco vassals due to the losses they will sustain”
(Benıtez, 2001, pp. 398-399).4
Despite the nobles’ resistance, the decision to expel the Moriscos was made in secret on
April 4th, 1609. The King’s council initially decided to give the nobles all of the possessions
of the Moriscos in their domains (Benıtez, 2008, p. 258), as compensation for the nobles’
losses and to reduce their opposition to the expulsion. In the months prior to the public
announcement of the expulsion, however, the council decided to allow Moriscos to take
whatever goods that they could carry to discourage revolt (Benıtez, 2008, p. 259). Whatever
the Moriscos could not carry would belong to the nobility.
1.3 The Expulsion of Moriscos in 1609
In September 1609, the Spanish Navy gathered off the coast of Valencia and rumors circulated
that this concentration of naval power would be used to expel the Moriscos. Valencia’s
nobles convened and sent an embassy on September 16th to King Phillip III to lobby for
the cancellation of the expulsion, citing the “irreparable damages, destruction, affliction
and calamities that the Kingdom would inevitably endure following the execution of such
a measure” (Salvador, 1998, pp. 129-130). When the nobles’ embassy arrived in Madrid,
they were informed that the decision was final and that the expulsion had already begun
(Halperin, 2008, p. 174). To limit the nobility’s resistance to the expulsion, the Viceroy
of Valencia was instructed to assure each noble that the King would “work to repair the
damages and discomfort that the expulsion will cause by all possible means” (Benıtez, 2008,
p. 259).
The Moriscos’ expulsion was announced publicly on September 22nd. The expulsion order
stated that Moriscos could only take what they could carry and that hiding other assets from
the nobility was punishable by death (Bleda, 1610, pp. 597-601). Nobles restricted Moriscos’
ability to sell their possessions and there was often little time before Moriscos were forced
from their homes (Halperin, 2008, pp. 183-184). Some nobles tolerated the sale of goods to
incoming Christian settlers, apparently to forestall revolt, though the surge in supply led
to what one contemporary called “the cheapest fairs the Kingdom had ever seen” (Benıtez,
4One potential reason for the Spanish Crown to renew expulsion efforts at this time was to provide anominal victory after a series of military and political setbacks (Benıtez, 2001, p. 430; Furio, 1995, p. 312).
7
2008, p. 259; Halperin, 2008, p. 179).
Over the following three months, approximately 110,000 Moriscos left Valencia.5 Many
Moriscos were escorted from their homes to exit ports by military force, where the vast
majority were taken to North Africa. There were two revolts in October of 1609, though
these were limited to mountainous terrain and were quickly subdued (LaPeyre, 1959, pp.
56-57). Some Moriscos continued to hide in the mountains, and the last 15 are reported to
have been captured on February 2nd, 1612 (LaPeyre, 1959, p. 67). Overall, the Kingdom
of Valencia lost approximately 130,000 Moriscos or roughly one-third of its total population
prior to the expulsion.
The loss of agricultural laborers devastated agricultural production in former-Morisco
areas and immediately bankrupted many nobles who relied on high tax revenues to pay
their debts.6 Nobles’ creditors began legal proceedings to confiscate former-Morisco lands
that had been used as collateral (Benıtez, 2008, p. 264). The Spanish Crown faced substan-
tial challenges in allocating the financial losses caused by the Moriscos’ expulsion, as both
the nobility and their creditors wielded considerable influence.7 In the years following the
Moriscos’ expulsion, the Crown worked out a balance between these competing interests: no-
bles’ creditors were forced to take substantial losses on their debt, the nobility agreed to pay
a share of their debts, and the nobility agreed to assume the Moriscos’ debts in exchange for
the ability to impose extractive taxes in former-Morisco areas (Benıtez, 2008, p. 296; Regla,
1964, p. 164).
1.4 Christian Settlement of Former-Morisco Areas
Immediately following the expulsion, it seemed that labor scarcity would force the Valencian
nobility to relax the extractive conditions in former-Morisco areas. Christian migrants began
to occupy former-Morisco areas immediately following the expulsion, at times arriving before
5The expulsion of Moriscos also affected areas outside the Kingdom of Valencia, though to a much lesserdegree (LaPeyre, 1959).
6The Valencian nobility had accumulated large debts prior to the expulsion (Casey, 1975, 2008), and mayalso have used the expulsion as an excuse to default on those debts (Ciscar, 1977, p. 143).
7In November 1609, the King had ordered the nobles to encourage repopulation and guaranteed thatmigrants’ harvest would not be confiscated by creditors (a copy of the edict is reproduced in Boronat, 1901[1992], pp. 564-567). In February 1610, the tribunal of Valencia (which generally defended creditors at thistime) wrote to the King with a list of policy recommendations to deal with the effects of the expulsion.They noted that continuation of the extractive institutional framework would delay the repopulation since“the Christians will not want to pay the services, taxes, labor services, and the share of their crops that theMoriscos paid,” but nevertheless suggested that nobles be allowed to establish the institutional conditionsthey saw fit “even if this included labor services” (ACA, CA, leg. 221, 8/9). In May 1610, the viceroy ofValencia wrote to the King informing him of the grave financial crisis caused by the expulsion because theKingdom “lives off interest which is not being and cannot be paid” (ACA, CA, leg. 221, 8/6). Since thisinterest was not paid, Valencia’s creditor classes were forced to withdraw substantial funds from Valencia’scentral bank, which collapsed in 1613 (Regla, 1964, p. 176; Torres, 1969, pp. 134-136). The bank wasrecapitalized following its collapse, although it continued to experience difficulties through the 17th century.
8
the Moriscos had left. This initial wave of migration reflected beliefs that Christians would
be able to settle former-Morisco areas under the same tax conditions as in former-Christian
areas.
It soon became clear that nobles intended to maintain the extractive institutions in
former-Morisco areas, however, and many of the Christian migrants left (Halperin, 2008,
pp. 205-207).8 There was initially high turnover in the resettlements as settlers moved to
other resettlements where they believed the conditions were more favorable or moved back
to their previous homes (Ciscar, 1975, pp. 148-149). The nobility found it difficult to attract
and maintain Christian populations under the continued institutional framework (Casey,
2008, p. 124). A high-ranking cleric noted, in a November 1609 letter to the King, that the
nobles “do not want to repopulate their lands despite the fact that there are many potential
migrants because they wish to extract from the Christians the same amount that they took
from the Moriscos” (cited in Boronat, 1901 [1992], p. 236).
Valencia’s nobility made some initial concessions to Christian migrants to encourage
them to populate former-Morisco areas. Temporary tax concessions attracted migrants (e.g.,
Lloret, 2002, p. 355), whereby nobles allowed peasants to pay a smaller share of their crop
than stipulated in the resettlement conditions. The remaining payments were often retained
as a debt to their new lord, which would be paid in the future (Ciscar, 1975).
Temporary tax concessions served to limit labor mobility, however, as peasants could
not legally leave seignorial lands prior to settling existing debts with their lords. Indeed,
the nobles had previously used similar techniques to limit the mobility of Valencia’s Muslim
or Morisco populations prior to their expulsion (Meyerson, 1991, pp. 19-23, 326). The
Spanish Crown aided the nobility in maintaining extractive institutions in former-Morisco
areas (Casey, 2008, p. 115), issuing edicts that limited labor mobility out of former-Morisco
areas in the years after the expulsion (Benıtez, 2008, pp. 297, 308).9
Nobles maintained control of institutions in former-Morisco areas, imposing higher taxes
in former-Morisco areas than were required in former-Christian areas. In former-Morisco
areas, the peasants had to pay a larger share of the harvest to their lord, the local market
was heavily controlled and dominated by seignorial monopolies, and the election of local
officials was largely controlled by the lord (e.g., Ciscar, 1993, pp. 222-225). In a later section
of the paper, when discussing interpretations of the empirical results, we review additional
8Most immigrants were drawn from surrounding non-Morisco areas, though there are some reports of im-migration from outside of Valencia (Torres, 1969). Migrants are thought to have been drawn from Valencia’spoorer inhabitants, i.e., those willing to accept an exploitative institutional framework in exchange for landand capital (Ciscar, 1993, p. 189; Torres, 1969, p. 73).
9The Spanish Crown continued to protect Christians by prohibiting forced labor services in former-Morisco areas (Casey, 2008, p. 106), but subjected Christian settlers to the high taxes and broad institutionalframework established by nobles in former-Morisco areas.
9
qualitative and quantitative evidence on the persistence of extractive institutions and their
abolishment in the early 19th century.
2 Data Construction
2.1 Agricultural Output and Population Data
Historical data are available to proxy for the total value of agricultural output by district in
Valencia. The Archbishopric of Valencia was entitled to a fixed proportion of approximately
10% of all agricultural output in each administrative tithing district (or delmari) under its
jurisdiction.10 Rather than directly collect agricultural goods, the Archbishopric separately
auctioned the right to collect its share of output in each district over the subsequent four
years in exchange for upfront fixed cash payments.11 The Archbishopric of Valencia recorded
the value of each winning bid in each tithing district and time period.
Some important assumptions are necessary, however, for percent changes in district-level
tithe auction prices to be roughly equal to percent changes in the value of agricultural output.
First, we assume that there was no collusion amongst risk-neutral bidders who had accurate
expectations over the value of agricultural output.12 Second, we assume that there were
minimal changes in the cost of tithe collection. In practice, we need these assumptions to
hold conditional on the control variables included in the empirical specifications.
The Moriscos’ expulsion may have affected tithe auction prices through channels other
than decreased agricultural labor availability, though we expect many of these effects to
be concentrated in the immediate aftermath of the expulsion. Tithe valuations in former-
Morisco districts may have reflected higher risk in periods following the expulsion, which
would understate both output and output per capita. Nobles’ defaults on loans and the
temporary collapse of the Valencian central bank may have caused deviations from friction-
free asset pricing, though our first post-expulsion tithe data is drawn after the worst of the
post-expulsion financial crisis had passed. While the Spanish Crown was looking for ways
to compensate nobles after the expulsion, the tithes were managed independently by the
Church.
These tithe auction prices appear to be a reasonable proxy for the value of agricultural
output by district, particularly given the typical limitations on output data in the pre-
10The rate at which agricultural output was taxed by the Church appears to have remained constant overthe entire sample period (Ardit, 1987). Prior to our sample period, the Church had transferred a share of itscollection rights (usually a third of the tithe) in most areas to the King who in turn eventually transferredthese rights to the nobility. The Church’s share remained fixed over our sample period, however, and thecollection rights were priced and recorded separately by the Church.
11Each November, the Archbishopric announced which tithing districts were to be auctioned. On January6th and 7th of the following year, the collection right for each district was sold to the highest bidder.
12Winning bids were usually made by local merchants in that district, as locals were in the best positionto forecast the value of collection rights and to collect the taxes (Llibrer, 2011).
10
industrial era. We are grateful to Manuel Ardit for providing transcriptions of unpublished
district tithe data.13 Our data contribution has been to define the geographic area of each
tithing district, which allows us to assign each tithing district its pre-expulsion population of
Moriscos, its total population in particular years, and its local geographic characteristics.14
We assign each district its towns’ population in 1569, 1609, 1622, 1646, 1692, 1712, 1730,
1768, and 1786.15 For these periods in which population and output data are both available,
we calculate the average value of district tithes within a 10-year window.16
2.2 Morisco and Christian Districts
The main geographic unit of analysis is a tithing district, of which there are 98 in our main
sample.17 Some district borders changed over the analyzed time period, but the geographic
unit of analysis is held constant by summing tithe auction prices over sub-divided parcels
(Ardit, 1987).
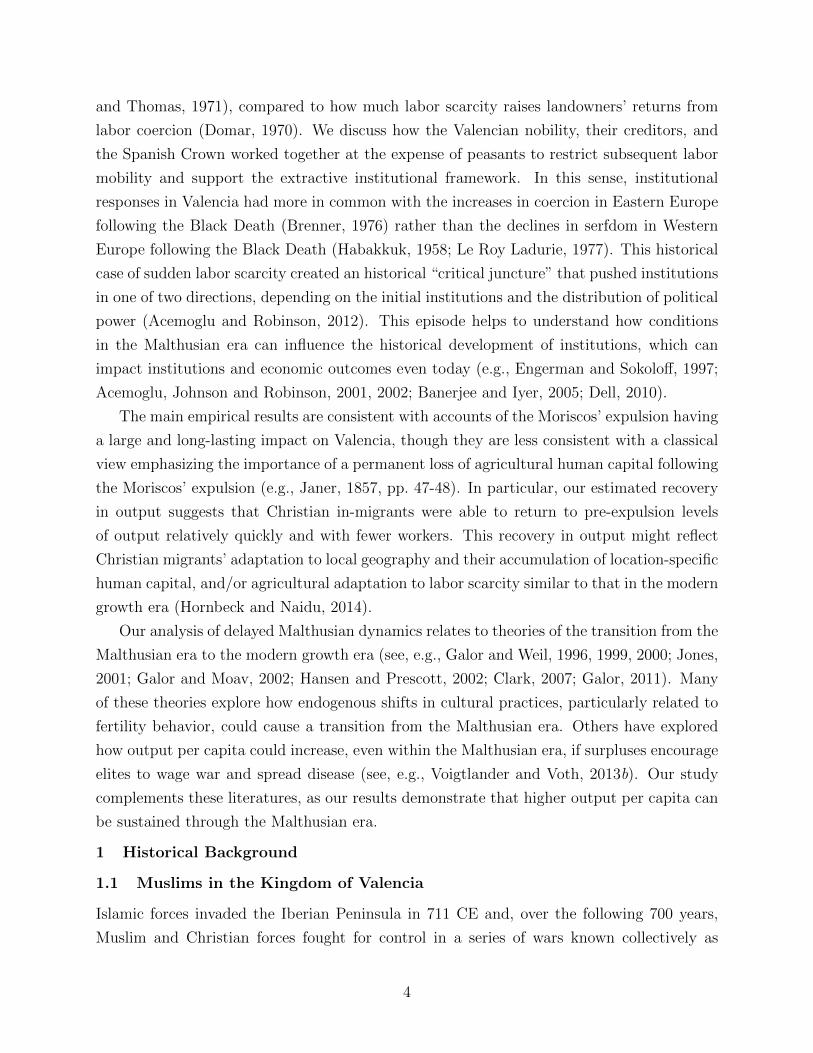
Figure 1 maps the tithing districts, shaded to reflect the Morisco population share in
1609 prior to the expulsion.18 The population is 0% Morisco in 31 districts (shaded white),
13These records have survived in a series of books known as the Llibres d’arrendaments dels delmaris del’arquebisbat de Valencia, which are now in the Archive of the Catedral de Valencia. The period from 1501to 1800 is covered in books 4388 to 4401, which have been used by Manuel Ardit in a series of publications(Ardit, 1987, 2009b). Casey (2008) also uses these data and provides some aggregate statistics for the entireArchbishopric of Valencia. We use the auction prices for the tithes known as “pa i vi,” which included all ofthe tithed crops in most areas (Ardit, 1987, p. 291).
14In doing this work, we are grateful for assistance from archivists at the Archive of the Catedral deValencia and from Manuel Ardit. We created a digitized map of Valencia’s historical tithing districts usingmanuscripts 4440 and 4441 from the Archive of the Catedral de Valencia, which list the population centersin each tithing district, and a 17th century map provided by Ardit that defines the municipal boundaries ofthe population centers. We then assigned town-level population data to tithing districts based on name andgeographic proximity, using the map provided by Ardit and information provided in Badenes and Bernat(1994). The matching procedure and data coverage are imperfect: some towns are missing in particularCensus years or may be assigned to the wrong district. Measurement error in population (or output) wouldbias the analysis of convergence rates, but the empirical analysis verifies the results’ robustness to a GMMapproach that would mitigate the bias from measurement error by using instrumental variables.
15Town-level population data are available from three sources. First, from a manuscript created between1565 and 1572, town populations in the Kingdom of Valencia were compiled by Chabas (1890). Second,Badenes and Bernat (1994) provide town-level population data from Censuses conducted throughout theKingdom of Valencia in 1609, 1646, 1692, 1712, 1730, 1768, and 1786. Third, for 1622, we use the populationdata provided in the ad limina visit organized by the Vatican (Carcel, 1988). Population data initially recordthe number of households and then record the number of individuals in 1768 and 1786; following standardpractice in this historical literature, households are assumed to contain 4.5 individuals.
16We assign the auction value in year t to years t + 1, t + 2, and t + 3. For each population census year,we then average tithe data over all periods from 5 years before to 4 years after. For 1609, we limit the tithedata to years before the Moriscos’ expulsion. Tithe data are available in most years, and no tithe data areavailable for 0.8% of the final district-year observations.
17Of the 102 tithing districts in the Archbishopric of Valencia, three districts (Rambla, Ressalany andRussafa) are omitted because we were unable to identify their geographic boundaries. In addition, we omitthe district Riu de Millars because it is non-contiguous.
18Mapped boundaries do not each reflect distinct tithing districts, as some districts contain non-contiguous
11
between 0% and 100% Morisco in 36 districts (shaded light gray), and 100% Morisco in 31
districts (shaded medium gray). In the second category, Morisco population shares are fairly
evenly distributed between 0% and 100% with a mean of 50%. The City of Valencia is in
the Northeast, in a cross-hashed non-tithing area, and the coastline is to the East.
Crucially, the 1609 population data includes the number of Christians and Moriscos
prior to the expulsion. Morisco communities had been largely segregated from Christian
communities, so it was not difficult to identify and expel the Morisco population. For the
few instances of mixed-religion households, the Crown allowed Morisco children under six
and their mothers to remain. Morisco fathers were expelled, regardless of the age of the
children, along with any older children (Dadson, 2009, p. 216).
2.3 Pre-expulsion Differences Between Morisco and Christian Districts
The main empirical analysis compares changes over time in Morisco and Christian districts,
but we begin by exploring cross-sectional differences between these districts prior to the
Moriscos’ expulsion. Table 1 reports estimates from regressing district-level outcomes in
1609 on districts’ Morisco population share in 1609. Column 2 reports that population,
output, and output per capita were substantially lower in Morisco districts in 1609.
Part of these observed differences can be attributed to observed geographic differences
between Morisco and Christian districts. Column 3 reports smaller estimated differences
when controlling for seven observed geographic characteristics of districts: distance to the
City of Valencia, distance to the coast, average terrain slope, latitude, longitude, average
rainfall, and agricultural suitability.19
Population was lower in Morisco districts, which could partly reflect the greater tax
burden on Moriscos, though the difference is statistically insignificant after controlling for
geographic characteristics. Lower measured output and output per capita in Morisco districts
may partly be a statistical artifact, reflecting the historical management of Church tithes.
In the years before Valencia’s Muslims were forced to convert to Christianity in 1525, they
did not pay tithes directly to the Church (Meyerson, 1991, p. 167). After their conversion
to Christianity, the Moriscos (former Muslims) began to pay tithes. It is possible, however,
that the Church’s share of these tithes was smaller in the Morisco areas than in Christian
areas because a larger share was assigned to the lord at the time of the Moriscos’ conversion
pieces.19Geographic distances are measured from a district’s centroid and distance to the coast is calculated
using the coastline of Valencia in the 17th century. Average slope within a tithing area is calculated fromGTOPO30 data on elevation (http://eros.usgs.gov/). Latitude and longitude are measured at a district’scentroid. Average rainfall and agricultural suitability are both drawn from the maps provided by the SpanishMinistry of Agriculture (available at http://sig.magrama.es/geoportal). There are two main rainfall valuesand two main agricultural suitability values in the sample region, so the regressions control for the fractionof each district with lower rainfall or lower agricultural suitability.
12
(Halperin, 2008, p. 131). If the Church’s share of the tithe was systematically lower in the
Morisco areas, this would cause systematically lower tithe auction values in Morisco areas.
The main empirical specifications focus on changes over time in former-Morisco and
former-Christian districts, including district fixed effects to absorb cross-sectional differ-
ences in geography or the Church’s tithe share. Further, as the impact of districts’ fixed
characteristics may change over time, the empirical analysis focuses on specifications that
control for these seven geographic characteristics interacted with each year.20
3 Post-expulsion Changes in Morisco and Christian Districts
3.1 Changes in Morisco and Christian Districts, 1609 to 1622
For an initial view of the raw data, Figure 2 plots the 1609 to 1622 change in district-
level outcomes against the district’s Morisco population share in 1609. Panel A shows that
population declined dramatically in districts with a large population share of Moriscos in
1609. Population also declined in entirely-Christian districts, reflecting migration to former-
Morisco districts. However, migration was insufficient to equalize the percent population
decline across districts.
While the Moriscos’ expulsion initially impacted most districts to some degree, the em-
pirical analysis focuses on estimating the relative impact on districts with a greater Morisco
population share in 1609. Rather than attempt to recover the aggregate impact of the expul-
sion, this comparison identifies relative impacts from a plausibly exogenous relative decline
in population.21
Figure 2, panel B, shows that output also declined relatively from 1609 to 1622 in districts
with a larger population share of Moriscos in 1609. Panel C shows that output per capita
generally increased relatively in districts that had a larger population share of Moriscos,
which is consistent with a declining population and fixed production factors.
Figure 3 plots the residual variation in districts’ outcome changes against districts’ resid-
ual Morisco population share in 1609, after controlling for districts’ seven observed geographic
characteristics. There is now more continuous variation in districts’ Morisco population
share, which predicts a fairly clear linear impact on relative changes in district outcomes
from 1609 to 1622. Conditional on districts’ geographic characteristics, districts with a
greater Morisco population share have a very large decline in population, a large decline in
output, and a moderate increase in output per capita.
20We have seen no indication that the Church permanently sold (or acquired) portions of tithe collectionrights in our sample period, from 1569 to 1786 (see also Ardit, 1987).
21Because non-Morisco districts were also affected through out-migration, we suspect that the aggregateeffects of the Moriscos’ expulsion are larger than our estimated relative changes in population, output, andoutput per capita.
13

Figure 4 plots the mean change from 1609 to 1622 for three groups of districts, and then
extends these changes through 1786.22 The three groups correspond to those in Figure 1:
31 districts with 0% Morisco population in 1609 (dotted line), 36 districts with between 0%
and 100% Morisco population in 1609 (dashed line), and 31 districts with 100% Morisco
population in 1609 (solid line). Population declines from 1609 to 1622 largely persisted
through the 17th century as total population remained similar, and average population in
each group increased similarly through the 18th century as total population increased (Panel
A). Output declines from 1609 to 1622 also persisted, but converged somewhat more over
time as total output increased through the 18th century (Panel B). By contrast, population
and output had been increasing from 1569 to 1609, and somewhat more so in districts with a
greater Morisco population share. Output per capita increased after the Moriscos’ expulsion
and remained higher in former-Morisco districts, and was largely unchanged through the
18th century in districts that had no Moriscos in 1609 (Panel C). The following empirical
analysis focuses on estimating relative changes by districts’ Morisco population share in 1609.
3.2 Estimated Relative Changes After the Expulsion
Preliminary empirical specifications estimate relative changes in districts with a greater
Morisco population share in 1609, controlling for districts’ geographic characteristics. Out-
come Y in district d and year t is regressed on the district’s Morisco population share in
1609, year fixed effects, district fixed effects, and districts’ geographic characteristics:
ln(Yd,t) = βtMoriscod + αt + αd + γtXd + εd,t. (1)
Note that β is allowed to vary by year, so each estimated β is interpreted as the average
difference between 100% Morisco districts and 0% Morisco districts in that year relative to
the omitted base year of 1609. Note also that γ is allowed to vary by year, so the impact of
districts’ geographic characteristics is allowed to change in each time period.
The main identification assumption is that districts with a greater Morisco population
share in 1609 would have changed similarly to other districts, if not for the Moriscos’ expul-
sion. In practice, this assumption must only hold after controlling for differential changes
associated with districts’ geographic characteristics. For example, an empirical concern is
that changes in agricultural prices might vary by district, perhaps due to changes in trans-
portation costs to Valencia or other markets. To the extent that changes in agricultural
prices are correlated with Morisco population share, the hope is that these changes are ab-
sorbed by controlling for distance to Valencia and distance to the coast (each interacted
with year). Similarly, while changes in agricultural technology may have differential impacts
22Outcome values are normalized to zero in 1609.
14
by district, the specifications control for districts’ terrain ruggedness, longitude, latitude,
average rainfall, and agricultural suitability (each interacted with year). For the statistical
inference in all specifications, standard errors are clustered at the district level to adjust for
heteroskedasticity and within-district correlation over time.
From estimating equation (1), Figure 5 (panel A) reports estimated changes in log pop-
ulation in a formerly 100% Morisco district relative to changes in a formerly 0% Morisco
district. The solid circles indicate the point estimates in each year, relative to the omitted
base year of 1609, and the vertical lines indicate 95% confidence intervals.
From 1609 to 1622, former-Morisco districts experienced an 85 log point or 57% relative
decline in population. Post-expulsion declines in population are statistically significant in
each time period. Population in former-Morisco districts had partially recovered by 1786,
though Morisco districts’ population had been increasing relatively from 1569 to 1609.
Figure 5, panel B, reports estimated relative changes in the log value of agricultural
tithes, as a proxy for the log value of agricultural output. From 1609 to 1622, output
declined relatively by 61 log points in former-Morisco districts. The relative decline in
output is similar through 1646, but then output recovers in former-Morisco districts even
though population remained lower. Output had been increasing relatively from 1569 to 1609
in Morisco districts, though at a somewhat lower rate than population.
Figure 5, panel C, reports estimated relative changes in the log value of tithes per capita.
From 1609 to 1622, this proxy for output per capita increased relatively by 25 log points in
former-Morisco districts. Output per capita remained higher and increased further over the
next 164 years. By contrast, there had been statistically insignificant declines in output per
capita in former-Morisco districts from 1569 to 1609.
Research on the Malthusian era sometimes focuses on estimating the elasticity of wages
with respect to population. There are substantial empirical challenges in estimating this
relationship, in the absence of a natural experiment, and estimates are generally “too large”
in the range of -1 to -2.7 (Lee and Anderson, 2002; Weir, 1991).23 The estimated increase
in output per capita from 1609 to 1622, as a fraction of the estimated decline in population,
implies an elasticity of -0.29 (and a standard error of 0.066). This elasticity is consistent
with a Cobb-Douglas production function with a land share of 0.29. Similarly, the estimated
decline in output from 1609 to 1622, as a fraction of the estimated decline in population,
implies a Cobb-Douglas production function with a land share of 0.28 (and a standard error
23This elasticity should correspond to the strength of decreasing returns in the production function (Leeand Anderson, 2002; Weir, 1991). For a Cobb-Douglas production function in which land is the only fixedfactor, the elasticity should equal the negative of the land share (which cannot be greater than 1). Theseestimates might be reconciled using a CES production function, but the required elasticity of substitutionbetween land and labor is generally below plausible values.
15
of 0.072).24 This land share is within the 0 to 0.40 range considered by Hayami and Ruttan
(1985) and would not reject the 0.19 value calculated by Caselli and Coleman II (2001).
Table 2 reports the estimated coefficients from Figure 5, along with the estimated stan-
dard errors. Table 2 also reports estimates when excluding the geographic controls. The
geographic controls capture some of the cross-sectional differences between Morisco and
Christian areas prior to the expulsion, and yet the results are not particularly sensitive to
the inclusion of these geographic controls.
Overall, following the Moriscos’ expulsion in 1609, these preliminary estimates indicate
that former-Morisco districts experienced relative declines in population and output and
a relative increase in output per capita. Population remained persistently lower, output
recovered more quickly, and there were sustained increases in output per capita.
There are some important limitations to this preliminary analysis, however. Malthusian
theory implies an explicit dynamic relationship in economic outcomes, where districts’ growth
rate depends on their initial outcome value. Because Morisco and Christian districts had
different economic outcomes prior to the expulsion, these districts might be expected to
experience differential growth after the expulsion. The later empirical analysis explicitly
models growth rates as a function of initial outcome values.
Based on this preliminary analysis, it is also difficult to quantify whether convergence
in former-Morisco districts was slower than might be expected. After the Black Death,
population responses were also slow and “far removed from the immediacy of the response
suggested by Malthus himself” (Hatcher, 1996, p. 76). It is difficult to quantify convergence
rates following the Black Death, in the absence of a clear counterfactual, but it is natural
to consider whether these preliminary results simply reflect slow rates of convergence in the
Malthusian era. The following empirical analysis estimates the rate of convergence in the
sample, and then reports estimated impacts on former-Morisco areas after adjusting for the
expected rate of convergence. Thus, the following analysis formalizes whether population
growth in former-Morisco districts was slower than would be expected given their lower levels
of population following the expulsion.
3.3 Estimated Convergence after the Expulsion
To better quantify economic dynamics in the aftermath of the Moriscos’ expulsion, we now
explicitly model districts as converging to steady-state outcome values (a la Barro and Sala-
i-Martin, 1992). For each district d, the annual growth rate in outcome Y from period t− τ
to period t will then depend on the difference between that district’s steady-state outcome
24While the estimated changes between 1609 and 1622 may reflect temporary disruption of productionafter the expulsion, these estimated ratios are similar to those using estimated changes between 1609 and1646.
16
value and that district’s outcome value in period t− τ . The district’s steady-state outcome
value is unobserved, but is allowed to vary by district with the inclusion of district fixed
effects (αd). Districts’ steady-state is also allowed to change over time with the inclusion
of year fixed effects (αt). Further, the changes in steady-state are allowed to vary with
districts’ geographic characteristics by including year-interacted controls for the previously-
used seven geographic characteristics (γtXd). Conditional on the above controls, we can then
directly estimate whether former-Morisco areas experienced differential growth by including
a district’s Morisco population share in 1609:
ln(Yd,t) − ln(Yd,t−τ )
τ= δln(Yd,t−τ ) + αd + αt + γtXd + βtMoriscod + εd,t (2)
Note that β is allowed to vary by year, so each estimated β is interpreted as the average
change after the expulsion in former-Morisco areas’ annual rate of growth between period t
and the prior period. We sometimes pool the estimated β’s, or constrain them to be equal
across periods, to report the average impact of the expulsion.25
There are some known challenges in estimating equations of this form (e.g., Caselli,
Esquivel and Lefort, 1996; Barro, 2012). First, growth regressions often include endogenous
variables as controls, though we restrict our attention to time-varying controls for districts’
fixed geographic characteristics. Second, estimates of δ are mechanically biased by the
inclusion of district fixed effects (Hurwicz, 1991), though this bias becomes small in datasets
over a long time horizon (Nickell, 1981; Barro, 2012). This bias is likely to be small in
our setting, for which it is relevant that the data span 217 years rather than include 9 time
periods. We report some estimates from specifications that omit district fixed effects, though
the resulting omitted variables bias will generally attenuate the estimated convergence rate
and bias the estimates.26
For dynamic panel settings such as this, Arellano and Bond (1991) develop a potential
solution to this second econometric concern. After differencing equation (2) over time to
eliminate the district fixed effect, the lagged dependent variable term [ln(Yd,t−τ )−ln(Yd,t−2τ )]
is mechanically correlated with the error term [εd,t − εd,t−τ ] because εd,t−τ is a component
of ln(Yd,t−τ ). However, in the absence of serial correlation in εd,t (or second-order serial
correlation in εd,t − εd,t−τ ), ln(Yd,t−2τ ) is a valid instrument for [ln(Yd,t−τ ) − ln(Yd,t−2τ )]
25In theory, the estimated δ is predicted to vary non-linearly with the time between periods (τ). In practice,estimating equation (2) using non-linear least squares introduces undesirable properties from including fixedeffects and many controls. This is only an issue when the time between periods varies over the sample period;as the predicted δ would only vary slightly with the differences in sample periods, we do not allow δ to varywith τ .
26Districts with higher outcome values may have higher unobserved steady-states, so those districts maynot grow much slower than districts with lower outcome values.
17
(Anderson and Hsiao, 1982). A more efficient GMM estimator makes additional use of all
further lagged values as instruments, which also permits tests for overidentifying restrictions
and for serial correlation in εd,t (Arellano and Bond, 1991).
This GMM estimator would also mitigate bias arising from classical measurement error
in the lagged dependent variable. Measurement error could also be non-classical, such as if
there were persistent differences across districts between the measured tithe auction prices
and unmeasured output. Fixed percentage differences in measurement would be absorbed
by district fixed effects, and the hope is that any varying differences in measurement (that
are correlated with Morisco population shares in 1609) would be absorbed by the inclusion
of year-interacted geographic controls.
Given that our empirical focus is on dynamic responses to the Moriscos’ expulsion, rather
than estimating convergence rates, we can also assume a value of δ and verify the robustness
of βt. Previous research has also struggled to estimate convergence rates (δ), however, so a
secondary contribution of our paper is to provide new estimates of Malthusian convergence
rates using our data and preferred econometric specifications.27
Table 3, column 1, reports estimated impacts on population from our preferred econo-
metric specification. The estimated impact of lagged population (δ), which is reported in
the first row, implies that population convergence is generally fast in the sample region and
has a half-life of 21 years (ln(2)/0.033). Districts with 1% lower population, all else equal,
are predicted to experience a 0.033 percentage point faster annual growth rate of population.
This control variable captures the sense in which former-Morisco districts would be expected
to experience faster population growth because their population had declined below their
district steady-state, such that the subsequent rows report whether former-Morisco areas
grew differently than expected. Districts’ expected growth rates are also allowed to vary
over time, using the former-Christian areas as a comparison group, and in a manner that
varies with districts’ geographic characteristics.
Population growth was substantially lower in former-Morisco areas from 1609 to 1622
(Table 3, column 1, row 2), which reflects the immediate decline in population following the
Moriscos’ expulsion. The annual population growth rate remained 2.5 to 1 percentage points
lower than expected in former-Morisco districts from 1622 through 1786 (Table 3, column
1, rows 3 – 8). That is, while former-Morisco areas would be expected to grow faster after
a large decline in population, the rate of population growth was slower than expected in all
periods through 1786.
27Our estimated rates of convergence would not only reflect the typical Malthusian channels of fertility andmortality to the extent that labor was mobile across districts, though our sense from the historical literatureis that cross-district labor mobility was fairly restricted in periods other than the immediate aftermath ofthe Moriscos’ expulsion.
18

Pooling the six estimated coefficients from 1646 through 1786, the bottom of column 1
reports that the annual growth rate was roughly 1.7 percentage points lower on average.28
This estimate implies that steady-state population would be 40% lower in former-Morisco
areas, which roughly coincides with estimates from Table 2.29 An F-test rejects the equality
of the individual coefficients from this period, however, as the coefficients are estimated
to increase by roughly 1 percentage point over 100 years.30 Still, population growth rates
remain below expectation in former-Morisco districts in each observed period.
Column 2 reports estimates when omitting district fixed effects. The estimated conver-
gence rate is substantially lower, consistent with the anticipated omitted variables bias, and
the estimated half-life increases to 154 years (row 1). Population growth remains below
expectation after the expulsion, though the coefficients are no longer statistically significant
in each period (rows 3 – 8). The annual population growth rate is lower by a statistically
significant 0.8 percentage points from 1622 through 1786, on average, and an F-test does not
reject the equality of the year-specific coefficients.
Columns 3 and 4 report the results when estimating equation (2) using GMM (Arellano
and Bond, 1991). Column 3 reports similar estimates as column 1, though there are in-
dications of second-order serial correlation that would violate the exclusion restriction for
some of the instrumental variables. As an adjustment, Column 4 reports estimates when
restricting the instruments to be third-order (or greater) lagged values of population. There
is no indication of third-order serial correlation, but the lagged impact of population is im-
precisely estimated and has the “wrong sign.” Despite there being no estimated expectation
of convergence, population growth still remains lower than expected in former-Morisco dis-
tricts through 1786. The individual estimates are mostly not statistically significant, but the
pooled estimate is more precise and statistically significant and we do not reject the equality
of the estimated coefficients.
Column 5 reports estimates when constraining the impact of lagged population to be
-0.01 (row 1), which reflects a convergence half-life of roughly 70 years. This parameter
value reflects a typical estimate of population convergence rates in the Malthusian era (Lee,
1973, 1987, 1993; Lee and Anderson, 2002), with other values ranging between -0.0065 and
-0.0136. When constraining the half-life of convergence to be roughly 70 years, the former-
Morisco areas have depressed population growth rates between 1622 and 1786. The estimated
28The pooled effect is found by estimating equation (2), replacing the year-specific Morisco variables withan interaction between districts’ Morisco share and an indicator variable for the 1646 – 1786 period.
29Setting the growth rates equal to zero in both former-Morisco and former-Christian areas, the log ratioof these districts’ steady-state population is equal to -β / δ.
30The 100 year trend is found by estimating equation (2), replacing the year-specific Morisco variableswith an average effect (as in the previous footnote) and a trend effect (in units of 100 years).
19
magnitudes are between those in columns 1 and 2, and closer to the estimates in column 2.
Table 4, column 1, reports estimated impacts on output from our preferred specification,
where district output is proxied by the recorded value of Church tithe auctions. In general,
output is estimated to converge with a half-life of roughly 32 years. The annual growth rate
of output is substantially lower in Morisco areas from 1609 to 1622, which reflects the initial
impact of the Moriscos’ expulsion. Output continues to grow at a lower rate than expected
for some time, though former-Morisco areas are mostly converging along the expected growth
path through the 18th century. There is a positive trend in these coefficients, for periods
from 1646 to 1786, that is of the same magnitude as the positive trend in the population
coefficients from column 1 of Table 3.
Columns 2 through 4 report estimates from alternative empirical specifications, which
generally continue to show slowed initial output growth and convergence in later periods.
Column 2 reports estimates when omitting district fixed effects, which increases the estimated
half-life of convergence to 578 years and is likely to reflect omitted variables that influence
districts’ steady-state output.31 Column 3 reports results when estimating equation (2) using
GMM and there is no indication of second-order serial correlation that might invalidate the
instrumental variables used. Column 4 reports estimates when constraining the convergence
rate for output, as in Table 3.
The estimated declines in output are generally smaller in magnitude than the estimated
declines in population, comparing the estimates in column 1 of Tables 3 and 4. Column 5
reports the difference in these coefficients, and their standard error, from estimating both
regressions in a seemingly unrelated regression framework. Output recovers faster than
population in each period, relative to the expected convergence in output and population.
Table 5 reports results from directly estimating changes in output per capita, which is
a more restricted specification than comparing the separately-estimated impacts on output
and population. Column 1 reports that output per capita grew substantially in former-
Morisco areas immediately following the Moriscos’ expulsion. The estimated impact of lagged
output per capita implies that areas experiencing higher output per capita should converge to
steady-state fairly quickly, yet former-Morisco areas experienced lower convergence (or higher
growth) than expected through 1786. Column 2 omits district fixed effects, which reduces
the estimated convergence rate and the persistence of higher output per capita growth in
former-Morisco areas. Column 3 constrains the convergence rate, which also reduces the
estimated magnitudes in later periods.32 Pooling the estimates from 1646 through 1786, in
31With substantial variation in districts’ steady-state output, there will generally appear to be slow con-vergence when low-output districts do not grow faster than high-output districts.
32If we assumed a faster convergence rate, such as the 2% rate of convergence often estimated in themodern era, the persistent impacts on output per capita would be larger.
20
columns 2 or 3, the continued growth in output per capita is marginally statistically greater
in former-Morisco areas.
Columns 4 and 5 report similar estimates to column 1, based on GMM estimates of
equation (2). Column 4 reports estimates using all further lagged values of output per
capita as instruments for the lagged value of output per capita (Arellano and Bond, 1991),
though the Hansen J test marginally indicates potential bias from some of the included
instruments. Column 5 restricts the included instruments to have the same impact in each
sample year, which yields very similar results and less indication of bias.
Overall, these dynamic panel regressions indicate the Moriscos’ expulsion had large initial
impacts that were often persistent. Population declined greatly in former-Morisco areas and,
in contrast to the average fast convergence rate, population growth in former-Morisco areas
remained slower than expected through 1786. Output also declined in former-Morisco areas,
though output more quickly grew along the expected growth path. Comparing the estimated
impacts on population growth and output growth, or directly estimating impacts on growth
of output per capita, output per capita increased immediately after the Moriscos’ expulsion
and continued to increase more than expected (or converge slower than expected) through
1786.
4 Historical Interpretations
The empirical results indicate that the Moriscos’ expulsion had long-lasting impacts on
former-Morisco areas. The estimated decline in population is persistent in former-Morisco
areas, conditional on the estimated convergence rate for population generally in the sample
region. In the Malthusian era, a decline in population and a corresponding increase in
output per capita are typically associated with convergence in population through migration,
increased fertility, and decreased mortality, leading to convergence in output per capita. By
contrast, following the Moriscos’ expulsion, there were sustained increases in per capita
output in former-Morisco areas. Below, we discuss some potential explanations for this
estimated persistence.
4.1 Persistence of Extractive Institutions
One contributing factor may have been a persistence of extractive institutions in former-
Morisco areas, which may have slowed population convergence by limiting labor income.
While output per capita was higher in former-Morisco districts, the imposition of high tax
rates on Christians in these areas would discourage further migration and demographic
responses through fertility and mortality. Casey (2008, p. 24) notes that birth rates remained
low in former-Morisco areas, despite a relatively high land-to-labor ratio after the expulsion.
The population in these areas also may have suffered “nutritional deficiencies,” perhaps
21
increasing mortality rates. Casey (2008, pp. 24, 44) attributes these phenomena, in part, to
“the low level of economic development” due to the “harshness of the new [post-expulsion]
seigneurial rent terms.”
We do not have direct evidence that extractive institutions delayed population conver-
gence through these Malthusian channels, but we have brought together some historical
accounts and new data that suggest there was indeed a persistence of extractive institutions
in former-Morisco areas. We discuss this institutional persistence at some length, as it is also
of independent interest that extractive institutions persisted in former-Morisco areas despite
increased labor scarcity following the Moriscos’ expulsion. This historical episode provides
an interesting example in which labor scarcity created an historical “critical juncture” (Ace-
moglu and Robinson, 2012), after which institutions remained extractive due to heightened
financial incentives and elites’ ability to restrict workers’ outside options (Acemoglu and
Wolitzky, 2011). We discuss some qualitative and quantitative indications that, for 200
years after the Moriscos’ expulsion, Christians faced very different institutional regimes de-
pending on whether their areas were settled earlier by Moriscos.
The Peasant Revolt of 1693. There was a Christian peasant uprising in 1693, which
appears to have been in response to the continued harshness of extractive institutions in
former-Morisco areas. There were reports in 1689 that some peasants in former-Morisco
areas had begun to “conspire to not pay the dues that they had always paid to their lord”
(ACA, CA, leg. 579, 53/2), and formal legal proceedings were initiated to evaluate peasants’
claims that peasants’ historical privileges had rendered illegal the extractive institutions
imposed after the expulsion of the Moriscos. The peasants’ claims were rejected in February
1693, and the extractive institutions were upheld, on the grounds that King Philip III had
allowed the nobility to impose high taxes in former-Morisco areas in exchange for assuming
the Moriscos’ debts.33 The peasants appealed the case to the King, though the case was
referred back to a tribunal in Valencia that was likely to rule against the peasants (Garcıa
Martınez, S., 1991, p. 268).
On July 9 of 1693, a peasant revolt began with the arrest of four peasants who refused to
33The document providing the legal decision states that the areas of Valencia “newly populated after theexpulsion of the Moriscos wished to become free of the many charges and taxes that they pay their lords”(ACA, CA, leg. 579, 53/3). It continues by summarizing the five legal arguments made by the peasants’appointed legal representatives, and provides a detailed refutation of each argument. The peasants’ generalargument is that when King Philip III ceded the Moriscos’ belongings to the nobles, this was done on thecondition that the nobles charge taxes comparable to those in former-Christian areas. The council rejectedthis claim, as King Philip III had also obliged the nobles to assume the Moriscos debts and in exchange “thenobles legitimately established the [harsh] conditions of repopulation with the agreement of the new vassals.”Furthermore, the council noted that had Philip III not allowed the nobility to impose higher extraction ratesfollowing the expulsion “the King would have not given the nobles anything, rather he would have onlyloaded them with the community and individual debts of the Moriscos.”
22
supply their noble’s share of the crops. The revolt spread to include between four thousand
and six thousand peasants, culminating in a battle on the 15th of July in which the peasants
were defeated (Garcıa Martınez, S., 1991, pp. 270-272). A list of the names and homes
of thirty-six leaders of this revolt (ACA, CA, leg. 579, 50/2) provides some quantitative
evidence that the extractive institutions were relatively harsh in former-Morisco areas: all
of the revolt leaders are recorded as being from former-Morisco areas.34 Given this stark
relationship in the data, an actual regression analysis is unnecessary.
Spanish War of Succession, 1700 – 1714. Peasant discontent continued in former-Morisco
areas after the suppression of the revolt. During the Spanish war of succession, peasants
from former-Morisco areas supported the Austrian archduke’s claim to the Spanish throne.
Supporters of the archduke sent one of the 1693 rebellion leaders to gain peasant support in
Valencia, promising freedom from oppressive taxes (Kamen, 2001, p. 45). The archduke lost
the war, however, and the extractive institutional framework remained in place.
Additional testimony from the 17th and 18th centuries suggest that the former-Morisco
areas retained a relatively harsh institutional framework. One historian sums up this evidence
by noting that peasants in former-Morisco areas who were “[u]nable to pay the high rents
introduced after the expulsion,” sometimes became “recruits for the bandit gangs which were
so active in the kingdom” (Casey, 2008, p. 101). An observer in the early 18th century noted
that the nobles in Valencia “enjoy such exorbitant taxes and dues from many of their vassals
that they turn them from free men into slaves, or else into desperadoes, who take to robbing
on the highways and stirring up trouble rather than work in the fields” (cited in Casey, 2008,
p. 114). Another contemporary in the 18th century noted that inhabitants of former-Morisco
areas “are loaded with seignorial tributes and appear to only work to fill the coffers of their
lords” (Cavanilles, 1958, p. 202).
Institutional Control in 1786. As a proxy for the geographic distribution of extractive
institutions, we have obtained data on whether particular areas were under the control of
a secular noble in 1786.35 The institutional framework in Valencia is thought to have been
harsher (on average) in areas controlled by the nobility (Halperin, 2008, p. 59), though we
do not have direct data on the persistence of extractive institutions themselves.
The Census of Floridablanca indicates whether particular towns were under the juris-
diction of a secular noble (“senorıo secular”) (Instituto Nacional de Estadıstica, 1991). We
merge these data to our geographic tithing districts, and assign each district the fraction of
34After merging this list with districts’ Morisco population share in 1609, all of the merged leaders arefrom districts with a large population share of Moriscos.
35Here we assume that the Census of Floridablanca measured institutions the same year it measuredpopulation.
23
towns under the control of nobles.36
Districts with a higher Morisco population share in 1609 are substantially more likely
to be under noble control in 1786. The estimated percentage of towns under noble control
in 1786 rises from 56% in former-Christian districts to 98% in former-Morisco districts, and
this difference is highly statistically significant with a standard error of 8%.37 This result
suggests that the institutional framework continued to be harsher in former-Morisco areas
following the expulsion.38 It is important to note here, however, that historians have generally
posited a two-tiered seignorial regime in Valencia. In contrast to the extractive framework
suffered in former-Morisco areas, noble areas that had been inhabited by Christians prior
to the expulsion are thought to have had a more benign institutional framework that was
closer to that prevailing on royal lands (Ciscar, 1993, pp. 185-186 ).39 Thus, we expect
that the difference in the fraction of lands under noble control is an understatement of the
institutional differences between former-Christian and former-Morisco areas.
Abolition of Extractive Institutions, 1808 – 1813. Popular opposition to this institutional
framework appears to have intensified in the late 18th century, though Napoleon’s invasion
of Spain in 1808 marked the beginning of the end of the Spanish Ancien Regime. In 1808,
Napoleon declared the abolition of the Spanish seignorial regime (De Moxo, 1965, p. 16).
The independent Spanish government made a similar pronouncement in 1811. In 1811, one
Valencian representative cited the Moriscos’ expulsion as when “all the evils that Valencia
suffers today began” (Ardit, 1977, p. 181) and noted in 1813 that those who repopulated
the formerly Morisco areas “substituted the expelled in their slavery” and sarcastically asked
whether “after receiving illegal and exorbitant tributes for over two centuries have the nobility
finally been compensated for the losses that they claimed [following the expulsion]?” (De
36The Census of Floridablanca provides the modern-day municipality for each population cen-ter, as of 1990. We reconstructed these municipal boundaries using the 2012 boundaries(http://www.arcgis.com/home/item.html?id=2e47bb12686d4b4b9d4c179c75d4eb78) and information onmunicipal splits from the Spanish Institute of Statistics (http://www.ine.es/intercensal/?L=0). We assigneda town center to a tithing district if the centroid of its modern municipality falls within the boundary ofthat tithing district. One tithing district (Canet de Berenguer) has no 1786 data within its boundaries, andso that district is dropped from the sample.
37These estimates are from regressing the fraction of towns under noble control on the district’s Moriscopopulation share in 1609. The estimated constant is 0.561 and the estimated impact of Morisco populationshare is 0.414 with a robust standard error of 0.078. Controlling for districts’ geographic characteristics, theestimated difference is 0.379 with a robust standard error of 0.086.
38We have also experimented with including ecclesiastical lordships and areas controlled by military ordersin our definition of lands controlled by the nobility, such that the omitted group is land controlled by theCrown. In this case, the estimated constant is 0.82 and the estimated impact of Morisco population share is0.17 with a robust standard error of 0.049. Controlling for districts’ geographic characteristics, the estimateddifference is 0.14 with a robust standard error of 0.050.
39While a substantial fraction of towns continued to be under the control of secular nobles in former-Christian districts, the nobility was substantially restricted in their ability to extract resources in areaspopulated by Christians following the reconquest.
24

Moxo, 1965, pp. 206-207).
Notably, the application of the 1811 declaration was delayed in Valencia until the final
evacuation of French troops in 1813. French forces appear to have found the existing seigno-
rial regime useful to fund military actions and to ensure support from Valencia’s nobility
(Ardit, 1977, pp. 157-158, 202, 204-205).
The final dismantling of Valencia’s seignorial regime stretched over the following decades.
During this period, the former-Morisco areas of Valencia experienced some of the “greatest
conflict” in Spain, including “violent confrontations” between nobles and their vassals (Ar-
tola, 1978, pp. 172-173). As the differential treatment of former-Morisco areas was removed,
observers decried the impoverished state of inhabitants in former-Morisco areas (Ardit, 1968,
p. 37). The extractive institutional framework in former-Morisco areas may have had long-
term effects even after its final dissolution, contributing to the delay in Valencian industri-
alization (Garcıa, 1974).
4.2 Cultural and Demographic Differences between Moriscos and Christians
Extractive institutions in former-Morisco areas are only one potential factor, however, which
might have contributed to the sustained decreases in population and increases in output per
capita in former-Morisco areas. This institutional interpretation stresses that high tax rates
discouraged in-migration of Christians and prevented high output per capita from trans-
lating into high consumption per capita and impacting mortality and birth rates. If the
institutional framework remained roughly constant before and after the expulsion, however,
then it is difficult to understand why steady-state population should remain significantly
lower in former-Morisco areas in the absence of other factors.40 One potential explanation
is that some authors, most prominently Ciscar (1977, 1993), have argued that the institu-
tional framework eventually imposed even higher monetary costs on Christians than on the
Moriscos. The historical evidence is less clear on how the degree of extraction changed in
Morisco areas following the expulsion, however, as compared to the general persistence of
extractive institutions in some form.
Another potential interpretation stresses the importance of systematic differences in the
demographic equilibrium across Morisco and non-Morisco areas prior to the expulsion. Some
contemporaries believed there were systematic differences between Moriscos and Christians
that, all else equal, would lead to higher population density in Morisco areas. Drawing on
the previous historical background, it seems plausible that the Morisco population retained
40Note also, that the imposition of more-extractive institutions on Moriscos should have depressed popula-tion density and raised per capita output in former-Morisco areas prior to the expulsion. As we note above,though, it is difficult to use cross-sectional variation to test these predictions prior to the expulsion due toconfounding geographic factors and potential differences in the Church’s share of the tithe across districts.
25
distinctive practices after its forced conversion to Christianity. Relevant differences could
include different preferences for child quality vs. child quantity (Galor and Moav, 2002), dif-
ferences in fertility or mortality (Galor and Weil, 1996; Voigtlander and Voth, 2009, 2013b,a),
or differences in subsistence consumption levels (Abdus and Rangazas, 2011).
For example, contemporaries claimed that the age of marriage of Morisco girls was much
lower than among Christians (e.g., Casey, 1971, p. 30). To the extent that this claim is true,
it would generally be associated with higher lifetime fertility in the Morisco population.41
In another example, contemporary observers stressed that Morisco populations survived
on less than their Christian counterparts.42 Indeed, in the decades prior to the Moriscos’
expulsion, observers claimed that the Morisco populations were growing at a faster rate
than Christian populations and routinely attributed this differential growth to the fact that
Moriscos consumed less than their Christian counterparts.43
Overall, a shift in cultural and demographic characteristics may have resulted in a change
in the Malthusian equilibrium following the Moriscos’ expulsion, contributing to the persis-
tent decrease in population and increase in per capita output. Some caution is required
in interpreting these historical accounts, however, as Casey (1971, p. 30) argues that con-
temporary testimony regarding demographic and cultural differences between Moriscos and
Christians was generally provided by Christian writers whose views were often biased. Fur-
ther, an interpretation based only on shifting cultural and demographic characteristics is less
consistent with poverty-induced impacts on mortality and fertility that have been associated
with former-Morisco areas (e.g. Casey, 2008, p. 24). We expect that some combination of
many of these factors contributed to the persistent decrease in population and increase in
per capita output.
4.3 Technological Adaptation
In contrast to the estimated persistent declines in population, output recovered more quickly
in former-Morisco areas. Initial increases in output per capita should, in principle, have been
sufficient to encourage population convergence, but it is interesting to consider what factors
might have driven the comparatively faster convergence in output.
One potential explanation is that Christian migrants reacquired location-specific human
capital that had been lost with the expulsion of the Moriscos, or otherwise adapted to
41It is worth noting, however, that more recent analysis of archival data has shown a similar female ageat marriage in Christian and Morisco communities (Casey, 2008, p. 18).
42One seigniorial agent noted that prior to the expulsion Moriscos could subsist on less than 1/7th theland needed by the Christian resettlers (Casey, 2008, p. 43). Another ecclesiastical official noted in 1582that Christians needed twice what Moriscos needed to subsist (Ardit, 2009a, p. 67).
43One characteristic quote comes from a bishop in 1587 who claimed that “in a very few years [the Moriscos]will multiply in such away that they will surpass [the Christians because the Moriscos] collect everythingand do not spend since they neither eat, nor drink, nor wear clothes or shoes” (Ardit, 2009a, p. 68).
26
agricultural production in former-Morisco areas. The empirical results are not sensitive to
controlling for geographic characteristics, interacted with time, which suggests a limited
direct role for geographic differences between former-Morisco and former-Christian areas.
Christian migrants might have overcome temporary challenges, however, in adapting to
geographically different former-Morisco areas.
Indeed, there are some indications that Moriscos and Christians had differential economic
performance in geographically different areas. Prior to the expulsion, population and output
are more sensitive to rainfall and agricultural suitability in Morisco districts: in districts
with a greater Morisco population share, population and output increase by more in districts
with higher rainfall and agricultural suitability. Moriscos may have taken better advantage
of better geographic conditions or, equivalently, were more negatively impacted by worse
geographic conditions.44 If Christians learned over time to exploit better geography, and
continued to be hurt less by worse geography, that would contribute to higher output over
time.
Former-Morisco and former-Christian areas had similar fractions of lands with higher
rainfall and higher agricultural suitability, however, so Christian migrants may not have
been entirely unfamiliar with former-Morisco lands.45 Instead, the estimated interaction
effects could reflect unobserved land quality in former-Morisco districts varying more with
our measured geographic characteristics. Unobserved differences in land quality would be
absorbed by district fixed effects in the main analysis, but could confound the estimation of
these cross-sectional differences in the pre-expulsion period.
Another potential explanation for the recovery in output is that persistent labor scarcity
encouraged labor-saving agricultural adaptation. Labor-saving technological adaptation is
not typically associated with the Malthusian era because population itself responds to labor
scarcity. If this population response is slow, however, then there remains substantial incentive
for labor-saving technological adaptation in the Malthusian era. Adaptation to labor scarcity
in the Malthusian era may then not be entirely distinct from adaptation in the modern
growth era (Habakkuk, 1962; Allen, 2009; Acemoglu, 2010), with particular parallels between
the Spanish Moriscos’ expulsion and the decrease in black population following the 1927
Mississippi flood (Hornbeck and Naidu, 2014).
Systematic district-level data are unavailable for a formal analysis of production adjust-
44In particular, from a regression interacting the Morisco population share with rainfall or agriculturalsuitability, there is generally a more positive impact of better geography in districts with more Moriscos.We include only rainfall or agricultural suitability, as the two measures of geographic productivity are highlycorrelated and the estimates are unstable when both are included.
45From a regression of districts’ Morisco population share in 1609 on districts’ geographic characteristics,rainfall and agricultural suitability do not substantively or statistically predict Morisco population share.
27
ments in former-Morisco areas relative to former-Christian areas, though some historical
accounts are consistent with labor-saving production adjustments. Ardit (2009b,a) describes
former-Morisco areas shifting from the cultivation of cereals to the production of cash crops
in the century following the expulsion.46 These areas also experienced a shift in the distri-
bution and management of agrarian property toward larger farm sizes, which is generally
associated with decreased labor intensity.
Labor-saving technological adaptation could simply have taken the form of recovering
capital stocks, though the Moriscos’ expulsion does not appear to have substantially de-
creased capital stocks below steady-state levels. While Moriscos were able to take whatever
goods they could carry, the rest of the capital stock remained in former-Morisco areas. In
areas with substantially lower population after the expulsion, there may even have been
too much capital relative to the optimal long-run steady-state. Shortly after the expulsion,
capital stocks appear to have been allowed to depreciate in former-Morisco areas. By the
1640’s, a seignorial administrator attempted to incentivize the upkeep of physical structures
that were in “ruin and a terrible state” (Ciscar, 1975, p. 159).
5 Conclusion
Depictions of the Malthusian era generally focus on the long-run constancy of output per
capita, as population growth dissipates increases in output per capita from technological
advance or population decline. Empirical analysis of the Malthusian era is generally con-
strained, however, by data limitations and the absence of natural experiments. Most large
population shocks, such as the Black Death, affected broad regions and it is difficult to
identify impacts over subsequent decades and centuries.
The Moriscos’ expulsion offers a uniquely-detailed empirical view of population and out-
put dynamics in the Malthusian era, combining district-level data with a large population
shock that is geographically differentiated. The empirical analysis compares districts with
a greater Morisco population share to a plausible historical counterfactual, represented by
districts with a smaller initial Morisco population share. Further, the analysis is able to
control for other changes that might differ with local geographic characteristics. We first
consider relative changes in population, output, and output per capita, and then explicitly
estimate convergence rates and impacts of the expulsion on the growth rate of each outcome.
After the Moriscos’ expulsion in 1609, districts with a greater Morisco population share
experienced a substantial relative decline in population. Population convergence was gen-
erally fast in the sample region, but population convergence was delayed through 1786 in
former-Morisco districts. Output declined in former-Morisco areas after the expulsion, but
46In particular, one former-Morisco area shifted 50% of irrigated land from cereals to mulberry trees, whoseleaves were used to feed silk worms.
28
converged more quickly than population. Output per capita increased immediately after the
expulsion, and remained higher through 1786. While increases in output per capita typically
resulted in convergence across the sample region, there were sustained higher rates of growth
in output per capita in former-Morisco districts.
Our empirical analysis focuses on the relative effects of the Moriscos’ expulsion, compar-
ing former-Morisco and former-Christian areas. The aggregate effects of the expulsion would
differ if there were spillover effects from the expulsion on former-Christian areas, and we
expect that labor outflows from former-Christian areas would decrease those areas’ output
such that aggregate economic losses were greater than the relative losses in former-Morisco
areas. Indeed, one line of the historical literature considers the Moriscos’ expulsion to have
contributed to the economic decline of Spain in the 17th century (Hamilton, 1938).
The Moriscos’ expulsion generated substantial and persistent labor scarcity in former-
Morisco districts, and it is also interesting to consider how this affected the evolution of
extractive institutions. Labor scarcity might have encouraged the relaxation of extractive
institutions, but these extractive institutions were perpetuated due to the coordinated fi-
nancial incentives of powerful elites. Nobles and their creditors were heavily dependent on
revenue streams from Morisco peasants, and the Moriscos’ expulsion threatened to collapse
the socio-economic system. The King helped to coordinate a settlement that maintained
high rates of extraction in former-Morisco areas, rather than risk radical social changes
along with the widespread confiscation of nobles’ landholdings. Extractive institutions were
supported by restrictions on worker mobility and accumulated debt obligations, and only
collapsed with Napoleon’s invasion of Spain. These institutional responses illustrate how la-
bor scarcity might empower workers, but how labor scarcity encourages elites to coordinate
and strengthen efforts to coerce workers. Previous research has demonstrated that histori-
cal institutions impact modern economic growth, and this historical episode provides some
insights into how historical institutions might persist and evolve.
In a Malthusian era perhaps best known for long-run convergence in population and
output per capita, the Moriscos’ expulsion had long-lasting impacts on population and output
per capita. There are some fundamental limitations in our ability to identify which factors are
driving this persistence, though we discuss several potential contributing factors related to
local extractive institutions, cultural differences, and technological adaptation. This historic
episode does provide an unusually rich empirical setting to examine Malthusian dynamics,
however, highlighting that there can be sustained differences in per capita output in the
Malthusian era.
Eric Chaney, Harvard University
Richard Hornbeck, Harvard University
29
References
Abdus, Salam, and Peter Rangazas. 2011. “Adult nutrition and growth.” Review ofEconomic Dynamics, 14: 636–649.
Acemoglu, D. 2010. “When Does Labor Scarcity Encourage Innovation?” Journal of Po-litical Economy, 118(6): 1037–1078.
Acemoglu, D., and A. Wolitzky. 2011. “The Economics of Labor Coercion.” Economet-rica, 79(2): 555–600.
Acemoglu, D., and J. A. Robinson. 2012. Why Nations Fail. Crown.
Acemoglu, D., S. Johnson, and J. A. Robinson. 2001. “The Colonial Origins ofComparative Development: An Empirical Investigation.” American Economic Review,91(5): 1369–1401.
Acemoglu, D., S. Johnson, and J. A. Robinson. 2002. “Reversal of Fortune: Geographyand Institutions in the Making of the Modern World Income Distribution.” QuarterlyJournal of Economics, 117(4): 1231–1294.
Allen, R.C. 2009. The British Industrial Revolution in Global Perspective. Cambridge Press.
Anderson, T.W., and Cheng Hsiao. 1982. “Formulation and Estimation of DynamicModels Using Panel Data.” Journal of Econometrics, 18(1): 47–82.
Ardit, M. 1968. Els Valencians de les Corts de Cadis. Rafael Dalmau.
Ardit, M. 1977. Revolucion liberal y revuelta campesina. Ariel.
Ardit, M. 1987. “Expulsio dels Moriscos i Creixement Agrari al Paıs Valencia.” Afers,5/6: 273–316.
Ardit, M. 2009a. “The Expulsion of the Moriscos from the Catalan Countries: Ideologyand History.” Catalan Historical Review, 2: 65–81.
Ardit, M. 2009b. “Una Reflexion sobre la Expulsion de los Moriscos Valencianos y laRepoblacion.” Revista de Historia Moderna, 27: 295–316.
Arellano, Manuel, and Stephen Bond. 1991. “Some Tests of Specification for PanelData: Monte Carlo Evidence and an Application to Employment Equations.” Review ofEconomic Studies, 58(2): 277–297.
Artola, M. 1978. Antiguo Regimen y revolucion liberal. Ariel.
Ashraf, Q., and O. Galor. 2011. “Dynamics and Stagnation in the Malthusian Epoch.”American Economic Review, 101(5): 2003–2041.
Badenes, M., and J. Bernat. 1994. Crecimiento de la Poblacion Valenciana: Analisis yPresentacion de los Censos Demograficos. Edicions Alfons el Magnanim.
30
Banerjee, Abhijit, and Lakshmi Iyer. 2005. “History, Institutions and Economic Per-formance: The Legacy of Colonial Land Tenure Systems in India.” American EconomicReview, 95(4): 1190–1213.
Barro, Robert J. 2012. “Convergence and Modernization Revisited.” NBER Working Pa-per 18295.
Barro, Robert J., and Xavier Sala-i-Martin. 1992. “Convergence.” Journal of PoliticalEconomy, 100(2): 223–251.
Benıtez, R. 2001. Heroicas Decisiones: la Monarquıa Catolica y los Moriscos Valencianos.Institucio Alfons el Magnanim.
Benıtez, R. 2008. “Justicia y Gracia: Lerma y los Consejos de la Monarquıa ante el Prob-lema de la Repoblacion del Reino de Valencia.” In La Monarquıa de Felipe III. , ed. J.Martınez Millan and M. Antonietta Visceglia, 255–331. Fundacion Mapfre.
Bleda, J. 1610. Defensio fidei in causa neophytorum sive morischorum Regni Valentiaetotiusque Hispaniae. Apud Ioannem Chrystostomum Garriz.
Boronat, P. 1901 [1992]. Los Moriscos Espanoles y su Expulsion, vol. II. Universidad deGranada.
Braudel, F. 1995. The Mediterranean and the Mediterranean World in the Age of PhilipII, volume II. University of California Press.
Brenner, R. 1976. “Agrarian Class Structure and Economic Development in Pre-IndustrialEurope.” Past & Present, 70: 30–75.
Canet, T. 1986. La Audiencia Valenciana en la Epoca Foral Moderna. Edicions Alfons elMagnanim.
Carcel, M. 1988. “La Poblacion de las Diocesis Valencianas a traves de las Relaciones “AdLimina”.” Edicions Alfons el Magnanim.
Card, David. 1990. “The Impact of the Mariel Boatlift on the Miami Labor Market.”Industrial and Labor Relations Review, 43(2): 245–257.
Carrington, William J., and Pedro J.F. de Lima. 1996. “The Impact of the 1970sRepatriates from Africa on the Portuguese Labor Market.” Industrial and Labor RelationsReview, 49(2): 330–347.
Caselli, Francesco, and John Coleman II. 2001. “The U.S. Structural Transforma-tion and Regional Convergence: A Reinterpretation.” Journal of Political Economy,109(3): 584–616.
Caselli, Francesco, Gerardo Esquivel, and Fernando Lefort. 1996. “Reopening theConvergence Debate: A New Look at Cross-Country Growth Empirics.” Journal of Eco-nomic Growth, 1(3): 363–389.
31
Casey, J. 1971. “Moriscos and the Depopulation of Valencia.” Past and Present, 50: 19–40.
Casey, J. 1975. “La situacion economica de la nobleza valenciana en vısperas de la expulsionde los moriscos.” In Homenaje al dr. D. Juan Regla Campistol. 515–526. Universtat deValencia.
Casey, J. 2008. The Kingdom of Valencia in the Seventeenth Century. Cambridge UniversityPress.
Cavanilles, A. 1958. Observaciones sobre la Historia Natural, Geografıa, Agricultura,Poblacion y Frutos del Reyno de Valencia; Vol. 2. Consejo Superior de InvestigacionesCientıficas.
Chabas, R. 1890. “Descripcion del Reino de Valencia, 1565 a 1572.” Archivo, 4: 373–388.
Ciscar, E. 1975. “El Endeudamiento del Campesinado Valenciano en el Siglo XVII.” Es-tudis, 4: 147–162.
Ciscar, E. 1977. Tierra y Senorıo en el Paıs Valenciano. Del Cenia al Segura.
Ciscar, E. 1993. Moriscos, Nobles y Repobladores. Edicions Alfons el Magnanim.
Ciscar, E. 1994. “Algaravıa y Algemıa. Precisiones sobre la Lengua de los Moriscos en elReino de Valencia.” Al-Qantara, 15(1): 131–162.
Clark, G. 2005. “The Condition of the Working Class in England, 1209-2003.” Journal ofPolitical Economy, 113: 1307–1340.
Clark, G. 2007. A Farewell to Alms: A Brief Economic History of the World. PrincetonUniversity Press.
Clark, G. 2010. “The Macroeconomic Aggregates for England, 1209-2008.” Research inEconomic History, 27: 51–140.
Dadson, T. 2009. “Los moriscos que no salieron.” Pedralbes, 29: 213–246.
Dell, M. 2010. “The Persistent Effects of Peru’s Mining Mita.” Econometrica, 78(6): 1863–1903.
De Moxo, S. 1965. La Disolucion del Regimen Senorial en Espana. Consejo Superior deInvestigactiones Cientıficas.
Domar, Evsey D. 1970. “The Causes of Slavery or Serfdom: A Hypothesis.” Journal ofEconomic History, 30(1): 18–32.
Engerman, Stanley L., and Kenneth L. Sokoloff. 1997. “Factor Endowments, Insti-tutions and Differential Paths of Growth Among New World Economies.” In How LatinAmerica Fell Behind. , ed. Stephen Haber. Stanford University Press.
Febrer Romaguera, M. 2000. Dominio y explotacion territorial en la Valencia foral. Uni-versitat de Valencia.
32
Friedberg, Rachel M. 2001. “The Impact of Mass Migration on the Israeli Labor Market.”Quarterly Journal of Economics, 116(4): 1373–1408.
Furio, A. 1995. Historia del Paıs Valencia. Edicions Alfons el Magnanim.
Galor, O. 2011. Unified Growth Theory. Princeton University Press.
Galor, O., and D. Weil. 1996. “The Gender Gap, Fertility, and Growth.” AmericanEconomic Review, 86(3): 374–387.
Galor, O., and D. Weil. 1999. “From Malthusian Stagnation to Modern Growth.” Amer-ican Economic Review, 89(2): 150–154.
Galor, O., and D. Weil. 2000. “Population, Technology, and Growth: From MalthusianStagnation to the Demographic Transition and Beyond.” American Economic Review,90(4): 806–828.
Galor, O., and O. Moav. 2002. “Natural Selection and the Origin of Economic Growth.”Quarterly Journal of Economics, 117: 1133–1191.
Garcıa, M. 1974. “El marco historico de la industrializacion valenciana.” Informacion com-ercial espanola, 485: 135–146.
Garcıa Martınez, S. 1991. Valencia Bajo Carlos II. Ayuntamiento de Villena.
Habakkuk, H.J. 1958. “The Economic History of Modern Britain.” Journal of EconomicHistory, 18(4): 486–501.
Habakkuk, H.J. 1962. American and British Technology in the Nineteenth Century: theSearch for Labour-saving Inventions. Cambridge Press.
Halperin, T. 2008. Un conflicto nacional: moriscos y cristianos viejos en Valencia. Uni-versitat de Valencia.
Hamilton, E. 1938. “Revisions in Economic History: VIII.-The Decline of Spain.” EconomicHistory Review, 8(2): 168–179.
Hansen, G., and E. Prescott. 2002. “Malthus to Solow.” American Economic Review,92: 1205–1217.
Hatcher, J. 1996. “Plague, population and the English economy, 1348-1530.” In BritishPopulation History: From the Black Death to the Present Day. Cambridge UniversityPress.
Hayami, Y., and V.W. Ruttan. 1985. Agricultural Development: An International Per-spective. Johns Hopkins Press.
Hornbeck, R., and S. Naidu. 2014. “When the Levee Breaks: Black Migration andEconomic Development in the American South.” American Economic Review, 104(3): 963–996.
33
Hunt, Jennifer. 1992. “The Impact of the 1962 Repatriates from Algeria on the FrenchLabor Market.” Industrial and Labor Relations Review, 45(3): 566–572.
Hurwicz, L. 1991. “Least-Squares Bias in Time Series.” In Statistical Inference in DynamicEconomic Models. , ed. Tjalling C. Koopmans. Wiley.
Instituto Nacional de Estadıstica. 1991. Censo de 1787 “Floridablanca” Tomo VI. In-stituto Nacional de Estadıstica.
Janer, F. 1857. Condicion Social de los Moriscos de Espana. Real Academia de la Historia.
Jones, C.I. 2001. “Was an Industrial Revolution Inevitable? Economic Growth Over theVery Long Run.” Advances in Macroeconomics, 1: 1–45.
Kamen, H. 2001. Philip V of Spain. Yale University Press.
LaPeyre, H. 1959. Geographie de l’Espagne Morisque. S.E.V.P.E.N.
Lee, Ronald. 1973. “Population in Preindustrialist England: An Econometric Analysis.”Quarterly Journal of Economics, 87(4): 581–607.
Lee, Ronald, and Michael Anderson. 2002. “Malthus in state space: Macro Economic-Demographic Relations in English History, 1540-1870.” Journal of Population Economics,15(2): 195–220.
Lee, Ronald D. 1987. “Population Dynamics of Humans and Other Animals.” Demography,24(4): 443–465.
Lee, Ronald D. 1993. “Accidental and Systematic Change in Population History: Home-ostasis in a Stochastic Setting.” Explorations in Economic History, 30: 1–30.
Le Roy Ladurie, Emmanuel. 1977. The Peasants of Languedoc. University of IllinoisPress.
Llibrer, I. 2011. “La Catedral de Valencia como Administrador General del Diezmo de laDiocesis. Aspectos Historicos, Economicos, Contables y Organizativos.” Paper presentedat the XVI congress of the Asociacion Espanola de Contabilidad y Administracion deEmpresas, 23 September.
Lloret, P. 2002. “Los Intentos Repobladores del Senor de Olocau tras la Expulsion de losMoriscos. La Carta Puebla de 1610.” Estudis, 28: 345–365.
Meyerson, M. 1991. The Muslims of Valencia. University of California Press.
Nickell, Stephen. 1981. “Biases in Dynamic Models with Fixed Effects.” Econometrica,49(6): 1417–1426.
North, Douglass C., and Robert Paul Thomas. 1971. “The Rise and Fall of theManorial System: A Theoretical Model.” Journal of Economic History, 31(4): 777–803.
34
Phelps-Brown, H., and S.V. Hopkins. 1981. A Perspective of Wages and Prices.Methuen Publishing.
Regla, J. 1964. Estudios sobre los Moriscos. Universidad de Valencia.
Salvador, E. 1998. “La Cuestion de los Censales y la Expulsion de los Moriscos Valen-cianos.” Estudis, 24: 127–146.
Torres, J. 1969. Repoblacion del Reino de Valencia, despues de la Expulsion de los Moriscos.Ayuntamiento de Valencia.
Voigtlander, N., and H.-J. Voth. 2009. “Malthusian Dynamism and the Rise of Europe:Make War, Not Love.” American Economic Review: Papers and Proceedings, 99(2): 248–254.
Voigtlander, N., and H.-J. Voth. 2013a. “How the West ”Invented” Fertility Restric-tion.” American Economic Review, 103(6): 2227–2264.
Voigtlander, N., and H.-J. Voth. 2013b. “The Three Horsemen of Riches: Plague, War,and Urbanization in Early Modern Europe.” Review of Economic Studies, 80(2): 774–811.
Weir, D.R. 1991. “A Historical Perspective on the Economic Consequences of Rapid Pop-ulation Growth.” In Consequences of Rapid Population Growth in Developing Countries.Taylor and Francis.
35
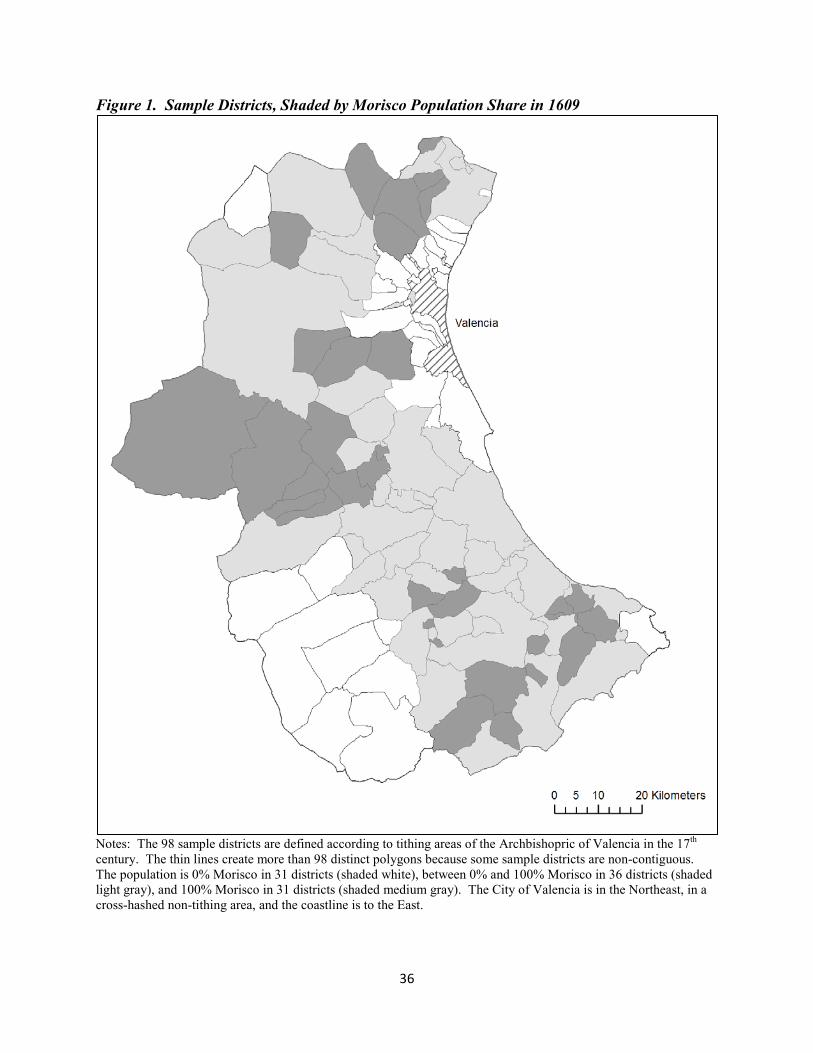
36
Figure 1. Sample Districts, Shaded by Morisco Population Share in 1609
Notes: The 98 sample districts are defined according to tithing areas of the Archbishopric of Valencia in the 17th century. The thin lines create more than 98 distinct polygons because some sample districts are non-contiguous. The population is 0% Morisco in 31 districts (shaded white), between 0% and 100% Morisco in 36 districts (shaded light gray), and 100% Morisco in 31 districts (shaded medium gray). The City of Valencia is in the Northeast, in a cross-hashed non-tithing area, and the coastline is to the East.
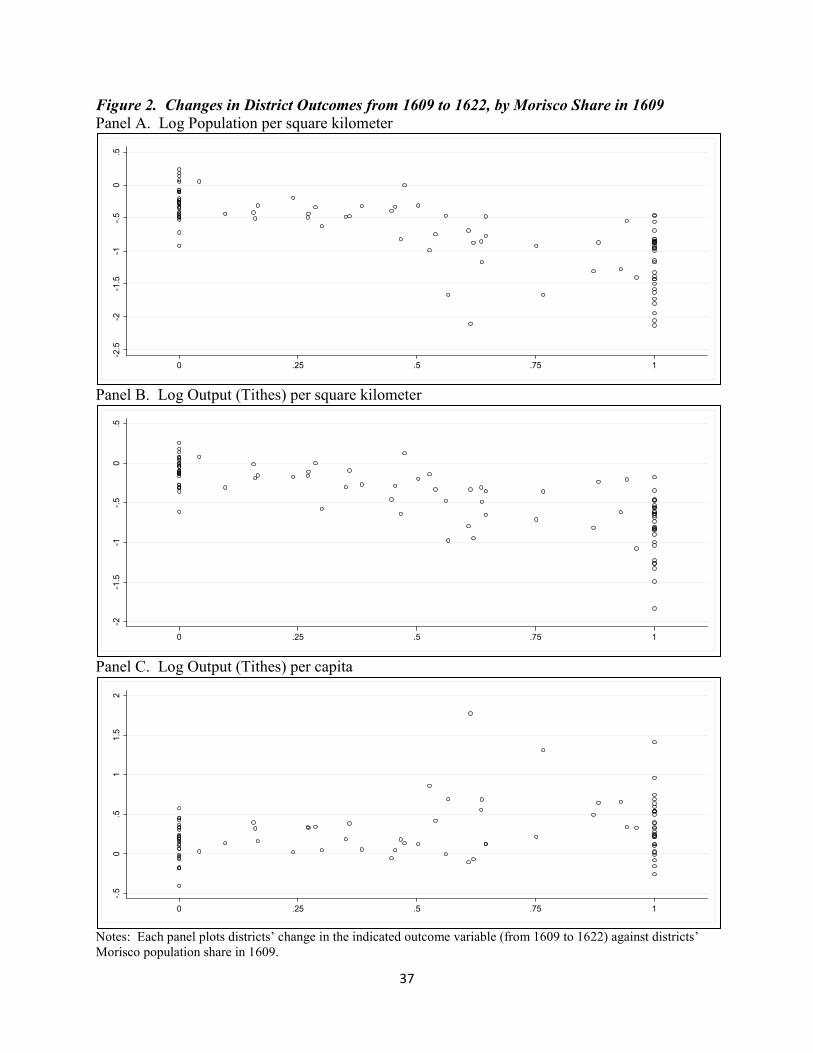
37
Figure 2. Changes in District Outcomes from 1609 to 1622, by Morisco Share in 1609 Panel A. Log Population per square kilometer
Panel B. Log Output (Tithes) per square kilometer
Panel C. Log Output (Tithes) per capita
Notes: Each panel plots districts’ change in the indicated outcome variable (from 1609 to 1622) against districts’ Morisco population share in 1609.
-2.5
-2-1
.5-1
-.50
.5
0 .25 .5 .75 1
-2-1
.5-1
-.50
.5
0 .25 .5 .75 1
-.50
.51
1.5
2
0 .25 .5 .75 1
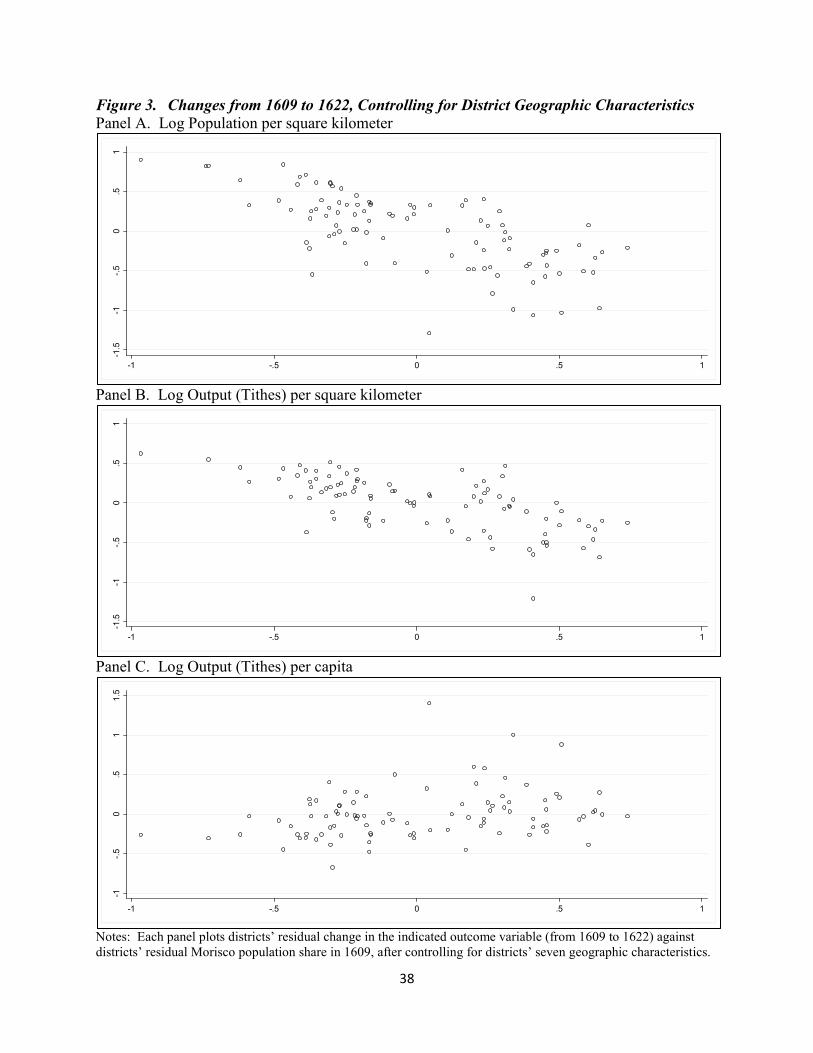
38
Figure 3. Changes from 1609 to 1622, Controlling for District Geographic Characteristics Panel A. Log Population per square kilometer
Panel B. Log Output (Tithes) per square kilometer
Panel C. Log Output (Tithes) per capita
Notes: Each panel plots districts’ residual change in the indicated outcome variable (from 1609 to 1622) against districts’ residual Morisco population share in 1609, after controlling for districts’ seven geographic characteristics.
-1.5
-1-.5
0.5
1
-1 -.5 0 .5 1
-1.5
-1-.5
0.5
1
-1 -.5 0 .5 1
-1-.5
0.5
11.
5
-1 -.5 0 .5 1

39
Figure 4. Changes in District Outcomes, Grouped by Morisco Share in 1609 Panel A. Log Population per square kilometer
Panel B. Log Output (Tithes) per square kilometer
Panel C. Log Output (Tithes) per capita
Notes: Each panel plots districts’ average change after 1609 in the indicated outcome variable, grouped by districts’ Morisco population share in 1609: 0% (dotted line), between 0% and 100% (dashed line), and 100% (solid line).
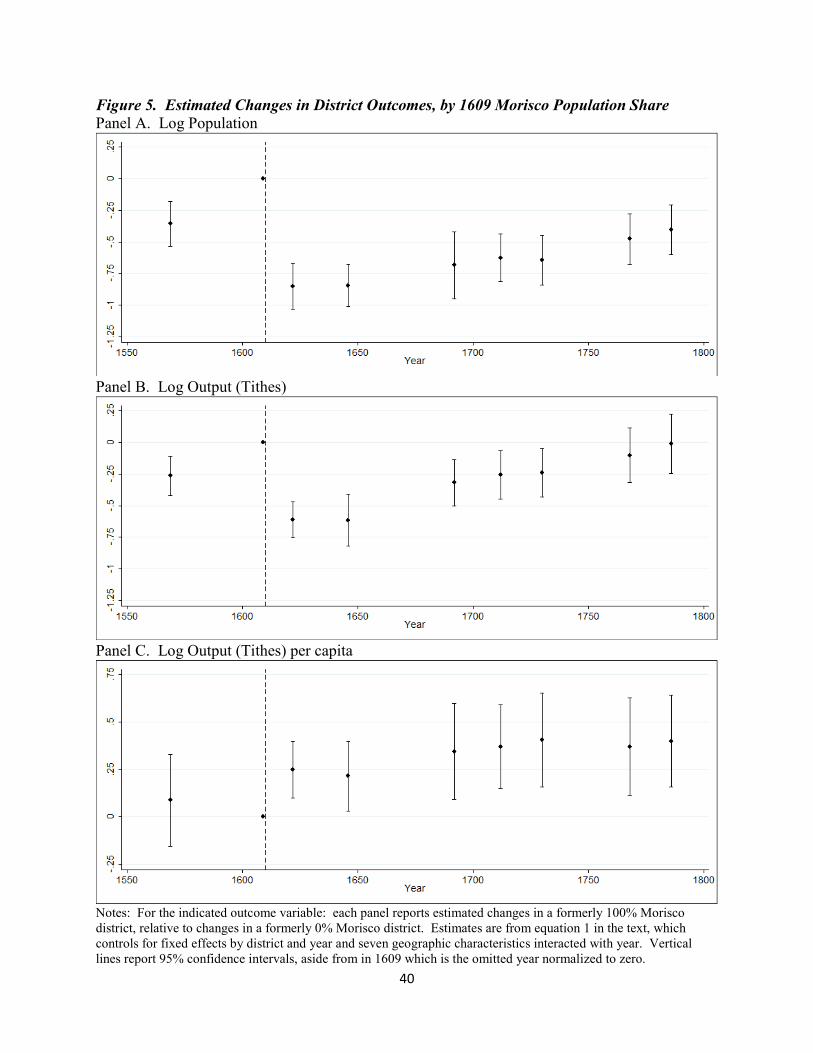
40
Figure 5. Estimated Changes in District Outcomes, by 1609 Morisco Population Share Panel A. Log Population
Panel B. Log Output (Tithes)
Panel C. Log Output (Tithes) per capita
Notes: For the indicated outcome variable: each panel reports estimated changes in a formerly 100% Morisco district, relative to changes in a formerly 0% Morisco district. Estimates are from equation 1 in the text, which controls for fixed effects by district and year and seven geographic characteristics interacted with year. Vertical lines report 95% confidence intervals, aside from in 1609 which is the omitted year normalized to zero.
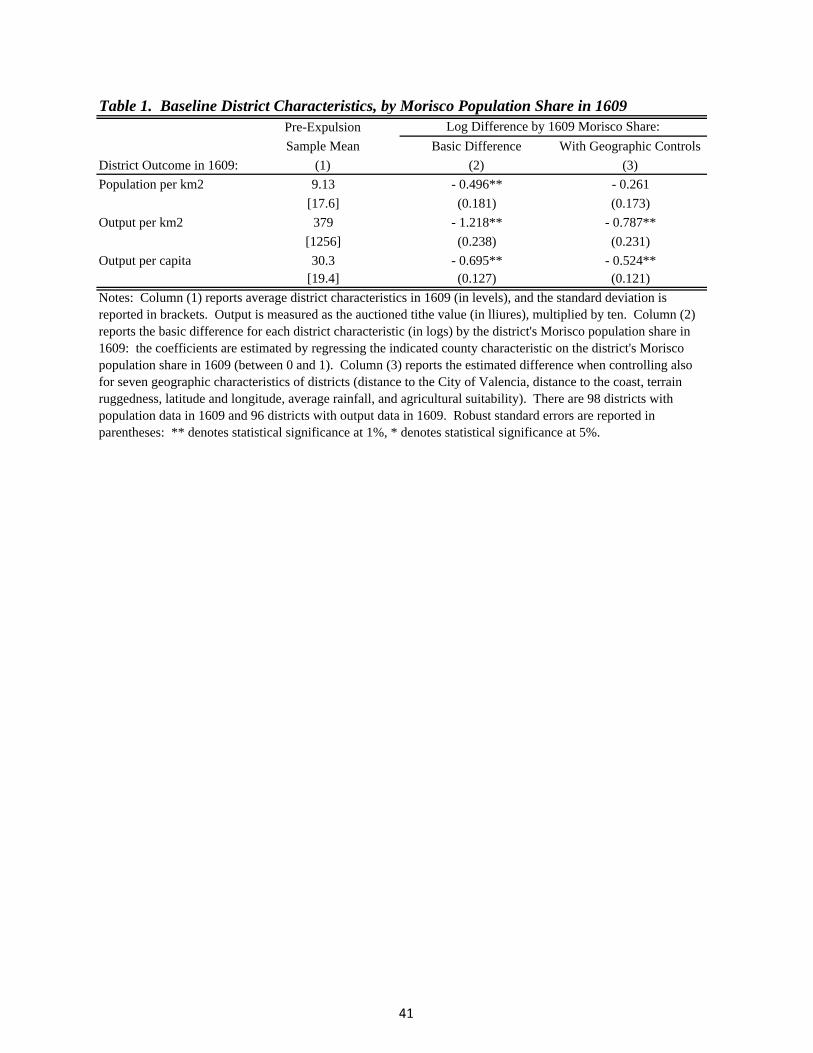
Table 1. Baseline District Characteristics, by Morisco Population Share in 1609Pre-Expulsion
Sample Mean Basic Difference With Geographic Controls
District Outcome in 1609: (1) (2) (3)
Population per km2 9.13 - 0.496** - 0.261
[17.6] (0.181) (0.173)
Output per km2 379 - 1.218** - 0.787**
[1256] (0.238) (0.231)
Output per capita 30.3 - 0.695** - 0.524**[19.4] (0.127) (0.121)
Notes: Column (1) reports average district characteristics in 1609 (in levels), and the standard deviation is reported in brackets. Output is measured as the auctioned tithe value (in lliures), multiplied by ten. Column (2) reports the basic difference for each district characteristic (in logs) by the district's Morisco population share in 1609: the coefficients are estimated by regressing the indicated county characteristic on the district's Morisco population share in 1609 (between 0 and 1). Column (3) reports the estimated difference when controlling also for seven geographic characteristics of districts (distance to the City of Valencia, distance to the coast, terrain ruggedness, latitude and longitude, average rainfall, and agricultural suitability). There are 98 districts with population data in 1609 and 96 districts with output data in 1609. Robust standard errors are reported in parentheses: ** denotes statistical significance at 1%, * denotes statistical significance at 5%.
Log Difference by 1609 Morisco Share:
41
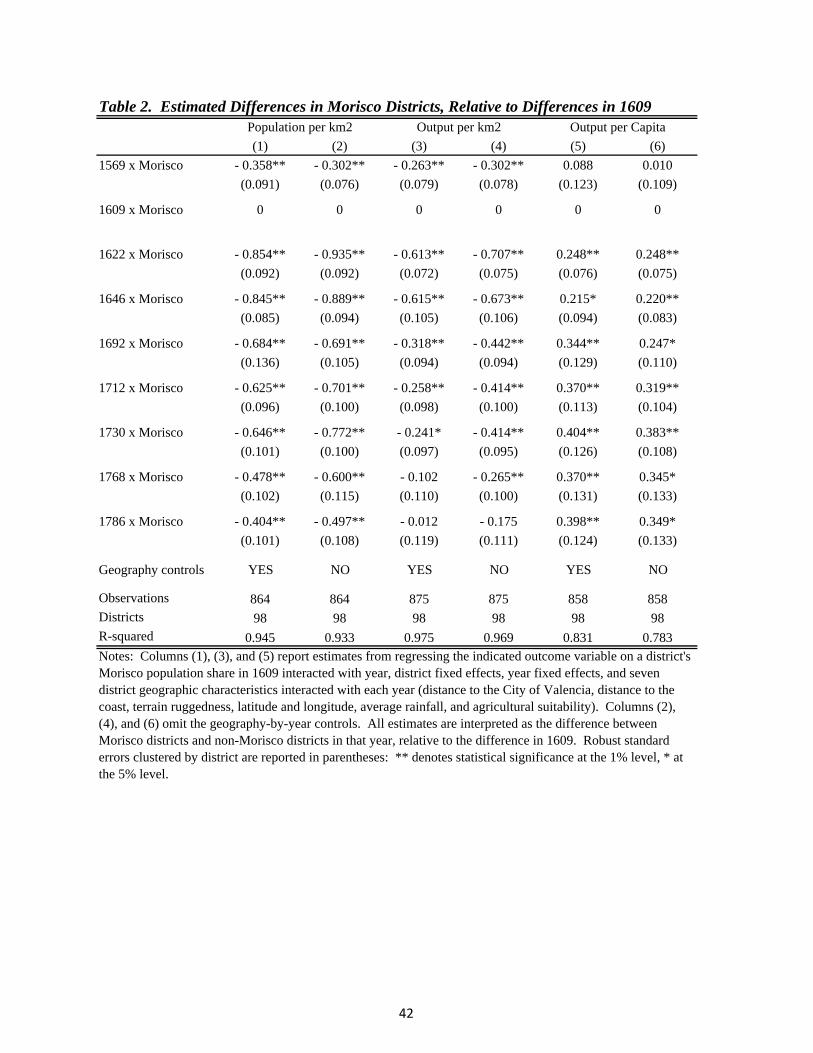
(1) (2) (3) (4) (5) (6)
1569 x Morisco - 0.358** - 0.302** - 0.263** - 0.302** 0.088 0.010
(0.091) (0.076) (0.079) (0.078) (0.123) (0.109)
1609 x Morisco 0 0 0 0 0 0
1622 x Morisco - 0.854** - 0.935** - 0.613** - 0.707** 0.248** 0.248**
(0.092) (0.092) (0.072) (0.075) (0.076) (0.075)
1646 x Morisco - 0.845** - 0.889** - 0.615** - 0.673** 0.215* 0.220**
(0.085) (0.094) (0.105) (0.106) (0.094) (0.083)
1692 x Morisco - 0.684** - 0.691** - 0.318** - 0.442** 0.344** 0.247*
(0.136) (0.105) (0.094) (0.094) (0.129) (0.110)
1712 x Morisco - 0.625** - 0.701** - 0.258** - 0.414** 0.370** 0.319**
(0.096) (0.100) (0.098) (0.100) (0.113) (0.104)
1730 x Morisco - 0.646** - 0.772** - 0.241* - 0.414** 0.404** 0.383**
(0.101) (0.100) (0.097) (0.095) (0.126) (0.108)
1768 x Morisco - 0.478** - 0.600** - 0.102 - 0.265** 0.370** 0.345*
(0.102) (0.115) (0.110) (0.100) (0.131) (0.133)
1786 x Morisco - 0.404** - 0.497** - 0.012 - 0.175 0.398** 0.349*
(0.101) (0.108) (0.119) (0.111) (0.124) (0.133)
Geography controls YES NO YES NO YES NO
Observations 864 864 875 875 858 858Districts 98 98 98 98 98 98R-squared 0.945 0.933 0.975 0.969 0.831 0.783
Table 2. Estimated Differences in Morisco Districts, Relative to Differences in 1609Population per km2 Output per km2
Notes: Columns (1), (3), and (5) report estimates from regressing the indicated outcome variable on a district's Morisco population share in 1609 interacted with year, district fixed effects, year fixed effects, and seven district geographic characteristics interacted with each year (distance to the City of Valencia, distance to the coast, terrain ruggedness, latitude and longitude, average rainfall, and agricultural suitability). Columns (2), (4), and (6) omit the geography-by-year controls. All estimates are interpreted as the difference between Morisco districts and non-Morisco districts in that year, relative to the difference in 1609. Robust standard errors clustered by district are reported in parentheses: ** denotes statistical significance at the 1% level, * at the 5% level.
Output per Capita
42
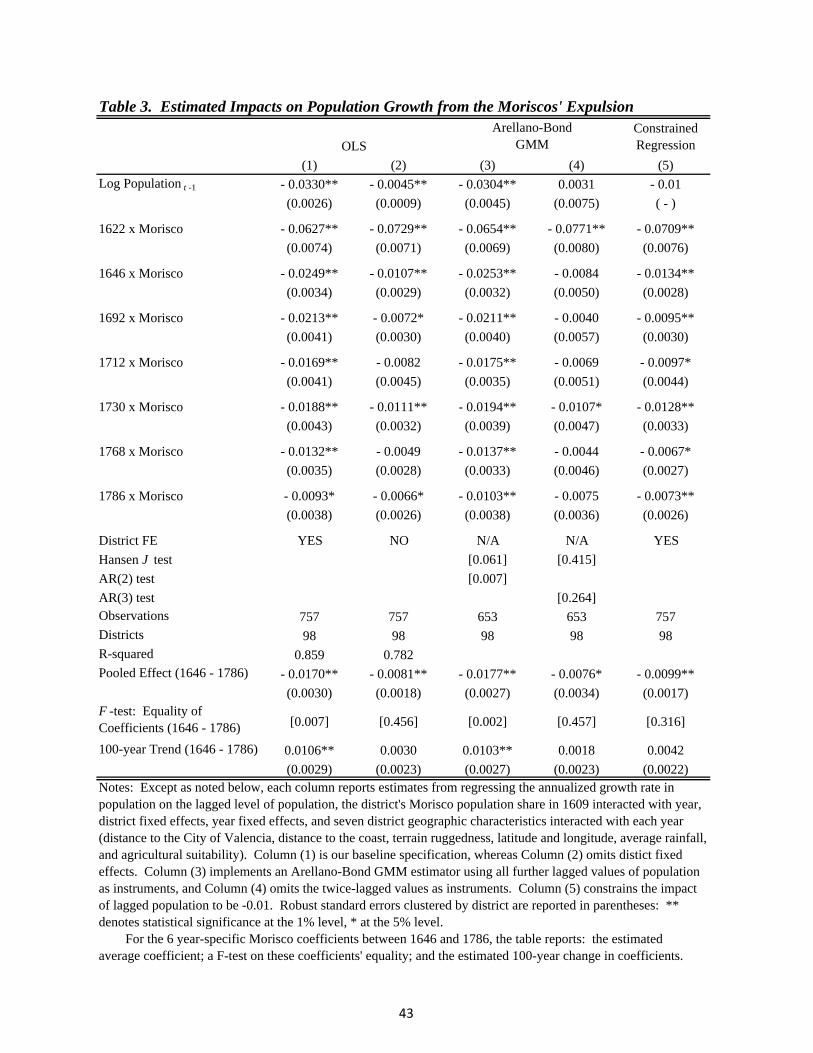
ConstrainedRegression
(1) (2) (3) (4) (5)Log Population t -1 - 0.0330** - 0.0045** - 0.0304** 0.0031 - 0.01
(0.0026) (0.0009) (0.0045) (0.0075) ( - )
1622 x Morisco - 0.0627** - 0.0729** - 0.0654** - 0.0771** - 0.0709**
(0.0074) (0.0071) (0.0069) (0.0080) (0.0076)
1646 x Morisco - 0.0249** - 0.0107** - 0.0253** - 0.0084 - 0.0134**
(0.0034) (0.0029) (0.0032) (0.0050) (0.0028)
1692 x Morisco - 0.0213** - 0.0072* - 0.0211** - 0.0040 - 0.0095**
(0.0041) (0.0030) (0.0040) (0.0057) (0.0030)
1712 x Morisco - 0.0169** - 0.0082 - 0.0175** - 0.0069 - 0.0097*
(0.0041) (0.0045) (0.0035) (0.0051) (0.0044)
1730 x Morisco - 0.0188** - 0.0111** - 0.0194** - 0.0107* - 0.0128**
(0.0043) (0.0032) (0.0039) (0.0047) (0.0033)
1768 x Morisco - 0.0132** - 0.0049 - 0.0137** - 0.0044 - 0.0067*
(0.0035) (0.0028) (0.0033) (0.0046) (0.0027)
1786 x Morisco - 0.0093* - 0.0066* - 0.0103** - 0.0075 - 0.0073**
(0.0038) (0.0026) (0.0038) (0.0036) (0.0026)
District FE YES NO N/A N/A YES
Hansen J test [0.061] [0.415]
AR(2) test [0.007]
AR(3) test [0.264]Observations 757 757 653 653 757Districts 98 98 98 98 98R-squared 0.859 0.782Pooled Effect (1646 - 1786) - 0.0170** - 0.0081** - 0.0177** - 0.0076* - 0.0099**
(0.0030) (0.0018) (0.0027) (0.0034) (0.0017)F -test: Equality of Coefficients (1646 - 1786) [0.007] [0.456] [0.002] [0.457] [0.316]
100-year Trend (1646 - 1786) 0.0106** 0.0030 0.0103** 0.0018 0.0042
(0.0029) (0.0023) (0.0027) (0.0023) (0.0022)
OLS
Table 3. Estimated Impacts on Population Growth from the Moriscos' Expulsion
Notes: Except as noted below, each column reports estimates from regressing the annualized growth rate in population on the lagged level of population, the district's Morisco population share in 1609 interacted with year, district fixed effects, year fixed effects, and seven district geographic characteristics interacted with each year (distance to the City of Valencia, distance to the coast, terrain ruggedness, latitude and longitude, average rainfall, and agricultural suitability). Column (1) is our baseline specification, whereas Column (2) omits distict fixed effects. Column (3) implements an Arellano-Bond GMM estimator using all further lagged values of population as instruments, and Column (4) omits the twice-lagged values as instruments. Column (5) constrains the impact of lagged population to be -0.01. Robust standard errors clustered by district are reported in parentheses: ** denotes statistical significance at the 1% level, * at the 5% level. For the 6 year-specific Morisco coefficients between 1646 and 1786, the table reports: the estimated average coefficient; a F-test on these coefficients' equality; and the estimated 100-year change in coefficients.
Arellano-BondGMM
43
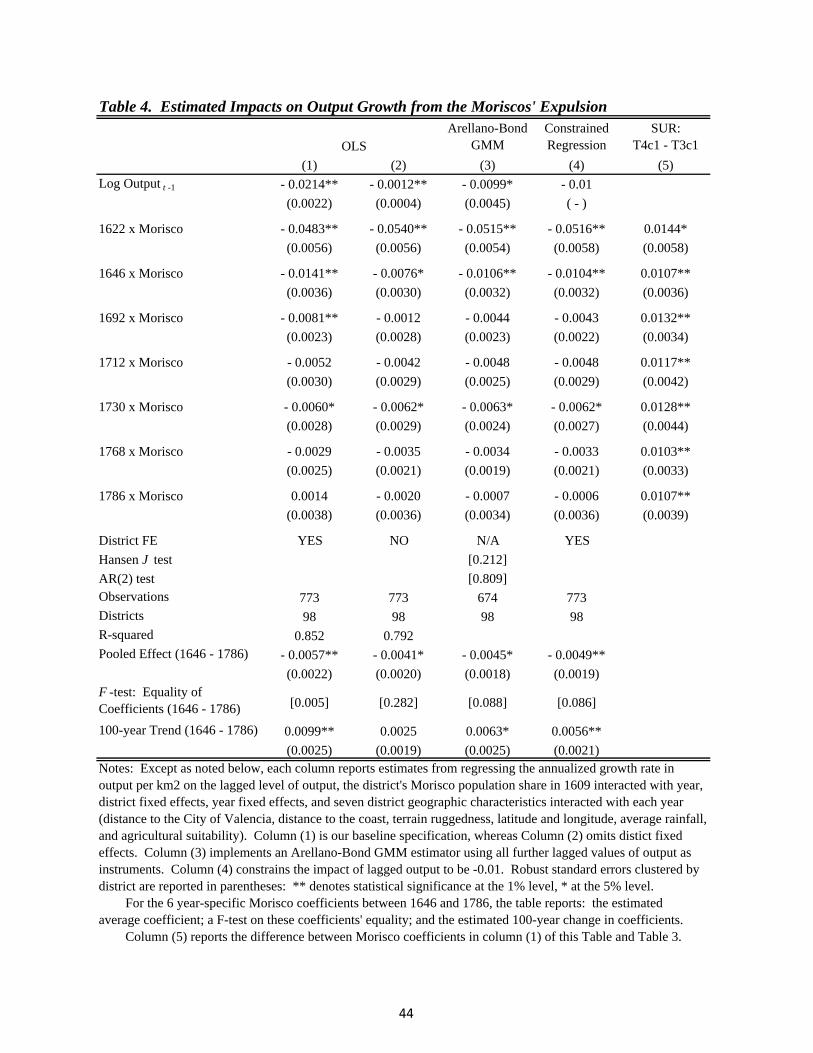
Arellano-BondGMM
ConstrainedRegression
SUR:T4c1 - T3c1
(1) (2) (3) (4) (5)Log Output t -1 - 0.0214** - 0.0012** - 0.0099* - 0.01
(0.0022) (0.0004) (0.0045) ( - )
1622 x Morisco - 0.0483** - 0.0540** - 0.0515** - 0.0516** 0.0144*
(0.0056) (0.0056) (0.0054) (0.0058) (0.0058)
1646 x Morisco - 0.0141** - 0.0076* - 0.0106** - 0.0104** 0.0107**
(0.0036) (0.0030) (0.0032) (0.0032) (0.0036)
1692 x Morisco - 0.0081** - 0.0012 - 0.0044 - 0.0043 0.0132**
(0.0023) (0.0028) (0.0023) (0.0022) (0.0034)
1712 x Morisco - 0.0052 - 0.0042 - 0.0048 - 0.0048 0.0117**
(0.0030) (0.0029) (0.0025) (0.0029) (0.0042)
1730 x Morisco - 0.0060* - 0.0062* - 0.0063* - 0.0062* 0.0128**
(0.0028) (0.0029) (0.0024) (0.0027) (0.0044)
1768 x Morisco - 0.0029 - 0.0035 - 0.0034 - 0.0033 0.0103**
(0.0025) (0.0021) (0.0019) (0.0021) (0.0033)
1786 x Morisco 0.0014 - 0.0020 - 0.0007 - 0.0006 0.0107**
(0.0038) (0.0036) (0.0034) (0.0036) (0.0039)
District FE YES NO N/A YES
Hansen J test [0.212]
AR(2) test [0.809]Observations 773 773 674 773Districts 98 98 98 98R-squared 0.852 0.792Pooled Effect (1646 - 1786) - 0.0057** - 0.0041* - 0.0045* - 0.0049**
(0.0022) (0.0020) (0.0018) (0.0019)F -test: Equality of Coefficients (1646 - 1786) [0.005] [0.282] [0.088] [0.086]
100-year Trend (1646 - 1786) 0.0099** 0.0025 0.0063* 0.0056**
(0.0025) (0.0019) (0.0025) (0.0021)
Table 4. Estimated Impacts on Output Growth from the Moriscos' Expulsion
OLS
Notes: Except as noted below, each column reports estimates from regressing the annualized growth rate in output per km2 on the lagged level of output, the district's Morisco population share in 1609 interacted with year, district fixed effects, year fixed effects, and seven district geographic characteristics interacted with each year (distance to the City of Valencia, distance to the coast, terrain ruggedness, latitude and longitude, average rainfall, and agricultural suitability). Column (1) is our baseline specification, whereas Column (2) omits distict fixed effects. Column (3) implements an Arellano-Bond GMM estimator using all further lagged values of output as instruments. Column (4) constrains the impact of lagged output to be -0.01. Robust standard errors clustered by district are reported in parentheses: ** denotes statistical significance at the 1% level, * at the 5% level. For the 6 year-specific Morisco coefficients between 1646 and 1786, the table reports: the estimated average coefficient; a F-test on these coefficients' equality; and the estimated 100-year change in coefficients. Column (5) reports the difference between Morisco coefficients in column (1) of this Table and Table 3.
44
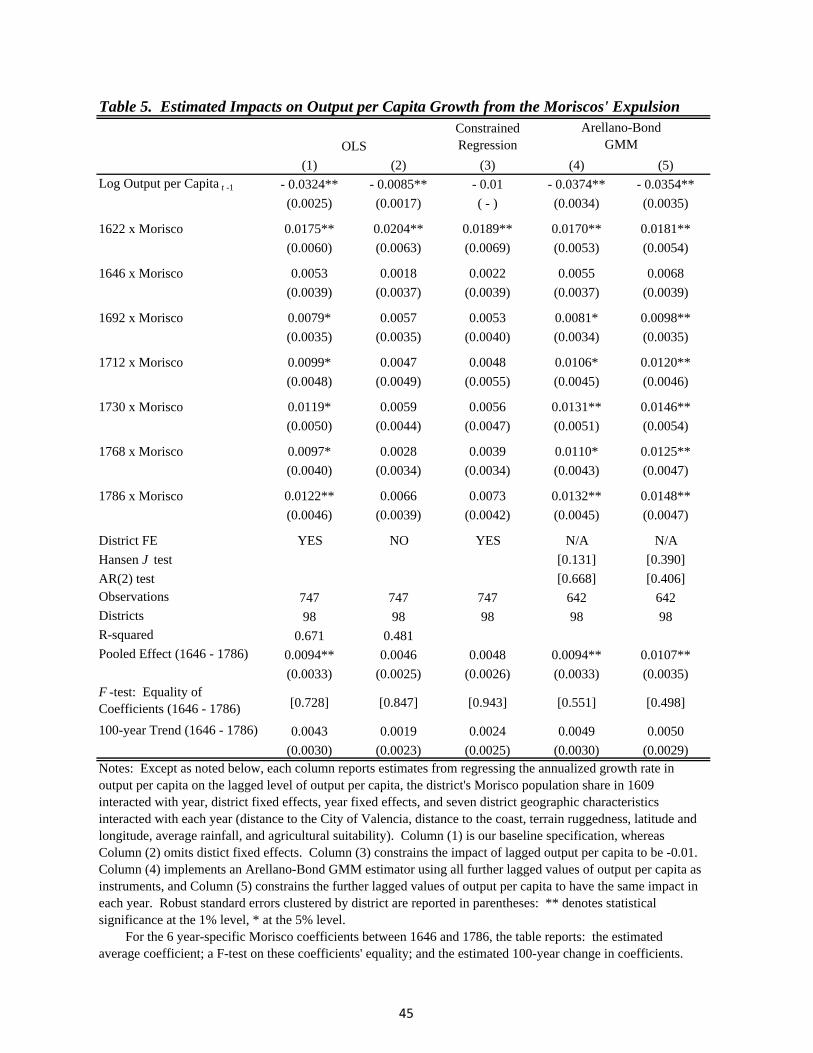
ConstrainedRegression
(1) (2) (3) (4) (5)Log Output per Capita t -1 - 0.0324** - 0.0085** - 0.01 - 0.0374** - 0.0354**
(0.0025) (0.0017) ( - ) (0.0034) (0.0035)
1622 x Morisco 0.0175** 0.0204** 0.0189** 0.0170** 0.0181**
(0.0060) (0.0063) (0.0069) (0.0053) (0.0054)
1646 x Morisco 0.0053 0.0018 0.0022 0.0055 0.0068
(0.0039) (0.0037) (0.0039) (0.0037) (0.0039)
1692 x Morisco 0.0079* 0.0057 0.0053 0.0081* 0.0098**
(0.0035) (0.0035) (0.0040) (0.0034) (0.0035)
1712 x Morisco 0.0099* 0.0047 0.0048 0.0106* 0.0120**
(0.0048) (0.0049) (0.0055) (0.0045) (0.0046)
1730 x Morisco 0.0119* 0.0059 0.0056 0.0131** 0.0146**
(0.0050) (0.0044) (0.0047) (0.0051) (0.0054)
1768 x Morisco 0.0097* 0.0028 0.0039 0.0110* 0.0125**
(0.0040) (0.0034) (0.0034) (0.0043) (0.0047)
1786 x Morisco 0.0122** 0.0066 0.0073 0.0132** 0.0148**
(0.0046) (0.0039) (0.0042) (0.0045) (0.0047)
District FE YES NO YES N/A N/A
Hansen J test [0.131] [0.390]
AR(2) test [0.668] [0.406]Observations 747 747 747 642 642Districts 98 98 98 98 98R-squared 0.671 0.481Pooled Effect (1646 - 1786) 0.0094** 0.0046 0.0048 0.0094** 0.0107**
(0.0033) (0.0025) (0.0026) (0.0033) (0.0035)F -test: Equality of Coefficients (1646 - 1786) [0.728] [0.847] [0.943] [0.551] [0.498]
100-year Trend (1646 - 1786) 0.0043 0.0019 0.0024 0.0049 0.0050
(0.0030) (0.0023) (0.0025) (0.0030) (0.0029)
Table 5. Estimated Impacts on Output per Capita Growth from the Moriscos' Expulsion
OLS
Arellano-BondGMM
Notes: Except as noted below, each column reports estimates from regressing the annualized growth rate in output per capita on the lagged level of output per capita, the district's Morisco population share in 1609 interacted with year, district fixed effects, year fixed effects, and seven district geographic characteristics interacted with each year (distance to the City of Valencia, distance to the coast, terrain ruggedness, latitude and longitude, average rainfall, and agricultural suitability). Column (1) is our baseline specification, whereas Column (2) omits distict fixed effects. Column (3) constrains the impact of lagged output per capita to be -0.01. Column (4) implements an Arellano-Bond GMM estimator using all further lagged values of output per capita as instruments, and Column (5) constrains the further lagged values of output per capita to have the same impact in each year. Robust standard errors clustered by district are reported in parentheses: ** denotes statistical significance at the 1% level, * at the 5% level. For the 6 year-specific Morisco coefficients between 1646 and 1786, the table reports: the estimated average coefficient; a F-test on these coefficients' equality; and the estimated 100-year change in coefficients.
45