Economic differences of Hungarian Regions Katalin Czakó Veronika Poreisz.
16
Economic differences of Hungarian Regions • Katalin Czakó • Veronika Poreisz
-
Upload
sharyl-harrington -
Category
Documents
-
view
226 -
download
2
Transcript of Economic differences of Hungarian Regions Katalin Czakó Veronika Poreisz.

Economic differences of Hungarian Regions
• Katalin Czakó• Veronika Poreisz
Immigration – emigration
Employment - unemployment
High education
R&D
Summary
Dynamics of national economic sectors
Territorial differences of GDP
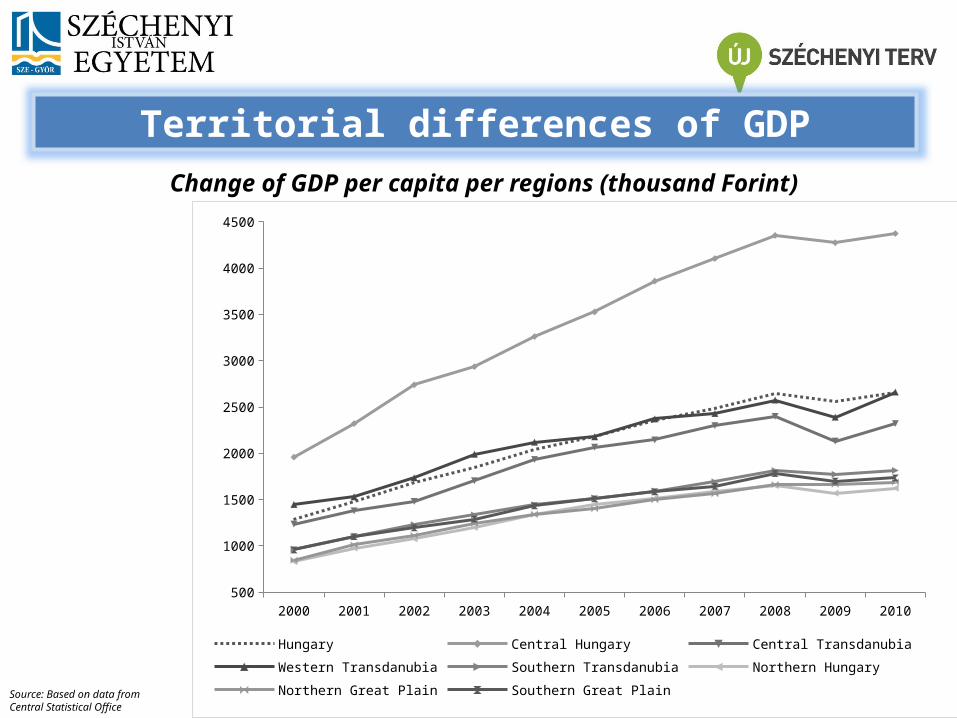
Source: Based on data from Central Statistical Office
Territorial differences of GDP
2000 2001 2002 2003 2004 2005 2006 2007 2008 2009 2010500
1000
1500
2000
2500
3000
3500
4000
4500
Hungary Central Hungary Central Transdanubia Western Transdanubia
Southern Transdanubia Northern Hungary Northern Great Plain Southern Great Plain
Change of GDP per capita per regions (thousand Forint)

Territorial distribution of GDP production in 2000 and 2010
Source: Based on data from Central Statistical Office
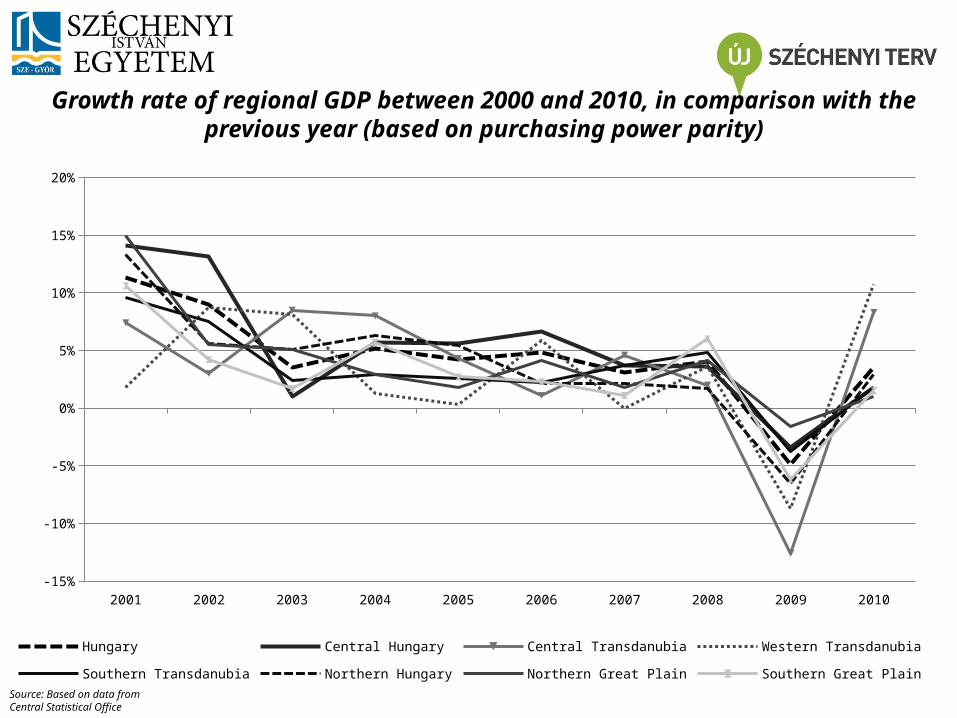
Growth rate of regional GDP between 2000 and 2010, in comparison with the previous year (based on purchasing power parity)
2001 2002 2003 2004 2005 2006 2007 2008 2009 2010-15%
-10%
-5%
0%
5%
10%
15%
20%
Hungary Central Hungary Central Transdanubia Western Transdanubia Southern Transdanubia
Northern Hungary Northern Great Plain Southern Great Plain
Source: Based on data from Central Statistical Office

• Based on the analysis, the categorization of different regions turned out to
be the following:
• Budapest: Positive territorial and structural factor, higher than average
dynamics
• Pest county: Positive regional, negative sectoral factor, higher than
average dynamics
• Central Transdanubia: Negative regional and structural factor, less than
average dynamics
Dynamics of national economic sectors

• Western Transdanubia
• Negative regional and structural factor, less than average dynamics. The sectoral factor’s absolute
value is only higher in this region than the regional factor.
• Southern Transdanubia:
• Negative regional and structural factor, less than average dynamics
• Northern Hungary:
• Negative regional and structural factor, less than average dynamics
• Northern Great Plain
• Negative regional and structural factor, less than average dynamics
• Southern Great Plain:
• Negative regional and structural factor,
less than average dynamics
Dynamics of national economic sectors
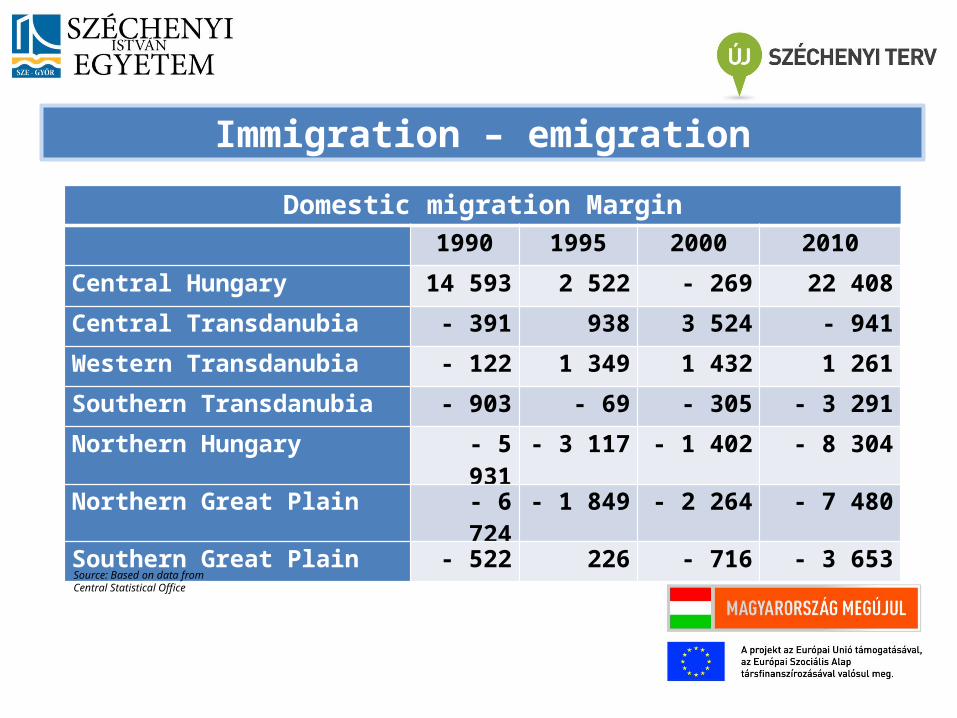
Immigration – emigration
Domestic migration Margin 1990 1995 2000 2010
Central Hungary 14 593 2 522 - 269 22 408
Central Transdanubia - 391 938 3 524 - 941
Western Transdanubia - 122 1 349 1 432 1 261
Southern Transdanubia - 903 - 69 - 305 - 3 291
Northern Hungary - 5 931 - 3 117 - 1 402 - 8 304
Northern Great Plain - 6 724 - 1 849 - 2 264 - 7 480
Southern Great Plain - 522 226 - 716 - 3 653
Source: Based on data from Central Statistical Office

Employment - unemployment
Number of employed people in regions, 1992-2011 (thousand person)
Source: Based on data from Central Statistical Office

Number of employed people in economically active ones, in regions, 1992-2011 (thousand person)
Source: Based on data from Central Statistical Office
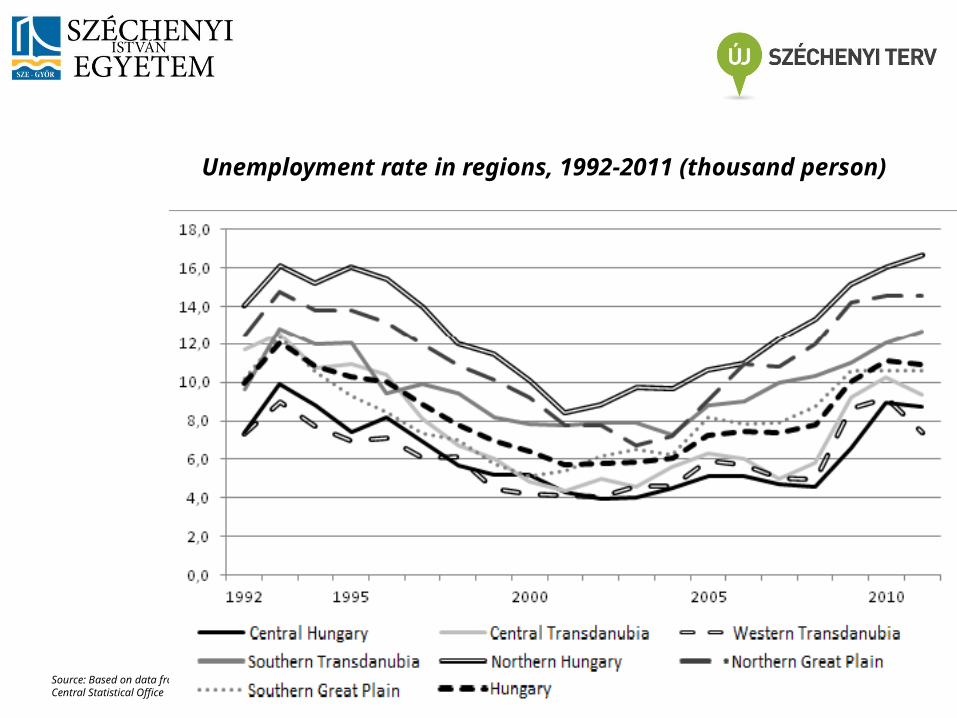
Unemployment rate in regions, 1992-2011 (thousand person)
Source: Based on data from Central Statistical Office
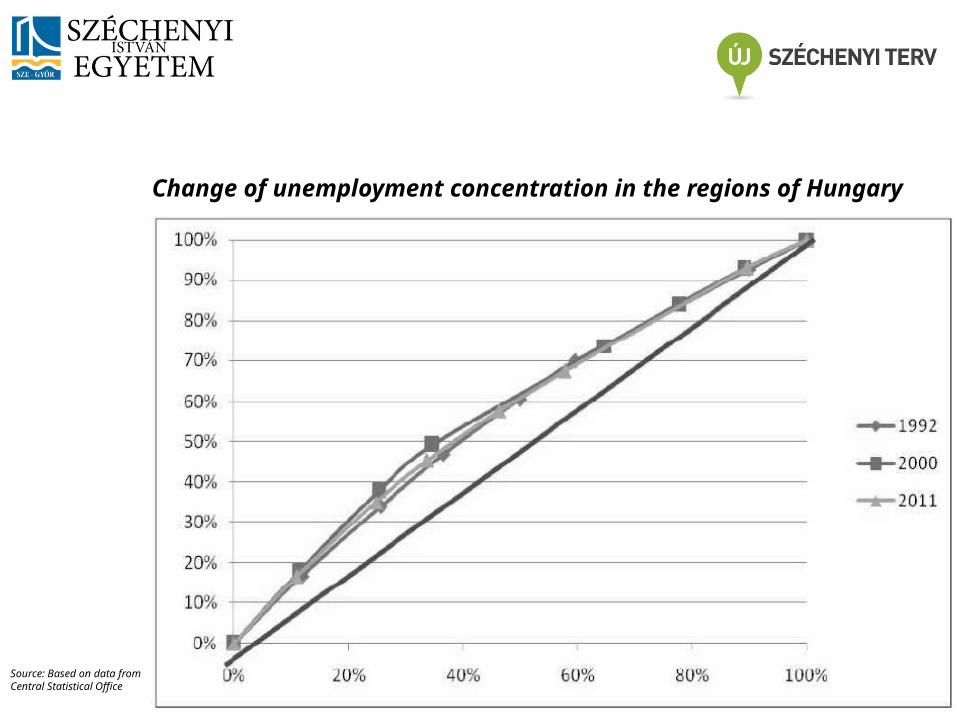
Change of unemployment concentration in the regions of Hungary
Source: Based on data from Central Statistical Office

Number of graduate employed population in ratio to employed population (1992-2011) (%)
Source: Based on data from Central Statistical Office
High education

Number and expenses of research and development institutions (2010)
Source: Based on data from Central Statistical Office
Number of R&D
institutions
Cost (million
Ft)
Cost for one institution (million Ft)
Expenditures (million Ft)
Expenditures for one
institution (million Ft)
Central Hungary 1 471 179 988 122,4 202 589 137,7Central Transdanubia 203 14 814 73 16 477 81,2Western Transdanubia
256 13 109 51,2 15 532 60,7
Southern Transdanubia
203 7 417 36,5 7 928 39,1
Northern Hungary 191 9 970 52,2 11 354 59,4Northern Great Plain 307 22 949 74,8 27 321 89Southern Great plain 352 21 074 59,9 23 617 67,1
R&D

Summary
• Increasing trend in differences
• Region of capital differs a lot
• Nearest data to national average: Western, Central Transdanubia, Northern
Hungary
• Backward places: Great Plain
• Basis of picking up methods to moderate economy (opposite example:
NFT vs. ÚMFT)

Thank you for attention!