Economic Development Survival Metrics
65
Economic Development Survival Metrics Presented by
-
Upload
atlas-advertising -
Category
Business
-
view
588 -
download
1
Transcript of Economic Development Survival Metrics

Economic Development Survival Metrics
Presented by

Your Hosts
Guillermo Mazier – Director, Strategic Accounts– Former economic developer and tourism marketer for the Costa Rican
Investment and Trade Development Board– Managed economic development and tourism campaign for Tortugero, CR– Industry speaker, content strategy and digital marketing specialist
www.twitter.com/atlasad
Tim Terrentine – Executive VP, Managing Director of Consultant Connect– Focused on the support, education and growth of small businesses in the
region– Serves as President of the Kalamazoo Regional Chamber of Commerce– Among the industry’s leading thinkers in leadership based economic
development, accountability and impact.

Introducing Atlas
1. Denver-based marketing services company, specializing in economic development
2. Founded in 2001, with 27 employees
3. Has worked with more communities than any other economic development marketing services firm in the past 10 years: 160+ economic development clients in 43 states and 6 countries
4. Specialize in providing branding, marketing planning, digital marketing, and GIS enabled websites, all for economic development
5. Pioneered the industry’s first metrics based benchmarking approach for marketing, business attraction, and business retention: High Performance Economic Development Marketing
6. IEDC’s High Performance Economic Development Marketing Partner
7. Frequent public speaker and lead speaker on benchmarking marketing, business attraction, and business retention programs, as well as on branding, research, digital marketing, websites, and GIS.

Presenting from Phoenix, AZ
View the slides, continue the dialogue
• Continue the Conversation: – Follow us on Twitter:
www.twitter.com/AtlasAd – Tweet questions using hashtag
#ASKATLAS – Join High Performance Economic
Development LinkedIn Group • View and share the slides with your
colleagues (available now): www.slideshare.com/wright0405
Outline
1. Introductions
2. The Metrics Situation in Economic Development
3. The Need for Metrics in Economic Development
4. What Happens if We Don’t Use Metrics
5. How to Put Metrics into Practice
6. Southwest Michigan First – Authentic Accountability
7. How to Get Your Community’s Report
8. Wrap up/Questions
Poll Question: What is your primary function in your organization?

Poll Question: As a practitioner, how much do you think you impact the
overall economic activity in your area?
The Metrics Situation in Economic Development

History of Metrics for Economic Development
In 2015, the general public still doesn’t know the value of
what we do
EDOs have been measuring their
performance for years
However, with differing viewpoints, metrics have
gotten muddy and misunderstood
In 2011, Atlas put together its first survey of EDO outcomes, to assist
EDOs in planning their marketing, business
attraction, and business retention programs
2011
In 2014, IEDC published its “Making it Count”
Metrics for High Performing EDOs
2014
2015

175 < 25,000 Average companies served
Typical number of establishments
in a community
Source: Atlas 2014 Benchmarking Study
EDOs service companies that comprise a very small percentage of their economies.

Why We Need Metrics for Economic Development

There is Too Much Discussion About Whether or Not Economic Developers are Essential, While Interest in Economic Development Organizations Wanes
Implications if we don’t use Metrics

Budget Level
LOW JOBS
ANNOUNCED,
2014
HIGH JOBS
ANNOUNCED,
2014
Under $100,000 20 243
$100,000 to $249,000 2 1,500
$250,000 to $499,000 5 5,000
$500,000 to $999,000 4 4,283
$1,000,000 to $2,500,000 35 8,000
Over $2,500,000 6 16,835
Source: Atlas Report - Why Metrics Matter, 2014
Average difference:
978x
The Spread Between High and Low Performing Organizations is Staggering, at All Sizes

How to Put Metrics Into Practice
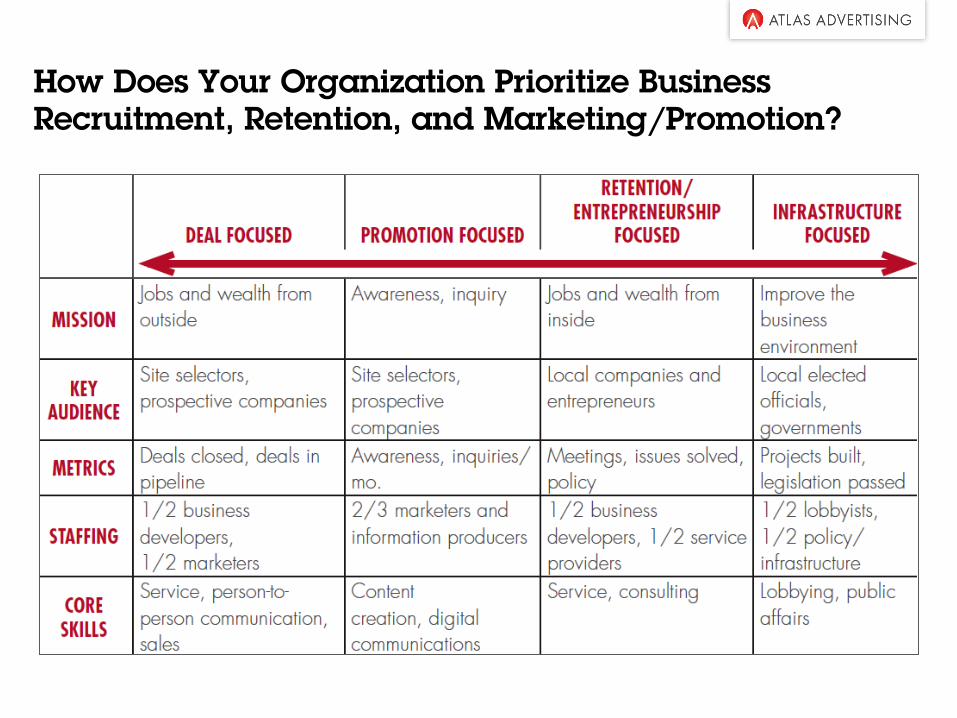
How Does Your Organization Prioritize Business Recruitment, Retention, and Marketing/Promotion?

Four Ways the International Economic Development
Council Defines High Performance
1. Internal Segment (Employee
satisfaction, funding sources)
2. ED Program Segment (Business Attraction, Business Retention, Business Creation)
3. Relationship Management Segment (Relationships with internal and external stakeholders)
4. Community Segment (Community well
being, in terms of demographics, workforce, household income, etc.)

Atlas High Performance Economic Development Focuses on the Relationship Management Segment, plus Outcomes from those Relationships
1. Internal Segment (Employee satisfaction,
funding sources
2. ED Program Segment (Business Attraction, Business Retention, Business Creation)
3. Relationship Management Segment (Relationships with internal and external stakeholders)
4. Community Segment (Community well being,
in terms of demographics, )
Outcomes for jobs announced and capital investment announced

Start With the Big 4, Then Get More

Poll Question: Should we use outcomes to measure ourselves?

Poll Question: Did your organization set measurable goals for your
marketing, business development, and business retention programs this year (2015)?

Poll Question: What is stopping you from implementing metrics for your
role within the organization?

Steps to Put High Performance into Practice
1. Discuss your organizational priorities for marketing, business recruitment, and business retention, and start with a simple score card
2. Assign metrics to certain staff 3. Set a plan to influence that metric for each staff person 4. Make the plan transparent to your stakeholders 5. Execute, report, and adjust

What Type of Organization Do You Want to be When You Grow Up?

Assigning Metrics to Staff: What Metrics Does Each Function Influence?
WEB VISITS INQUIRIES /CONVERSATIONS
JOBS ANNOUNCED
CAPITAL INVESTMENT ANNOUNCED
CEO/Executive X X X X Business Developer X X X
Marketer X X
Researcher X

Setting a Plan so That Each Staff Person Can Drive High Performance
BUILD THIS

Economic Development CEO / Executive
Metrics He/She Should Influence 1. All Role He/She Plays 1. Setting the vision for the organization 2. Creating a culture of accountability and transparency 3. Setting the parameters for a metrics score card 4. Allocating staff and resources 5. Building capacity to ensure board engagement
Sphere of Influence
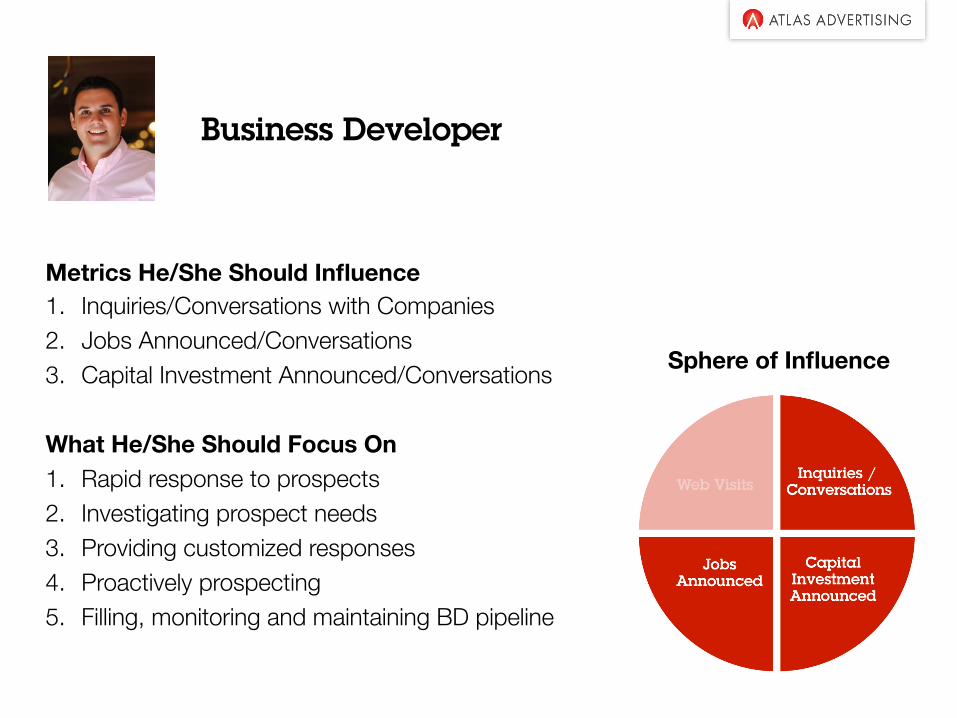
Business Developer
Metrics He/She Should Influence 1. Inquiries/Conversations with Companies 2. Jobs Announced/Conversations 3. Capital Investment Announced/Conversations What He/She Should Focus On 1. Rapid response to prospects 2. Investigating prospect needs 3. Providing customized responses 4. Proactively prospecting 5. Filling, monitoring and maintaining BD pipeline
Sphere of Influence

Marketer
Metrics He/She Should Influence 1. Website visits 2. Ratio of website visits/inquiries What He/She Should Focus On 1. Creating opportunities for BD, through marketing 2. Driving traffic to the website via search engines,
social media, email 3. Keeping content fresh and relevant 4. Leveraging the latest marketing tools and
software to create a competitive advantage for her community
Sphere of Influence

Researcher/Economist
Metrics He/She Should Influence 1. Website Visits 2. Jobs Announced 3. Capital Investment Announced Role He/She Plays 1. Creating outstanding and differentiated content for
all teams 2. Providing customized data to the business
developer 3. Managing and reporting on benchmarked data 4. Leveraging the latest data sources and tools
Sphere of Influence

Benchmark Your Community Using Atlas’ High
Performance Economic Development
1. Take the survey here: 2. View your report online: here

A Case Study on Metrics: SOUTHWEST MICHIGAN FIRST
"The person who says it cannot be done should not interrupt the person doing it.” - Chinese Proverb
Tim Terrentine, Vice President

AUTHENTIC
TIM TERRENTINE execu0ve vice president | Southwest Michigan First
managing director | Consultant Connect
@#mterren#ne www.catalystconnect.org
Atlas Adver#sing Metrics Webinar (2015)
ACCOUNTABILITY

The Economic Development Profession

Source: U.S. Census, Southwest Michigan First
ECONOMIC DEVELOPMENT
Customers Genera0ons Expecta0ons
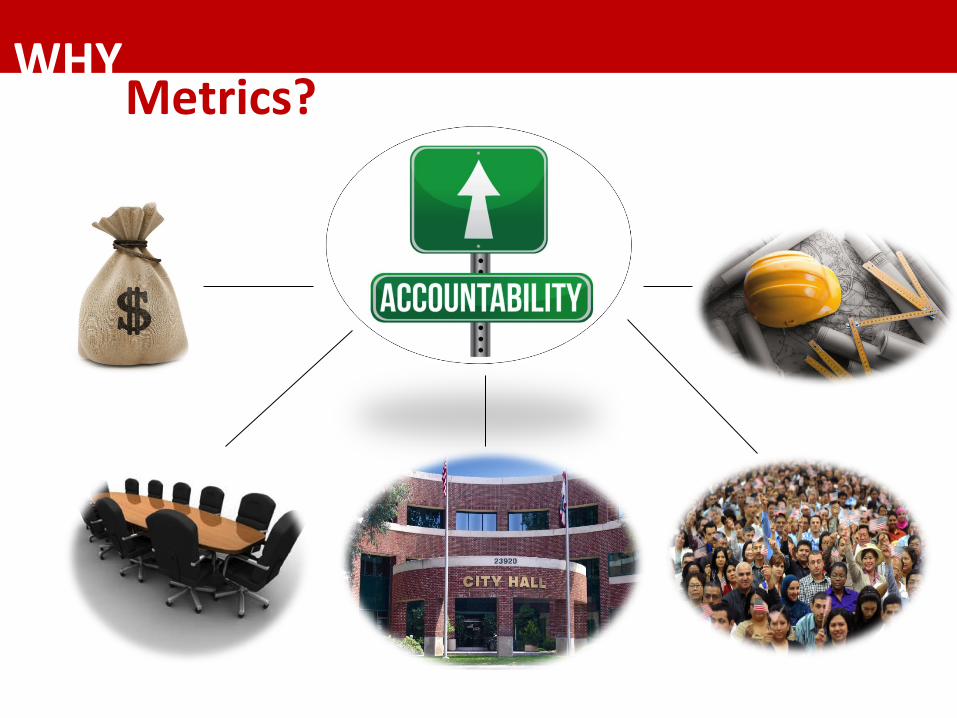
WHY Metrics?

NO Metrics?
Your story will be told…Hopefully by YOU!

IMPLEMENTING Metrics?
TALENT
FOCUS
AUTHENTICITY
AUTHENTIC ACCOUNTABILITY

HOW WE GOT HERE

In 2011, Governor Rick Snyder’s ini#a#ves divided the state into various regions. The seven coun#es of Southwest Michigan were joined together. Southwest Michigan First was selected to lead our region’s collabora#on.
HOW WE GOT HERE

THE IMPORTANCE OF DIVERSITY
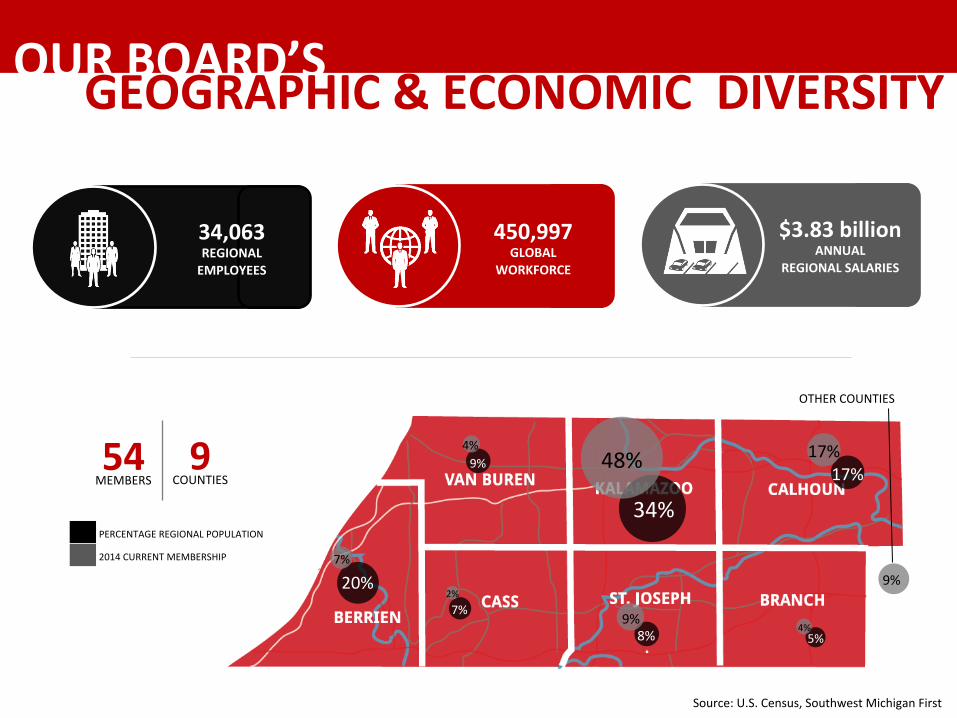
54 MEMBERS
9 COUNTIES
PERCENTAGE REGIONAL POPULATION
2014 CURRENT MEMBERSHIP
Source: U.S. Census, Southwest Michigan First
48%
34%
17%
20% 7%
9% 4%
7% 2%
5% 4% .
9% 8%
17%
9%
OTHER COUNTIES
OUR BOARD’S GEOGRAPHIC & ECONOMIC DIVERSITY
$3.83 billion ANNUAL
REGIONAL SALARIES
450,997 GLOBAL
WORKFORCE
34,063 REGIONAL EMPLOYEES

BUILDING A CULTURE OF RESPONSIBILITY

BUILDING A CULTURE OF RESPONSIBILITY REQUIRES
Commitment Consistency Communica0on
√ √ √

ESTABLISH A SYSTEM THAT WORKS FOR YOU
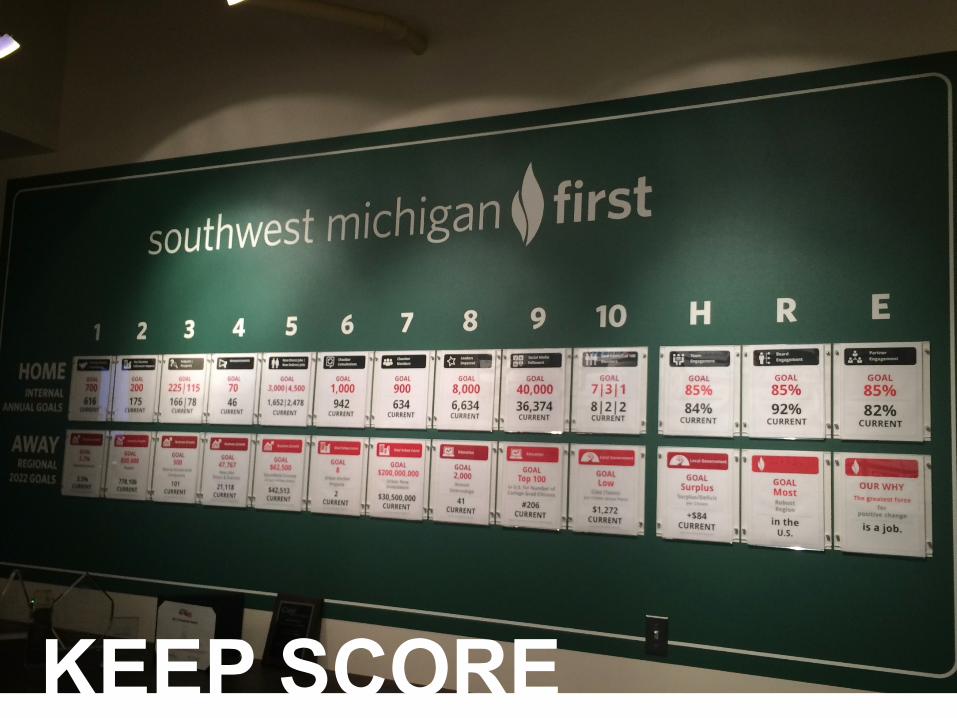
KEEP SCORE

REGIONAL
SCO
RECA
RD

MEASURING THE REGION

BUSINESS GRO
WTH
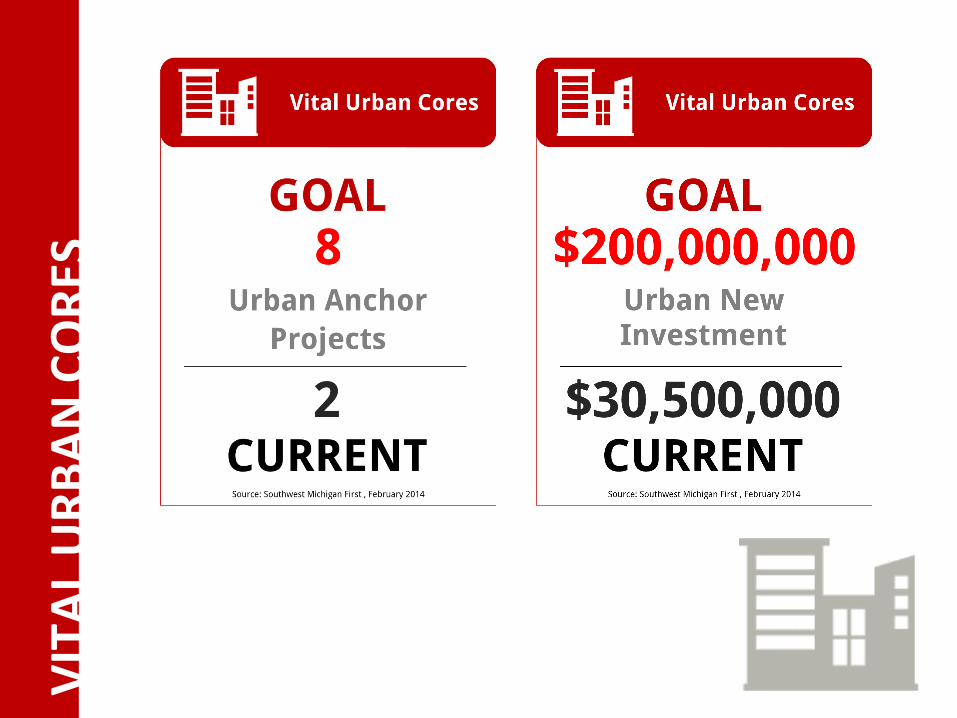
VITA
L URB
AN CORE
S

EDUCA
TION
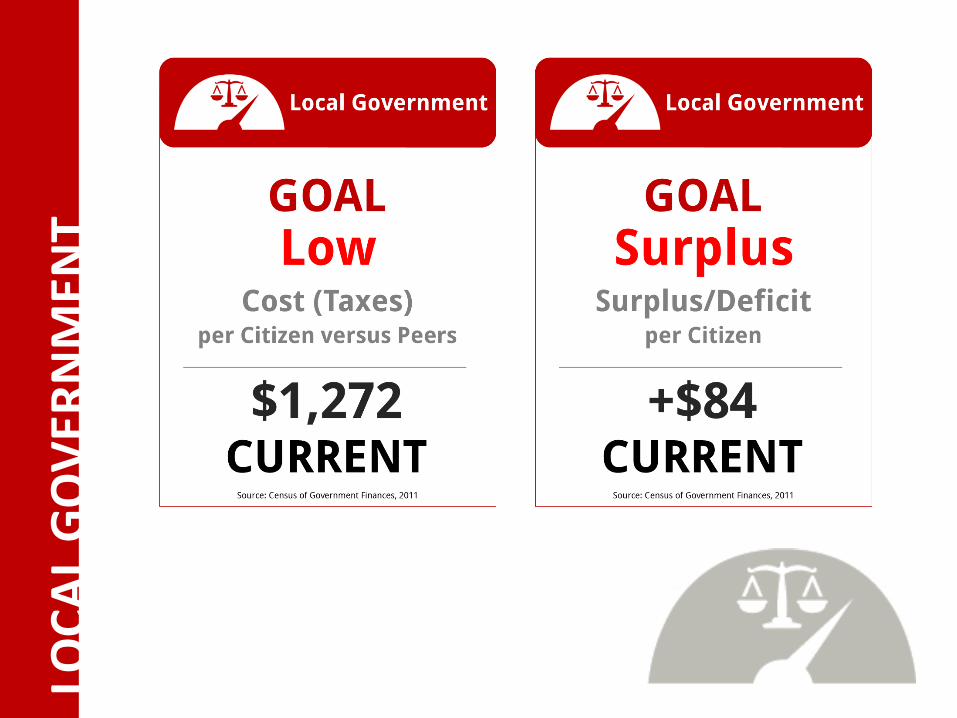
LOCA
L GOVE
RNMEN
T
MEASURING RELATIONSHIPS

RELA
TIONSH
IPS

COMMUNITY & QUALITY OF LIFE MEASURING
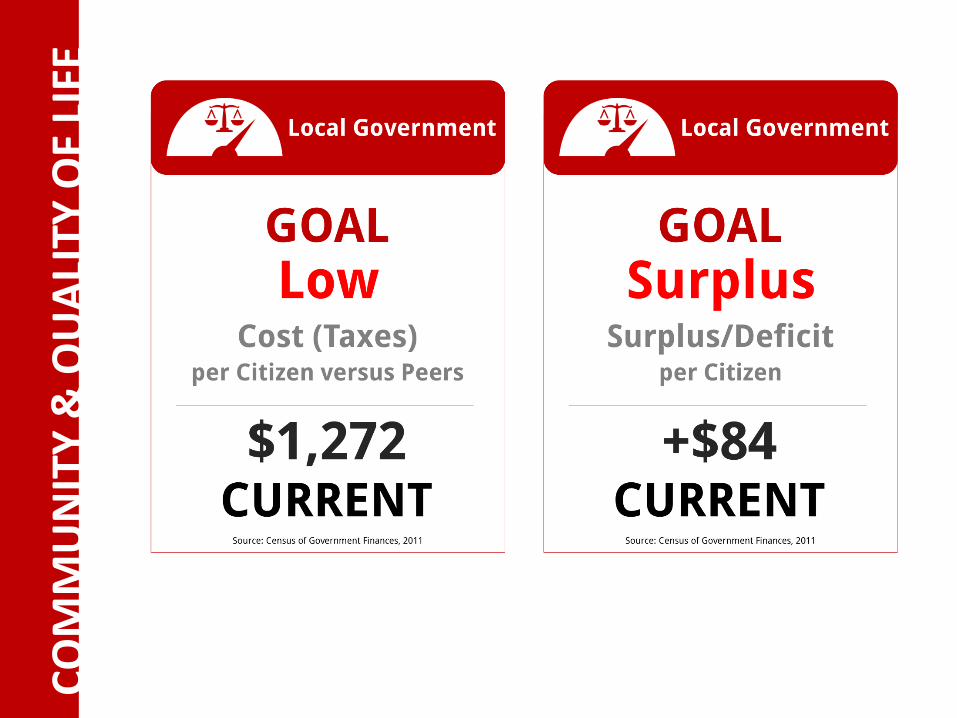
COMMUNITY & QUAL
ITY OF LIFE
Tim Terren0ne #[email protected] 269.553.9588 @#mterren#ne www.consultantconnect.org www.southwestmichiganfirst.com
HOW TO CONTACT ME
Question for Tim: What's the conversation like with your board when you are
behind with your metrics?

Question for Tim: Why did you initiate a metrics program in the first place?
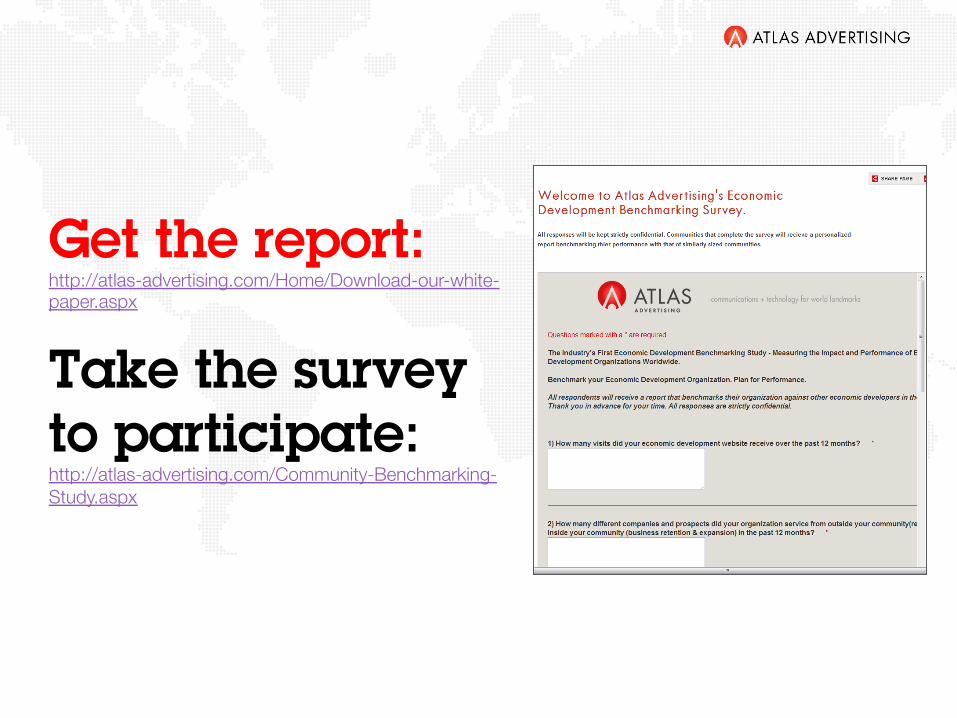
Get the report: http://atlas-advertising.com/Home/Download-our-white-paper.aspx
Take the survey to participate: http://atlas-advertising.com/Community-Benchmarking-Study.aspx "

Questions

Thank you! Contact information: Guillermo Mazier 303.292.3300 x 232 929 Broadway Denver, CO 80203 [email protected] www.Atlas-Advertising.com LinkedIn Profile | LinkedIn Group | Twitter | Blog | Slideshare