Economic Development & Hydrocarbons: Old or New Challenges? · Lisa Viscidi Director, Energy,...
22
Economic Development & Hydrocarbons: Old or New Challenges? 15.10.15
Transcript of Economic Development & Hydrocarbons: Old or New Challenges? · Lisa Viscidi Director, Energy,...
Economic Development & Hydrocarbons: Old or New Challenges?
15.10.15

Macroeconomic Impacts of the Oil & Gas Industry

Oil production and oil dependency
Source: Unctad, IMF; EIA (data from 2014)
Some of the top oil producers are also the most oil-dependent.
Countries % of GDP % of Exports Oil Production Ranking China 0% 1% 4 United States 1% 8% 1 Brazil 1% 9% 9 Mexico 3% 11% 10 Canada 6% 22% 5 Colombia 7% 52% 19 Norway 10% 36% 15 Iran 13% 60% 7 Nigeria 14% 81% 13 Russian Federation 17% 61% 3 Qatar 23% 37% 14 Venezuela 31% 79% 12 Saudi Arabia 38% 81% 2 Iraq 40% 98% 8 United Arab Emirates 46% 51% 6 Kuwait 52% 83% 11

Oil price volatility Oil dependency makes countries more vulnerable to swings in international oil prices. The most oil-dependent countries have seen large fluctuations in terms of trade in line with oil price movements.
Source: World Bank; EIA
0
20
40
60
80
100
120
0
50
100
150
200
250
300
2000 2001 2002 2003 2004 2005 2006 2007 2008 2009 2010 2011 2012 2013 2014
Terms of Trade (2000=100)
United States Saudi Arabia China IraqMexico Kuwait Venezuela Nigeria
US$ Brent Spot Price
Index
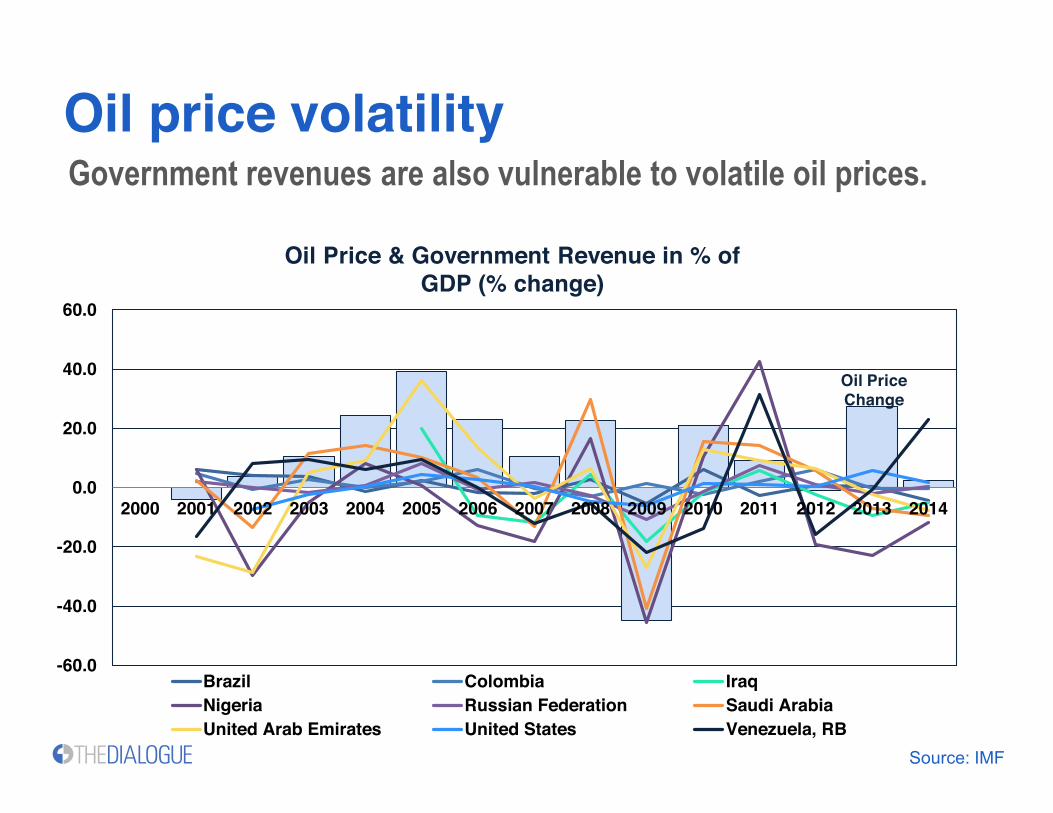
Oil price volatility
-60.0
-40.0
-20.0
0.0
20.0
40.0
60.0
2000 2001 2002 2003 2004 2005 2006 2007 2008 2009 2010 2011 2012 2013 2014
Brazil Colombia IraqNigeria Russian Federation Saudi ArabiaUnited Arab Emirates United States Venezuela, RB
Oil Price Change
Oil Price & Government Revenue in % of GDP (% change)
Source: IMF
Government revenues are also vulnerable to volatile oil prices.

Dutch disease
0200400600800
1,0001,200
2000
2001
2002
2003
2004
2005
2006
2007
2008
2009
2010
2011
2012
2013
2014
USA
0
100
200
300
400
2000
2001
2002
2003
2004
2005
2006
2007
2008
2009
2010
2011
2012
2013
2014
Saudi Arabia
0500
1,0001,5002,0002,500
2000
2001
2002
2003
2004
2005
2006
2007
2008
2009
2010
2011
2012
2013
2014
China
020406080
100120
2000
2001
2002
2003
2004
2005
2006
2007
2008
2009
2010
2011
2012
2013
2014
Kuwait
050
100150200250300350
2000
2001
2002
2003
2004
2005
2006
2007
2008
2009
2010
2011
2012
2013
2014
Mexico
0
20
40
60
80
100
2000
2001
2002
2003
2004
2005
2006
2007
2008
2009
2010
2011
2012
2013
2014
Venezuela
Unit: Billion $US Source: Unctad
Primary Manufacturing
Oil dependent countries are highly concentrated in primary rather than manufacturing goods exports.

How to avoid the pitfalls
• Sovereign wealth fund: Norway • Fiscal rules: Chile • Hedging: Mexico
In general, the key to addressing large fluctuations in oil prices is to smooth out spending.

Sovereign wealth fund
Sovereign wealth funds insulate the domestic economy from commodity price fluctuations and avoid inflation & Dutch disease. Norway’s Government Pension Fund continues to grow in value, even when oil prices drop.
* January – August 2015 Source: Norwegian Petroleum Directorate, Norwegian Ministry of Petroleum & Energy, US Energy Information Administration, Norges Bank
6,431
311.6
57.81
0
20
40
60
80
100
120
0
1,000
2,000
3,000
4,000
5,000
6,000
7,000 Market ValueNorway'sGovernmentPension FundGlobal - left axis
Net governmentcash flow frompetroleumactivities - leftaxis
Europe BrentSpot Price FOB($/barrel)- rightaxis
Billion kroner US$

0.0
0.5
1.0
1.5
2.0
2.5
3.0
3.5
4.0
4.5
-20
-15
-10
-5
0
5
10
15
2005 2006 2007 2008 2009 2010 2011 2012 2013 2014
Public Net Debt (% of GDP)-leftaxisEconomic and Social StabilizationFund Balance (% of GDP)-left axisCopper Prices-right axis
Fiscal Rules
Source: COCHILCO (Ministerio de Minería de Chile) & Oficina de la Deuda Pública, Ministerio de Hacienda & IMF
% US$
A fiscal rule imposes a constraint on fiscal policy through numerical limits on budgetary aggregates. Chile’s fiscal rule reduces macroeconomic uncertainty, lowers volatility and protects social programs during cyclical downturns.
Note: Public Net Debt is public sector liabilities minus public sector assets.

Hedging
0
20
40
60
80
100
120
140
160
Jan-
07M
ay-0
7Se
p-07
Jan-
08M
ay-0
8Se
p-08
Jan-
09M
ay-0
9Se
p-09
Jan-
10M
ay-1
0Se
p-10
Jan-
11M
ay-1
1Se
p-11
Jan-
12M
ay-1
2Se
p-12
Jan-
13M
ay-1
3Se
p-13
Jan-
14M
ay-1
4Se
p-14
Jan-
15M
ay-1
5Se
p-15
Jan-
16M
ay-1
6Se
p-16
Mexico's Oil Hedging Program
WTI MME (Mexican Maya Crude-Oil Mix) Hedge
US$/barrel
NYMEX future price
Hedging uses market-based instruments to manage commodity price volatility. Mexico’s finance ministry hedges the country’s exports to ensure a steady revenue stream.

Local and Microeconomic Impacts of the Oil & Gas Industry

Local level revenue distribution
Source: Instituto Nacional de Estadística de Bolivia, Unidad de Análisis de Políticas Sociales, and YPFB
In most countries, oil-producing regions receive a larger share of oil revenue to compensate for local impacts. This improves incomes for producing regions, but may lead to higher inequality.
05
10152025303540
0.0 5.0 10.0 15.0 20.0 25.0 30.0
# of
Hyd
roca
rbon
Wel
ls (Y
PFB)
GDP Share (%)
Hydrocarbon Production and GDP Share by Region
Santa Cruz
La Paz Cochabamba
Tarija Chuquisaca
Oruro Pando
Beni
Potosi
30.035.040.045.050.055.060.065.0
0.0 10.0 20.0 30.0
Pove
rty R
atio
(%)
GDP Share (%)
Poverty Ratio and GDP Share by region
Santa Cruz
La Paz
Tarija
Cochabamba Oruro
Potosi
Chuquisaca
Pando
Beni

Local conflicts over natural resources
4%
28%
26% 4%
20%
18%
NorthAmerica
Oceania
SouthAmerica
CentralAmerica &theCaribbean
Cases by location 2% 4% 4%
6%
10%
4%
22%
34%
4% 2%
8%
Zinc
Silver
Iron
Nickel
Coal
Shale Oil
Copper
Gold
Uranium
Diamonds
Platinum
Cases by Primary Commodity
Source: Proceedings of the US National Academy of Sciences (PNAS)
There are many conflicts over oil & gas as well as other extractive industries projects all over the world, leading to large investment losses.

Sources of local conflicts
• Economic demands
• Land rights • Environmental
concerns
The reasons behind protests vary greatly by country.

Corruption Corruption and weak local government capacity may prevent local communities from reaping the benefits from oil investment.
0%
20%
40%
60%
80%
100%
120%
0 20 40 60 80 100
Oil
Expo
rts in
% o
f Tot
al E
xpor
ts
Corruption Score (Transparency International)
SAU KWT
COL
VEN
IRQ
NGA
IRN UAE
QAT NOR
CAN
USA BRA MEX
CHN
Source: Transparency International, IMF, Unctad, 2014
0%
10%
20%
30%
40%
50%
60%
0 20 40 60 80 100
Oil
Expo
rts in
% o
f GDP
Corruption Score (Transparency International)
IRQ
VEN
NGA IRN
SAU
QAT
UAE
KWT
NOR CAN
USA BRA
COL
MEX
CHN
Oil Exports in % of Total Exports and Corruption Score
Oil Exports in % of GDP and Corruption Score

Mitigating local conflicts
• Increase Government Intermediation • Expand Human Capital • Improve Local Content • Improve Environmental Regulation • Invest in Sustainable Projects
Some measures have proved successful in improving relations with local communities and increasing the microeconomic benefits of oil industry activities.

Increase Government Intermediation
• Increase institutional capacity to improve dialogue with communities • Clear legal processes • Provide more information for communities and government officials • Clarify the role of companies versus the role of the state
The key to reducing conflicts appears to be proactive and sustained government-led engagement from the start of each project.

Expand Human Capital Developing local human capital & service suppliers can mitigate conflicts and enhance benefits for local communities. Mexico provides an interesting case study.
0 400,000,000 800,000,000 1,200,000,000
Geothermal Energy Innovation Center
Solar Energy Innovation Center
Wind Energy Innovation Center
Institutional Strengthening for Energy…
Science and Technology Projects for Border Issues
Mexican Postdoctoral Projects in Sustainable…
Non-Fossil Fuel Technology Demands
Energy Sustainability Innovation Labs
Bioenergy Innovation Center
Ocean Energy Innovation Center
EstimatedHumanResourceDevelopmentInvestment
TotalInvestmentApproved
Support for Human Resource Formation from Mexico's Sustainability Fund in pesos (Jan 2013-Jun 2014)
Source: Programa Estratégico de Formación de Recursos Humanos (PEFRHME)

Improve Local Content
• Norway (positive example): • Prioritized technology transfer to develop
competitiveness of local industry suppliers • Encouraged R&D partnerships through tax incentives • Timing and international context were important
• Brazil (negative example): • Onerous & complicated local content requirements
were created without enough preparation for local industries to meet the standards.
While local content requirements can be challenging, they also present an opportunity for companies to create jobs by developing local supply chains.

Improve Environmental Regulation Upholding environmental standards is critical to gaining confidence of local communities. In the US, regulation for the shale industry has been a critical challenge, but a body of best practices has been established.
• Establish baseline of water quality before drilling starts • Separate environmental regulator & licensing agency • Integrity of well construction • Transparency on fracking fluids • Address air pollution

Invest in sustainable projects
• Invest in education, research, training
• Energy subsidies are less efficient than direct transfers
• Extractive Industries Transparency Initiative (EITI) can provide transparency about distribution of rents
Investment and tax revenues should be used to promote long-term local economic development.
Source: International Energy Agency

Thank you
Lisa Viscidi
Director, Energy, Climate Change & Extractive Industries Program
Inter-American Dialogue