Economic Development for Fiscal Years 2020 and 2021
79
ECONOMIC DEVELOPMENT - 77 -
Transcript of Economic Development for Fiscal Years 2020 and 2021

ECONOMIC DEVELOPMENT
- 77 -

||||||
STATE OF HAWAII VARIANCE REPORT REPORT V61 PROGRAM TITLE: ECONOMIC DEVELOPMENT 12/7/20 PROGRAM-ID: PROGRAM STRUCTURE NO: 01
FISCAL YEAR 2019-20 THREE MONTHS ENDED 09-30-20 NINE MONTHS ENDING 06-30-21
PART I: EXPENDITURES & POSITIONS BUDGETED ACTUAL + CHANGE_ % BUDGETED ACTUAL + CHANGE_ % BUDGETED ESTIMATED + CHANGE_ %
RESEARCH & DEVELOPMENT COSTS POSITIONS EXPENDITURES ($1,000's)
OPERATING COSTS POSITIONS 510.00 401.00 - 109.00 21 509.00 391.00 - 118.00 23 509.00 407.00 - 102.00 20 EXPENDITURES ($1000's) 350,447 275,937 - 74,510 21 99,789 52,786 - 47,003 47 254,478 181,145 - 73,333 29
TOTAL COSTS POSITIONS 510.00 401.00 - 109.00 21 509.00 391.00 - 118.00 23 509.00 407.00 - 102.00 20 EXPENDITURES ($1000's) 350,447 275,937 - 74,510 21 99,789 52,786 - 47,003 47 254,478 181,145 - 73,333 29
| FISCAL YEAR 2019-20 | FISCAL YEAR 2020-21 | | PLANNED ACTUAL | + CHANGE_ | % | PLANNED ESTIMATED | + CHANGE_ | % |
PART II: MEASURES OF EFFECTIVENESS | | | | | | | 1. GROSS STATE PRODUCT (2012 CONSTANT $ IN MILLIONS) | 81410 77840 | - 3570 | 4 | 82468 73994 | - 8474 | 10 | 2. REAL PERSONAL INCOME (2009 CONSTANT $ IN MILLIONS) | 62304 64605 | + 2301 | 4 | 63363 63392 | + 29 | 0 | 3. UNEMPLOYMENT RATE (%, TENTHS) | 2.5 6.9 | + 4.4 | 176 | 2.8 9.6 | + 6.8 | 243 | 4. TOTAL EMPLOYMENT (THOUSANDS) | 685 617 | - 68 | 10 | 691 596 | - 95 | 14 | 5. GROSS STATE PRODUCT (CURRENT $ IN MILLIONS) | 95545 91112 | - 4433 | 5 | 98985 88201 | - 10784 | 11 | 6. PERSONAL INCOME (CURRENT $ IN MILLIONS) | 81984 83778 | + 1794 | 2 | 84976 83431 | - 1545 | 2 |
- 78 -

PROGRAM TITLE: PROGRAM TITLE: ECONOMIC DEVELOPMENTECONOMIC DEVELOPMENT 010101
VARIANCE REPORT NARRATIVE FY 2020 AND FY 2021
PROGRAM TITLE: ECONOMIC DEVELOPMENT
PART I - EXPENDITURES AND POSITIONS
Details of the position and expenditure variances are best examined at the lowest program level.
PART II - MEASURES OF EFFECTIVENESS
See Lowest Level Programs for additional information.
- 79 -

||||
STATE OF HAWAII VARIANCE REPORT REPORT V61 PROGRAM TITLE: BUSINESS DEVELOPMENT 12/5/20 PROGRAM-ID: PROGRAM STRUCTURE NO: 0101
FISCAL YEAR 2019-20 THREE MONTHS ENDED 09-30-20 NINE MONTHS ENDING 06-30-21
PART I: EXPENDITURES & POSITIONS BUDGETED ACTUAL + CHANGE_ % BUDGETED ACTUAL + CHANGE_ % BUDGETED ESTIMATED + CHANGE_ %
RESEARCH & DEVELOPMENT COSTS POSITIONS EXPENDITURES ($1,000's)
OPERATING COSTS POSITIONS 66.00 57.00 - 9.00 14 66.00 56.00 - 10.00 15 66.00 59.00 - 7.00 11 EXPENDITURES ($1000's) 12,717 14,067 + 1,350 11 15,477 14,048 - 1,429 9 10,819 10,369 - 450 4
TOTAL COSTS POSITIONS 66.00 57.00 - 9.00 14 66.00 56.00 - 10.00 15 66.00 59.00 - 7.00 11 EXPENDITURES ($1000's) 12,717 14,067 + 1,350 11 15,477 14,048 - 1,429 9 10,819 10,369 - 450 4
| FISCAL YEAR 2019-20 | FISCAL YEAR 2020-21 | | PLANNED ACTUAL | + CHANGE_ | % | PLANNED ESTIMATED | + CHANGE_ | % |
PART II: MEASURES OF EFFECTIVENESS | | | | | | | 1. % INCREASE IN EXPORTS DUE TO PROG PARTICIPATION | 10 10 | + 0 | 0 | 10 10 | + 0 | 0 | 2. $ AMOUNT OF DIRECT EXPEN - FILM/TV PROD (MIL) | 250 405 | + 155 | 62 | 250 200 | - 50 | 20 | 3. %VALUE INCR OF CARGO IN/OUT OF FTZ (EXCL SUBZONES) | 3 7.8 | + 4.8 | 160 | 3 3 | + 0 | 0 | 4. TOTAL VISITOR EXPENDITURES ($ BILLIONS) | 18.7 13.4 | - 5.3 | 28 | 19.35 7.2 | - 12.15 | 63 |
- 80 -

PROGRAM TITLE: PROGRAM TITLE: BUSINESS DEVELOPMENTBUSINESS DEVELOPMENT 01 0101 01
VARIANCE REPORT NARRATIVE FY 2020 AND FY 2021
PROGRAM TITLE: BUSINESS DEVELOPMENT 01 01
PART I - EXPENDITURES AND POSITIONS
Details of the position and expenditure variances are best examined at the lowest program level.
PART II - MEASURES OF EFFECTIVENESS
See Lowest Level Programs for additional information.
- 81 -

|||
|||
|||
STATE OF HAWAII VARIANCE REPORT REPORT V61 PROGRAM TITLE: STRATEGIC MARKETING AND SUPPORT 12/5/20 PROGRAM-ID: BED-100 PROGRAM STRUCTURE NO: 010101
FISCAL YEAR 2019-20 THREE MONTHS ENDED 09-30-20 NINE MONTHS ENDING 06-30-21
PART I: EXPENDITURES & POSITIONS BUDGETED ACTUAL + CHANGE_ % BUDGETED ACTUAL + CHANGE_ % BUDGETED ESTIMATED + CHANGE_ %
RESEARCH & DEVELOPMENT COSTS POSITIONS EXPENDITURES ($1,000's)
OPERATING COSTS POSITIONS 10.00 10.00 + 0.00 0 10.00 10.00 + 0.00 0 10.00 10.00 + 0.00 0 EXPENDITURES ($1000's) 5,108 5,913 + 805 16 13,988 12,767 - 1,221 9 6,105 5,597 - 508 8
TOTAL COSTS POSITIONS 10.00 10.00 + 0.00 0 10.00 10.00 + 0.00 0 10.00 10.00 + 0.00 0 EXPENDITURES ($1000's) 5,108 5,913 + 805 16 13,988 12,767 - 1,221 9 6,105 5,597 - 508 8
PART II: MEASURES OF EFFECTIVENESS 1. % INCREASE IN EXPORTS DUE TO PROG PARTICIPATION 2. $ VALUE OF TOTAL/PROJ SALES-TRADE & EXPORT PROMO 3. # NEW FIRMS ENROLLED IN ENTERPRISE ZONE PROGRAM
| FISCAL YEAR 2019-20 | PLANNED ACTUAL | + CHANGE_ | | | | | 10 10 | + 0 | | 17500 18500 | + 1000 | | 25 23 | - 2 |
| FISCAL YEAR 2020-21 % | PLANNED ESTIMATED | + CHANGE_
| | 0 | 10 10 | + 0 6 | 19000 17300 | - 1700 8 | 25 23 | - 2
| | | | |
%
0 9 8
| | | | | |
PART III: PROGRAM TARGET GROUP 1. # OF FIRMS ENROLLED IN ENTERPRIZE ZONE PROGRAM 2. #COMM-BASED ORGS, CO-OPS & SMALL BUS ASSISTED 3. # SML & MED-SIZED ENTERPRISES EXPAND/NEW TO EXPORT
| |||
250 200 35
251 312 65
| | + | + | +
| 1 |
112 | 30 |
0 56 86
| |||
250 200 35
201 500 60
| | -| + | +
49 300 25
| | | |
20 150 71
| | | |
PART IV: PROGRAM ACTIVITY 1. # INT'L BUSINESS DEVELOPMENT ACTIVITIES 2. OUTREACH ACTIVITIES 3. #FIRMS ASSISTED FOR PARTIC IN ENTERPRSE ZONES
| |||
25 10
300
25 10
330
| | + | + | +
| 0 | 0 |
30 |
0 0
10
| |||
25 10
300
25 12
300
| | + | + | +
0 2 0
| | | |
0 20 0
| | | |
- 82 -

01 01 0101 01 0101 01 0101 01 01PROGRAM TITLE: PROGRAM TITLE: PROGRAM TITLE: PROGRAM TITLE: STRATEGIC MARKETING AND SUPPORTSTRATEGIC MARKETING AND SUPPORTSTRATEGIC MARKETING AND SUPPORTSTRATEGIC MARKETING AND SUPPORT BED 100BED 100BED 100BED 100
VARIANCE REPORT NARRATIVE FY 2020 AND FY 2021
01 01 01 PROGRAM TITLE: STRATEGIC MARKETING AND SUPPORT BED 100
PART I - EXPENDITURES AND POSITIONS
FY 20 Actual expenditures are greater than the budgeted amount because it includes expenditures/encumbrances that occurred in FY 20 from non-FY 20 accounts such as prior-year accounts.� � FY 21 Expenditures for three months ended 9-30-20: variance due to $13,000,000 of non-reverting funds allotted in the first quarter but will be spent throughout the second quarter as well.� � Estimated expenditures for nine months ending 6-30-21, is net of restrictions on general funds.
PART II - MEASURES OF EFFECTIVENESS
promotion to the neighbor islands.� �
No significant variances.
PART III - PROGRAM TARGET GROUPS
Item 1. Many Enterprise Zones companies graduated from the program this year and the COVID-19 pandemic restrictions made outreach to recruit new companies very difficult.� � Item 2. Target group companies is very high and only an estimate because we assisted many companies with the Paycheck Protection Program (PPP) and Economic Injury Disaster Loan (EIDL) loans (COVID-19-related economic injury) as an U.S. Small Business Administration (SBA) resource partner this year. � � Item 3. The number of small and medium size enterprises (SME) new to export and expanding exports significantly increased due to the expanded in-person outreach efforts of the Hawaii State Trade Expansion Program (HiSTEP) to the neighbor islands.
PART IV - PROGRAM ACTIVITIES
Items 2 and 3. The number of outreach activities and number of firms assisted for participation in enterprise zones increased due to HiSTEP
- 83 -

|||||||||
|||
|||
STATE OF HAWAII VARIANCE REPORT REPORT V61 PROGRAM TITLE: CREATIVE INDUSTRIES DIVISION 12/5/20 PROGRAM-ID: BED-105 PROGRAM STRUCTURE NO: 010102
FISCAL YEAR 2019-20 THREE MONTHS ENDED 09-30-20 NINE MONTHS ENDING 06-30-21
PART I: EXPENDITURES & POSITIONS BUDGETED ACTUAL + CHANGE_ % BUDGETED ACTUAL + CHANGE_ % BUDGETED ESTIMATED + CHANGE_ %
RESEARCH & DEVELOPMENT COSTS POSITIONS EXPENDITURES ($1,000's)
OPERATING COSTS POSITIONS 14.00 9.00 - 5.00 36 14.00 9.00 - 5.00 36 14.00 9.00 - 5.00 36 EXPENDITURES ($1000's) 1,845 2,069 + 224 12 415 198 - 217 52 1,124 1,191 + 67 6
TOTAL COSTS POSITIONS 14.00 9.00 - 5.00 36 14.00 9.00 - 5.00 36 14.00 9.00 - 5.00 36 EXPENDITURES ($1000's) 1,845 2,069 + 224 12 415 198 - 217 52 1,124 1,191 + 67 6
| FISCAL YEAR 2019-20 | FISCAL YEAR 2020-21 | | PLANNED ACTUAL | + CHANGE_ | % | PLANNED ESTIMATED | + CHANGE_ | % |
PART II: MEASURES OF EFFECTIVENESS | | | | | | | 1. CREATIVE ECONOMY SHARE OF HAWAII GDP (BIL) | 3.5 4.2 | + 0.7 | 20 | 3.5 3.0 | - 0.5 | 14 | 2. # OF CREATIVE SECTOR JOBS (THOUS) IN HAWAII | 53 53 | + 0 | 0 | 53 43 | - 10 | 19 | 3. # JOBS ON NEIGHBOR ISLANDS IN CREATIVE SECTORS | 17 14 | - 3 | 18 | 17 10 | - 7 | 41 | 4. $ AMOUNT OF DIRECT EXPEN - FILM/TV PROD (MIL) | 350 405 | + 55 | 16 | 300 200 | - 100 | 33 | 5. $ AMT ECONOMIC IMPACT - FILM/TV PROD (MIL) | 400 700 | + 300 | 75 | 400 340 | - 60 | 15 | 6. $ AMT OF TAXES GENERATED FROM FILM/TV PROD (MIL) | 40 43 | + 3 | 8 | 35 21 | - 14 | 40 | 7. $ AMT OF ESTIMATED REBATE - ACT 88/89 | 53 50 | - 3 | 6 | 53 50 | - 3 | 6 | 8. $ AMT OF PRODUCTION SPENT ON NEIGHBOR ISLANDS | 45 30 | - 15 | 33 | 45 35 | - 10 | 22 | 9. $ AMT OF HOUSEHOLD INCOME - TOTAL SPEND (MIL) | 200 200 | + 0 | 0 | 200 100 | - 100 | 50 |
PART III: PROGRAM TARGET GROUP | | | | | | | 1. TOTAL $ AMT/VALUE OF WFORCE DEV CONT - ACT 88/89 | 90 100 | + 10 | 11 | 90 75 | - 15 | 17 | 2. AMOUNT OF PARTICIPANTS - ENT DEV PROGRAMS | 135 140 | + 5 | 4 | 140 100 | - 40 | 29 | 3. ESTIMATED REV. GEN. FM MUSIC PLACEMENTS (THOUS) | 55 120 | + 65 | 118 | 60 100 | + 40 | 67 |
PART IV: PROGRAM ACTIVITY | | | | | | | 1. # PERMITS FOR FILM/TV/COM/INTERNET PROJ YEARLY | 2800 2800 | + 0 | 0 | 2800 1500 | - 1300 | 46 | 2. # OF CREATIVE CONTENT PROJ DEV FOR EXPORT | 18 13 | - 5 | 28 | 20 25 | + 5 | 25 | 3. # OF MUSIC PLACEMENTS IN FILM, TV, COMMERCIALS | 18 15 | - 3 | 17 | 23 25 | + 2 | 9 |
- 84 -

01 01 02PROGRAM TITLE: CREATIVE INDUSTRIES DIVISION BED 105
VARIANCE REPORT NARRATIVE FY 2020 AND FY 2021
01 01 02 PROGRAM TITLE: CREATIVE INDUSTRIES DIVISION BED 105
PART I - EXPENDITURES AND POSITIONS
FY 20 Actual Expenditures are greater than budgeted as it includes encumbrances/expenditures incurred in FY 20 from non-FY 20 budgeted operating accounts.� � FY 21 Quarter 1 Actual Expenditures less than budgeted but expect to catch up in the latter of the year net of general fund restrictions.� � 1. In FY 20, filled two (2) Film Office statutory required positions (Economic Development Specialist V (EDSV) and EDSVI) with 89-day hires while in recruitment. In the 3rd Quarter, division received lists from the Department of Human Resourses Development (DHRD) for Accountant V and began to schedule interviews when the COVID-19 pandemic hit. As a result, both 89-day hires were released in the 4th Quarter and the Accountant V list was returned due to Executive Memorandum (E.M.) No. 20-01, Hiring Freeze. � � 2. One (1) vacant branch chief position was filled with an 89-day hire in the 2nd Quarter of FY 20, while the position description (PD) was rewritten due to outdated responsibilities from the transfer in the branch in 2003. PD dated back to 1980s.� � 3. Due to COVID-19 and E.M. No. 20-01, Hiring Freeze, the four (4) new positions, which are critical to the improved operations, have completed PDs but were unable to hire 89-day or permanent hires. � � 4. Legislative reduction in SLH 2020 eliminated funding for the branch chief for the Arts and Culture Branch, the EDSV, EDSVI, and Accountant V for tax credit, a statutory function in the Film Branch, along with the Office Assistant III position. This has all but crippled the division and its operation until two of the 89-day hires in the EDSV and Accountant V positions could be rehired. � � 5. Management of the film tax credit program requires a dedicated two (2) full-time equivalent team, an Accountant V and an EDSVI. The Administrator has to take on the tasks of report reviews due to limited
staffing/capacity; this is an unsustainable plan.
PART II - MEASURES OF EFFECTIVENESS
The Creative Industries Divison, with support by the Department of Business, Economic Development and Tourism's Research and Economic Analysis Division (READ) established a baseline of metrics to track creative sector vibrancy/resilience. The sectors tracked expanded to align with satellite accounts developed by the U.S. Bureau of Economic Analysis. � � The program refocused its measures of effectiveness in 2016-17 as reflected in Part II. The estimates and totals listed in FY 19-20 and FY 20-21 are reflective of the most recent report from READ, which is based on data sets from FY 18-19. The Neighbor Island totals for the film production activity are pending from the Film Office. � � Item 1. The Gross Domestic Product (GDP) share holds steady for the FY 19-20 timeframe. Anticipated decline due to the COVID-19 pandemic for FY 20-21 and an estimated 65-75% of creatives impacted in Hawaii, not eligible for unemployment insurance. Brookings Institute, June 2020 report, notes the most impacted sectors of U.S. creative economy are the performing arts and visual arts sectors, which will be "hit hardest, suffering estimated losses of almost 1.4 million jobs and $42.5 billion in sales, with estimated losses of representing 50% of all jobs nationwide." � � Item 2. Creative sector growth maintained an upward trend in FY 19-20. The COVID-19 pandemic is estimated to reduce this figure as independent contractors, gig workers, and creatives are negatively impacted or leaving the State due to COVID-19. � � Item 3. The unit of measurement is in (thousands) for jobs.� � Item 4. FY 19-20 saw stable activity in the film/tv sectors, matching the trend over the last three years (inclusive of FY 19-20). Due to COVID-19, all global production halted in March with 90-95% of film workers globally and locally impacted. FY 20-21 1st Quarter marks return of TV series to
- 85 -

01 01 02PROGRAM TITLE: CREATIVE INDUSTRIES DIVISION BED 105
VARIANCE REPORT NARRATIVE FY 2020 AND FY 2021
01 01 02 PROGRAM TITLE: CREATIVE INDUSTRIES DIVISION BED 105
Hawai (Magnum P.I.) and features, along with local productions. As of October, 22, 2020, estimated total for the year may reach $200M. Potential of two (2) more TV series coming to the islands will shift the numbers upward.� � 5. FY 19-20 econonmic impacts factored at an aggregate 1.73 multiplier is based on the estimated $405M spent in calendar year (CY) 2019. Act 275, Hawaii Motion Picture, Digital Media and Film Production Tax Credit, is reported on a calendar year basis. Figures therefore represent the estimated amount spent. FY 20-21 will have a lower econonmic impact due to the reduction of activity.� � 6. Estimated taxes generated are determined by an input/output model formula. Reduced numbers in FY 20-21 are due to the COVID-19 pandemic.� � Item 7. The establishment of Act 143, SLH 2017, (amended in Senate Bill No. 33, now Act 275, SLH 2018) for the Hawaii Motion Picture, Digital Media and Film Production Tax Credit, set a limit on the annual dollar amount of tax credit annually available to $50 million per calendar year effective January 1, 2019. � � Item 8: Both FY 18 and FY 19 saw a significant increase in neighbor island production totals. Beginning in CY 2020, impact of the COVID-19 pandemic reduced production activity from March to August by 95%. Estimates for FY 20 are lower than anticipated due to COVID-19. We anticipate three (3) TV series to be in production by end of November 2020, which is factored into the estimates. � � Item 9. Estimated household income based on the total production spent is further reduced in FY 20-21 due to the downturn in production activity.
PART III - PROGRAM TARGET GROUPS
1. Workforce Development metrics are still being compiled for both FY 18-19 and FY 19-20. Per Act 89 and now Act 143 require .1% contribution to public K-12 and University programs, as well as internships. The new
fiscal operations staffing in BED 105 will provide more granular details on the actual spent, value of the time of industry professionals and other metrics associated with these contributions. Target groups track metrics of +/- based on talent/workforce development efforts (Creative Lab Hawaii (CLH), Ohina Labs, Good Pitch Hawaii programs); the reach of film program initiatives statewide and; export of creative product in music licensed for film, television and commercials globally.� � Item 2. Due to the COVID-19 pandemic, CLH programs in media and music pivoted to online only virtual mentorship sessions for FY 20-21. This increases the size of the entrepreneurs in each module of the program which kicks off in November 2020 through November 2021. In-person mentoring and immersive programs for theatre and directing will start in Spring 2021, pending on the outcome of the COVID-19 pandemic.� � Item 3. The estimated revenue generated from the Hawaii songwriters CLH Music Immersive program has grown exponentially. Revenue estimates were low based on conservative outlook. However, the CLH music program has surpassed expectations with over $500,000 placements for island singer songwriters to date. CLH Media Immersives, job creation, monetization and export of the original IP of Hawaii filmmakers and screenwriters has exceeded expectations, selling projects to Hallmark, Lifetime, Amazon Prime and award winning webseries.
PART IV - PROGRAM ACTIVITIES
Program Activities were refined to focus on film production permitting volume per year and number of locally developed media, arts, culture, and music content projects that are export or investment ready annually.� � Items 1, 2, and 3. Refined measurable activities in film, media content and music export which shows the volume of film production permitting per year, number of locally developed media and music content projects that are licensed, exported via media projects domestically or globally, or are at a seed stage of being investment ready. Film production is down due to COVID-19 restrictions.� �
- 86 -

VARIANCE REPORT NARRATIVE FY 2020 AND FY 2021
01 01 02 PROGRAM TITLE: CREATIVE INDUSTRIES DIVISION BED 105
Item 3. See Item 3 in Part III above. �
- 87 -

||||||||
|||
|||||
STATE OF HAWAII VARIANCE REPORT REPORT V61 PROGRAM TITLE: FOREIGN TRADE ZONE 12/5/20 PROGRAM-ID: BED-107 PROGRAM STRUCTURE NO: 010103
FISCAL YEAR 2019-20 THREE MONTHS ENDED 09-30-20 NINE MONTHS ENDING 06-30-21
PART I: EXPENDITURES & POSITIONS BUDGETED ACTUAL + CHANGE_ % BUDGETED ACTUAL + CHANGE_ % BUDGETED ESTIMATED + CHANGE_ %
RESEARCH & DEVELOPMENT COSTS POSITIONS EXPENDITURES ($1,000's)
OPERATING COSTS POSITIONS 16.00 14.00 - 2.00 13 16.00 13.00 - 3.00 19 16.00 16.00 + 0.00 0 EXPENDITURES ($1000's) 2,438 2,628 + 190 8 550 567 + 17 3 1,895 1,878 - 17 1
TOTAL COSTS POSITIONS 16.00 14.00 - 2.00 13 16.00 13.00 - 3.00 19 16.00 16.00 + 0.00 0 EXPENDITURES ($1000's) 2,438 2,628 + 190 8 550 567 + 17 3 1,895 1,878 - 17 1
| FISCAL YEAR 2019-20 | FISCAL YEAR 2020-21 | | PLANNED ACTUAL | + CHANGE_ | % | PLANNED ESTIMATED | + CHANGE_ | % |
PART II: MEASURES OF EFFECTIVENESS | | | | | | | 1. %VALUE INCR OF CARGO IN/OUT OF FTZ (EXCL SUBZONES) | 3 7.8 | + 4.8 | 160 | 3 3 | + 0 | 0 | 2. % INCR VALUE CARGO IN/OUT OF ALL SUBZONES | 3 10.6 | + 7.6 | 253 | 3 3 | + 0 | 0 | 3. % INCR IN VALUE OF CARGO IN/OUT OF PIER 2 FACIL | 5 -8.7 | - 13.7 | 274 | 5 5 | + 0 | 0 | 4. # OF NEW FIRMS USING FTZ PROGRAM | 30 24 | - 6 | 20 | 30 30 | + 0 | 0 | 5. % INCR IN VALUE OF EXPORTS FROM ALL FTZ FACILITIES | 5 -4.2 | - 9.2 | 184 | 5 5 | + 0 | 0 | 6. INCR IN USERS' EMPLMT ATTRIB TO PARTIC IN FTZ PROG | 60 166 | + 106 | 177 | 60 60 | + 0 | 0 | 7. SATIS RATING BY FTZ USERS (1-5 SCALE) | 4 NO DATA | - 4 | 100 | 4 4 | + 0 | 0 | 8. YEARLY SPECIAL FUND BAL (TOT REV LESS TOT EXP) | 0 NO DATA | + 0 | 0 | 0 0 | + 0 | 0 |
PART III: PROGRAM TARGET GROUP | | | | | | | 1. FIRMS USING FTZ PROGRAM (NO.) | 250 321 | + 71 | 28 | 250 250 | + 0 | 0 | 2. COMPANIES THAT IMPORT/EXPORT DUTIABLE MERCHANDISE | 500 786 | + 286 | 57 | 500 500 | + 0 | 0 | 3. COMPANIES THAT MANUF USING DUTIABLE COMPONENTS | 70 64 | - 6 | 9 | 70 70 | + 0 | 0 |
PART IV: PROGRAM ACTIVITY | | | | | | | 1. VALUE OF CARGO IN/OUT OF FTZ (EXCL SUBZONES) (MIL) | 1750 2370 | + 620 | 35 | 1750 1750 | + 0 | 0 | 2. VALUE OF CARGO IN/OUT OF SUBZONES (MIL) | 7600 7128 | - 472 | 6 | 7600 7600 | + 0 | 0 | 3. VALUE OF CARGO IN/OUT OF PIER 2 FACILITY (MIL) | 60 32 | - 28 | 47 | 60 60 | + 0 | 0 | 4. VALUE OF CARGO HANDLD FOR DEPT OF HOMELAND SEC | 0 0 | + 0 | 0 | 0 0 | + 0 | 0 | 5. ADVERTISING/MARKETING EXPEND ZONE PROMOTION | 75 13 | - 62 | 83 | 75 75 | + 0 | 0 |
- 88 -

01 01 0301 01 0301 01 0301 01 03PROGRAM TITLE: PROGRAM TITLE: PROGRAM TITLE: PROGRAM TITLE: FOREIGN TRADE ZONEFOREIGN TRADE ZONEFOREIGN TRADE ZONEFOREIGN TRADE ZONE BED 107BED 107BED 107BED 107
VARIANCE REPORT NARRATIVE FY 2020 AND FY 2021
01 01 03 PROGRAM TITLE: FOREIGN TRADE ZONE BED 107
PART I - EXPENDITURES AND POSITIONS PART IV - PROGRAM ACTIVITIES
The position variances in FY 20 and the first quarter of FY 21 are due to the COVID-19 hiring freeze.� � The expenditures variance in FY 20 is due to the actual amount, including expenditures/encumbrances incurred in FY 20 from non-FY 20 appropriation accounts.
PART II - MEASURES OF EFFECTIVENESS
Items 1 and 2. The variances in value are due to continued trade volatility and uncertainty under the federal administration's ongoing trade actions.� � Items 3 and 4. The variances in value and number of new firms using the Foreign-Trade Zone (FTZ) are the result of uncertain trade conditions affecting the State under the federal administration's ongoing trade actions.� � Item 5. The variance is the result of the world-wide decrease in oil prices.� � Item 6. The variance is the result of uncertain trade conditions impacting the number of firms using the FTZ.� � Item 7. Data was not available from the Foreign-Trade Programs statewide.� � Item 8. No data available, but revenues generally exceed expenses by about $50,000 per annum.
PART III - PROGRAM TARGET GROUPS
Items 1, 2 and 3. The variances in the number of firms using the FTZ and importing or exporting dutiable merchandise are due to uncertain trade conditions.� � �
Item 1. The variance in the value of cargo in and out of the FTZ, except subzones, is due to uncertain trade conditions. � � Item 3. The variance in the value of cargo in and out of Pier 2 is due to uncertain trade conditions. � � Item 5. The variance in marketing expenses is due to the Program reducing its marketing expenditures in an effort to maintain parity with program revenues within its special fund.
- 89 -

||||
|
||||
12/5/20 STATE OF HAWAII VARIANCE REPORT REPORT V61 PROGRAM TITLE: GENERAL SUPPORT FOR ECONOMIC DEVELOPMENT PROGRAM-ID: BED-142 PROGRAM STRUCTURE NO: 010104
FISCAL YEAR 2019-20 THREE MONTHS ENDED 09-30-20 NINE MONTHS ENDING 06-30-21
PART I: EXPENDITURES & POSITIONS BUDGETED ACTUAL + CHANGE_ % BUDGETED ACTUAL + CHANGE_ % BUDGETED ESTIMATED + CHANGE_ %
RESEARCH & DEVELOPMENT COSTS POSITIONS EXPENDITURES ($1,000's)
OPERATING COSTS POSITIONS 26.00 24.00 - 2.00 8 26.00 24.00 - 2.00 8 26.00 24.00 - 2.00 8 EXPENDITURES ($1000's) 3,326 3,457 + 131 4 524 516 - 8 2 1,695 1,703 + 8 0
TOTAL COSTS POSITIONS 26.00 24.00 - 2.00 8 26.00 24.00 - 2.00 8 26.00 24.00 - 2.00 8 EXPENDITURES ($1000's) 3,326 3,457 + 131 4 524 516 - 8 2 1,695 1,703 + 8 0
PART II: MEASURES OF EFFECTIVENESS 1. # OF PROCUREMENT VIOLATIONS 2. % ERROR-FREE SUMMARY WARRANT VOUCHERS PROCESSED 3. SERVER DOWNTIME AS % TOTAL OPERATIONAL TIME (<) 4. % DBEDT EMPLOYEES WORKING W/OUT FORMAL GRIEVANCE
| FISCAL YEAR 2019-20 | PLANNED ACTUAL | + CHANGE_ | | | | | 0 0 | + 0 | | 95 95 | + 0 | | 2.0 2 | + 0 | | 98 100 | + 2 |
| FISCAL YEAR 2020-21 % | PLANNED ESTIMATED | + CHANGE_
| | 0 | 0 0 | + 0 0 | 95 95 | + 0 0 | 2.0 2 | + 0 2 | 98 98 | + 0
| | | | | |
%
0 0 0 0
| | | | | | |
PART III: PROGRAM TARGET GROUP 1. NUMBER OF DBEDT POSNS (PERMANENT & TEMPORARY)
| | 327 315
| | -
| 12 | 4
| | 327 315
| | - 12
| | 4
| |
PART IV: PROGRAM ACTIVITY 1. # OF REQUESTS FOR ALLOTMENT (A19) PREPARED 2. # OF SUMMARY WARRANT VOUCHERS PROCESSED 3. # OF FORMAL GRIEVANCES FILED ANNUALLY 4. # OF HR/PERSONNEL TRANSACTIONS PROCESSED ANNUALLY
| ||||
150 1250
5 1500
| 169 | +
1353 | + 0 | -
850 | -
| 19 |
103 | 5 |
650 |
| 13 |8 |
100 |43 |
150 1250
5 1500
| 170 | +
1300 | + 5 | +
900 | -
20 50 0
600
| | | | |
13 4 0
40
| | | | |
- 90 -

01 01 0401 01 0401 01 0401 01 04PROGRAM TITLE: PROGRAM TITLE: PROGRAM TITLE: PROGRAM TITLE: GENERAL SUPPORT FOR ECONOMIC DEVELOPMENTGENERAL SUPPORT FOR ECONOMIC DEVELOPMENTGENERAL SUPPORT FOR ECONOMIC DEVELOPMENTGENERAL SUPPORT FOR ECONOMIC DEVELOPMENT BED 142BED 142BED 142BED 142
VARIANCE REPORT NARRATIVE FY 2020 AND FY 2021
01 01 04 PROGRAM TITLE: GENERAL SUPPORT FOR ECONOMIC DEVELOPMENT BED 142
PART I - EXPENDITURES AND POSITIONS
FY 20 - Actual expenditures are greater than budgeted because the actual amount includes expenditures/encumbrances from prior-year appropriation accounts that were incurred in FY 20.
PART II - MEASURES OF EFFECTIVENESS
No significant variances.
PART III - PROGRAM TARGET GROUPS
No significant variances.
PART IV - PROGRAM ACTIVITIES
Item 1. The FY 20 variance is due to changes in Budget Execution Instructions for allotment requests. Unlike FY 19, the interim Budget Execution Instructions required an initial Form A-19 to allot 25% of budgeted appropriation in the first quarter. The official FY20 Budget Execution Instructions (Executive Memorandum No. 19-02 dated August 2, 2019) required a subsequent first amendment to allocate funds for the full-year for each program's main operating accounts. The FY21 estimates are greater than planned due to current Budget Execution Policies pursuant to Executive Memo No. 20-08 dated September 14, 2020, only allowing general funds to be allotted on a quarter-by-quarter basis. As well as the expectation of allotting collective bargaining adjustments, and reverting/realloting funds once or twice throughout the rest of the fiscal year for each program's main operating accounts.� � Item 3. The variance is due to an overestimation of the number of grievances filed for the year.� � Item 4. The variance is due to an overestimation of the planned amount of personnel transactions processed during the year.� �
- 91 -

|||||
||
||||||
STATE OF HAWAII VARIANCE REPORT REPORT V61 PROGRAM TITLE: TOURISM 12/5/20 PROGRAM-ID: BED-113 PROGRAM STRUCTURE NO: 0102
FISCAL YEAR 2019-20 THREE MONTHS ENDED 09-30-20 NINE MONTHS ENDING 06-30-21
PART I: EXPENDITURES & POSITIONS BUDGETED ACTUAL + CHANGE_ % BUDGETED ACTUAL + CHANGE_ % BUDGETED ESTIMATED + CHANGE_ %
RESEARCH & DEVELOPMENT COSTS POSITIONS EXPENDITURES ($1,000's)
OPERATING COSTS POSITIONS 3.00 2.00 - 1.00 33 3.00 2.00 - 1.00 33 3.00 2.00 - 1.00 33 EXPENDITURES ($1000's) 141,483 120,752 - 20,731 15 36,845 1,471 - 35,374 96 104,638 34,097 - 70,541 67
TOTAL COSTS POSITIONS 3.00 2.00 - 1.00 33 3.00 2.00 - 1.00 33 3.00 2.00 - 1.00 33 EXPENDITURES ($1000's) 141,483 120,752 - 20,731 15 36,845 1,471 - 35,374 96 104,638 34,097 - 70,541 67
| FISCAL YEAR 2019-20 | FISCAL YEAR 2020-21 | | PLANNED ACTUAL | + CHANGE_ | % | PLANNED ESTIMATED | + CHANGE_ | % |
PART II: MEASURES OF EFFECTIVENESS | | | | | | | 1. TOTAL VISITOR EXPENDITURES ($ BILLIONS) | 18.7 13.4 | - 5.3 | 28 | 19.35 7.2 | - 12.15 | 63 | 2. % OF RESIDENTS WHO AGREE TOURISM IS POSITIVE | NO DATA 58 | + 58 | 0 | NO DATA 58 | + 58 | 0 | 3. VISITOR-RELATED GROSS DOMESTIC PRODUCT ($MILLION) | 13280 15754 | + 2474 | 19 | 13280 8541.4 | - 4738.6 | 36 | 4. % TRAVELERS CONSIDERING A TRIP TO HAWAIb��I | NO DATA 55 | + 55 | 0 | NO DATA 55 | + 55 | 0 | 5. % OF TOURISM STAKEHOLDERS RECOGNIZE HTA AS LEADER | 7.00 NO DATA | - 7 | 100 | 7.00 NO DATA | - 7 | 100 |
PART III: PROGRAM TARGET GROUP | | | | | | | 1. JAPANESE TRAVELERS TO THE US (MILLION) | 3.6 3.752 | + 0.152 | 4 | 3.6 1.03 | - 2.57 | 71 | 2. US AIR TRAFFIC TO OVERSEAS REGIONS (MILLIONS) | 40.5 44.81 | + 4.31 | 11 | 40.5 12.91 | - 27.59 | 68 |
PART IV: PROGRAM ACTIVITY | | | | | | | 1. # SPORTING EVENTS ACTUALLY FUNDED | 21 9 | - 12 | 57 | 21 7 | - 14 | 67 | 2. # PROD ENRICH PROJ FNDED (INCL NAT RES & LVING HWN | 128 140 | + 12 | 9 | 128 30 | - 98 | 77 | 3. # OF HAWAIIAN AND MAJOR FESTIVALS ACTUALLY FUNDED | 12 12 | + 0 | 0 | 12 3 | - 9 | 75 | 4. # SPEECHES/PRESENTATIONS TO TOURISM STAKEHOLDERS | 55 101 | + 46 | 84 | 55 46 | - 9 | 16 | 5. NUMBER OF HITS TO TOURISM RESEARCH PAGE | 138000 65715 | - 72285 | 52 | 138000 65800 | - 72200 | 52 | 6. MAJOR MARKETING CONTRACTORS FUNDED ($MILLIONS) | 48.0 40.65 | - 7.35 | 15 | 48.0 28.60 | - 19.4 | 40 |
- 92 -

01 0201 0201 02PROGRAM TITLE: PROGRAM TITLE: PROGRAM TITLE: TOURISMTOURISMTOURISM BED 113BED 113BED 113
VARIANCE REPORT NARRATIVE FY 2020 AND FY 2021
01 02 PROGRAM TITLE: TOURISM BED 113
PART I - EXPENDITURES AND POSITIONS
The expenditure of funds is primarily limited to the amount of Transient Accommodations Tax (TAT) and Convention Center revenue collected. TAT was capped at $108.5 million effective FY 16 (pursuant to Act 121, SLH 2015). TAT was capped at $95.5 million effective FY 19 (pursuant to Act 86, SLH 2018).� � The Hawaii Toruism Authority (HTA) is operating under significantly reduced funding due to the COVID-19 pandemic, as HTA's allocation of TAT has been suspended. We have reduced or cancelled a significant amount of our contracts and budgeted expenditures for both FYs 20 and 21.
PART II - MEASURES OF EFFECTIVENESS
The COVID-19 pandemic has significantly impacted tourism in Hawaii; thus, the resulting measures of effectiveness.� � Item 1. Air and cruise data does not include supplemental business spending. The January to August 2020 amounts are preliminary, and the September 2020 to June 2021 amounts are based on the Department of Business, Economic Development and Tourism's forecast.� � Item 2. Resident sentiment typically decreases with increased visitor arrivals; we are currently working on efforts to improve the perception of tourism's positive benefits to the community.� � Item 3. The Gross Domestic Product is calculated by the Research and Economic Analysis Division (Databook Table 7.34). Calendar year (CY) 19 is the most recent data available (used for FY 2020). The drop in FY 2021 is due to the COVID-19 pandemic.� � Item 4. U.S. West Coast residents considering a trip to Hawaii for their next vacation is based on data obtained from OmniTrak Marketing Effectiveness Study Wave 4 data.� �
Item 5. Not applicable as this measure of effectiveness for the HTA has been discontinued.
PART III - PROGRAM TARGET GROUPS
The COVID-19 pandemic has significantly impacted tourism in Hawaii; thus, the resulting measures of effectiveness.� � Item 1. FY 20 information based on data obtained from www.trade.gov/visitors-arrivals-program-i-94-data. CY 19 is the most recent data available (used for FY 20). FY 21 amount was based on the year to date August 2020 growth rate.� � Item 2. FY 20 information based on data obtained from travel.trade.gov/outreachpages/outbound.general_information.outbound_o verview.asp. CY 19 is the most recent data available (used for FY 20). FY 21 figures based on reported FY 20 amounts times tourism economic growth rate.
PART IV - PROGRAM ACTIVITIES
Item 1. Several sports events were cancelled due to the COVID-19 pandemic.� � Items 2 and 3. For the increase of projects in FY 20, award amounts to individual vendors were set to lower maximum amounts than prior fiscal years, resulting in more awards. For the decrease in FY 21, budgets for community and Hawaiian programs were reduced due to the COVID-19 pandemic and the Governor's suspension of Section 237D, Hawaii Revised Statutes, 6.5 distributions to HTA.� � Item 4. For FY 20, the actual and estimated speeches and presentations significantly vary from planned and reflect the inclusion of Brand Managers and Research staff versus only HTA Leadership. Also, in FY 21, due to the COVID-19 pandemic, the focus has shifted to small group meetings and less presentations and speeches.� �
- 93 -

VARIANCE REPORT NARRATIVE FY 2020 AND FY 2021
01 02 PROGRAM TITLE: TOURISM BED 113
Item 5. The actual and estimated figures represent Page Views instead of Hits, which is the newer industry standard measure. It remains lower than targeted. In addition, HTA redesigned its website and consolidated some of the Research pages, reducing the overall number of pages that may be viewed. The amount provided is not comparable to the target. The number of page views have increased from the prior fiscal year.� � Item 6. For both FYs 20 and 21, HTA is operating under significantly reduced funding due to the COVID-19 pandemic during which HTA's allocation of TAT has been suspended. We have reduced or cancelled a significant amount of our contracts and budgeted expenditures.�
- 94 -

||
STATE OF HAWAII VARIANCE REPORT REPORT V61 PROGRAM TITLE: AGRICULTURE 12/5/20 PROGRAM-ID: PROGRAM STRUCTURE NO: 0103
FISCAL YEAR 2019-20 THREE MONTHS ENDED 09-30-20 NINE MONTHS ENDING 06-30-21
PART I: EXPENDITURES & POSITIONS BUDGETED ACTUAL + CHANGE_ % BUDGETED ACTUAL + CHANGE_ % BUDGETED ESTIMATED + CHANGE_ %
RESEARCH & DEVELOPMENT COSTS POSITIONS EXPENDITURES ($1,000's)
OPERATING COSTS POSITIONS 337.00 260.00 - 77.00 23 337.00 254.00 - 83.00 25 337.00 265.00 - 72.00 21 EXPENDITURES ($1000's) 60,956 40,028 - 20,928 34 12,628 11,832 - 796 6 42,633 43,429 + 796 2
TOTAL COSTS POSITIONS 337.00 260.00 - 77.00 23 337.00 254.00 - 83.00 25 337.00 265.00 - 72.00 21 EXPENDITURES ($1000's) 60,956 40,028 - 20,928 34 12,628 11,832 - 796 6 42,633 43,429 + 796 2
| FISCAL YEAR 2019-20 | FISCAL YEAR 2020-21 | | PLANNED ACTUAL | + CHANGE_ | % | PLANNED ESTIMATED | + CHANGE_ | % |
PART II: MEASURES OF EFFECTIVENESS | | | | | | | 1. AMT OF AG OR AQUA FIN PROVIDED BY OTHR CRED SOURCS | 900 60 | - 840 | 93 | 750 750 | + 0 | 0 | 2. # INTERCEPTED PEST SPECIES NOT ESTABLISHED IN HI | 520 426 | - 94 | 18 | 530 530 | + 0 | 0 |
- 95 -

PROGRAM TITLE: PROGRAM TITLE: AGRICULTUREAGRICULTURE 01 0301 03
VARIANCE REPORT NARRATIVE FY 2020 AND FY 2021
PROGRAM TITLE: AGRICULTURE 01 03
PART I - EXPENDITURES AND POSITIONS
Details of the position and expenditures variances are best examined at the lowest program level.
PART II - MEASURES OF EFFECTIVENESS
See Lowest Level Programs for additional information.
- 96 -

|||||
||||
||||
STATE OF HAWAII VARIANCE REPORT REPORT V61 PROGRAM TITLE: FINANCIAL ASSISTANCE FOR AGRICULTURE 12/5/20 PROGRAM-ID: AGR-101 PROGRAM STRUCTURE NO: 010301
FISCAL YEAR 2019-20 THREE MONTHS ENDED 09-30-20 NINE MONTHS ENDING 06-30-21
PART I: EXPENDITURES & POSITIONS BUDGETED ACTUAL + CHANGE_ % BUDGETED ACTUAL + CHANGE_ % BUDGETED ESTIMATED + CHANGE_ %
RESEARCH & DEVELOPMENT COSTS POSITIONS EXPENDITURES ($1,000's)
OPERATING COSTS POSITIONS 9.00 8.00 - 1.00 11 9.00 8.00 - 1.00 11 9.00 8.00 - 1.00 11 EXPENDITURES ($1000's) 6,861 3,227 - 3,634 53 1,413 1,413 + 0 0 5,448 5,448 + 0 0
TOTAL COSTS POSITIONS 9.00 8.00 - 1.00 11 9.00 8.00 - 1.00 11 9.00 8.00 - 1.00 11 EXPENDITURES ($1000's) 6,861 3,227 - 3,634 53 1,413 1,413 + 0 0 5,448 5,448 + 0 0
| FISCAL YEAR 2019-20 | FISCAL YEAR 2020-21 | | PLANNED ACTUAL | + CHANGE_ | % | PLANNED ESTIMATED | + CHANGE_ | % |
PART II: MEASURES OF EFFECTIVENESS | | | | | | | 1. NUMBER OF LOANS APPROVED | 25 26 | + 1 | 4 | 25 25 | + 0 | 0 | 2. TOTAL DOLLAR AMOUNT OF LOANS APPROVED (000'S) | 4500 4714 | + 214 | 5 | 5000 5000 | + 0 | 0 | 3. ANNUAL ACREAGE CULTIVATED BY BORROWERS | 10000 10958 | + 958 | 10 | 10000 10000 | + 0 | 0 | 4. AMT OF EMPLOYEES OR LABORERS UTILIZED BY BORROWER | 1000 698 | - 302 | 30 | 1000 1000 | + 0 | 0 | 5. AMT OF AG OR AQUA FIN PROVIDED BY OTHR CRED SOURCS | 900 60 | - 840 | 93 | 750 750 | + 0 | 0 |
PART III: PROGRAM TARGET GROUP | | | | | | | 1. POTENTIAL QUALIFIED FARMERS/NEW FARMERS | 7000 7328 | + 328 | 5 | 7000 7000 | + 0 | 0 | 2. POTENTIAL QUALIFED AQUACULTURISTS | 70 70 | + 0 | 0 | 70 70 | + 0 | 0 | 3. AGRICULTURE/AQUACULTURE COOPERATIVES | 25 27 | + 2 | 8 | 20 20 | + 0 | 0 | 4. COMMERCIAL BANKS | 5 6 | + 1 | 20 | 5 5 | + 0 | 0 |
PART IV: PROGRAM ACTIVITY | | | | | | | 1. NUMBER OF PUBLIC RELATIONS CONTACTS | 50 47 | - 3 | 6 | 50 50 | + 0 | 0 | 2. NO. OF SERVICING CONTACTS WITH EXISTING BORROWERS | 700 552 | - 148 | 21 | 700 700 | + 0 | 0 | 3. NUMBER OF LOAN INQUIRIES RECEIVED BY THE DIVISION | 175 159 | - 16 | 9 | 175 175 | + 0 | 0 | 4. AMOUNT COLLECTED BY PROGRAM (000'S) | 2250 3836 | + 1586 | 70 | 2250 2250 | + 0 | 0 |
- 97 -

01 03 0101 03 0101 03 0101 03 01PROGRAM TITLE: PROGRAM TITLE: PROGRAM TITLE: PROGRAM TITLE: FINANCIAL ASSISTANCE FOR AGRICULTUREFINANCIAL ASSISTANCE FOR AGRICULTUREFINANCIAL ASSISTANCE FOR AGRICULTUREFINANCIAL ASSISTANCE FOR AGRICULTURE AGR 101AGR 101AGR 101AGR 101
VARIANCE REPORT NARRATIVE FY 2020 AND FY 2021
01 03 01 PROGRAM TITLE: FINANCIAL ASSISTANCE FOR AGRICULTURE AGR 101
PART I - EXPENDITURES AND POSITIONS
Variances in FY 20 expenditures were due to position vacancies and the lower dollar amount in loan disbursements. Variances in positions are due to lack of qualified applicants for vacant positions.
PART II - MEASURES OF EFFECTIVENESS
Item 3. The annual acreage cultivated by borrowers well exceeded the planned amount and is due to the larger loan portfolio and increased ranch acreage.� � Item 4. The amount of employees or laborers utilized by borrowers was below the planned amount due to the farm efficiencies, the tight labor market which made finding employees difficult, and adjustments made by farms during the last quarter to poor economic conditions as a result of the COVID-19 pandemic. � � Item 5. Amount of financing provided by other credit sources was well below the planned amount due to the perceived higher risk associated with farming operations and the lending industry lack of familiarity with agriculture.
PART III - PROGRAM TARGET GROUPS
Item 4. The commercial banks amount was above the planned amount due to the addition of a new State-chartered bank. The expanded banking industry will help make more credit available for the agricultural and ranch communities.
PART IV - PROGRAM ACTIVITIES
Item 2. The number of servicing contacts was below the planned amount. The program's initial stay-at-home order due to the COVID-19 pandemic reduced public contacts and restricted travel to the neighbor islands. Reduced public contact measures included stopping routine farm field inspections and direct meeting with borrowers.� �
Item 4. The amount collected by the program was above the projected amount due to the larger loan portfolio and several significant loan payoffs. The program remains focused on the collections and working with delinquent borrowers, especially during the current economic downturn and periodic stay-at-home restrictions.
- 98 -

||
12/5/20 STATE OF HAWAII VARIANCE REPORT REPORT V61 PROGRAM TITLE: PRODCTVTY IMPRVMT & MGT ASSTNCE FOR AGR PROGRAM-ID: PROGRAM STRUCTURE NO: 010302
FISCAL YEAR 2019-20 THREE MONTHS ENDED 09-30-20 NINE MONTHS ENDING 06-30-21
PART I: EXPENDITURES & POSITIONS BUDGETED ACTUAL + CHANGE_ % BUDGETED ACTUAL + CHANGE_ % BUDGETED ESTIMATED + CHANGE_ %
RESEARCH & DEVELOPMENT COSTS POSITIONS EXPENDITURES ($1,000's)
OPERATING COSTS POSITIONS 184.00 149.00 - 35.00 19 184.00 147.00 - 37.00 20 184.00 152.00 - 32.00 17 EXPENDITURES ($1000's) 21,940 16,144 - 5,796 26 4,855 4,855 + 0 0 16,111 16,111 + 0 0
TOTAL COSTS POSITIONS 184.00 149.00 - 35.00 19 184.00 147.00 - 37.00 20 184.00 152.00 - 32.00 17 EXPENDITURES ($1000's) 21,940 16,144 - 5,796 26 4,855 4,855 + 0 0 16,111 16,111 + 0 0
| FISCAL YEAR 2019-20 | FISCAL YEAR 2020-21 | | PLANNED ACTUAL | + CHANGE_ | % | PLANNED ESTIMATED | + CHANGE_ | % |
PART II: MEASURES OF EFFECTIVENESS | | | | | | | 1. % TTL PARCELS INSP INTERCEPTED AS PROHIB/RESTRICT | .003 .004 | + 0.001 | 33 | .003 .004 | + 0.001 | 33 | 2. # INTERCEPTED PEST SPECIES NOT ESTABLISHED IN HI | 520 426 | - 94 | 18 | 530 530 | + 0 | 0 |
- 99 -

PROGRAM TITLE: PROGRAM TITLE: PRODCTVTY IMPRVMT & MGT ASSTNCE FOR AGRPRODCTVTY IMPRVMT & MGT ASSTNCE FOR AGR 01 03 0201 03 02
VARIANCE REPORT NARRATIVE FY 2020 AND FY 2021
PROGRAM TITLE: PRODCTVTY IMPRVMT & MGT ASSTNCE FOR AGR 01 03 02
PART I - EXPENDITURES AND POSITIONS
Details of the position and expenditures variances are best examined at the lowest program level.
PART II - MEASURES OF EFFECTIVENESS
See Lowest Level Programs for additional information.
- 100 -

|||||||
||||||||||
||||||||
STATE OF HAWAII VARIANCE REPORT REPORT V61 PROGRAM TITLE: PLANT PEST AND DISEASE CONTROL 12/5/20 PROGRAM-ID: AGR-122 PROGRAM STRUCTURE NO: 01030201
FISCAL YEAR 2019-20 THREE MONTHS ENDED 09-30-20 NINE MONTHS ENDING 06-30-21
PART I: EXPENDITURES & POSITIONS BUDGETED ACTUAL + CHANGE_ % BUDGETED ACTUAL + CHANGE_ % BUDGETED ESTIMATED + CHANGE_ %
RESEARCH & DEVELOPMENT COSTS POSITIONS EXPENDITURES ($1,000's)
OPERATING COSTS POSITIONS 124.00 100.00 - 24.00 19 124.00 99.00 - 25.00 20 124.00 101.00 - 23.00 19 EXPENDITURES ($1000's) 15,810 11,022 - 4,788 30 3,505 3,505 + 0 0 11,524 11,524 + 0 0
TOTAL COSTS POSITIONS 124.00 100.00 - 24.00 19 124.00 99.00 - 25.00 20 124.00 101.00 - 23.00 19 EXPENDITURES ($1000's) 15,810 11,022 - 4,788 30 3,505 3,505 + 0 0 11,524 11,524 + 0 0
| FISCAL YEAR 2019-20 | FISCAL YEAR 2020-21 | | PLANNED ACTUAL | + CHANGE_ | % | PLANNED ESTIMATED | + CHANGE_ | % |
PART II: MEASURES OF EFFECTIVENESS | | | | | | | 1. % TTL PARCELS INSP INTERCEPTED AS PROHIB/RESTRICT | .003 .004 | + 0.001 | 33 | .003 .004 | + 0.001 | 33 | 2. NUMBER OF PEST INTERCEPTIONS | 1700 903 | - 797 | 47 | 1700 1300 | - 400 | 24 | 3. # INTERCEPTED PEST SPECIES NOT ESTABLISHED IN HI | 520 426 | - 94 | 18 | 530 530 | + 0 | 0 | 4. # OF PROHIBITED ANIMALS INTERCEPTED OR CONFISCATED | 600 1685 | + 1085 | 181 | 600 1200 | + 600 | 100 | 5. % OF CHEM/MECH CNTRL PROJ UNDER HI LEVEL OF CNTRL | 15 15 | + 0 | 0 | 15 15 | + 0 | 0 | 6. % BIO CONTROL PROJECTS UNDER A HIGH LEVEL OF CNTRL | 35 35 | + 0 | 0 | 35 35 | + 0 | 0 | 7. COMPLIANCE RATE CERT NURS & PT OF ORIGIN EXP INSP | 85 97 | + 12 | 14 | 85 85 | + 0 | 0 |
PART III: PROGRAM TARGET GROUP | | | | | | | 1. NUMBER OF AIRCRAFT AND SHIP ARRIVALS (THOUSANDS) | 46 25 | - 21 | 46 | 46 35 | - 11 | 24 | 2. NUMBER PASSENGER ARRIVALS BY AIR AND SEA (THOUS) | 7000 2056 | - 4944 | 71 | 7000 5000 | - 2000 | 29 | 3. NO. OF REGULATED BAGGAGE, CARGO AND MAIL (THOUS) | 8200 12665 | + 4465 | 54 | 8200 10200 | + 2000 | 24 | 4. NUMBER OF IMPORT PERMIT REQUESTS | 1000 1432 | + 432 | 43 | 1000 1300 | + 300 | 30 | 5. NUMBER OF SITES REQUIRING POST-ENTRY INSPECTIONS | 520 512 | - 8 | 2 | 520 520 | + 0 | 0 | 6. NUMBER OF CERTIFIED NURSERIES | 170 167 | - 3 | 2 | 170 167 | - 3 | 2 | 7. NUMBER OF NEW NOXIOUS WEED INFESTATIONS | 1 0 | - 1 | 100 | 1 1 | + 0 | 0 | 8. NUMBER OF WIDESPREAD NOXIOUS WEED INFESTATIONS | 40 40 | + 0 | 0 | 40 40 | + 0 | 0 | 9. NO. OF NEW INFESTATIONS OF INSECTS AND OTHER PESTS | 40 38 | - 2 | 5 | 40 45 | + 5 | 13 | 10. NO. OF WIDESPREAD INFEST OF INSECTS AND OTHER PEST | 10 12 | + 2 | 20 | 15 12 | - 3 | 20 |
PART IV: PROGRAM ACTIVITY | | | | | | | 1. NUMBER OF AIRCRAFT AND SHIPS MONITORED (THOUSANDS) | 45 19 | - 26 | 58 | 45 35 | - 10 | 22 | 2. NUMBER OF AIR AND SEA PASSENGERS MONITORED (THOUS) | 6500 1393 | - 5107 | 79 | 6500 3500 | - 3000 | 46 | 3. NO. OF BAGGAGE, CARGO, AND MAIL INSPECTED (THOUS) | 8200 11665 | + 3465 | 42 | 8200 10200 | + 2000 | 24 | 4. NUMBER OF POST-ENTRY INSPECTIONS CONDUCTED | 420 98 | - 322 | 77 | 420 225 | - 195 | 46 | 5. NUMBER OF CERTIFIED NURSERY INSPECTIONS | 352 326 | - 26 | 7 | 348 334 | - 14 | 4 | 6. NUMBER OF CHEM/MECH CNTRL AND ERADICATION PROJECTS | 15 10 | - 5 | 33 | 15 10 | - 5 | 33 | 7. BIOLOGICAL CONTROL OF PEST SPECIES (# OF PROJECTS) | 8 8 | + 0 | 0 | 8 6 | - 2 | 25 | 8. SEED TEST AND ANALYSIS (NUMBER OF LOTS) | 35 61 | + 26 | 74 | 35 35 | + 0 | 0 |
- 101 -

01 03 02 0101 03 02 0101 03 02 01PROGRAM TITLE: PROGRAM TITLE: PROGRAM TITLE: PLANT PEST AND DISEASE CONTROLPLANT PEST AND DISEASE CONTROLPLANT PEST AND DISEASE CONTROL AGR 122AGR 122AGR 122
VARIANCE REPORT NARRATIVE FY 2020 AND FY 2021
01 03 02 01 PROGRAM TITLE: PLANT PEST AND DISEASE CONTROL AGR 122
PART I - EXPENDITURES AND POSITIONS
Variances were due to restrictions, position vacancies, and lower than expected special and federal fund expenditures. Variances in positions are due to lack of qualified applicants for vacant positions.
PART II - MEASURES OF EFFECTIVENESS
Item 1. The increase is due to the increased number of illegal animal shipments.� � Item 2. The number of pest interceptions decreased due to reduced cargo shipments due to the COVID-19 pandemic and staff focusing time and effort on high-risk, Not Known to Occur (NKO) in Hawaii pests. Number of NKOs account for roughly half the interceptions turned in. High level of compliance for origin inspections and certified nurseries also resulted in reduced insect interceptions.� � Item 3. The reduction is due to less cargo shipments due to the COVID-19 pandemic and staff focusing on high-risk species that are NKO.� � Item 4. The high increase is due to the stay-at-home orders for COVID-19. With so many people at home, there was increased interest in maintaining pets and many individuals looked to the internet to obtain animals that they did not know were illegal in Hawaii. This resulted in a dramatic increase in illegal animal shipments.� � Item 7. All Certified Nurseries are in compliance; origin inspections at 98% compliance.
PART III - PROGRAM TARGET GROUPS
Item 1. The reduction is due to the COVID-19 pandemic, resulting in an 80-90% reduction in domestic inbound flights, depending on which island.� � Item 2. Reduction is due to COVID-19 pandemic and subsequent travel restrictions. Even with flights arriving, most aircraft were carrying little to no passengers.�
� Item 3. Significant increase due to the stay-at-home orders for COVID-19. Individuals were forced to rely on e-commerce and other web-based sellers for goods resulting in substantial increases in imported parcels through express mail carriers.� � Item 4. Increase is due to due to the stay-at-home orders for COVID-19. The increase in permit volume was primarily for the importation of non-domestic animals as pets.� � Item 7. No new noxious weed infestations were detected in FY 20 during surveys. � � Item 10. The number of widespread infestations of insects and other pests is expected to increase. Most prominently will be the expected expansion of distribution of little fire ant as more infestations are identified statewide and a collective lack of staffing resources to respond to new infestations in a meaningful way. Queensland longhorned beetle will continue to expand its infestation range and is expected to be detected on another island. Two-lined spittlebug will continue to expand its infected range and will likely be detected on a new island in a few years.
PART IV - PROGRAM ACTIVITIES
Item 1. Reduction is due to the COVID-19 pandemic, resulting in an 80-90% reduction in domestic inbound flights, depending on which island.� � Item 2. Reduction is due to the COVID-19 pandemic and subsequent travel restrictions. Even with flights arriving, most aircraft were carrying little to no passengers.� � Item 3. There was a significant increase due to the stay-at-home orders for COVID-19. Individuals were forced to rely on e-commerce and other web-based sellers for goods resulting in substantial increases in imported parcels through express mail carriers.� � �
- 102 -

VARIANCE REPORT NARRATIVE FY 2020 AND FY 2021
01 03 02 01 PROGRAM TITLE: PLANT PEST AND DISEASE CONTROL AGR 122
Item 4. The Land Vertebrate Specialist (LVS) position was filled in December 2019. The LVS oversees the largest number of post entry inspections. However, due to the COVID-19 pandemic and stay-at-home orders, many sites were not accessible for inspections. Additionally, these inspections were given lower priority due to staff safety concerns regarding social distancing requirements, as they are normally done in close proximity with permittees for periods far exceeding 15 minutes.� � Item 6. COVID-19 restrictions kept staff out of the office and out of the field for a prolonged period of time. Coupled with the lack of Oahu staff due to promotion and retirements, there was a decreased number of active projects, especially on Oahu.� � Item 7. COVID-19 related travel restrictions will negatively impact the State's ability to conduct foreign exploration. While adjustments have been made to increase national and international collaboration and facilitate the sharing of natural enemies and foreign exploration on shared targets, movement of natural enemies have been significantly impacted due to global reduction in the number of flights. The lack of Trans-Pacific lift capacity to Hawaii has negatively impacted biocontrol programs in Hawaii for an estimated three to five years, with delays in ongoing and future projects. Costs for shipment and movement of biocontrol agents for testing and evaluation will increase until foreign air travel increases significantly in volume. Staffing has also been reduced, necessitating a reduction in the number of target species which can be worked on.� � Item 8. The number of seed lots tested depends upon receiving seeds from distributors, private entities, and the U.S. Department of Agriculture. �
- 103 -

|||
STATE OF HAWAII VARIANCE REPORT REPORT V61 PROGRAM TITLE: ANIMAL PEST AND DISEASE CONTROL 12/5/20 PROGRAM-ID: PROGRAM STRUCTURE NO: 01030202
FISCAL YEAR 2019-20 THREE MONTHS ENDED 09-30-20 NINE MONTHS ENDING 06-30-21
PART I: EXPENDITURES & POSITIONS BUDGETED ACTUAL + CHANGE_ % BUDGETED ACTUAL + CHANGE_ % BUDGETED ESTIMATED + CHANGE_ %
RESEARCH & DEVELOPMENT COSTS POSITIONS EXPENDITURES ($1,000's)
OPERATING COSTS POSITIONS 60.00 49.00 - 11.00 18 60.00 48.00 - 12.00 20 60.00 51.00 - 9.00 15 EXPENDITURES ($1000's) 6,130 5,122 - 1,008 16 1,350 1,350 + 0 0 4,587 4,587 + 0 0
TOTAL COSTS POSITIONS 60.00 49.00 - 11.00 18 60.00 48.00 - 12.00 20 60.00 51.00 - 9.00 15 EXPENDITURES ($1000's) 6,130 5,122 - 1,008 16 1,350 1,350 + 0 0 4,587 4,587 + 0 0
| FISCAL YEAR 2019-20 | FISCAL YEAR 2020-21 | | PLANNED ACTUAL | + CHANGE_ | % | PLANNED ESTIMATED | + CHANGE_ | % |
PART II: MEASURES OF EFFECTIVENESS | | | | | | | 1. NUMBER OF RABIES CASES IN THE COMMUNITY | 0 0 | + 0 | 0 | 0 0 | + 0 | 0 | 2. NO. OF DISEASE-FREE STATUS OBTAINED & MAINTAINED | 5 5 | + 0 | 0 | 5 5 | + 0 | 0 | 3. NO.OF DISEASE CNTRL PROG W/ PUBLIC HEALTH IMPACT | 6 6 | + 0 | 0 | 6 6 | + 0 | 0 |
- 104 -

PROGRAM TITLE: PROGRAM TITLE: ANIMAL PEST AND DISEASE CONTROLANIMAL PEST AND DISEASE CONTROL 01 03 02 0201 03 02 02
VARIANCE REPORT NARRATIVE FY 2020 AND FY 2021
PROGRAM TITLE: ANIMAL PEST AND DISEASE CONTROL 01 03 02 02
PART I - EXPENDITURES AND POSITIONS
Details of the position and expenditures variances are best examined at the lowest program level.
PART II - MEASURES OF EFFECTIVENESS
See Lowest Level Programs for additional information.
- 105 -

||
||
||||||||
STATE OF HAWAII VARIANCE REPORT REPORT V61 PROGRAM TITLE: RABIES QUARANTINE 12/5/20 PROGRAM-ID: AGR-131 PROGRAM STRUCTURE NO: 0103020201
FISCAL YEAR 2019-20 THREE MONTHS ENDED 09-30-20 NINE MONTHS ENDING 06-30-21
PART I: EXPENDITURES & POSITIONS BUDGETED ACTUAL + CHANGE_ % BUDGETED ACTUAL + CHANGE_ % BUDGETED ESTIMATED + CHANGE_ %
RESEARCH & DEVELOPMENT COSTS POSITIONS EXPENDITURES ($1,000's)
OPERATING COSTS POSITIONS 34.32 29.32 - 5.00 15 34.32 28.32 - 6.00 17 34.32 30.32 - 4.00 12 EXPENDITURES ($1000's) 3,933 3,503 - 430 11 888 888 + 0 0 3,058 3,058 + 0 0
TOTAL COSTS POSITIONS 34.32 29.32 - 5.00 15 34.32 28.32 - 6.00 17 34.32 30.32 - 4.00 12 EXPENDITURES ($1000's) 3,933 3,503 - 430 11 888 888 + 0 0 3,058 3,058 + 0 0
| FISCAL YEAR 2019-20 | FISCAL YEAR 2020-21 | | PLANNED ACTUAL | + CHANGE_ | % | PLANNED ESTIMATED | + CHANGE_ | % |
PART II: MEASURES OF EFFECTIVENESS | | | | | | | 1. NUMBER OF RABIES CASES IN THE COMMUNITY | 0 0 | + 0 | 0 | 0 0 | + 0 | 0 | 2. NUMBER OF ALIEN PESTS DETECTED | 4 7 | + 3 | 75 | 5 7 | + 2 | 40 |
PART III: PROGRAM TARGET GROUP | | | | | | | 1. DOGS AND CATS QUARANTINED | 700 4011 | + 3311 | 473 | 700 3000 | + 2300 | 329 | 2. POPULATION OF HAWAII | 1450000 1415000 | - 35000 | 2 | 1450000 1415000 | - 35000 | 2 |
PART IV: PROGRAM ACTIVITY | | | | | | | 1. NUMBER OF DOGS AND CATS QUARANTINED - 120 DAYS | 50 200 | + 150 | 300 | 50 200 | + 150 | 300 | 2. NO. OF DOGS & CATS QUARANTINED- LESS THAN 120 DAYS | 650 3811 | + 3161 | 486 | 650 3800 | + 3150 | 485 | 3. NO. QUAL DOGS & CATS RELEASD AFTER INSP UPON ARRVL | 14400 12144 | - 2256 | 16 | 14700 13000 | - 1700 | 12 | 4. NUMBER OF DOGS AND CATS QUARANTINED - TRANSIT | 200 123 | - 77 | 39 | 200 150 | - 50 | 25 | 5. NO. OF SATELLITE & APPROVED VET FACILITY MONITORED | 32 32 | + 0 | 0 | 32 32 | + 0 | 0 | 6. NO. OF DOGS & CATS SAMPLED FOR EXTERNAL PARASITES | 2 5 | + 3 | 150 | 2 6 | + 4 | 200 | 7. NO. OF DOGS & CATS SAMPLED FOR INTERNAL PARASITES | 1000 650 | - 350 | 35 | 1000 600 | - 400 | 40 | 8. NO. SVC DOGS & ELIGIBLE GUIDE DOG ENTRIES PROCESED | 1500 744 | - 756 | 50 | 1600 1600 | + 0 | 0 |
- 106 -

01 03 02 02 0101 03 02 02 0101 03 02 02 0101 03 02 02 01PROGRAM TITLE: PROGRAM TITLE: PROGRAM TITLE: PROGRAM TITLE: RABIES QUARANTINERABIES QUARANTINERABIES QUARANTINERABIES QUARANTINE AGR 131AGR 131AGR 131AGR 131
VARIANCE REPORT NARRATIVE FY 2020 AND FY 2021
01 03 02 02 01 PROGRAM TITLE: RABIES QUARANTINE AGR 131
PART I - EXPENDITURES AND POSITIONS
The variances in expenditures are due to vacant positions. The variances in positions filled are due to the inability to find qualified candidates for vacant positions.
PART II - MEASURES OF EFFECTIVENESS
Item 2. The increase in alien pests detected is associated with the continuing increased tick infestations in the originating areas of the continental United States.
PART III - PROGRAM TARGET GROUPS
Item 1. The increased amount of animals quarantined is primarily due to the increased number of animals arriving before the date they are qualified for Direct Airport Release and an increase in the number of animals under the Five-Day-or-Less Program, also known as 5 Day Or Less quarantine program, not released on arrival. A decrease is expected in FY 21 due to effects of COVID-19 transpacific travel.
PART IV - PROGRAM ACTIVITIES
Items 1 & 2. The FY 20 increase in the amount of animals quarantined is due primarily to the increased number of animals arriving before the date they are qualified for Direct Airport Release and an increase in the number of animals under the 5 Day Or Less program not released on arrival. A higher number of animals also arrived without any preparations done for the 5 Day or Less program, resulting in quarantine for 120 days. A decrease in the 120-day category is expected in FY 21`due to recent administrative rule changes affecting import requirements. However, an increase in the number of 5 Day Or Less category animals is anticipated, similar to FY 20, that may be due indirectly to the effects of COVID-19 and the inability for pet owners to complete entry requirements in a timely manner. � � Item 3 & 4. A reduction of animals entering the State or in these categories was due to the pandemic and is expected to continue in FY 21.�
Item 6. The increase in external parasite sampling is due to an increase in the number of animals entering the State with ectoparasites.� � Item 7. The decrease in the number of animals sampled for internal parasites is due to shorter confinement periods implemented in FY 19 and may also be indirectly due to the effects of COVID-19 effects on travel.� � Item 8. The decrease in Service Dogs in FY 20 is likely due to the COVID-19 effects on travel and may continue in FY 21�
- 107 -
||||
|||
||||||||||
STATE OF HAWAII VARIANCE REPORT REPORT V61 PROGRAM TITLE: ANIMAL DISEASE CONTROL 12/5/20 PROGRAM-ID: AGR-132 PROGRAM STRUCTURE NO: 0103020202
FISCAL YEAR 2019-20 THREE MONTHS ENDED 09-30-20 NINE MONTHS ENDING 06-30-21
PART I: EXPENDITURES & POSITIONS BUDGETED ACTUAL + CHANGE_ % BUDGETED ACTUAL + CHANGE_ % BUDGETED ESTIMATED + CHANGE_ %
RESEARCH & DEVELOPMENT COSTS POSITIONS EXPENDITURES ($1,000's)
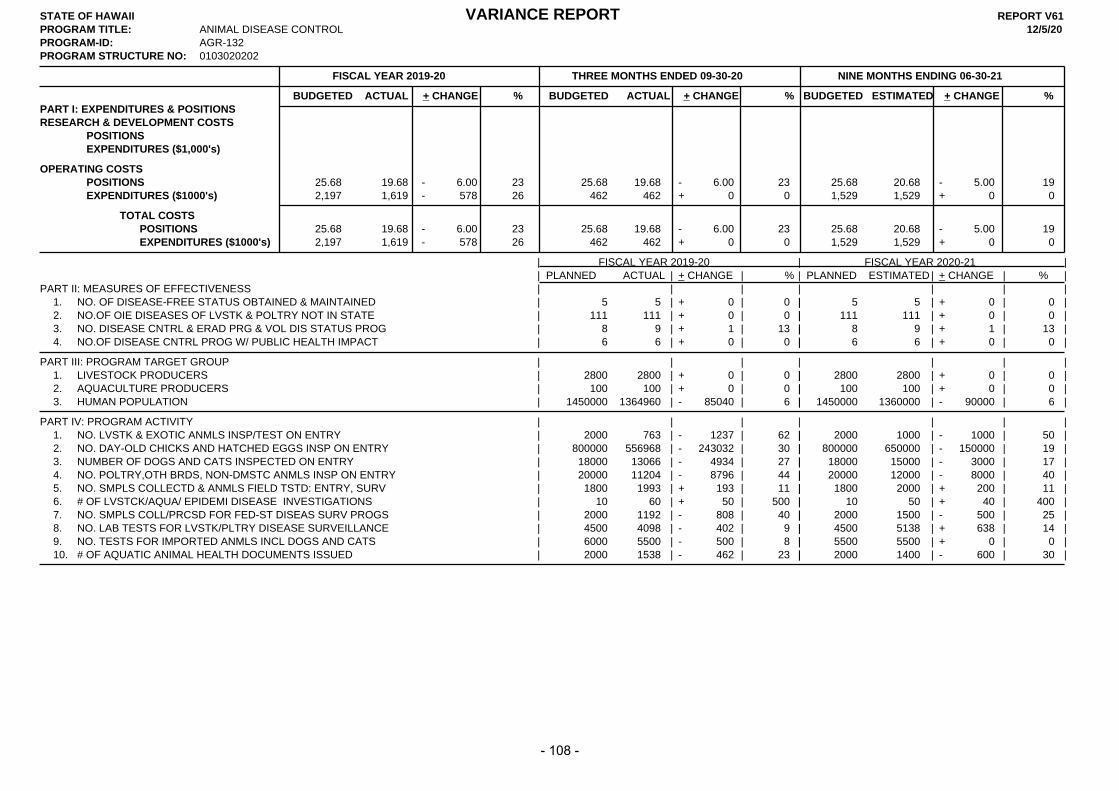
OPERATING COSTS POSITIONS 25.68 19.68 - 6.00 23 25.68 19.68 - 6.00 23 25.68 20.68 - 5.00 19 EXPENDITURES ($1000's) 2,197 1,619 - 578 26 462 462 + 0 0 1,529 1,529 + 0 0
TOTAL COSTS POSITIONS 25.68 19.68 - 6.00 23 25.68 19.68 - 6.00 23 25.68 20.68 - 5.00 19 EXPENDITURES ($1000's) 2,197 1,619 - 578 26 462 462 + 0 0 1,529 1,529 + 0 0
| FISCAL YEAR 2019-20 | FISCAL YEAR 2020-21 | | PLANNED ACTUAL | + CHANGE_ | % | PLANNED ESTIMATED | + CHANGE_ | % |
PART II: MEASURES OF EFFECTIVENESS | | | | | | | 1. NO. OF DISEASE-FREE STATUS OBTAINED & MAINTAINED | 5 5 | + 0 | 0 | 5 5 | + 0 | 0 | 2. NO.OF OIE DISEASES OF LVSTK & POLTRY NOT IN STATE | 111 111 | + 0 | 0 | 111 111 | + 0 | 0 | 3. NO. DISEASE CNTRL & ERAD PRG & VOL DIS STATUS PROG | 8 9 | + 1 | 13 | 8 9 | + 1 | 13 | 4. NO.OF DISEASE CNTRL PROG W/ PUBLIC HEALTH IMPACT | 6 6 | + 0 | 0 | 6 6 | + 0 | 0 |
PART III: PROGRAM TARGET GROUP | | | | | | | 1. LIVESTOCK PRODUCERS | 2800 2800 | + 0 | 0 | 2800 2800 | + 0 | 0 | 2. AQUACULTURE PRODUCERS | 100 100 | + 0 | 0 | 100 100 | + 0 | 0 | 3. HUMAN POPULATION | 1450000 1364960 | - 85040 | 6 | 1450000 1360000 | - 90000 | 6 |
PART IV: PROGRAM ACTIVITY | | | | | | | 1. NO. LVSTK & EXOTIC ANMLS INSP/TEST ON ENTRY | 2000 763 | - 1237 | 62 | 2000 1000 | - 1000 | 50 | 2. NO. DAY-OLD CHICKS AND HATCHED EGGS INSP ON ENTRY | 800000 556968 | - 243032 | 30 | 800000 650000 | - 150000 | 19 | 3. NUMBER OF DOGS AND CATS INSPECTED ON ENTRY | 18000 13066 | - 4934 | 27 | 18000 15000 | - 3000 | 17 | 4. NO. POLTRY,OTH BRDS, NON-DMSTC ANMLS INSP ON ENTRY | 20000 11204 | - 8796 | 44 | 20000 12000 | - 8000 | 40 | 5. NO. SMPLS COLLECTD & ANMLS FIELD TSTD: ENTRY, SURV | 1800 1993 | + 193 | 11 | 1800 2000 | + 200 | 11 | 6. # OF LVSTCK/AQUA/ EPIDEMI DISEASE INVESTIGATIONS | 10 60 | + 50 | 500 | 10 50 | + 40 | 400 | 7. NO. SMPLS COLL/PRCSD FOR FED-ST DISEAS SURV PROGS | 2000 1192 | - 808 | 40 | 2000 1500 | - 500 | 25 | 8. NO. LAB TESTS FOR LVSTK/PLTRY DISEASE SURVEILLANCE | 4500 4098 | - 402 | 9 | 4500 5138 | + 638 | 14 | 9. NO. TESTS FOR IMPORTED ANMLS INCL DOGS AND CATS | 6000 5500 | - 500 | 8 | 5500 5500 | + 0 | 0 | 10. # OF AQUATIC ANIMAL HEALTH DOCUMENTS ISSUED | 2000 1538 | - 462 | 23 | 2000 1400 | - 600 | 30 |
- 108 -

01 03 02 02 0201 03 02 02 0201 03 02 02 0201 03 02 02 02PROGRAM TITLE: PROGRAM TITLE: PROGRAM TITLE: PROGRAM TITLE: ANIMAL DISEASE CONTROLANIMAL DISEASE CONTROLANIMAL DISEASE CONTROLANIMAL DISEASE CONTROL AGR 132AGR 132AGR 132AGR 132
VARIANCE REPORT NARRATIVE FY 2020 AND FY 2021
01 03 02 02 02 PROGRAM TITLE: ANIMAL DISEASE CONTROL AGR 132
PART I - EXPENDITURES AND POSITIONS
Variances in expenditures are due to vacancies and the absence of special fund expenditures. Variances in positions are due to difficulties in finding qualified candidates for vacant positions.
PART II - MEASURES OF EFFECTIVENESS
Item 3. Increase due to adding surveillance for African swine fever.
PART III - PROGRAM TARGET GROUPS
No significant variances.
PART IV - PROGRAM ACTIVITIES
Item 1. The decrease is due to the number of market hogs being imported into the State.� � Item 2. The decrease is due to the delay of an anticipated start up of a new egg layer operation on Oahu, resulting in a reduction in the number of day-old chicks and hatching eggs entering the State.� � Item 3. The decrease is due to a reduction in the number of pets entering the State as a result of decreases in travel associated with the COVID-19 outbreak.� � Item 4. The decrease is due to the lower number of upland game birds entering the State.� � Items 5 & 6. The increases are due to the number of smaller operations and backyard type farmers getting into livestock and poultry production; some of which have been associated with self-sustainability efforts during the COVID-19 outbreak. A lack of formal education and experience results in requests for assistance with diagnostics for otherwise routine disease occurrences and investigations.� � �
Item 7. Decrease is a result of delays in farm testing activities and animal imports due to COVID-19 pandemic quarantine and travel restrictions.� � Item 10. The decrease is due to a reduction in the documentation required for shrimp exportation to certain international destinations such as India.
- 109 -

|||
12/5/20 STATE OF HAWAII VARIANCE REPORT REPORT V61 PROGRAM TITLE: PRODUCT DEVELOPMENT AND MARKETING FOR AGR PROGRAM-ID: PROGRAM STRUCTURE NO: 010303
FISCAL YEAR 2019-20 THREE MONTHS ENDED 09-30-20 NINE MONTHS ENDING 06-30-21
PART I: EXPENDITURES & POSITIONS BUDGETED ACTUAL + CHANGE_ % BUDGETED ACTUAL + CHANGE_ % BUDGETED ESTIMATED + CHANGE_ %
RESEARCH & DEVELOPMENT COSTS POSITIONS EXPENDITURES ($1,000's)
OPERATING COSTS POSITIONS 64.00 47.00 - 17.00 27 64.00 46.00 - 18.00 28 64.00 47.00 - 17.00 27 EXPENDITURES ($1000's) 16,717 8,965 - 7,752 46 2,876 2,080 - 796 28 9,697 10,493 + 796 8
TOTAL COSTS POSITIONS 64.00 47.00 - 17.00 27 64.00 46.00 - 18.00 28 64.00 47.00 - 17.00 27 EXPENDITURES ($1000's) 16,717 8,965 - 7,752 46 2,876 2,080 - 796 28 9,697 10,493 + 796 8
| FISCAL YEAR 2019-20 | FISCAL YEAR 2020-21 | | PLANNED ACTUAL | + CHANGE_ | % | PLANNED ESTIMATED | + CHANGE_ | % |
PART II: MEASURES OF EFFECTIVENESS | | | | | | | 1. MARKETING ACTIVITIES CREATED, CONDUCTED OR MANAGED | 24 25 | + 1 | 4 | 24 24 | + 0 | 0 | 2. NO. OF REQ FOR PROPOSALS OFFERED TO ASSOCIATION | 4 6 | + 2 | 50 | 4 4 | + 0 | 0 | 3. NO. OF CONTRACTS, LOA, MOU, ADMINISTERED | 20 555 | + 535 | 2675 | 20 75 | + 55 | 275 |
- 110 -

PROGRAM TITLE: PROGRAM TITLE: PRODUCT DEVELOPMENT AND MARKETING FOR AGRPRODUCT DEVELOPMENT AND MARKETING FOR AGR 01 03 0301 03 03
VARIANCE REPORT NARRATIVE FY 2020 AND FY 2021
PROGRAM TITLE: PRODUCT DEVELOPMENT AND MARKETING FOR AGR 01 03 03
PART I - EXPENDITURES AND POSITIONS
Details of the position and expenditures variances are best examined at the lowest program level.
PART II - MEASURES OF EFFECTIVENESS
See Lowest Level Programs for additional information.
- 111 -

||||||||
||||||
|||||||
12/5/20 STATE OF HAWAII VARIANCE REPORT REPORT V61 PROGRAM TITLE: FORESTRY - RESOURCE MANAGEMENT & DEVELOPMENT PROGRAM-ID: LNR-172 PROGRAM STRUCTURE NO: 01030301
FISCAL YEAR 2019-20 THREE MONTHS ENDED 09-30-20 NINE MONTHS ENDING 06-30-21
PART I: EXPENDITURES & POSITIONS BUDGETED ACTUAL + CHANGE_ % BUDGETED ACTUAL + CHANGE_ % BUDGETED ESTIMATED + CHANGE_ %
RESEARCH & DEVELOPMENT COSTS POSITIONS EXPENDITURES ($1,000's)
OPERATING COSTS POSITIONS 28.00 23.00 - 5.00 18 28.00 23.00 - 5.00 18 28.00 23.00 - 5.00 18 EXPENDITURES ($1000's) 9,600 4,647 - 4,953 52 1,615 819 - 796 49 4,978 5,774 + 796 16
TOTAL COSTS POSITIONS 28.00 23.00 - 5.00 18 28.00 23.00 - 5.00 18 28.00 23.00 - 5.00 18 EXPENDITURES ($1000's) 9,600 4,647 - 4,953 52 1,615 819 - 796 49 4,978 5,774 + 796 16
| FISCAL YEAR 2019-20 | FISCAL YEAR 2020-21 | | PLANNED ACTUAL | + CHANGE_ | % | PLANNED ESTIMATED | + CHANGE_ | % |
PART II: MEASURES OF EFFECTIVENESS | | | | | | | 1. NO. OF SEEDLINGS DISTRIBUTED AND/OR SOLD | 100 91 | - 9 | 9 | 100 100 | + 0 | 0 | 2. NO. OF ACRES OF TREE PLANTING OR REFORESTATION | 100 46 | - 54 | 54 | 100 100 | + 0 | 0 | 3. NO. OF LANDOWNERS/ORGANIZATNS/COMMUNITS ASSISTED | 100 90.8 | - 9.2 | 9 | 100 100 | + 0 | 0 | 4. % STATE FUNDING MATCHED AGAINST O/SIDE FUNDNG SRCS | 100 250 | + 150 | 150 | 100 100 | + 0 | 0 | 5. ACRES ACQRD/SCRD FOR FORST RSRV/OTHER FRSTRY PRPS | 100 225 | + 125 | 125 | 100 200 | + 100 | 100 | 6. ACRES DEPRTMNTL LANDS UNDR COMMERCIAL TIMBER MGMT | 100 .6 | - 99.4 | 99 | 100 2 | - 98 | 98 | 7. $ VALUE REVNUE FR FORST PROD & OTHR FORST REV SRCS | 100 102 | + 2 | 2 | 100 100 | + 0 | 0 | 8. NO. INFORMTIONL MATRLS PRODCD & OUTRCH EVNTS ATTND | 100 100 | + 0 | 0 | 100 100 | + 0 | 0 |
PART III: PROGRAM TARGET GROUP | | | | | | | 1. FOREST PRODCT PRODCRS/PROCSSRS/RELTD BUSNS/INVSTRS | 150 471 | + 321 | 214 | 150 150 | + 0 | 0 | 2. FOREST AND RANGE LANDOWNERS | 50 147 | + 97 | 194 | 50 400 | + 350 | 700 | 3. BUSINESS COMMUNITY | 50 48 | - 2 | 4 | 50 25 | - 25 | 50 | 4. EDUCATION COMMUNITY | NO DATA 5 | + 5 | 0 | NO DATA 5 | + 5 | 0 | 5. WATERSHED PARTNERS | NO DATA 10 | + 10 | 0 | NO DATA 10 | + 10 | 0 | 6. COMMUNITY VOLUNTEER ORGANIZATIONS | 100 242 | + 142 | 142 | 100 250 | + 150 | 150 |
PART IV: PROGRAM ACTIVITY | | | | | | | 1. PRODCE & SUBSQNTL DISTRBTE &/OR SELL TREE SEEDLNGS | 60000 54623 | - 5377 | 9 | 60000 60000 | + 0 | 0 | 2. PLANT OR REFOREST DEPARTMENTAL LANDS | 150 69 | - 81 | 54 | 150 150 | + 0 | 0 | 3. PROVDE TECH FORSTRY ASSIST TO LNDWNRS/ORG/AGN/COMM | 1000 908 | - 92 | 9 | 1000 1000 | + 0 | 0 | 4. LEVERAGE STATE FUNDS/ASSOC SVCS THRU GRNTS/PRGM | 2 5 | + 3 | 150 | 2 2 | + 0 | 0 | 5. ACQUIRE/SECURE LANDS ADDTN TO FOREST RES SYS | 2000 4516 | + 2516 | 126 | 2000 4000 | + 2000 | 100 | 6. DEVELOP DEPARTMENTAL LANDS FOR COMMERCL TIMBR MNGT | 6000 40 | - 5960 | 99 | 6000 100 | - 5900 | 98 | 7. GENERATE REVENUES FROM NON-TRADTNL FOREST PRODUCTS | 50000 51295 | + 1295 | 3 | 50000 50000 | + 0 | 0 |
- 112 -

01 03 03 0101 03 03 0101 03 03 01PROGRAM TITLE: PROGRAM TITLE: PROGRAM TITLE: FORESTRY - RESOURCE MANAGEMENT & DEVELOPMENTFORESTRY - RESOURCE MANAGEMENT & DEVELOPMENTFORESTRY - RESOURCE MANAGEMENT & DEVELOPMENT LNR 172LNR 172LNR 172
VARIANCE REPORT NARRATIVE FY 2020 AND FY 2021
01 03 03 01 PROGRAM TITLE: FORESTRY - RESOURCE MANAGEMENT & DEVELOPMENT LNR 172
PART I - EXPENDITURES AND POSITIONS
The number of positions filled was less than the budgeted in FY 20 and 1st quarter of FY 21 due to vacancies attributed to staff promotions, retirements and resignations, as well as a hiring freeze that began in March 2020. The division is unable to fill all 28 budgeted positions by the end FY 21 due to the defunding of 5 permanent positions by Act 9, SLH 2020. � � The program expenditures for FY 20 were 52% below the allowed and budgeted ceiling. The program did not generate the projected revenues in S-347 for commercial forestry projects due to implementation delays. Funds actually expended in the first quarter of FY 20 were less than budgeted due to transfers between State funds and federal grant reimbursements; State funds must be expended before the Department can request federal grant reimbursement, which is then returned to the State general fund. The variance is also due to the delay in contract and purchase order encumbrances.
PART II - MEASURES OF EFFECTIVENESS
Item 2. The Department was 54% below the target for trees planted or reforested. This variance is attributed to impacts associated with COVID-19 restrictions and limited ability to use group and volunteer planting events. � � Item 4. The Department was 150% above the target of State funding matched against other nonstate funding sources. This is largely due to the purchase of the Waimea Native Forest on O'ahu that contributed over $3 million of federal and private funds towards the acquisition. � � Item 5. The Department was 125% above the target of acres acquired thanks to the purchase of the Waimea Native Forest on O'ahu and Pua'ahala Watershed on Moloka'i. The Department has several executive orders processing for addition to the Forest Reserve System and multiple large land acquisitions pending for FY 21.� �
Item 6. The Department was 99% below the target for lands under commercial timber management due to only small-scale commercial sales through the forest reserves; much of the Department's commercial timber production is focused on smaller scale sales at this time.
PART III - PROGRAM TARGET GROUPS
Item 1. In FY 20, the Department was 214% above the target due to efforts to increase commercial timber management and non-timber forest products, as well as increasing business interest in investing in natural resource management. � � Item 2. In FY 20, the Department was 194% above the target and is projected to be 700% above the target in FY 21 largely due in part to the large number of landowners interested in technical support on forest management for their properties. � � Item 4. New goal category for this reporting period; the target goal should be set at 10. � � Item 5. New goal category for this reporting period; the target goal should be set at 10. � � Item 6. The Department was 142% above the goal for target groups due to the recent hiring of an Urban and Community Forester and establishment of the Hawaii Wood Utilization Team, both of which have done substantial amount of community engagement and outreach and engaged community volunteer organizations.
PART IV - PROGRAM ACTIVITIES
Item 1. No significant variances.� � Item 2. The Department reforested an estimated 69 acres during FY 20, which is 54% below our target. This variance is attributed to impacts associated with COVID-19 restrictions and limited ability to use group and volunteer planting events. �
- 113 -

VARIANCE REPORT NARRATIVE FY 2020 AND FY 2021
01 03 03 01 PROGRAM TITLE: FORESTRY - RESOURCE MANAGEMENT & DEVELOPMENT LNR 172
� Item 4. The Department's leverage State resources increased, with over $5 million from private and federal funds. The increase beyond the goal is largely due to the purchase of the Waimea Native Forest on O'ahu that contributed over $3 million of federal and private funds towards the acquisition. � � Item 5. The Department secured 4,516 acres of land through the purchase of the Waimea Native Forest on O'ahu and Pu'uahala Watershed on Moloka'i during FY 20, which is 126% higher than the target. Additionally, the Department is still processing several executive orders for addition to the Forest Reserve System, and actively worked on several acquisition projects of approximately 16,800 acres and anticipates closing in FY 21 and FY 22. � � Item 6. The Department placed 40 acres of its land under commercial timber management during FY 20, which is 99% below our target. This variance is attributed to a focus on smaller-scale commercial harvesting opportunities for higher valued products.
- 114 -

|||||
||||
|||||||
STATE OF HAWAII VARIANCE REPORT REPORT V61 PROGRAM TITLE: QUALITY AND PRICE ASSURANCE 12/5/20 PROGRAM-ID: AGR-151 PROGRAM STRUCTURE NO: 01030302
FISCAL YEAR 2019-20 THREE MONTHS ENDED 09-30-20 NINE MONTHS ENDING 06-30-21
PART I: EXPENDITURES & POSITIONS BUDGETED ACTUAL + CHANGE_ % BUDGETED ACTUAL + CHANGE_ % BUDGETED ESTIMATED + CHANGE_ %
RESEARCH & DEVELOPMENT COSTS POSITIONS EXPENDITURES ($1,000's)
OPERATING COSTS POSITIONS 23.00 14.00 - 9.00 39 23.00 13.00 - 10.00 43 23.00 14.00 - 9.00 39 EXPENDITURES ($1000's) 3,522 1,813 - 1,709 49 627 627 + 0 0 2,116 2,116 + 0 0
TOTAL COSTS POSITIONS 23.00 14.00 - 9.00 39 23.00 13.00 - 10.00 43 23.00 14.00 - 9.00 39 EXPENDITURES ($1000's) 3,522 1,813 - 1,709 49 627 627 + 0 0 2,116 2,116 + 0 0
| FISCAL YEAR 2019-20 | FISCAL YEAR 2020-21 | | PLANNED ACTUAL | + CHANGE_ | % | PLANNED ESTIMATED | + CHANGE_ | % |
PART II: MEASURES OF EFFECTIVENESS | | | | | | | 1. % OF ENFORCEMENT INSP THAT COMPLY W/ LAWS AND RULE | 95 96 | + 1 | 1 | 95 95 | + 0 | 0 | 2. % CERTIFICATION REQUESTS FULFILLED | 100 100 | + 0 | 0 | 100 100 | + 0 | 0 | 3. AVERAGE TURN AROUND TIME IN DAYS FOR COFFEE CERT | 3 3 | + 0 | 0 | 3 3 | + 0 | 0 | 4. % OF MIN CLASS ONE MILK PRICE RECEIVED BY PRODUCER | 100 100 | + 0 | 0 | 100 100 | + 0 | 0 | 5. % OF AUDITED FARMS COMPLYING W/ GOOD AG PRACTICES | 95 95 | + 0 | 0 | 95 95 | + 0 | 0 |
PART III: PROGRAM TARGET GROUP | | | | | | | 1. PRODUCERS AND PROCESSORS OF AGRICULTURAL PRODUCTS | 5500 5500 | + 0 | 0 | 5500 5500 | + 0 | 0 | 2. WHOLESALERS AND RETAILERS OF AGRICULTURAL PRODUCTS | 441 439 | - 2 | 0 | 441 441 | + 0 | 0 | 3. PRODUCERS, PROD-DISTRIB & DISTRIBUTORS OF MILK | 22 19 | - 3 | 14 | 22 19 | - 3 | 14 | 4. PRODUCERS AND DISTRIBUTORS OF ANIMAL FEED PRODUCTS | 12 8 | - 4 | 33 | 12 12 | + 0 | 0 |
PART IV: PROGRAM ACTIVITY | | | | | | | 1. # OF CERT ISSUED FOR GRADE AND COND OF AG COMM | 1000 853 | - 147 | 15 | 1000 1900 | + 900 | 90 | 2. # OF LOTS OF AG COMM INSP FOR COMP W/ LAWS & RULES | 2000 8245 | + 6245 | 312 | 2000 2000 | + 0 | 0 | 3. NUMBER OF DEALERS IN AG PRODUCTS LICENSED | 950 923 | - 27 | 3 | 950 950 | + 0 | 0 | 4. # PRODUCERS, PROD-DIST, AND DIST OF MILK LICENSED | 24 19 | - 5 | 21 | 24 19 | - 5 | 21 | 5. NUMBER OF MONTHLY MILK PAYROLLS CALCULATED | 24 24 | + 0 | 0 | 24 24 | + 0 | 0 | 6. # OF TIMES MIN PRICE TO MILK PRODUCERS IS ADJUSTED | 12 12 | + 0 | 0 | 12 12 | + 0 | 0 | 7. # OF HRS EDUC SESSIONS TO IMP COMP W/ LAWS & RULE | 10 2 | - 8 | 80 | 10 10 | + 0 | 0 |
- 115 -

VARIANCE REPORT NARRATIVE FY 2020 AND FY 2021
01 03 03 0201 03 03 0201 03 03 0201 03 03 0201 03 03 02 PROGRAM TITLE: PROGRAM TITLE: PROGRAM TITLE: PROGRAM TITLE: QUALITY AND PRICE ASSURANCEPROGRAM TITLE: QUALITY AND PRICE ASSURANCEQUALITY AND PRICE ASSURANCEQUALITY AND PRICE ASSURANCEQUALITY AND PRICE ASSURANCE AGR 151AGR 151AGR 151AGR 151AGR 151
PART I - EXPENDITURES AND POSITIONS
Variances were due to position vacancies and lower than expected special, revolving, and federal fund expenditures. Position variances are due to lack of qualified candidates for vacant positions.
PART II - MEASURES OF EFFECTIVENESS
No significant variances.
PART III - PROGRAM TARGET GROUPS
Item 3. The decrease in producers, producer-distributors, and distributors of milk is due to the closing of one dairy. � � Item 4. The decrease in producers and distributors importing animal feed products is possibly due to shipping costs.
PART IV - PROGRAM ACTIVITIES
Item 1. The variance is due to a decline in certification of agricultural commodities. � � Item 2. The increase in variance is due to availability of fresh fruits and vegetables inspected for compliance with laws and rules. � � Item 4. The variance is due to a decline in local milk industry.� � Item 7. The decreased number of hours of education sessions are due to limited outreach activities resulting from the COVID-19 pandemic. �
- 116 -

||||
|||
||||
STATE OF HAWAII VARIANCE REPORT REPORT V61 PROGRAM TITLE: AGRICULTURAL DEVELOPMENT AND MARKETING 12/5/20 PROGRAM-ID: AGR-171 PROGRAM STRUCTURE NO: 01030303
FISCAL YEAR 2019-20 THREE MONTHS ENDED 09-30-20 NINE MONTHS ENDING 06-30-21
PART I: EXPENDITURES & POSITIONS BUDGETED ACTUAL + CHANGE_ % BUDGETED ACTUAL + CHANGE_ % BUDGETED ESTIMATED + CHANGE_ %
RESEARCH & DEVELOPMENT COSTS POSITIONS EXPENDITURES ($1,000's)
OPERATING COSTS POSITIONS 13.00 10.00 - 3.00 23 13.00 10.00 - 3.00 23 13.00 10.00 - 3.00 23 EXPENDITURES ($1000's) 3,595 2,505 - 1,090 30 634 634 + 0 0 2,603 2,603 + 0 0
TOTAL COSTS POSITIONS 13.00 10.00 - 3.00 23 13.00 10.00 - 3.00 23 13.00 10.00 - 3.00 23 EXPENDITURES ($1000's) 3,595 2,505 - 1,090 30 634 634 + 0 0 2,603 2,603 + 0 0
| FISCAL YEAR 2019-20 | FISCAL YEAR 2020-21 | | PLANNED ACTUAL | + CHANGE_ | % | PLANNED ESTIMATED | + CHANGE_ | % |
PART II: MEASURES OF EFFECTIVENESS | | | | | | | 1. MARKETING ACTIVITIES CREATED, CONDUCTED OR MANAGED | 24 25 | + 1 | 4 | 24 24 | + 0 | 0 | 2. PRODUCER GROUPS CONTACTED THRU OUTREACH ACTIVITIES | 40 110 | + 70 | 175 | 40 80 | + 40 | 100 | 3. NO. OF REQ FOR PROPOSALS OFFERED TO ASSOCIATION | 4 6 | + 2 | 50 | 4 4 | + 0 | 0 | 4. NO. OF CONTRACTS, LOA, MOU, ADMINISTERED | 20 555 | + 535 | 2675 | 20 75 | + 55 | 275 |
PART III: PROGRAM TARGET GROUP | | | | | | | 1. PRODUCERS AND PROCESSORS OF AGRICULTURAL PRODUCTS | 7000 7328 | + 328 | 5 | 7000 7328 | + 328 | 5 | 2. COMMODITY GROUPS | 10 10 | + 0 | 0 | 10 10 | + 0 | 0 | 3. COMMODITY ASSOCIATIONS, COOPERATIVES, FEDERATIONS | 10 10 | + 0 | 0 | 10 10 | + 0 | 0 |
PART IV: PROGRAM ACTIVITY | | | | | | | 1. SEEK AND APPLY FOR FED FUNDING VIA GRANTS, PRGMS | 3 3 | + 0 | 0 | 3 3 | + 0 | 0 | 2. COLLECT, COMPILE AND PUBLISH STATISTICS (NASS/HAS) | 75 58 | - 17 | 23 | 75 60 | - 15 | 20 | 3. CREATE ECONOMIC REPORTS AND MARKET STUDIES | 20 14 | - 6 | 30 | 20 15 | - 5 | 25 | 4. PLAN, MANAGE, OR ATTEND TRADE SHOWS | 5 5 | + 0 | 0 | 5 2 | - 3 | 60 |
- 117 -
01 03 03 0301 03 03 0301 03 03 03PROGRAM TITLE: PROGRAM TITLE: PROGRAM TITLE: AGRICULTURAL DEVELOPMENT AND MARKETINGAGRICULTURAL DEVELOPMENT AND MARKETINGAGRICULTURAL DEVELOPMENT AND MARKETING AGR 171AGR 171AGR 171
VARIANCE REPORT NARRATIVE FY 2020 AND FY 2021
01 03 03 03 PROGRAM TITLE: AGRICULTURAL DEVELOPMENT AND MARKETING AGR 171
PART I - EXPENDITURES AND POSITIONS
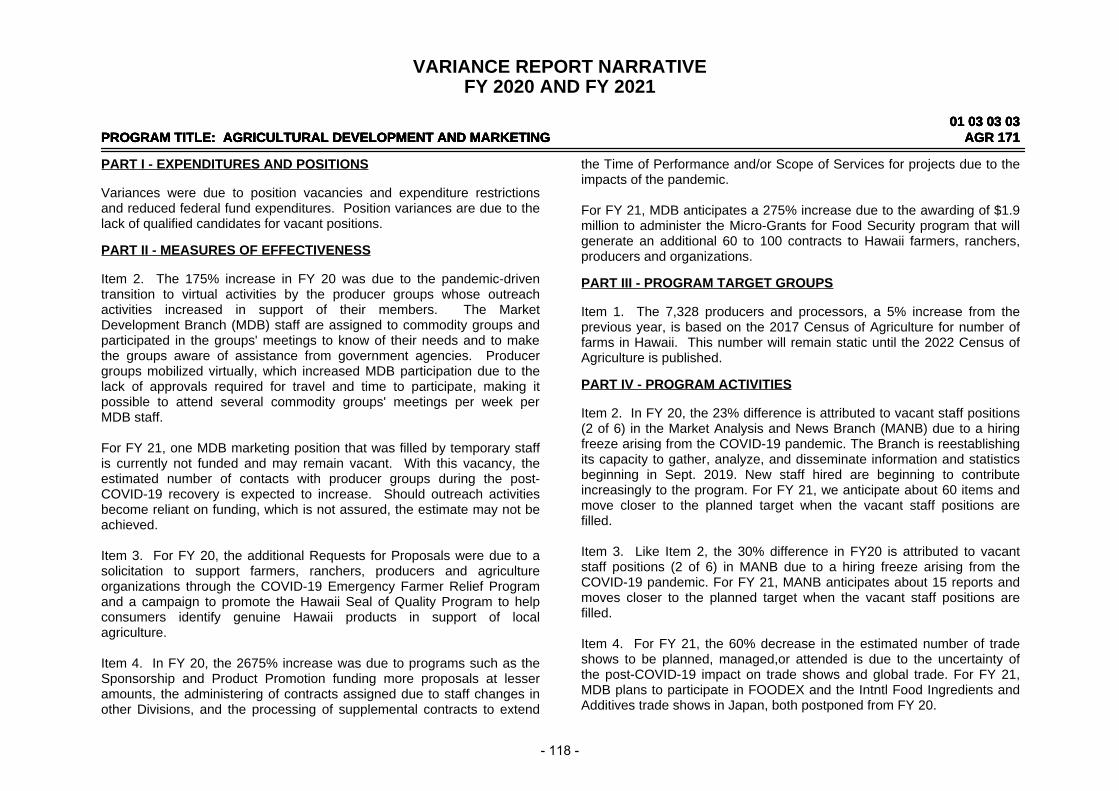
Variances were due to position vacancies and expenditure restrictions and reduced federal fund expenditures. Position variances are due to the lack of qualified candidates for vacant positions.
PART II - MEASURES OF EFFECTIVENESS
Item 2. The 175% increase in FY 20 was due to the pandemic-driven transition to virtual activities by the producer groups whose outreach activities increased in support of their members. The Market Development Branch (MDB) staff are assigned to commodity groups and participated in the groups' meetings to know of their needs and to make the groups aware of assistance from government agencies. Producer groups mobilized virtually, which increased MDB participation due to the lack of approvals required for travel and time to participate, making it possible to attend several commodity groups' meetings per week per MDB staff. � � For FY 21, one MDB marketing position that was filled by temporary staff is currently not funded and may remain vacant. With this vacancy, the estimated number of contacts with producer groups during the post-COVID-19 recovery is expected to increase. Should outreach activities become reliant on funding, which is not assured, the estimate may not be achieved.� � Item 3. For FY 20, the additional Requests for Proposals were due to a solicitation to support farmers, ranchers, producers and agriculture organizations through the COVID-19 Emergency Farmer Relief Program and a campaign to promote the Hawaii Seal of Quality Program to help consumers identify genuine Hawaii products in support of local agriculture. � � Item 4. In FY 20, the 2675% increase was due to programs such as the Sponsorship and Product Promotion funding more proposals at lesser amounts, the administering of contracts assigned due to staff changes in other Divisions, and the processing of supplemental contracts to extend
the Time of Performance and/or Scope of Services for projects due to the impacts of the pandemic. � � For FY 21, MDB anticipates a 275% increase due to the awarding of $1.9 million to administer the Micro-Grants for Food Security program that will generate an additional 60 to 100 contracts to Hawaii farmers, ranchers, producers and organizations.
PART III - PROGRAM TARGET GROUPS
Item 1. The 7,328 producers and processors, a 5% increase from the previous year, is based on the 2017 Census of Agriculture for number of farms in Hawaii. This number will remain static until the 2022 Census of Agriculture is published.
PART IV - PROGRAM ACTIVITIES
Item 2. In FY 20, the 23% difference is attributed to vacant staff positions (2 of 6) in the Market Analysis and News Branch (MANB) due to a hiring freeze arising from the COVID-19 pandemic. The Branch is reestablishing its capacity to gather, analyze, and disseminate information and statistics beginning in Sept. 2019. New staff hired are beginning to contribute increasingly to the program. For FY 21, we anticipate about 60 items and move closer to the planned target when the vacant staff positions are filled.� � Item 3. Like Item 2, the 30% difference in FY20 is attributed to vacant staff positions (2 of 6) in MANB due to a hiring freeze arising from the COVID-19 pandemic. For FY 21, MANB anticipates about 15 reports and moves closer to the planned target when the vacant staff positions are filled.� � Item 4. For FY 21, the 60% decrease in the estimated number of trade shows to be planned, managed,or attended is due to the uncertainty of the post-COVID-19 impact on trade shows and global trade. For FY 21, MDB plans to participate in FOODEX and the Intntl Food Ingredients and Additives trade shows in Japan, both postponed from FY 20.
- 118 -

||
STATE OF HAWAII VARIANCE REPORT REPORT V61 PROGRAM TITLE: GENERAL SUPPORT FOR AGR 12/5/20 PROGRAM-ID: PROGRAM STRUCTURE NO: 010304
FISCAL YEAR 2019-20 THREE MONTHS ENDED 09-30-20 NINE MONTHS ENDING 06-30-21
PART I: EXPENDITURES & POSITIONS BUDGETED ACTUAL + CHANGE_ % BUDGETED ACTUAL + CHANGE_ % BUDGETED ESTIMATED + CHANGE_ %
RESEARCH & DEVELOPMENT COSTS POSITIONS EXPENDITURES ($1,000's)
OPERATING COSTS POSITIONS 80.00 56.00 - 24.00 30 80.00 53.00 - 27.00 34 80.00 58.00 - 22.00 28 EXPENDITURES ($1000's) 15,438 11,692 - 3,746 24 3,484 3,484 + 0 0 11,377 11,377 + 0 0
TOTAL COSTS POSITIONS 80.00 56.00 - 24.00 30 80.00 53.00 - 27.00 34 80.00 58.00 - 22.00 28 EXPENDITURES ($1000's) 15,438 11,692 - 3,746 24 3,484 3,484 + 0 0 11,377 11,377 + 0 0
| FISCAL YEAR 2019-20 | FISCAL YEAR 2020-21 | | PLANNED ACTUAL | + CHANGE_ | % | PLANNED ESTIMATED | + CHANGE_ | % |
PART II: MEASURES OF EFFECTIVENESS | | | | | | | 1. # OF ACRES RECLASSIFIED FROM AGR TO URBAN USE | 300 0 | - 300 | 100 | 300 300 | + 0 | 0 | 2. LANDS IRRIGATED BY DEPT OF AG IRRIG SYS (ACRES) | 12400 11870 | - 530 | 4 | 12400 11870 | - 530 | 4 |
- 119 -

PROGRAM TITLE: PROGRAM TITLE: GENERAL SUPPORT FOR AGRGENERAL SUPPORT FOR AGR 01 03 0401 03 04
VARIANCE REPORT NARRATIVE FY 2020 AND FY 2021
PROGRAM TITLE: GENERAL SUPPORT FOR AGR 01 03 04
PART I - EXPENDITURES AND POSITIONS
Details of the position and expenditures variances are best examined at the lowest program level.
PART II - MEASURES OF EFFECTIVENESS
See Lowest Level Programs for additional information.
- 120 -

||
||
|||||
STATE OF HAWAII VARIANCE REPORT REPORT V61 PROGRAM TITLE: AGRICULTURAL RESOURCE MANAGEMENT 12/5/20 PROGRAM-ID: AGR-141 PROGRAM STRUCTURE NO: 01030401
FISCAL YEAR 2019-20 THREE MONTHS ENDED 09-30-20 NINE MONTHS ENDING 06-30-21
PART I: EXPENDITURES & POSITIONS BUDGETED ACTUAL + CHANGE_ % BUDGETED ACTUAL + CHANGE_ % BUDGETED ESTIMATED + CHANGE_ %
RESEARCH & DEVELOPMENT COSTS POSITIONS EXPENDITURES ($1,000's)
OPERATING COSTS POSITIONS 37.00 31.00 - 6.00 16 37.00 29.00 - 8.00 22 37.00 33.00 - 4.00 11 EXPENDITURES ($1000's) 4,666 3,598 - 1,068 23 1,008 1,008 + 0 0 3,410 3,410 + 0 0
TOTAL COSTS POSITIONS 37.00 31.00 - 6.00 16 37.00 29.00 - 8.00 22 37.00 33.00 - 4.00 11 EXPENDITURES ($1000's) 4,666 3,598 - 1,068 23 1,008 1,008 + 0 0 3,410 3,410 + 0 0
PART II: MEASURES OF EFFECTIVENESS 1. LANDS IRRIGATED BY DEPT OF AG IRRIG SYS (ACRES) 2. AGRICULTURAL LANDS LEASED (ACRES)
| FISCAL YEAR 2019-20 | PLANNED ACTUAL | + CHANGE_ | | | | | 12400 11870 | - 530 | | 20000 20111 | + 111 |
| FISCAL YEAR 2020-21 % | PLANNED ESTIMATED | + CHANGE_
| | 4 | 12400 11870 | - 530 1 | 20000 20150 | + 150
| | | |
%
4 1
| | | | |
PART III: PROGRAM TARGET GROUP 1. FARMS SERVED BY DEPT OF AG IRRIG SYSTEMS 2. FARMS LEASED ON DEPT OF AG LANDS
| ||
615 485
600 460
| | -| -
| 15 | 25 |
2 5
| ||
615 495
597 475
| | -| -
18 20
| | |
3 4
| | |
PART IV: PROGRAM ACTIVITY 1. NO. OF CURRENT IRRIGATION/LAND CIP PROJECTS 2. NUMBER OF NEW WATER SERVICES INSTALLED 3. PIPELINE AND DITCHES MAINTAINED (MILES) 4. NO. OF AG LAND FIELD INSPECTIONS CONDUCTED 5. NUMBER OF DAM SAFETY INSPECTIONS CONDUCTED
| |||||
75 10
100 360 25
68 0
100 285 26
| | -| -| + | -| +
| 7 |
10 | 0 |
75 | 1 |
| 9 |
100 |0 |
21 |4 |
75 10
100 370 25
75 3
100 345 12
| | + | -| + | -| -
0 7 0
25 13
| | | | | |
0 70 0 7
52
| | | | | |
- 121 -

01 03 04 0101 03 04 0101 03 04 0101 03 04 01PROGRAM TITLE: PROGRAM TITLE: PROGRAM TITLE: PROGRAM TITLE: AGRICULTURAL RESOURCE MANAGEMENTAGRICULTURAL RESOURCE MANAGEMENTAGRICULTURAL RESOURCE MANAGEMENTAGRICULTURAL RESOURCE MANAGEMENT AGR 141AGR 141AGR 141AGR 141
VARIANCE REPORT NARRATIVE FY 2020 AND FY 2021
01 03 04 01 PROGRAM TITLE: AGRICULTURAL RESOURCE MANAGEMENT AGR 141
PART I - EXPENDITURES AND POSITIONS
Variances were due to vacant positions and lower than expected special and revolving fund expenditures. Position variances are due to a lack of qualified candidates for vacant positions.
PART II - MEASURES OF EFFECTIVENESS
No significant variances.
PART III - PROGRAM TARGET GROUPS
No significant variances.
PART IV - PROGRAM ACTIVITIES
Item 2 - Actual FY 20 - Prospective customers declined meter installation due to cost and unable to add customers until Big Island reservoir improvement projects are completed and water restored in the reservoirs. Estimated FY 21 - Anticipate farmers hesitating to start business due to unstable economy resulting from COVID-19 pandemic. Also, unable to add customers until Big Island reservoir improvement projects are completed and water restored in the reservoirs. � � Item 4 - There were fewer leases transferred from the Department of Land and Natural Resources than anticipated. Additionally, since COVID-19 restrictions took effect in the second half of FY 20, all site visits were postponed until such time that it is deemed safer to resume this activity.� � Item 5 - Estimated FY 21 - Travel limited due to COVID-19 pandemic, which will limit the amount of dam safety inspections that can be conducted.� � �
- 122 -

|||||||
|||||||
||||||||
STATE OF HAWAII VARIANCE REPORT REPORT V61 PROGRAM TITLE: AGRIBUSINESS DEVELOPMENT AND RESEARCH 12/5/20 PROGRAM-ID: AGR-161 PROGRAM STRUCTURE NO: 01030402
FISCAL YEAR 2019-20 THREE MONTHS ENDED 09-30-20 NINE MONTHS ENDING 06-30-21
PART I: EXPENDITURES & POSITIONS BUDGETED ACTUAL + CHANGE_ % BUDGETED ACTUAL + CHANGE_ % BUDGETED ESTIMATED + CHANGE_ %
RESEARCH & DEVELOPMENT COSTS POSITIONS EXPENDITURES ($1,000's)
OPERATING COSTS POSITIONS 10.00 0.00 - 10.00 100 10.00 0.00 - 10.00 100 10.00 0.00 - 10.00 100 EXPENDITURES ($1000's) 7,295 5,291 - 2,004 27 1,163 1,163 + 0 0 4,028 4,028 + 0 0
TOTAL COSTS POSITIONS 10.00 0.00 - 10.00 100 10.00 0.00 - 10.00 100 10.00 0.00 - 10.00 100 EXPENDITURES ($1000's) 7,295 5,291 - 2,004 27 1,163 1,163 + 0 0 4,028 4,028 + 0 0
| FISCAL YEAR 2019-20 | FISCAL YEAR 2020-21 | | PLANNED ACTUAL | + CHANGE_ | % | PLANNED ESTIMATED | + CHANGE_ | % |
PART II: MEASURES OF EFFECTIVENESS | | | | | | | 1. ACRES OF AGRICULTURAL LANDS DIRECTLY MANAGED | 31031 32250 | + 1219 | 4 | 31741 31031 | - 710 | 2 | 2. ACRES AG LANDS SRVED BY ADC IRRIG SYS & INFRSTRC | 18846 18346 | - 500 | 3 | 18846 18846 | + 0 | 0 | 3. NO. OF IRRIG AND INFRASTRC PROJ MANAGED BY ADC | 4 4 | + 0 | 0 | 4 4 | + 0 | 0 | 4. NO. OF AG RELATED FACILITIES MANAGED BY ADC | 1 1 | + 0 | 0 | 3 3 | + 0 | 0 | 5. ADC PROJECTS THAT BENEFIT DIVERSIFIED AGRICULTURE | 17 16 | - 1 | 6 | 17 16 | - 1 | 6 | 6. ACRES OF LAND AGRIC CONSERV EASEMNTS UNDER ADC | 108 108 | + 0 | 0 | 108 108 | + 0 | 0 | 7. AGRIC RELATED PROJ NEEDING ADC EVAL & INVOLVEMENT | 3 3 | + 0 | 0 | 3 3 | + 0 | 0 |
PART III: PROGRAM TARGET GROUP | | | | | | | 1. ACRES FRMR SUGAR & PINE LND AVAIL FOR CONT AG USE | 85032 86120 | + 1088 | 1 | 85742 86247 | + 505 | 1 | 2. MAJOR AGRICULTURAL IRRIGATION SYS & INFRASTRUCTURE | 11 10 | - 1 | 9 | 11 10 | - 1 | 9 | 3. AG PRCESSING, MRSHALLING, PACKING, WAREHSING FACIL | 3 2 | - 1 | 33 | 3 2 | - 1 | 33 | 4. PRDCRS AND RELATED AGRIBUSINESS IN ADC PROJ AREAS | 148 150 | + 2 | 1 | 149 150 | + 1 | 1 | 5. AGRICULTURAL COOPERATIVES | 6 5 | - 1 | 17 | 6 5 | - 1 | 17 | 6. LNDOWNRS INTRESTD IN PRSERVING AG LAND OR INFRASTR | 6 4 | - 2 | 33 | 6 4 | - 2 | 33 | 7. PRVT GRPS, GOV AGNCIES WRKING AG OR LND/WTR ISSUES | 18 17 | - 1 | 6 | 18 19 | + 1 | 6 |
PART IV: PROGRAM ACTIVITY | | | | | | | 1. ACRES OF AGRICULTURAL LANDS MANAGED BY ADC (ACRES) | 31638 30487 | - 1151 | 4 | 32348 31269 | - 1079 | 3 | 2. # OF ONGOING IRRIG SYS AND INFRASTRUCTURE PROJECTS | 9 8 | - 1 | 11 | 9 8 | - 1 | 11 | 3. # OF TECH ASSIST/CONSULT/PROJ/STUDIES INITI BY ADC | 3 3 | + 0 | 0 | 2 2 | + 0 | 0 | 4. # OF GRANTS AND CONTRACTS AWRDED OR MANAGED BY ADC | 1 1 | + 0 | 0 | 1 1 | + 0 | 0 | 5. # OF ONGOING CAPITAL IMP PROJ FOR ADC ASSETS | 7 7 | + 0 | 0 | 8 7 | - 1 | 13 | 6. # PRDCRS BENEFIT FR ADC LAND, IRRIG, INFRSTR & FAC | 151 149 | - 2 | 1 | 156 149 | - 7 | 4 | 7. ACRES COVRD BY AG CONS EASMNT TITLES HELD BY ADC | 108 108 | + 0 | 0 | 108 108 | + 0 | 0 | 8. AGRICULTURE RELATED PROJ BEING EVALUATED BY ADC | 2 2 | + 0 | 0 | 2 2 | + 0 | 0 |
- 123 -

01 03 04 0201 03 04 0201 03 04 0201 03 04 02PROGRAM TITLE: PROGRAM TITLE: PROGRAM TITLE: PROGRAM TITLE: AGRIBUSINESS DEVELOPMENT AND RESEARCHAGRIBUSINESS DEVELOPMENT AND RESEARCHAGRIBUSINESS DEVELOPMENT AND RESEARCHAGRIBUSINESS DEVELOPMENT AND RESEARCH AGR 161AGR 161AGR 161AGR 161
VARIANCE REPORT NARRATIVE FY 2020 AND FY 2021
01 03 04 02 PROGRAM TITLE: AGRIBUSINESS DEVELOPMENT AND RESEARCH AGR 161
PART I - EXPENDITURES AND POSITIONS
Variances were due to lower than anticipated revolving fund expenditures.
PART II - MEASURES OF EFFECTIVENESS
No significant variances.
PART III - PROGRAM TARGET GROUPS
Item 2. Actual FY 20 and estimated FY 21 variance is due to the lack of funding for others to operate the East Kauai Irrigation System.� � Item 3. Actual FY 20 and estimated FY 21 variance is due to lack of funding to continue master planning.� � Item 5. Actual FY 20 and estimated variance is due to the Agribusiness Development Corporation's discontinued interest in acquiring the Kau Irrigation System.� � Item 6. Program has not received the anticipated amount of interest from landowners.
PART IV - PROGRAM ACTIVITIES
Item 2. Actual FY 20 and estimated FY 21 variance are due to the lack of funding for others to operate the East Kauai Irrigation System.� �
- 124 -

||||
|||||
|||||
STATE OF HAWAII VARIANCE REPORT REPORT V61 PROGRAM TITLE: GENERAL ADMINISTRATION FOR AGRICULTURE 12/5/20 PROGRAM-ID: AGR-192 PROGRAM STRUCTURE NO: 01030403
FISCAL YEAR 2019-20 THREE MONTHS ENDED 09-30-20 NINE MONTHS ENDING 06-30-21
PART I: EXPENDITURES & POSITIONS BUDGETED ACTUAL + CHANGE_ % BUDGETED ACTUAL + CHANGE_ % BUDGETED ESTIMATED + CHANGE_ %
RESEARCH & DEVELOPMENT COSTS POSITIONS EXPENDITURES ($1,000's)
OPERATING COSTS POSITIONS 33.00 25.00 - 8.00 24 33.00 24.00 - 9.00 27 33.00 25.00 - 8.00 24 EXPENDITURES ($1000's) 3,477 2,803 - 674 19 1,313 1,313 + 0 0 3,939 3,939 + 0 0
TOTAL COSTS POSITIONS 33.00 25.00 - 8.00 24 33.00 24.00 - 9.00 27 33.00 25.00 - 8.00 24 EXPENDITURES ($1000's) 3,477 2,803 - 674 19 1,313 1,313 + 0 0 3,939 3,939 + 0 0
| FISCAL YEAR 2019-20 | FISCAL YEAR 2020-21 | | PLANNED ACTUAL | + CHANGE_ | % | PLANNED ESTIMATED | + CHANGE_ | % |
PART II: MEASURES OF EFFECTIVENESS | | | | | | | 1. # OF ACRES RECLASSIFIED FROM AG TO URBAN USE | 300 0 | - 300 | 100 | 300 300 | + 0 | 0 | 2. NUMBER OF POSITIONS FILLED | 50 60 | + 10 | 20 | 50 5 | - 45 | 90 | 3. % OF VENDOR PAYMENTS MADE WTHN 30 DAYS | 95 92 | - 3 | 3 | 95 92 | - 3 | 3 | 4. % OF DATA PROCESSING REQUESTS COMPLETED | 95 93 | - 2 | 2 | 95 93 | - 2 | 2 |
PART III: PROGRAM TARGET GROUP | | | | | | | 1. INVENTORY OF IMPORTANT AG LANDS (ACRES) | 137000 136489 | - 511 | 0 | 137000 137000 | + 0 | 0 | 2. EMPLOYEES (NUMBER) | 338 350 | + 12 | 4 | 340 350 | + 10 | 3 | 3. DIVISIONS (NUMBER) | 6 6 | + 0 | 0 | 6 6 | + 0 | 0 | 4. BRANCHES (NUMBER) | 12 12 | + 0 | 0 | 12 12 | + 0 | 0 | 5. ATTACHED AGENCIES (NUMBER) | 1 1 | + 0 | 0 | 1 1 | + 0 | 0 |
PART IV: PROGRAM ACTIVITY | | | | | | | 1. # LAND USE PERMIT APPL REVIEWED AFFECTING AG LANDS | 25 20 | - 5 | 20 | 25 25 | + 0 | 0 | 2. NUMBER OF PERSONNEL ACTIONS PROCESSED | 1900 1063 | - 837 | 44 | 1900 1000 | - 900 | 47 | 3. NUMBER OF PURCHASE ORDERS PROCESSED | 2665 2507 | - 158 | 6 | 2665 2650 | - 15 | 1 | 4. NUMBER OF PETTY CASH CHECKS PROCESSED | 130 80 | - 50 | 38 | 130 120 | - 10 | 8 | 5. NUMBER OF DATA PROCESSING REQUESTS RECEIVED | 600 589 | - 11 | 2 | 600 600 | + 0 | 0 |
- 125 -

01 03 04 0301 03 04 0301 03 04 0301 03 04 03PROGRAM TITLE: PROGRAM TITLE: PROGRAM TITLE: PROGRAM TITLE: GENERAL ADMINISTRATION FOR AGRICULTUREGENERAL ADMINISTRATION FOR AGRICULTUREGENERAL ADMINISTRATION FOR AGRICULTUREGENERAL ADMINISTRATION FOR AGRICULTURE AGR 192AGR 192AGR 192AGR 192
VARIANCE REPORT NARRATIVE FY 2020 AND FY 2021
01 03 04 03 PROGRAM TITLE: GENERAL ADMINISTRATION FOR AGRICULTURE AGR 192
PART I - EXPENDITURES AND POSITIONS
The variances in expenditures are due to vacant positions. The variances in positions are due to lack of qualified applicants to fill positions.
PART II - MEASURES OF EFFECTIVENESS
Item 1. There were no land use boundary amendments brought for action before the land use commission.� � Item 2. FY 20 variance and FY 21 estimated variance is due to budget conditions and associated hiring freeze.
PART III - PROGRAM TARGET GROUPS
No significant variances.
PART IV - PROGRAM ACTIVITIES
Item 1. FY 20 reduction is due to prioritization given to other work elements.� � Item 2. The variance is due to the implementation of HIPay; many� transactions require the Department of Human Resources Development's� assistance for completion.� � Items 4. The variance is due to an increased use of pCards (purchasing card) for purchases made by the department.
- 126 -

||||
STATE OF HAWAII VARIANCE REPORT REPORT V61 PROGRAM TITLE: FISHERIES AND AQUACULTURE 12/5/20 PROGRAM-ID: PROGRAM STRUCTURE NO: 0104
FISCAL YEAR 2019-20 THREE MONTHS ENDED 09-30-20 NINE MONTHS ENDING 06-30-21
PART I: EXPENDITURES & POSITIONS BUDGETED ACTUAL + CHANGE_ % BUDGETED ACTUAL + CHANGE_ % BUDGETED ESTIMATED + CHANGE_ %
RESEARCH & DEVELOPMENT COSTS POSITIONS EXPENDITURES ($1,000's)
OPERATING COSTS POSITIONS 17.00 14.00 - 3.00 18 17.00 14.00 - 3.00 18 17.00 13.00 - 4.00 24 EXPENDITURES ($1000's) 2,878 1,866 - 1,012 35 379 349 - 30 8 2,005 2,035 + 30 1
TOTAL COSTS POSITIONS 17.00 14.00 - 3.00 18 17.00 14.00 - 3.00 18 17.00 13.00 - 4.00 24 EXPENDITURES ($1000's) 2,878 1,866 - 1,012 35 379 349 - 30 8 2,005 2,035 + 30 1
| FISCAL YEAR 2019-20 | FISCAL YEAR 2020-21 | | PLANNED ACTUAL | + CHANGE_ | % | PLANNED ESTIMATED | + CHANGE_ | % |
PART II: MEASURES OF EFFECTIVENESS | | | | | | | 1. NUMBER OF LICENSES ISSUED | 4 3.5 | - 0.5 | 13 | 4 3.8 | - 0.2 | 5 | 2. AQUACULTURE PRODUCTION (THOUSANDS OF POUNDS) | 773 750 | - 23 | 3 | 792 450 | - 342 | 43 | 3. PRIMARY VALUE OF AQUACULTURE PRODUCTION ($000) | 87980 83232 | - 4748 | 5 | 92380 88000 | - 4380 | 5 | 4. TOTAL AQUACULTURE EMPLOYMENT | 500 369 | - 131 | 26 | 500 220 | - 280 | 56 |
- 127 -

PROGRAM TITLE: PROGRAM TITLE: FISHERIES AND AQUACULTUREFISHERIES AND AQUACULTURE 01 0401 04
VARIANCE REPORT NARRATIVE FY 2020 AND FY 2021
PROGRAM TITLE: FISHERIES AND AQUACULTURE 01 04
PART I - EXPENDITURES AND POSITIONS
Details of the position and expenditure variances are best examined at the lowest program level.
PART II - MEASURES OF EFFECTIVENESS
See Lowest Level Programs for additional information.�
- 128 -

||||||||
||||||||
||||||||||
STATE OF HAWAII VARIANCE REPORT REPORT V61 PROGRAM TITLE: FISHERIES MANAGEMENT 12/5/20 PROGRAM-ID: LNR-153 PROGRAM STRUCTURE NO: 010402
FISCAL YEAR 2019-20 THREE MONTHS ENDED 09-30-20 NINE MONTHS ENDING 06-30-21
PART I: EXPENDITURES & POSITIONS BUDGETED ACTUAL + CHANGE_ % BUDGETED ACTUAL + CHANGE_ % BUDGETED ESTIMATED + CHANGE_ %
RESEARCH & DEVELOPMENT COSTS POSITIONS EXPENDITURES ($1,000's)
OPERATING COSTS POSITIONS 13.00 11.00 - 2.00 15 13.00 11.00 - 2.00 15 13.00 10.00 - 3.00 23 EXPENDITURES ($1000's) 2,116 1,531 - 585 28 275 245 - 30 11 1,705 1,735 + 30 2
TOTAL COSTS POSITIONS 13.00 11.00 - 2.00 15 13.00 11.00 - 2.00 15 13.00 10.00 - 3.00 23 EXPENDITURES ($1000's) 2,116 1,531 - 585 28 275 245 - 30 11 1,705 1,735 + 30 2
| FISCAL YEAR 2019-20 | FISCAL YEAR 2020-21 | | PLANNED ACTUAL | + CHANGE_ | % | PLANNED ESTIMATED | + CHANGE_ | % |
PART II: MEASURES OF EFFECTIVENESS | | | | | | | 1. NUMBER OF LICENSES ISSUED | 4 3.5 | - 0.5 | 13 | 4 3.8 | - 0.2 | 5 | 2. FISHING RPRTS CLLCTD & PRCSSD AS % OF TTL RPTS DUE | 97 97 | + 0 | 0 | 97 97 | + 0 | 0 | 3. ONLNE COMMRCL MRNE FSHNG LCNS ISSD/RNW, ADPTN RATE | 42 50 | + 8 | 19 | 43 55 | + 12 | 28 | 4. ONLINE COMMERCIAL FISH REPORT FILING, ADOPTN RATE | 72 73 | + 1 | 1 | 72 75 | + 3 | 4 | 5. FISHING SUCCESS (FISH/TRIP) | 2 2 | + 0 | 0 | 2 2 | + 0 | 0 | 6. NUMBER OF FISHERY MANAGEMENT AREAS | 26 26 | + 0 | 0 | 27 26 | - 1 | 4 | 7. # OF NEW/AMENDED RULES TO SUSTAIN IMPORTNT SPECIES | 1 0 | - 1 | 100 | 1 3 | + 2 | 200 | 8. NUMBER OF FISHERMAN INTERVIEWED (THOUSANDS) | 7 7 | + 0 | 0 | 7 7 | + 0 | 0 |
PART III: PROGRAM TARGET GROUP | | | | | | | 1. LICENSED COMMERCIAL FISHERS (1000) | 3.7 3.1 | - 0.6 | 16 | 3.7 3.4 | - 0.3 | 8 | 2. COMMERCIAL MARINE DEALERS (HUNDREDS) | 2.2 2.1 | - 0.1 | 5 | 2.2 2.2 | + 0 | 0 | 3. FISHG-ASSOCIATED COMMERCIAL ENTERPRISES (100'S) | 5 4 | - 1 | 20 | 5 5 | + 0 | 0 | 4. PUBLIC CONSUMERS OR USERS OF FISHERY PRDTS (000'S) | 6 5 | - 1 | 17 | 6 6 | + 0 | 0 | 5. LICENSED FRESHWATER SPORT FISHERMEN (THOUSANDS) | 5 5 | + 0 | 0 | 5 5 | + 0 | 0 | 6. MARINE SPORT FISHERMEN (THOUSANDS) | 156 170 | + 14 | 9 | 156 170 | + 14 | 9 | 7. NON-CONSUMPTIVE RECREATIONAL USERS (THOUSANDS) | 148 100 | - 48 | 32 | 148 125 | - 23 | 16 | 8. RELATED COUNTY, STATE & FED RESOURCE MNGT AGENCIES | 12 12 | + 0 | 0 | 12 12 | + 0 | 0 |
PART IV: PROGRAM ACTIVITY | | | | | | | 1. COMMERCIAL FISHING LICENSES & PERMITS ISSUED (000) | 4 3.5 | - 0.5 | 13 | 4 3.8 | - 0.2 | 5 | 2. FISH DATA COLL - CATCH REPTS PROCESSED (000'S) | 645 635 | - 10 | 2 | 645 640 | - 5 | 1 | 3. MAIN HAWN ISLANDS BOTTOMFISH VESSEL I.D. REG(00'S) | 1110 1029 | - 81 | 7 | 1100 1070 | - 30 | 3 | 4. AQUARIUM PERMITS (HUNDREDS) | .7 0 | - 0.7 | 100 | 1 0 | - 1 | 100 | 5. FISH DATA COLL - INTERNAL & EXTERN. DATA REQUESTS | 200 200 | + 0 | 0 | 200 200 | + 0 | 0 | 6. NO. OF MTGS & CONTACTS WITH OTHER MNGT AGENCIES | 13 14 | + 1 | 8 | 13 15 | + 2 | 15 | 7. FISHERY MANAGEMENT AREAS MANAGED | 29 29 | + 0 | 0 | 30 29 | - 1 | 3 | 8. # OF RULES MADE FOR AQUATIC SPECIES CONSERVATION | 55 55 | + 0 | 0 | 56 60 | + 4 | 7 | 9. SURVEYS FOR FISHERMEN (THOUSANDS) | 5.5 4.5 | - 1 | 18 | 6 4.5 | - 1.5 | 25 | 10. SURVEYS OF FISHING AREAS | 37 37 | + 0 | 0 | 37 37 | + 0 | 0 |
- 129 -

01 04 0201 04 0201 04 0201 04 02PROGRAM TITLE: PROGRAM TITLE: PROGRAM TITLE: PROGRAM TITLE: FISHERIES MANAGEMENTFISHERIES MANAGEMENTFISHERIES MANAGEMENTFISHERIES MANAGEMENT LNR 153LNR 153LNR 153LNR 153
VARIANCE REPORT NARRATIVE FY 2020 AND FY 2021
01 04 02 PROGRAM TITLE: FISHERIES MANAGEMENT LNR 153
PART I - EXPENDITURES AND POSITIONS
FY 20:�All vacancies were frozen due to the economic impacts of the pandemic including an Aquatic Biologist V and Statistics Clerk. In addition, actual expenditures reflect a significant (585K) scale down on spending for all funding sources due to COVID-19.� � FY 21:�The program's two vacancies may not be filled this year due to lack of funding and expenditures were curtailed in the 1st quarter, as cost saving measures have been implemented because of the existing poor economic conditions the State is experiencing.
PART II - MEASURES OF EFFECTIVENESS
Item 1:�The number of commercial marine fishing licenses issued decreased as fishermen are unable to sell their catch with the tourist industry feeling the impact of the pandemic over most of the year.� � Item 3: Online purchases of commercial marine fishing licenses rose dramatically after the virus prevented over-the-counter sales in the 4th quarter last year and this has continued into FY 21.� � Item 7: New rules on important marine species were delayed last year. However, these rules are expected to be completed this year. The rules include amending the regulation on crustaceans, limiting the number and size of certain herbivore species and increasing the legal size of juvenile goatfish from 5 to 8 inches on Maui.
PART III - PROGRAM TARGET GROUPS
Item 1: COVID-19 caused a decrease in the number of licensed fishermen last year, but we are expecting a rise in these numbers this year, although not to the level before the pandemic.� � Item 3:�The virus caused the number of commercial fishing enterprises to decrease last year, but we expect these numbers to get back to near where they were with the return of tourist this year.� �
Item 4:�Similarly to Item #3, the pandemic reduced the number of consumer or users of fishery products during the 4th quarter of FY 20, but we believe this will return to close to normal levels when tourist come back in substantial number this year.� � Item 6:�A significant increase in saltwater fishing activity mainly for subsistence occurred due to the pandemic's economic impacts on the State.� � Item 7: It is estimated that sport fishing activities decreased dramatically with the almost complete shutdown of tourism.
PART IV - PROGRAM ACTIVITIES
Item 1:�The number of commercial fishing licenses and permits decreased last year as fishermen found it difficult to sell their catch with the tourist industry essentially closed.� � Item 4: The suspension of commercial aquarium fishing reflects the zeros posted for actual and estimated aquarium permits issued.� � Item 6: The number of meetings and contacts with management agencies increased slightly last fiscal year and is expected to increase further this year due to the ease and convenience of online meeting platforms.� � Item 9: The number of fishermen surveys decreased marginally because of less survey hours last year and similar results are expected this year.
- 130 -

|||
|
||||
STATE OF HAWAII VARIANCE REPORT REPORT V61 PROGRAM TITLE: AQUACULTURE DEVELOPMENT PROGRAM 12/5/20 PROGRAM-ID: AGR-153 PROGRAM STRUCTURE NO: 010403
FISCAL YEAR 2019-20 THREE MONTHS ENDED 09-30-20 NINE MONTHS ENDING 06-30-21
PART I: EXPENDITURES & POSITIONS BUDGETED ACTUAL + CHANGE_ % BUDGETED ACTUAL + CHANGE_ % BUDGETED ESTIMATED + CHANGE_ %
RESEARCH & DEVELOPMENT COSTS POSITIONS EXPENDITURES ($1,000's)
OPERATING COSTS POSITIONS 4.00 3.00 - 1.00 25 4.00 3.00 - 1.00 25 4.00 3.00 - 1.00 25 EXPENDITURES ($1000's) 762 335 - 427 56 104 104 + 0 0 300 300 + 0 0
TOTAL COSTS POSITIONS 4.00 3.00 - 1.00 25 4.00 3.00 - 1.00 25 4.00 3.00 - 1.00 25 EXPENDITURES ($1000's) 762 335 - 427 56 104 104 + 0 0 300 300 + 0 0
PART II: MEASURES OF EFFECTIVENESS 1. AQUACULTURE PRODUCTION (THOUSANDS OF POUNDS) 2. PRIMARY VALUE OF AQUACULTURE PRODUCTION ($000) 3. TOTAL AQUACULTURE EMPLOYMENT
| FISCAL YEAR 2019-20 | PLANNED ACTUAL | + CHANGE_ | | | | | 773 750 | - 23 | | 87980 83232 | - 4748 | | 500 369 | - 131 |
| FISCAL YEAR 2020-21 % | PLANNED ESTIMATED | + CHANGE_
| | 3 | 792 450 | - 342 5 | 92380 88000 | - 4380
26 | 500 220 | - 280
| | | | |
%
43 5
56
| | | | | |
PART III: PROGRAM TARGET GROUP 1. AQUACULTURE OPERATIONS STATEWIDE
| | 100 95
| | -
| 5 | 5
| | 100 55
| | - 45
| | 45
| |
PART IV: PROGRAM ACTIVITY 1. INFORMATION SENT (NUMBER) 2. PERMIT ASSISTANCE (NUMBER) 3. DISEASE ASSISTANCE (NUMBER OF CASES) 4. PROMOTIONAL EVENTS AND PRESENTATIONS (NUMBER)
| ||||
175 200 250
4
175 200 250
4
| | + | + | + | +
| 0 | 0 | 0 | 0 |
0 0 0 0
| ||||
175 200 250
4
175 150 250
4
| | + | -| + | +
0 50 0 0
| | | | |
0 25 0 0
| | | | |
- 131 -

01 04 0301 04 0301 04 0301 04 03PROGRAM TITLE: PROGRAM TITLE: PROGRAM TITLE: PROGRAM TITLE: AQUACULTURE DEVELOPMENT PROGRAMAQUACULTURE DEVELOPMENT PROGRAMAQUACULTURE DEVELOPMENT PROGRAMAQUACULTURE DEVELOPMENT PROGRAM AGR 153AGR 153AGR 153AGR 153
VARIANCE REPORT NARRATIVE FY 2020 AND FY 2021
01 04 03 PROGRAM TITLE: AQUACULTURE DEVELOPMENT PROGRAM AGR 153
PART I - EXPENDITURES AND POSITIONS
Variances were due to vacant positions and lower than anticipated expenditures from the Aquaculture Development Special Fund.
PART II - MEASURES OF EFFECTIVENESS
Items 1, 2, and 3: A significant decrease in production, value, and employment is expected in FY 21 due to the impact of COVID-19 that continues the trend that started in FY 20.
PART III - PROGRAM TARGET GROUPS
Item 1: A significant decrease in the number of aquaculture operations is expected in FY 21 due to the impact of COVID-19.
PART IV - PROGRAM ACTIVITIES
Item 2. A significant decrease in the number of permit inquiries is expected in FY 21 due to the impact of COVID-19.� �
- 132 -

||||
STATE OF HAWAII VARIANCE REPORT REPORT V61 PROGRAM TITLE: TECHNOLOGY 12/5/20 PROGRAM-ID: PROGRAM STRUCTURE NO: 0105
FISCAL YEAR 2019-20 THREE MONTHS ENDED 09-30-20 NINE MONTHS ENDING 06-30-21
PART I: EXPENDITURES & POSITIONS BUDGETED ACTUAL + CHANGE_ % BUDGETED ACTUAL + CHANGE_ % BUDGETED ESTIMATED + CHANGE_ %
RESEARCH & DEVELOPMENT COSTS POSITIONS EXPENDITURES ($1,000's)
OPERATING COSTS POSITIONS 9.00 5.00 - 4.00 44 8.00 5.00 - 3.00 38 8.00 5.00 - 3.00 38 EXPENDITURES ($1000's) 105,528 75,258 - 30,270 29 23,303 22,075 - 1,228 5 79,173 67,980 - 11,193 14
TOTAL COSTS POSITIONS 9.00 5.00 - 4.00 44 8.00 5.00 - 3.00 38 8.00 5.00 - 3.00 38 EXPENDITURES ($1000's) 105,528 75,258 - 30,270 29 23,303 22,075 - 1,228 5 79,173 67,980 - 11,193 14
| FISCAL YEAR 2019-20 | FISCAL YEAR 2020-21 | | PLANNED ACTUAL | + CHANGE_ | % | PLANNED ESTIMATED | + CHANGE_ | % |
PART II: MEASURES OF EFFECTIVENESS | | | | | | | 1. INCREASE IN NUMBER OF COMPANIES FUNDED | 10 NO DATA | - 10 | 100 | 10 NO DATA | - 10 | 100 | 2. # OF COMPANIES ASSTD AT HTDC INCUBATION CENTERS | 300 24 | - 276 | 92 | 300 25 | - 275 | 92 | 3. TOTAL TENANT REVENUE ($M) | 71 55 | - 16 | 23 | 71 60 | - 11 | 15 | 4. NELHA REVENUES (INCL REIMBURSABLES) ($M) | 6.8 5.6 | - 1.2 | 18 | 7.0 5.8 | - 1.2 | 17 |
- 133 -

PROGRAM TITLE: PROGRAM TITLE: TECHNOLOGYTECHNOLOGY 01 0501 05
VARIANCE REPORT NARRATIVE FY 2020 AND FY 2021
PROGRAM TITLE: TECHNOLOGY 01 05
PART I - EXPENDITURES AND POSITIONS
Details of the position and expenditure variances are best examined at the lowest program level.
PART II - MEASURES OF EFFECTIVENESS
See Lowest Level Programs for additional information.
- 134 -

||||
||||
||||
STATE OF HAWAII VARIANCE REPORT REPORT V61 PROGRAM TITLE: HAWAII STATE ENERGY OFFICE 12/5/20 PROGRAM-ID: BED-120 PROGRAM STRUCTURE NO: 010501
FISCAL YEAR 2019-20 THREE MONTHS ENDED 09-30-20 NINE MONTHS ENDING 06-30-21
PART I: EXPENDITURES & POSITIONS BUDGETED ACTUAL + CHANGE_ % BUDGETED ACTUAL + CHANGE_ % BUDGETED ESTIMATED + CHANGE_ %
RESEARCH & DEVELOPMENT COSTS POSITIONS EXPENDITURES ($1,000's)
OPERATING COSTS POSITIONS 5.00 4.00 - 1.00 20 5.00 4.00 - 1.00 20 5.00 4.00 - 1.00 20 EXPENDITURES ($1000's) 3,211 3,945 + 734 23 551 594 + 43 8 2,369 2,369 + 0 0
TOTAL COSTS POSITIONS 5.00 4.00 - 1.00 20 5.00 4.00 - 1.00 20 5.00 4.00 - 1.00 20 EXPENDITURES ($1000's) 3,211 3,945 + 734 23 551 594 + 43 8 2,369 2,369 + 0 0
| FISCAL YEAR 2019-20 | FISCAL YEAR 2020-21 | | PLANNED ACTUAL | + CHANGE_ | % | PLANNED ESTIMATED | + CHANGE_ | % |
PART II: MEASURES OF EFFECTIVENESS | | | | | | | 1. % OF SOLAR WATER HEATER VARIANCES PROCESSED TIMELY | 100 100 | + 0 | 0 | 100 100 | + 0 | 0 | 2. # OF BUSINESSES PARTICIPATING IN GREEN BUS. PROG. | 15 16 | + 1 | 7 | 15 15 | + 0 | 0 | 3. # OF ENERGY STAKEHOLDERS REACHED | 167360 159445 | - 7915 | 5 | 172380 166088 | - 6292 | 4 | 4. % OF SESF 12 ACTIVATIONS THAT ARE STAFFED | 100 100 | + 0 | 0 | 100 100 | + 0 | 0 |
PART III: PROGRAM TARGET GROUP | | | | | | | 1. # OF EMERGING AND EXISTING RE PROJECT ENTITIES | 120 133 | + 13 | 11 | 125 133 | + 8 | 6 | 2. # OF POTENTIAL GBP PARTICIPANTS CONTACTED | 60 77 | + 17 | 28 | 60 60 | + 0 | 0 | 3. # OF BUILDING CODE ORGANIZATIONS | 6 14 | + 8 | 133 | 6 10 | + 4 | 67 | 4. # OF ENERGY STAKEHOLDERS AND POLICY MAKERS | 2046 1935 | - 111 | 5 | 2128 2015 | - 113 | 5 |
PART IV: PROGRAM ACTIVITY | | | | | | | 1. # OF TECH. ASSIST. TO PUBLIC & PRIVATE ENTITIES | 1500 1817 | + 317 | 21 | 1500 1300 | - 200 | 13 | 2. # OF ANALYSES & PROJECTS SUPPORTING CLEAN ENERGY | 18 31 | + 13 | 72 | 18 24 | + 6 | 33 | 3. # OF STAFF HOURS SUPPORTING THE EOC FOR SESF 12 | 1328 1483.5 | + 155.5 | 12 | 1328 800 | - 528 | 40 | 4. # OF LEGISLATIVE MEASURES TRACKED AND ADDRESSED | 115 248 | + 133 | 116 | 115 115 | + 0 | 0 |
- 135 -

01 05 0101 05 0101 05 0101 05 01PROGRAM TITLE: PROGRAM TITLE: PROGRAM TITLE: PROGRAM TITLE: HAWAII STATE ENERGY OFFICEHAWAII STATE ENERGY OFFICEHAWAII STATE ENERGY OFFICEHAWAII STATE ENERGY OFFICE BED 120BED 120BED 120BED 120
VARIANCE REPORT NARRATIVE FY 2020 AND FY 2021
01 05 01 PROGRAM TITLE: HAWAII STATE ENERGY OFFICE BED 120
PART I - EXPENDITURES AND POSITIONS
Positions: One vacant position was filled by Temporary Assignment. A general freeze on filling positions was in effect as of the last quarter of FY 20.� � Expenditures: FY 20 expenditures exceeded the budgeted amount because the actual expenditures include amounts for prior years' encumbrances and expenditures from non-appropriated federal funds.
PART II - MEASURES OF EFFECTIVENESS
No significant variances.
PART III - PROGRAM TARGET GROUPS
Item 1. The number of emerging and existing renewable energy (RE) project entities was slightly higher because there were more RE projects during FY 20 than anticipated.� � Item 2. With the assistance from a student intern, the Hawaii State Energy Office (HSEO) contacted more potential Green Business Program participants than planned. � � Item 3. The number of building code organizations was greater than planned as more organizations were targeted due to the training and updates related to the 2015 International Energy Conservation Code.
PART IV - PROGRAM ACTIVITIES
Item 1. Technical assistance provided to public and private entities was higher than planned due to additional demands related to the COVID-19 pandemic.� � Item 2. The number of analyses and projects supporting clean energy was much greater than planned due to additional demands related to the COVID-19 pandemic.� �
Item 3. Staff hours supporting the Emergency Operation Center for State Emergency Support Function 12 - Energy were higher because of COVID-19 response.� � Item 4. HSEO tracked and addressed more legislative measures than expected because the volume of legislation referred to the office was greater. �
- 136 -

||
||
|
12/5/20 STATE OF HAWAII VARIANCE REPORT REPORT V61 PROGRAM TITLE: HAWAII TECHNOLOGY DEVELOPMENT CORPORATION PROGRAM-ID: BED-143 PROGRAM STRUCTURE NO: 010502
FISCAL YEAR 2019-20 THREE MONTHS ENDED 09-30-20 NINE MONTHS ENDING 06-30-21
PART I: EXPENDITURES & POSITIONS BUDGETED ACTUAL + CHANGE_ % BUDGETED ACTUAL + CHANGE_ % BUDGETED ESTIMATED + CHANGE_ %
RESEARCH & DEVELOPMENT COSTS POSITIONS EXPENDITURES ($1,000's)
OPERATING COSTS POSITIONS 4.00 1.00 - 3.00 75 3.00 1.00 - 2.00 67 3.00 1.00 - 2.00 67 EXPENDITURES ($1000's) 8,477 18,121 + 9,644 114 1,116 160 - 956 86 4,592 1,000 - 3,592 78
TOTAL COSTS POSITIONS 4.00 1.00 - 3.00 75 3.00 1.00 - 2.00 67 3.00 1.00 - 2.00 67 EXPENDITURES ($1000's) 8,477 18,121 + 9,644 114 1,116 160 - 956 86 4,592 1,000 - 3,592 78
PART II: MEASURES OF EFFECTIVENESS 1. # OF COMPANIES ASSTD AT HTDC INCUBATION CENTERS 2. MKTG: # OF INDIVIDUALS OR COMPANIES ASSISTED
| FISCAL YEAR 2019-20 | PLANNED ACTUAL | + CHANGE_ | | | | | 300 24 | - 276 | | 36300 36002 | - 298 |
| FISCAL YEAR 2020-21 % | PLANNED ESTIMATED | + CHANGE_
| | 92 | 300 25 | - 275 1 | 36300 36000 | - 300
| | | |
%
92 1
| | | | |
PART III: PROGRAM TARGET GROUP 1. # OF POTENTIAL TECH-BASED COMPANIES 2. # OF COMPANIES APPLYING FOR INCUBATION SERVICES
| ||
1400 NO DATA 25 3
| | -| -
| 1400 |
22 |
| 100 |88 |
1400 25
NO DATA 3
| | -| -
1400 22
| | |
100 88
| | |
PART IV: PROGRAM ACTIVITY 1. # OF CONTACTS AND RESPONSES
| | 58000 65116
| | +
| 7116 | 12
| | 58000 58000
| | + 0
| | 0
| |
- 137 -

01 05 0201 05 0201 05 0201 05 02PROGRAM TITLE: PROGRAM TITLE: PROGRAM TITLE: PROGRAM TITLE: HAWAII TECHNOLOGY DEVELOPMENT CORPORATIONHAWAII TECHNOLOGY DEVELOPMENT CORPORATIONHAWAII TECHNOLOGY DEVELOPMENT CORPORATIONHAWAII TECHNOLOGY DEVELOPMENT CORPORATION BED 143BED 143BED 143BED 143
VARIANCE REPORT NARRATIVE FY 2020 AND FY 2021
01 05 02 PROGRAM TITLE: HAWAII TECHNOLOGY DEVELOPMENT CORPORATION BED 143
PART I - EXPENDITURES AND POSITIONS PART III - PROGRAM TARGET GROUPS
FY 21, Quarter 1 positions variance is due to the vacancies of a permanent Director and Secretary position, respectively. � � FY 20 actual expenditures are greater than the budgeted amount because it includes expenditures/encumbrances from non-FY 20 accounts such as prior-year accounts and non-appropriated federal fund accounts that occurred in FY 20.� � FY 20 expenditures from FY 20 budgeted operating accounts were lower than budgeted primarily due to: 1) the budgeted appropriation for Hawaii Technology Development Corporation's (HTDC) special funds, including excess capacity for flexibility should an opportunity arise, actual operating income and expenses are much lower; 2) the budgeted appropriation in the current year for federal-funded grants being placeholders for payroll expenses, actual payroll expenses are charged to the initial year of the grant; 3) not expending funds for the Hawaii technology loan program; and 4) no activity for newly assigned Hawaii Strategic Development Corporation powers, as we will implement as we learn more about current investments.� � FY 21 expenditures are also expected to be lower than budgeted for the same reasons stated above.
PART II - MEASURES OF EFFECTIVENESS
Item 1. HTDC lost control of the Manoa Innovation Center (MIC) in July 2018. Our facilities in Maui continue to be under-utilized, and vacancy remains high throughout the Kihei area. � � Item 2. Our marketing efforts are also robust, and we are reaching more individuals. However, Maui remains slower in activity than on Oahu. � � � �
Item 1. The target group of companies that potentially would utilize the Manufacturing Extension Partnership Program and its Hawaii Small Business Innovation Research (HSBIR) Grant Program was lowered after a decrease in the appropriation funding of the HSBIR grant.� � Item 2. The number of companies applying for tenancy or to become a virtual tenant at tech centers was lower than anticipated in FY 20. With the loss of MIC, we expect a further drop off of activity.
PART IV - PROGRAM ACTIVITIES
Item 1. While hits to various HTDC websites have shown that activity is higher than planned, HTDC's revamped techjobs.org has been partially operational and was used during some of HTDC's events. This has resulted in higher interactions and contacts with the public.
- 138 -

|||
|||
|||
12/5/20 STATE OF HAWAII VARIANCE REPORT REPORT V61 PROGRAM TITLE: HAWAII STRATEGIC DEVELOPMENT CORPORATION PROGRAM-ID: BED-145 PROGRAM STRUCTURE NO: 010503
FISCAL YEAR 2019-20 THREE MONTHS ENDED 09-30-20 NINE MONTHS ENDING 06-30-21
PART I: EXPENDITURES & POSITIONS BUDGETED ACTUAL + CHANGE_ % BUDGETED ACTUAL + CHANGE_ % BUDGETED ESTIMATED + CHANGE_ %
RESEARCH & DEVELOPMENT COSTS POSITIONS EXPENDITURES ($1,000's)
OPERATING COSTS POSITIONS 0.00 0.00 + 0.00 0 0.00 0.00 + 0.00 0 0.00 0.00 + 0.00 0 EXPENDITURES ($1000's) 2 211 + 209 10,450 0 0 + 0 0 2 0 - 2 100
TOTAL COSTS POSITIONS 0.00 0.00 + 0.00 0 0.00 0.00 + 0.00 0 0.00 0.00 + 0.00 0 EXPENDITURES ($1000's) 2 211 + 209 10,450 0 0 + 0 0 2 0 - 2 100
PART II: MEASURES OF EFFECTIVENESS 1. INCR IN LEVERAGING PUBLIC INV W/PRIVATE CAPITAL 2. INCR IN NUMBER OF VENTURE CAP PARTNERSHIPS ESTAB 3. INCREASE IN NUMBER OF COMPANIES FUNDED
| FISCAL YEAR 2019-20 | PLANNED ACTUAL | + CHANGE_ | | | | | 5000000 NO DATA | - 5000000 | | 1 NO DATA | - 1 | | 10 NO DATA | - 10 |
| FISCAL YEAR 2020-21 % | PLANNED ESTIMATED | + CHANGE_
| | 100 | 0 NO DATA | + 0 100 | 1 NO DATA | - 1 100 | 10 NO DATA | - 10
| | | | |
%
0 100 100
| | | | | |
PART III: PROGRAM TARGET GROUP 1. ENTREPRENEURIAL START-UP COMPANIES 2. POTENTIAL INVEST ORG,INCL HIGH NET WORTH INDIVIDS 3. SUPPORT ORGS INCLUDING LEGAL & ACCT FIRMS
| |||
40 NO DATA 20 NO DATA 5 NO DATA
| | -| -| -
| 40 | 20 | 5 |
| 100 |100 |100 |
30 20 5
NO DATA NO DATA NO DATA
| | -| -| -
30 20 5
| | | |
100 100 100
| | | |
PART IV: PROGRAM ACTIVITY 1. REINVEST INVEST DISTRIB IN NEW VENTURE PARTNERSHIP 2. ORGANIZE AND SPONSOR VENTURE CAPITAL CONF 3. ENTREPRENEURIAL TRAINING PROGRAMS
| |||
0 NO DATA 2 NO DATA 0 NO DATA
| | + | -| +
| 0 | 2 | 0 |
| 0 |
100 |0 |
0 3 0
NO DATA NO DATA NO DATA
| | + | -| +
0 3 0
| | | |
0 100
0
| | | |
- 139 -

01 05 0301 05 0301 05 0301 05 03PROGRAM TITLE: PROGRAM TITLE: PROGRAM TITLE: PROGRAM TITLE: HAWAII STRATEGIC DEVELOPMENT CORPORATIONHAWAII STRATEGIC DEVELOPMENT CORPORATIONHAWAII STRATEGIC DEVELOPMENT CORPORATIONHAWAII STRATEGIC DEVELOPMENT CORPORATION BED 145BED 145BED 145BED 145
VARIANCE REPORT NARRATIVE FY 2020 AND FY 2021
01 05 03 PROGRAM TITLE: HAWAII STRATEGIC DEVELOPMENT CORPORATION BED 145
PART I - EXPENDITURES AND POSITIONS
BED 145, Hawaii Strategic Development Corporation (HSDC), was absorbed by BED 143, Hawaii Technology Development Corporation (HTDC), pursuant to Act 5, SLH 2019.� � FY 20 actual expenditures was greater than budgeted due to the actual amount, including expenditures/encumbrances incurred in FY 20 from non-FY 20 appropriation accounts.
PART II - MEASURES OF EFFECTIVENESS
BED 145, HSDC, was absorbed by BED 143, HTDC, pursuant to Act 5, SLH 2019.
PART III - PROGRAM TARGET GROUPS
BED 145, HSDC, was absorbed by BED 143, HTDC, pursuant to Act 5, SLH 2019.
PART IV - PROGRAM ACTIVITIES
BED 145, HSDC, was absorbed by BED 143, HTDC, pursuant to Act 5, SLH 2019.
- 140 -

|||||
||||
|||||||
STATE OF HAWAII VARIANCE REPORT REPORT V61 PROGRAM TITLE: NATURAL ENERGY LAB OF HAWAII AUTHORITY 12/5/20 PROGRAM-ID: BED-146 PROGRAM STRUCTURE NO: 010504
FISCAL YEAR 2019-20 THREE MONTHS ENDED 09-30-20 NINE MONTHS ENDING 06-30-21
PART I: EXPENDITURES & POSITIONS BUDGETED ACTUAL + CHANGE_ % BUDGETED ACTUAL + CHANGE_ % BUDGETED ESTIMATED + CHANGE_ %
RESEARCH & DEVELOPMENT COSTS POSITIONS EXPENDITURES ($1,000's)
OPERATING COSTS POSITIONS 0.00 0.00 + 0.00 0 0.00 0.00 + 0.00 0 0.00 0.00 + 0.00 0 EXPENDITURES ($1000's) 7,901 7,205 - 696 9 1,780 1,465 - 315 18 6,129 5,044 - 1,085 18
TOTAL COSTS POSITIONS 0.00 0.00 + 0.00 0 0.00 0.00 + 0.00 0 0.00 0.00 + 0.00 0 EXPENDITURES ($1000's) 7,901 7,205 - 696 9 1,780 1,465 - 315 18 6,129 5,044 - 1,085 18
| FISCAL YEAR 2019-20 | FISCAL YEAR 2020-21 | | PLANNED ACTUAL | + CHANGE_ | % | PLANNED ESTIMATED | + CHANGE_ | % |
PART II: MEASURES OF EFFECTIVENESS | | | | | | | 1. NELHA REVENUES (INCL REIMBURSABLES) ($M) | 6.8 5.6 | - 1.2 | 18 | 7 5.8 | - 1.2 | 17 | 2. ENERGY PRODUCED FROM RENEWABLE RESOURCES (MWH/YR) | 4500 4500 | + 0 | 0 | 4500 4500 | + 0 | 0 | 3. TOTAL TENANT REVENUE ($M) | 71 55 | - 16 | 23 | 71 60 | - 11 | 15 | 4. ANNUAL TENANT CAPITAL IMPROVEMENT ($M) | 10 2 | - 8 | 80 | 10 10 | + 0 | 0 | 5. SEAWATER SYSTEM DELIVERY RELIABILITY (%) | 99.999 99.999 | + 0 | 0 | 99.999 99.999 | + 0 | 0 |
PART III: PROGRAM TARGET GROUP | | | | | | | 1. COMMERCIAL TENANTS | 30 30 | + 0 | 0 | 30 31 | + 1 | 3 | 2. PRE-COMMERCIAL TENANTS | 13 11 | - 2 | 15 | 13 12 | - 1 | 8 | 3. RESEARCH/EDUCATION/OTHER TENANTS | 15 12 | - 3 | 20 | 15 13 | - 2 | 13 | 4. PUBLIC OUTREACH PARTICIPANTS | 6000 6000 | + 0 | 0 | 6000 6000 | + 0 | 0 |
PART IV: PROGRAM ACTIVITY | | | | | | | 1. TOTAL EMPLOYMENT AT NELHA (PUBLIC & PRIVATE) | 480 485 | + 5 | 1 | 480 485 | + 5 | 1 | 2. TOTAL VOLUME OF SEAWATER PUMPED (MGALS) | 150 8933 | + 8783 | 5855 | 150 8500 | + 8350 | 5567 | 3. TOTAL NUMBER OF NELHA TENANTS | 56 53 | - 3 | 5 | 56 56 | + 0 | 0 | 4. PERCENTAGE OF NELHA LAND IN USE | 47 45 | - 2 | 4 | 47 47 | + 0 | 0 | 5. TOTAL CUMULATIVE CIP; TENANT, STATE, FEDERAL ($M) | 150 160 | + 10 | 7 | 150 160 | + 10 | 7 | 6. BEACH PARK USE (# OF ATTENDEES) | 139000 139000 | + 0 | 0 | 139000 139000 | + 0 | 0 | 7. CEMP (# OF REGULATORY AGENCIES) | 7 7 | + 0 | 0 | 7 7 | + 0 | 0 |
- 141 -

01 05 0401 05 0401 05 0401 05 04PROGRAM TITLE: PROGRAM TITLE: PROGRAM TITLE: PROGRAM TITLE: NATURAL ENERGY LAB OF HAWAII AUTHORITYNATURAL ENERGY LAB OF HAWAII AUTHORITYNATURAL ENERGY LAB OF HAWAII AUTHORITYNATURAL ENERGY LAB OF HAWAII AUTHORITY BED 146BED 146BED 146BED 146
VARIANCE REPORT NARRATIVE FY 2020 AND FY 2021
01 05 04 PROGRAM TITLE: NATURAL ENERGY LAB OF HAWAII AUTHORITY BED 146
PART I - EXPENDITURES AND POSITIONS
Lower planned revenues due to a delay in the sale of a building. In addition, positions and expenditures are lower than planned to maintain special fund balance.
PART II - MEASURES OF EFFECTIVENESS
Item 1. The variance in FY 20 expenditures is due to actual revenue collected being lower than anticipated due to a delay in the sale of a building.� � Item 3. The Natural Energy Laboratory of Hawaii Authority (NELHA) no longer collects total tenant revenue. A better indication of economic impact is total tenant expenditures, which are being reported. The title of this measure of effectiveness needs to be changed.� � Item 4. Tenants in HOST Park are not expanding as quickly as anticipated and some projects have been delayed by the slower than anticipated permitting process.
PART III - PROGRAM TARGET GROUPS
Item 2. Lower pre-commercial tenant count is due to lower duration of stays and the failure of some start-up companies to also lower these numbers.� � Item 3. Downturn in visitors in association with the Great Pandemic of 2020.
PART IV - PROGRAM ACTIVITIES
Item 2. The total volume of seawater pumped has been updated to reflect correct amounts. FY 20 actual was 8,933 mgals; therefore, budgeted amount of 150 mgals for FY 20 and FY 21 was incorrectly entered, causing large variances. Decrease of FY 20 8,933 mgals to 8,500 mgals for FY 21 is due to lower tenant demand in conjunction with their efforts to increase efficiency and conservation.
- 142 -

|||||||
||
|
STATE OF HAWAII VARIANCE REPORT REPORT V61 PROGRAM TITLE: HAWAII GREEN INFRASTRUCTURE AUTHORITY 12/5/20 PROGRAM-ID: BED-138 PROGRAM STRUCTURE NO: 010505
FISCAL YEAR 2019-20 THREE MONTHS ENDED 09-30-20 NINE MONTHS ENDING 06-30-21
PART I: EXPENDITURES & POSITIONS BUDGETED ACTUAL + CHANGE_ % BUDGETED ACTUAL + CHANGE_ % BUDGETED ESTIMATED + CHANGE_ %
RESEARCH & DEVELOPMENT COSTS POSITIONS EXPENDITURES ($1,000's)
OPERATING COSTS POSITIONS 0.00 0.00 + 0.00 0 0.00 0.00 + 0.00 0 0.00 0.00 + 0.00 0 EXPENDITURES ($1000's) 85,937 45,776 - 40,161 47 19,856 19,856 + 0 0 66,081 59,567 - 6,514 10
TOTAL COSTS POSITIONS 0.00 0.00 + 0.00 0 0.00 0.00 + 0.00 0 0.00 0.00 + 0.00 0 EXPENDITURES ($1000's) 85,937 45,776 - 40,161 47 19,856 19,856 + 0 0 66,081 59,567 - 6,514 10
PART II: MEASURES OF EFFECTIVENESS 1. % FINANCING FOR UNDERSERVED TARGET 2. ESTIMATED KWH PRODUCTION OVER LIFETIME (000) 3. EST KWH REDUCTION OVER LIFETIME (000) 4. EST BARRELS OF PETROLUEM DISPLACED (000) 5. EST METRIC TONS OF GREENHOUSE GAS AVOIDED (000) 6. TOTAL GEMS LOANS DEPLOYED (000) 7. ESTIMATED NET COST SAVINGS
| FISCAL YEAR 2019-20 | PLANNED ACTUAL | + CHANGE_ | | | | | NO DATA 73 | + 73 | | NO DATA 48416 | + 48416 | | NO DATA 4845 | + 4845 | | 129 33 | - 96 | | 63 16 | - 47 | | NO DATA 24468 | + 24468 | | NO DATA 1448649 | + 1448649 |
| FISCAL YEAR 2020-21 % | PLANNED ESTIMATED | + CHANGE_
| | 0 | NO DATA 85 | + 85 0 | NO DATA 40000 | + 40000 0 | NO DATA 100 | + 100
74 | 129 25 | - 104 75 | 63 11 | - 52 0 | NO DATA 20000 | + 20000 0 | NO DATA 10000 | + 10000
| | | | | | | | |
%
0 0 0
81 83 0 0
| | | | | | | | | |
PART III: PROGRAM TARGET GROUP 1. RESIDENTIAL RATE PAYERS (HOMEOWNERS/RENTERS) 2. COMMERCIAL RATEPAYERS
| | |
NO DATA NO DATA
96 9
| | + | +
| 96 | 9 |
0 0
| | |
NO DATA NO DATA
75 5
| | + | +
75 5
| | |
0 0
| | |
PART IV: PROGRAM ACTIVITY 1. ORIGINATE AND SERVICE CLEAR ENERGY LOANS
| | NO DATA
| 404 | +
| 404 | 0
| | NO DATA
| 300 | + 300
| | 0
| |
- 143 -

01 05 0501 05 0501 05 0501 05 05PROGRAM TITLE: PROGRAM TITLE: PROGRAM TITLE: PROGRAM TITLE: HAWAII GREEN INFRASTRUCTURE AUTHORITYHAWAII GREEN INFRASTRUCTURE AUTHORITYHAWAII GREEN INFRASTRUCTURE AUTHORITYHAWAII GREEN INFRASTRUCTURE AUTHORITY BED 138BED 138BED 138BED 138
VARIANCE REPORT NARRATIVE FY 2020 AND FY 2021
01 05 05 PROGRAM TITLE: HAWAII GREEN INFRASTRUCTURE AUTHORITY BED 138
PART I - EXPENDITURES AND POSITIONS
The Hawaii Green Infrastructure Authority's (HGIA) FY 2020 budget includes appropriations for operating overhead, program expenses, a loan ceiling for loans funded, a bond ceiling for Green Energy Market Securitization (GEMS) bond payments and expenses, and a bond ceiling "cushion" required by the bond indenture documents for 1.5 times the bond payments of $6.5 million. This $6.5 million is not intended or expected to be spent and, as such, is not included in the estimated amounts. Total loans funded during the year aggregated $26.5 million. Overhead and program expenses of $970,000 were offset by approximately $3.7 million in revenue earned during the fiscal year. � � The actual timing of a loan being funded is dependent on the various contractors achieving specified milestones in the project contracts for loans approved. Projects typically take between 6 to 18 months to complete, making it hard to predict the timing of loan funding. As of June 30, 2020, HGIA had $16.4 million in committed loans.
PART II - MEASURES OF EFFECTIVENESS
With only a limited amount in GEMS loan capital left to lend, HGIA established a permitted interaction group ("PIG") to investigate, discuss and make a recommendation for future loans. The recommendation of the PIG was to utilize the remaining funds to assist the under-served and hard to reach with clean energy financing, consisting of the following segments: (1) low- and moderate-income single family residential homeowners and renters; (2) small businesses (as defined by the U.S. Small Business Administration); (3) multi-family rental projects; and (4) nonprofits. Although limiting financing to these targeted, historically hard to reach segments will slow the deployment of loan funds, HGIA's board adopted these recommendations, effective September 1, 2019, in order to democratize clean energy, making financing available to those with limited options, to help lower their energy costs while helping our State achieve its aggressive clean energy goals. As such, the percentage financing for under-served target is expected to increase to 85% for FY 21. The remaining metrics are expected to remain the same as HGIA
maintains its operations. Note that the measures of effectiveness were set in 2018, prior to the establishment of many of the program metrics stated in the Measures of Effectiveness for the current program. HGIA intends to update its metrics targets at the next round of metrics updates in December 2020.
PART III - PROGRAM TARGET GROUPS
As indicated in Part II, HGIA expects its loan volume to decrease as it is typically harder to reach these under-served segments and the pace of adoption is slower. As a result, the number of homeowners, renters, nonprofits, small businesses and multi-family projects are expected to decrease. Additionally, the COVID-19 pandemic has resulted in a significant decrease in consumer confidence due to uncertainties regarding the State's economy and business viability, which has resulted in a decrease of commercial interest that likely will decrease the total amount of loans funded in FY 21.
PART IV - PROGRAM ACTIVITIES
Similarly, as mentioned above, although HGIA will double its efforts on grass-roots community outreach, we expect the program activity measured by the number of loans originated and serviced to decrease. Although the gross volume will decrease, the lower energy costs for these under-served families and organizations will be meaningful and impactful.
- 144 -

||||||
|
||||||||
STATE OF HAWAII VARIANCE REPORT REPORT V61 PROGRAM TITLE: WATER AND LAND DEVELOPMENT 12/5/20 PROGRAM-ID: LNR-141 PROGRAM STRUCTURE NO: 0106
FISCAL YEAR 2019-20 THREE MONTHS ENDED 09-30-20 NINE MONTHS ENDING 06-30-21
PART I: EXPENDITURES & POSITIONS BUDGETED ACTUAL + CHANGE_ % BUDGETED ACTUAL + CHANGE_ % BUDGETED ESTIMATED + CHANGE_ %
RESEARCH & DEVELOPMENT COSTS POSITIONS EXPENDITURES ($1,000's)
OPERATING COSTS POSITIONS 28.00 24.00 - 4.00 14 28.00 24.00 - 4.00 14 28.00 24.00 - 4.00 14 EXPENDITURES ($1000's) 3,776 3,271 - 505 13 1,384 586 - 798 58 2,177 2,975 + 798 37
TOTAL COSTS POSITIONS 28.00 24.00 - 4.00 14 28.00 24.00 - 4.00 14 28.00 24.00 - 4.00 14 EXPENDITURES ($1000's) 3,776 3,271 - 505 13 1,384 586 - 798 58 2,177 2,975 + 798 37
| FISCAL YEAR 2019-20 | FISCAL YEAR 2020-21 | | PLANNED ACTUAL | + CHANGE_ | % | PLANNED ESTIMATED | + CHANGE_ | % |
PART II: MEASURES OF EFFECTIVENESS | | | | | | | 1. SURFACE WATER SUPPLY DEVELOPED (MGD) | 0 0 | + 0 | 0 | 0 0 | + 0 | 0 | 2. GROUNDWATER SUPPLY DEVELOPED (MGD) | 1 0 | - 1 | 100 | 1 1 | + 0 | 0 | 3. WATER CREDITS PROVID TO STATE AGENCIES (1000 GALS) | 250 0 | - 250 | 100 | 250 250 | + 0 | 0 | 4. STATE LANDS DEVELOPED (ACRES) | 10 10 | + 0 | 0 | 10 10 | + 0 | 0 | 5. GEOTHERMAL ROYALTIES COLLECTED (DOLLARS) | 1200 0 | - 1200 | 100 | 1200 20 | - 1180 | 98 | 6. ROCKFALL PROJECTS IMPLEMENTED (# OF PROJECTS) | 4 4 | + 0 | 0 | 4 4 | + 0 | 0 |
PART III: PROGRAM TARGET GROUP | | | | | | | 1. DEFACTO POPULTN BENEFTNG FR IMPRVMNTS (NO. IN MIL) | 1.4 1.4 | + 0 | 0 | 1.4 1.4 | + 0 | 0 |
PART IV: PROGRAM ACTIVITY | | | | | | | 1. PLANNING AND PROGRAMMING (NUMBER OF PROJECTS) | 25 26 | + 1 | 4 | 25 24 | - 1 | 4 | 2. PROJECTS DESIGNED (NUMBER OF PROJECTS) | 30 32 | + 2 | 7 | 30 30 | + 0 | 0 | 3. ENGINEERING CONSULTANT CONTRACTS ADMINISTERED | 30 34 | + 4 | 13 | 30 30 | + 0 | 0 | 4. ENGIN SVCS PROVIDD TO OTHER DLNR OFFICES (MAN HRS) | 20000 18000 | - 2000 | 10 | 20000 18000 | - 2000 | 10 | 5. CIP EXPENDITURES ($1,000) | 40000 36860 | - 3140 | 8 | 40000 40000 | + 0 | 0 | 6. ALTERNATE WATER DEVLPM PROJECTS INVESTIGATED (NO.) | 0 0 | + 0 | 0 | 0 0 | + 0 | 0 | 7. GEOTHERMAL RESOURCE PERMITS ISSUED (# OF PERMITS) | 1 0 | - 1 | 100 | 1 1 | + 0 | 0 | 8. ROCKFALL/SLOPE MOVEMNT AREAS INVSTGTD &OR ADDRSSD | 5 5 | + 0 | 0 | 5 5 | + 0 | 0 |
- 145 -

01 0601 0601 0601 06PROGRAM TITLE: PROGRAM TITLE: PROGRAM TITLE: PROGRAM TITLE: WATER AND LAND DEVELOPMENTWATER AND LAND DEVELOPMENTWATER AND LAND DEVELOPMENTWATER AND LAND DEVELOPMENT LNR 141LNR 141LNR 141LNR 141
VARIANCE REPORT NARRATIVE FY 2020 AND FY 2021
01 06 PROGRAM TITLE: WATER AND LAND DEVELOPMENT LNR 141
PART I - EXPENDITURES AND POSITIONS PART IV - PROGRAM ACTIVITIES
FY 20 position variance due to budgeted unfilled positions under various stages of recruitment. The program has experienced difficulties in recruitment due to the prolonged historically low unemployment rate and lack of interested and qualified applicants. In order to fill its vacancies, the program is attempting to recruit positions at all levels.� � FY 20 and FY 21 differences in budgeted amount and actual expenditures are primarily payroll savings due to staff vacancy and corresponding funds for activities to be performed, and unused accrued vacation/sick leave fund for the Capital Improvement Program (CIP) project staff.� � FY 21 position variance due to authorized but unfunded positions (budget adjustments made by Act 9, SLH 2020) and proposed Program Review adjustments.
PART II - MEASURES OF EFFECTIVENESS
Items 1 and 2: Reflects authorized water projects and their completion; program has sought but not been authorized funding for such projects. One groundwater project has been authorized in FY 21.� � Item 3: The variance reflects a downturn in requests for water credits by State agencies.� � Item 5: The variance reflects the shutdown in May 2018 of the only geothermal producer due to eruption of the Kilauea East Rift Zone. The geothermal plant was originally anticipated to come back online in FY 20; however, it is now expected to come back online at partial capacity in FY 21. Note that adjustments to prior royalty estimates were inadvertently not reflected.
PART III - PROGRAM TARGET GROUPS
No significance variance.
Item 3: FY 20 actuals reflect greater number of projects authorized than initially projected due to increased CIP funding levels and the breakdown of Lump Sum appropriations into multiple projects/contracts. � � Item 4: The variance is due to temporary staff vacancies which were under recruitment in FY 20, which will continue to be held vacant due to Act 9, SLH 2020, funding reductions and proposed Program Review adjustments.� � Item 5: FY 20 reflects actual expenditures based on contractor invoicing and payment processing; an additional $60 million is encumbered in consultant and/or construction contracts for expenditure in FY 21 and beyond. � � Item 7: No geothermal resource permit applications were received in FY 20.
- 146 -

||
STATE OF HAWAII VARIANCE REPORT REPORT V61 PROGRAM TITLE: SPECIAL COMMUNITY DEVELOPMENT 12/5/20 PROGRAM-ID: PROGRAM STRUCTURE NO: 0107
FISCAL YEAR 2019-20 THREE MONTHS ENDED 09-30-20 NINE MONTHS ENDING 06-30-21
PART I: EXPENDITURES & POSITIONS BUDGETED ACTUAL + CHANGE_ % BUDGETED ACTUAL + CHANGE_ % BUDGETED ESTIMATED + CHANGE_ %
RESEARCH & DEVELOPMENT COSTS POSITIONS EXPENDITURES ($1,000's)
OPERATING COSTS POSITIONS 21.00 16.00 - 5.00 24 21.00 16.00 - 5.00 24 21.00 19.00 - 2.00 10 EXPENDITURES ($1000's) 3,541 9,475 + 5,934 168 632 487 - 145 23 2,541 2,686 + 145 6
TOTAL COSTS POSITIONS 21.00 16.00 - 5.00 24 21.00 16.00 - 5.00 24 21.00 19.00 - 2.00 10 EXPENDITURES ($1000's) 3,541 9,475 + 5,934 168 632 487 - 145 23 2,541 2,686 + 145 6
| FISCAL YEAR 2019-20 | FISCAL YEAR 2020-21 | | PLANNED ACTUAL | + CHANGE_ | % | PLANNED ESTIMATED | + CHANGE_ | % |
PART II: MEASURES OF EFFECTIVENESS | | | | | | | 1. NEW PRIV DEV IN KAKAAKO COM DEV DIST ($M) | 55.9 163 | + 107.1 | 192 | -163 0 | + 163 | -100 | 2. NEW PRIVATE DEVELOPMENT WITHIN KALAELOA ($M) | 20 10 | - 10 | 50 | 20 20 | + 0 | 0 |
- 147 -

PROGRAM TITLE: PROGRAM TITLE: SPECIAL COMMUNITY DEVELOPMENTSPECIAL COMMUNITY DEVELOPMENT 01 0701 07
VARIANCE REPORT NARRATIVE FY 2020 AND FY 2021
PROGRAM TITLE: SPECIAL COMMUNITY DEVELOPMENT 01 07
PART I - EXPENDITURES AND POSITIONS
Details of the position and expenditure variances are best examined at the lowest program level.
PART II - MEASURES OF EFFECTIVENESS
See Lowest Level Programs for additional information.
- 148 -

|||||||
|||||
|||||||
STATE OF HAWAII VARIANCE REPORT REPORT V61 PROGRAM TITLE: HAWAII COMMUNITY DEVELOPMENT AUTHORITY 12/5/20 PROGRAM-ID: BED-150 PROGRAM STRUCTURE NO: 010701
FISCAL YEAR 2019-20 THREE MONTHS ENDED 09-30-20 NINE MONTHS ENDING 06-30-21
PART I: EXPENDITURES & POSITIONS BUDGETED ACTUAL + CHANGE_ % BUDGETED ACTUAL + CHANGE_ % BUDGETED ESTIMATED + CHANGE_ %
RESEARCH & DEVELOPMENT COSTS POSITIONS EXPENDITURES ($1,000's)
OPERATING COSTS POSITIONS 21.00 16.00 - 5.00 24 21.00 16.00 - 5.00 24 21.00 19.00 - 2.00 10 EXPENDITURES ($1000's) 3,541 9,475 + 5,934 168 632 487 - 145 23 2,541 2,686 + 145 6
TOTAL COSTS POSITIONS 21.00 16.00 - 5.00 24 21.00 16.00 - 5.00 24 21.00 19.00 - 2.00 10 EXPENDITURES ($1000's) 3,541 9,475 + 5,934 168 632 487 - 145 23 2,541 2,686 + 145 6
| FISCAL YEAR 2019-20 | FISCAL YEAR 2020-21 | | PLANNED ACTUAL | + CHANGE_ | % | PLANNED ESTIMATED | + CHANGE_ | % |
PART II: MEASURES OF EFFECTIVENESS | | | | | | | 1. NEW PRIV DEV IN KAKAAKO COM DEV DIST ($M) | 55.9 163 | + 107.1 | 192 | -163 0 | + 163 | -100 | 2. NEW BLDG FLOOR SPACE IN KAKAAKO (1000 SF) | 0 224 | + 224 | 0 | 0 0 | + 0 | 0 | 3. # OF NEW HOUSING UNITS IN KAKAAKO | 267 267 | + 0 | 0 | 0 0 | + 0 | 0 | 4. # OF NEW PUBLIC FACILITIES IN KAKAAKO | 0 0 | + 0 | 0 | 0 0 | + 0 | 0 | 5. # ACTIVELY-USED PARCELS IN KALAELOA CDD | 100 105 | + 5 | 5 | 105 115 | + 10 | 10 | 6. NEW PRIVATE DEVELOPMENT WITHIN KALAELOA ($M) | 20 10 | - 10 | 50 | 20 20 | + 0 | 0 | 7. # ACRES RESTORATION OF WETLANDS USES IN HEEIA | 0 0 | + 0 | 0 | 0 0 | + 0 | 0 |
PART III: PROGRAM TARGET GROUP | | | | | | | 1. # OF RESIDENTS IN KAKAAKO | 30280 30280 | + 0 | 0 | 0 30280 | + 30280 | 0 | 2. # OF EMPLOYEES IN KAKAAKO | 25330 25330 | + 0 | 0 | 0 25330 | + 25330 | 0 | 3. # OF BUSINESSES IN KAKAAKO | 1266 1266 | + 0 | 0 | 0 1266 | + 1266 | 0 | 4. # OF LANDUSERS WITHIN KALAELOA | 17 25 | + 8 | 47 | 20 35 | + 15 | 75 | 5. # RESIDENTS WITHIN KALAELOA & SURROUNDING AREAS | 6000 6025 | + 25 | 0 | 6000 6050 | + 50 | 1 |
PART IV: PROGRAM ACTIVITY | | | | | | | 1. DEVELOPMENT PERMITS ISSUED IN KAKAAKO | 125 94 | - 31 | 25 | 125 125 | + 0 | 0 | 2. # INFRASTRUCTURE IMPROV PROJS BEGUN IN KAKAAKO | 0 0 | + 0 | 0 | 0 0 | + 0 | 0 | 3. NEW PUBLIC IMPROVEMENTS IN KAKAAKO ($M) | 0 0 | + 0 | 0 | 0 0 | + 0 | 0 | 4. # PARCELS IN KALAELOA COVERED BY ECON DEV PLAN | 60 65 | + 5 | 8 | 60 65 | + 5 | 8 | 5. NEW PLANNING IN KALAELOA ($M) | 25 25 | + 0 | 0 | 25 25 | + 0 | 0 | 6. # PARCELS, INFRASTRUCTURE SYS CONVEYED IN KALAELOA | 0 2 | + 2 | 0 | 0 5 | + 5 | 0 | 7. # PROJS FACILITATED & COMPLETED IN KALAELOA | 2 2 | + 0 | 0 | 2 2 | + 0 | 0 |
- 149 -

01 07 0101 07 0101 07 0101 07 01PROGRAM TITLE: PROGRAM TITLE: PROGRAM TITLE: PROGRAM TITLE: HAWAII COMMUNITY DEVELOPMENT AUTHORITYHAWAII COMMUNITY DEVELOPMENT AUTHORITYHAWAII COMMUNITY DEVELOPMENT AUTHORITYHAWAII COMMUNITY DEVELOPMENT AUTHORITY BED 150BED 150BED 150BED 150
VARIANCE REPORT NARRATIVE FY 2020 AND FY 2021
01 07 01 PROGRAM TITLE: HAWAII COMMUNITY DEVELOPMENT AUTHORITY BED 150
PART I - EXPENDITURES AND POSITIONS � �
FY 20 actual expenditures are greater than the budgeted amount � because the actuals include expenditures/encumbrance from prior-year accounts. The amount of actual expenditures/encumbrance from FY 20 budgeted, operating accounts was around $2,463 (thousand).� � The variance in FY 21 1st Quarter is due to six (6) vacant positions and the timing of administrative expenses (the budgeted amount is the annualized portion of the full year - large expenditures will be incurred in Quarters 2 to 4). The Executive Director position has been filled as of October 16, 2020, and there are three (3) Governor approvals submitted to the fill positions in the planning department.
PART II - MEASURES OF EFFECTIVENESS
Items 1 and 2: Consistent with the trend throughout the State, particularly in the urban core, development in Kakaako has slowed down. Development is still ongoing, however the pace will be slower than what we have experienced in recent years.� � Item 6: The lack of suitable and reliable infrastructure has delayed development in Kalaeloa. The Hawaii Community Development Authority (HCDA) has submitted biennium requests to implement further infrastructure projects in Kalaeloa to seed future development.
PART III - PROGRAM TARGET GROUPS
Item 4: The lack of suitable and reliable infrastructure has delayed development in Kalaeloa. The HCDA has submitted biennium requests to implement further infrastructure projects in Kalaeloa to seed future development.
PART IV - PROGRAM ACTIVITIES
Item 1: We will see the number of permits begin to normalize with the slow down in development in Kakaako, consistent with the development cycle.�
- 150 -

|||||
|
|||||||
12/5/20 STATE OF HAWAII VARIANCE REPORT REPORT V61 PROGRAM TITLE: HAWAII HOUSING FINANCE AND DEVELOPMENT CORP PROGRAM-ID: BED-160 PROGRAM STRUCTURE NO: 0108
FISCAL YEAR 2019-20 THREE MONTHS ENDED 09-30-20 NINE MONTHS ENDING 06-30-21
PART I: EXPENDITURES & POSITIONS BUDGETED ACTUAL + CHANGE_ % BUDGETED ACTUAL + CHANGE_ % BUDGETED ESTIMATED + CHANGE_ %
RESEARCH & DEVELOPMENT COSTS POSITIONS EXPENDITURES ($1,000's)
OPERATING COSTS POSITIONS 29.00 23.00 - 6.00 21 29.00 20.00 - 9.00 31 29.00 20.00 - 9.00 31 EXPENDITURES ($1000's) 17,854 10,025 - 7,829 44 8,868 1,914 - 6,954 78 9,051 16,005 + 6,954 77
TOTAL COSTS POSITIONS 29.00 23.00 - 6.00 21 29.00 20.00 - 9.00 31 29.00 20.00 - 9.00 31 EXPENDITURES ($1000's) 17,854 10,025 - 7,829 44 8,868 1,914 - 6,954 78 9,051 16,005 + 6,954 77
| FISCAL YEAR 2019-20 | FISCAL YEAR 2020-21 | | PLANNED ACTUAL | + CHANGE_ | % | PLANNED ESTIMATED | + CHANGE_ | % |
PART II: MEASURES OF EFFECTIVENESS | | | | | | | 1. # OF HOMEBUYERS ASSISTED | 603 328 | - 275 | 46 | 1143 200 | - 943 | 83 | 2. # OF NEW RENTAL UNITS | 464 810 | + 346 | 75 | 231 1099 | + 868 | 376 | 3. # OF EXISTING AFFORD RENTAL HOUSING UNITS PRESERV | 150 0 | - 150 | 100 | 150 70 | - 80 | 53 | 4. # OF LEASE RENTS RENEGOTIATED | 3 3 | + 0 | 0 | 3 3 | + 0 | 0 | 5. # OF SINGLE FAM LEASHLD LOTS CONVERT TO FEE SIMPLE | 2 0 | - 2 | 100 | 2 0 | - 2 | 100 |
PART III: PROGRAM TARGET GROUP | | | | | | | 1. HSEHLDS EARN UP 140% OF MED INC EST BY USDHUD | 2900 4000 | + 1100 | 38 | 2900 4000 | + 1100 | 38 |
PART IV: PROGRAM ACTIVITY | | | | | | | 1. ORIGINATE LOANS/GRANTS FOR ACQ/REHAB OR DEV OF HSE | 250 797 | + 547 | 219 | 250 250 | + 0 | 0 | 2. ALLOCATE TAX CRDT FOR ACQ/REHAB OR DEV OF HOUSING | 150 1007 | + 857 | 571 | 150 150 | + 0 | 0 | 3. ISSUE TAX-EXEMPT REVENUE BONDS ($M) | 20 84 | + 64 | 320 | 20 128.9 | + 108.9 | 545 | 4. FACILITATE DEVELOPMENT OF REAL PROPERTY | 0 0 | + 0 | 0 | 0 0 | + 0 | 0 | 5. ASSIST FIRST-TIME HOMEBUYERS | 603 328 | - 275 | 46 | 1143 200 | - 943 | 83 | 6. PROCESS APP FOR ARBITRATION OF LEASE RENT RENEGO | 2 5 | + 3 | 150 | 2 6 | + 4 | 200 | 7. PROCESS APPLICATIONS FOR LEASEHOLD CONVERSION | 2 1 | - 1 | 50 | 2 5 | + 3 | 150 |
- 151 -

01 0801 0801 08PROGRAM TITLE: PROGRAM TITLE: PROGRAM TITLE: HAWAII HOUSING FINANCE AND DEVELOPMENT CORPHAWAII HOUSING FINANCE AND DEVELOPMENT CORPHAWAII HOUSING FINANCE AND DEVELOPMENT CORP BED 160BED 160BED 160
VARIANCE REPORT NARRATIVE FY 2020 AND FY 2021
01 08 PROGRAM TITLE: HAWAII HOUSING FINANCE AND DEVELOPMENT CORP BED 160
PART I - EXPENDITURES AND POSITIONS
The position variances are primarily due to attrition, coupled with the inability to fill the vacancies as a hiring freeze was instituted during FY 20. Until the hiring freeze is removed, vacant positions will remain unfilled.� � The expenditure variance for FY 20 is primarily the result of the timing of federal grant award expenditures.� � The first quarter budget of FY 21 includes budgeted appropriation for federal funds from Act 9, SLH 2020, of $6,100,000 to correspond with Form A-19 formatting of non-reverting funds. � � In the first quarter of FY 21, actual expenditures of the non-federally funded appropriations were slightly delayed with the expectation that the expenditures will be caught up during the remainder of the fiscal year. Federally-funded expenditures fluctuate depending on the progression of funded projects that may be expended over multiple years.
PART II - MEASURES OF EFFECTIVENESS
Item 1. The negative variances in the number of homebuyers assisted for FYs 20 and 21 are a result of delayed start of projects due to the COVID-19 pandemic and the limited available capacity of the mortgage credit certificate program.� � Item 2. The positive variances in the number of new rental units for FYs 20 and 21 are a result of acceleration of completed projects and an underestimation of planned projects to be completed. � � Item 3. The negative variances in the number of existing affordable rental housing preserved for FYs 20 and 21 are a result of timing delays and an overestimation of planned projects.� � Item 4. No variances in renegotiated lease rents for FYs 20 and 21.� � Item 5. The negative variance in leasehold to fee conversions for FY 20 is
a result of not obtaining resolution approval from the Legislature due to the limited FY 21 legislative session caused by health concerns relating to the COVID-19 pandemic. The negative variance expected for FY 21 is a result of not holding public, in-person community meetings due to health concerns relating to the COVID-19 pandemic.
PART III - PROGRAM TARGET GROUPS
Item 1. Households earning 50%-140% of the U.S. Department of Housing and Urban Development average median income in accordance with a Hawaii Housing Planning Study conducted in 2019 increased to 4,000 units.
PART IV - PROGRAM ACTIVITIES
Item 1. The positive variance in the number of loan originations for FY 20 is primarily a result of the $200 million appropriation to the Rental Housing Revolving Fund; no variance estimated in FY 21.� � Item 2. The positive variance in tax credits allocated for FY 20 is primarily a result of the $200 million appropriation to the Rental Housing Revolving Fund; no variance estimated in FY 21.� � Item 3. The positive variances in the amount of tax-exempt revenue bonds issued for FYs 20 and 21 are a result of acceleration of projects due to various reasons, such as interest rates and construction costs.� � Item 4. No variances in the facilitation of real property development for FYs 20 and 21. � � Item 5. The negative variances in the number of first-time homebuyers assisted for FYs 20 and 21 are a result of delayed start of projects due to the COVID-19 pandemic and the limited available capacity of the mortgage credit certificate program.� � Item 6. The positive variances in the number of applications processed for arbitration of lease rent renegotiation for FYs 20 and 21 are a result of
- 152 -

VARIANCE REPORT NARRATIVE FY 2020 AND FY 2021
01 08 PROGRAM TITLE: HAWAII HOUSING FINANCE AND DEVELOPMENT CORP BED 160
an increase in the number of applications received. � � Item 7. No significant variance in the number of applications processed for leasehold conversions for FY 20. The positive variance for FY 21 is a result of an increase in the number of applications received.�
- 153 -

|||||
|||
||||
STATE OF HAWAII VARIANCE REPORT REPORT V61 PROGRAM TITLE: OFFICE OF AEROSPACE 12/5/20 PROGRAM-ID: BED-128 PROGRAM STRUCTURE NO: 0109
FISCAL YEAR 2019-20 THREE MONTHS ENDED 09-30-20 NINE MONTHS ENDING 06-30-21
PART I: EXPENDITURES & POSITIONS BUDGETED ACTUAL + CHANGE_ % BUDGETED ACTUAL + CHANGE_ % BUDGETED ESTIMATED + CHANGE_ %
RESEARCH & DEVELOPMENT COSTS POSITIONS EXPENDITURES ($1,000's)
OPERATING COSTS POSITIONS 0.00 0.00 + 0.00 0 0.00 0.00 + 0.00 0 0.00 0.00 + 0.00 0 EXPENDITURES ($1000's) 1,714 1,195 - 519 30 273 24 - 249 91 1,441 1,569 + 128 9
TOTAL COSTS POSITIONS 0.00 0.00 + 0.00 0 0.00 0.00 + 0.00 0 0.00 0.00 + 0.00 0 EXPENDITURES ($1000's) 1,714 1,195 - 519 30 273 24 - 249 91 1,441 1,569 + 128 9
| FISCAL YEAR 2019-20 | FISCAL YEAR 2020-21 | | PLANNED ACTUAL | + CHANGE_ | % | PLANNED ESTIMATED | + CHANGE_ | % |
PART II: MEASURES OF EFFECTIVENESS | | | | | | | 1. SUPPORT THE DOE CHALLENGER PROGRAM | 1 1 | + 0 | 0 | 1 1 | + 0 | 0 | 2. INTERNATIONAL AEROSPACE ENTITIES | 1 1 | + 0 | 0 | 1 1 | + 0 | 0 | 3. PUBLIC-PRIVATE PARTNERSHIPS INITIATED/MAINTAINED | 5 5 | + 0 | 0 | 5 5 | + 0 | 0 | 4. OUTREACH EVENTS SPONSORED BY (PISCES) | 10 10 | + 0 | 0 | 10 10 | + 0 | 0 | 5. NATIONAL AEROSPACE ENTITIES | 1 1 | + 0 | 0 | 1 1 | + 0 | 0 |
PART III: PROGRAM TARGET GROUP | | | | | | | 1. HAWAII-BASED AEROSPACE ENTITIES | 1 1 | + 0 | 0 | 1 1 | + 0 | 0 | 2. HAWAII-BASED EDUCATIONAL AND RESEARCH INSTITUTIONS | 9 9 | + 0 | 0 | 9 9 | + 0 | 0 | 3. STUDENTS AND INTERNS PARTICIPATION (PISCES) | 18 18 | + 0 | 0 | 18 18 | + 0 | 0 |
PART IV: PROGRAM ACTIVITY | | | | | | | 1. EXPLORE POSSIBLE NEW INDUSTRIES (PISCES) | 1 1 | + 0 | 0 | 1 1 | + 0 | 0 | 2. AEROSPACE PROJECTS | 4 4 | + 0 | 0 | 4 4 | + 0 | 0 | 3. HAWAII AEROSPACE ADVISORY COMMITTEE MEETINGS | 4 0 | - 4 | 100 | 4 0 | - 4 | 100 | 4. COMMUNITY OUTREACH GOAL | 24 24 | + 0 | 0 | 24 24 | + 0 | 0 |
- 154 -

01 0901 0901 0901 09PROGRAM TITLE: PROGRAM TITLE: PROGRAM TITLE: PROGRAM TITLE: OFFICE OF AEROSPACEOFFICE OF AEROSPACEOFFICE OF AEROSPACEOFFICE OF AEROSPACE BED 128BED 128BED 128BED 128
VARIANCE REPORT NARRATIVE FY 2020 AND FY 2021
01 09 PROGRAM TITLE: OFFICE OF AEROSPACE BED 128
PART I - EXPENDITURES AND POSITIONS
The variance in FY 20 expenditures is due to the Office of Aerospace having a $500,000 special fund ceiling.� � Estimated expenditures for the rest of FY 21 is the remaining appropriation less general fund restrictions.
PART II - MEASURES OF EFFECTIVENESS
No significant variances.
PART III - PROGRAM TARGET GROUPS
No significant variances.
PART IV - PROGRAM ACTIVITIES
Item 6. The Hawaii Aerospace Advisory Committee is being planned to be repealed.� �
- 155 -