Economic Costs of Excessive Alcohol Consumption in the ...
127
Economic Costs of Excessive Alcohol Consumption in the United States, 2006 Final Report Prepared for: The Centers for Disease Control and Prevention and the National Foundation for the Centers for Disease Control and Prevention Submitted by: The Lewin Group, Inc. Updated February 2013
Transcript of Economic Costs of Excessive Alcohol Consumption in the ...

Economic Costs of Excessive Alcohol Consumption in the United States, 2006
Final Report
Prepared for:
The Centers for Disease Control and Prevention and the National Foundation for the Centers for Disease Control and Prevention
Submitted by:
The Lewin Group, Inc.
Updated February 2013

Economic Costs of Excessive Alcohol Consumption in the United States,
2006
Final Report
Prepared for:
The Centers for Disease Control and Prevention and the National Foundation for the Centers for Disease
Control and Prevention
Prepared by:
Ellen Bouchery, The Lewin Group Carol Simon, The Lewin Group Hendrick Harwood, NASADAD
Updated
February 2013
Final Report Economic Cost of Excessive Alcohol Consumption
i
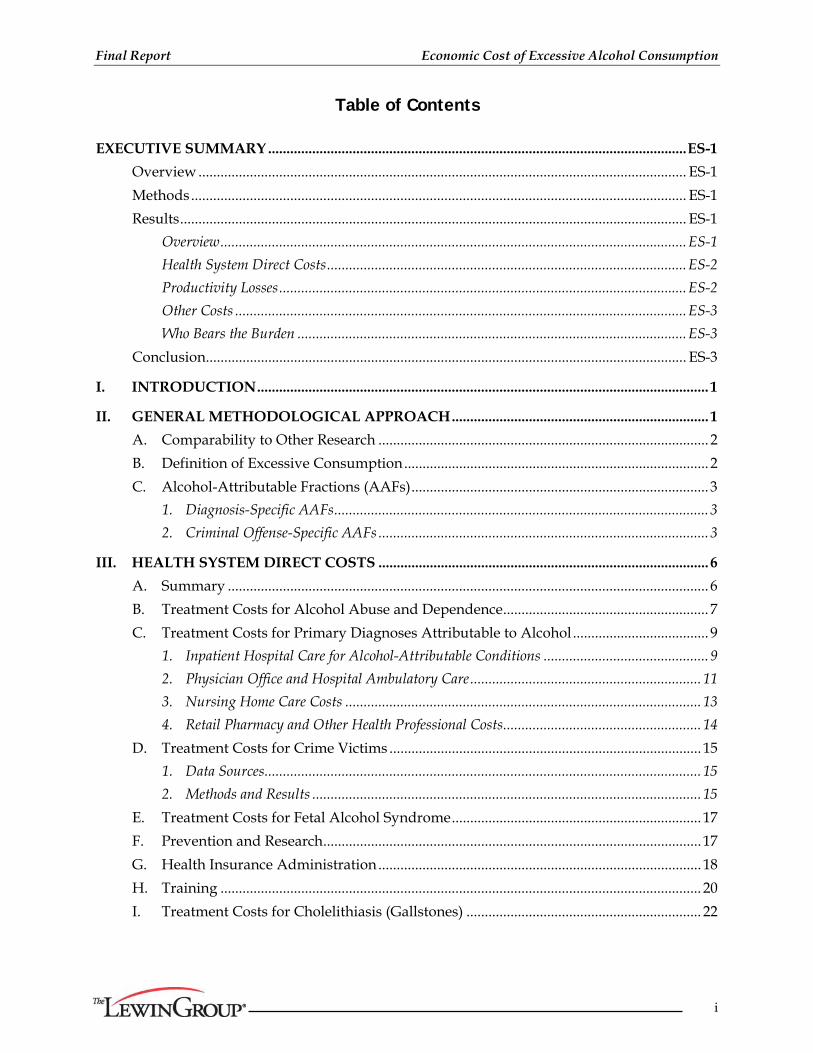
Table of Contents
EXECUTIVE SUMMARY .................................................................................................................. ES-1
Overview ..................................................................................................................................... ES-1
Methods ....................................................................................................................................... ES-1
Results .......................................................................................................................................... ES-1
Overview ............................................................................................................................... ES-1
Health System Direct Costs .................................................................................................. ES-2
Productivity Losses ............................................................................................................... ES-2
Other Costs ........................................................................................................................... ES-3
Who Bears the Burden .......................................................................................................... ES-3
Conclusion................................................................................................................................... ES-3
I. INTRODUCTION ........................................................................................................................... 1
II. GENERAL METHODOLOGICAL APPROACH ...................................................................... 1
A. Comparability to Other Research .......................................................................................... 2
B. Definition of Excessive Consumption ................................................................................... 2
C. Alcohol-Attributable Fractions (AAFs) ................................................................................. 3
1. Diagnosis-Specific AAFs ...................................................................................................... 3
2. Criminal Offense-Specific AAFs .......................................................................................... 3
III. HEALTH SYSTEM DIRECT COSTS .......................................................................................... 6
A. Summary ................................................................................................................................... 6
B. Treatment Costs for Alcohol Abuse and Dependence ........................................................ 7
C. Treatment Costs for Primary Diagnoses Attributable to Alcohol ..................................... 9
1. Inpatient Hospital Care for Alcohol-Attributable Conditions ............................................. 9
2. Physician Office and Hospital Ambulatory Care ............................................................... 11
3. Nursing Home Care Costs ................................................................................................. 13
4. Retail Pharmacy and Other Health Professional Costs ...................................................... 14
D. Treatment Costs for Crime Victims ..................................................................................... 15
1. Data Sources ....................................................................................................................... 15
2. Methods and Results .......................................................................................................... 15
E. Treatment Costs for Fetal Alcohol Syndrome .................................................................... 17
F. Prevention and Research ....................................................................................................... 17
G. Health Insurance Administration ........................................................................................ 18
H. Training ................................................................................................................................... 20
I. Treatment Costs for Cholelithiasis (Gallstones) ................................................................ 22

Final Report Economic Cost of Excessive Alcohol Consumption
ii
IV. PRODUCTIVITY LOSSES .......................................................................................................... 22
A. Summary ................................................................................................................................. 23
B. Impaired Productivity ........................................................................................................... 23
1. Traditional Earnings Model ............................................................................................... 24
2. Household Productivity Losses .......................................................................................... 32
3. Losses Related to Absenteeism............................................................................................ 33
C. Losses While Institutionalized/Hospitalized .................................................................... 40
D. Mortality .................................................................................................................................. 40
E. Crime-Related Losses ............................................................................................................ 42
1. Crime Victim Productivity Losses ..................................................................................... 42
2. Losses Related to Incarceration .......................................................................................... 43
F. Lost Earnings Among Persons With Fetal Alcohol Syndrome ........................................ 45
V. OTHER COSTS ............................................................................................................................. 45
A. Summary ................................................................................................................................. 45
B. Victim Costs (Excluding Medical and Productivity Costs) .............................................. 46
C. Criminal Justice System Costs .............................................................................................. 48
1. Correctional Costs and Private Legal Costs ....................................................................... 48
2. Government Expenditures for Police Protection and Legal and Adjudication Costs ........ 48
3. Summary ............................................................................................................................ 50
D. Motor Vehicle Crashes (Excluding Medical and Productivity Losses) .......................... 51
E. Fire Damage ............................................................................................................................ 52
F. Fetal Alcohol Syndrome ........................................................................................................ 52
VI. SUMMARY OF RESULTS ........................................................................................................... 54
A. Summary of Costs .................................................................................................................. 54
B. Crime-Related Costs .............................................................................................................. 55
C. Who Bears the Burden of Costs? .......................................................................................... 55
1. Health System Direct Costs ............................................................................................... 56
2. Productivity Losses ............................................................................................................ 57
3. Other Costs ......................................................................................................................... 58
D. Economic Costs Associated with Binge Drinking ............................................................. 62
E. Economic Costs Associated with Underage Drinking ...................................................... 65
1. Methods of allocation to underage drinking ....................................................................... 65
2. Results ................................................................................................................................ 67
F. Economic Costs Associated with Drinking During Pregnancy ....................................... 68
Final Report Economic Cost of Excessive Alcohol Consumption
iii
G. Comparison to Previous Estimates ...................................................................................... 69
1. Aggregate Cost Categories ................................................................................................. 69
2. Health System Direct Costs ............................................................................................... 71
3. Productivity Losses ............................................................................................................ 72
4. Other Costs ......................................................................................................................... 74
H. Limitations .............................................................................................................................. 74
1. Healthcare ........................................................................................................................... 75
2. Productivity ........................................................................................................................ 76
3. Other Costs ......................................................................................................................... 76
4. Overall ................................................................................................................................ 77
APPENDIX A: ALCOHOL-ATTRIBUTABLE DIAGNOSES ....................................................... 79
APPENDIX B: DETAILED HEALTH CARE TREATMENT EXPENDITURE TABLES ......... 85
APPENDIX C: EFFECT OF VARYING FETAL ALCOHOL SYNDROME PREVALENCE RATE ............................................................................................................................ 96
APPENDIX D: SUPPLEMENTAL TABLES FOR PRODUCTIVITY RESULTS ....................... 99
APPENDIX E: SUPPLEMENTAL TABLES FOR CRIMINAL JUSTICE SYSTEM COSTS ..... 104
APPENDIX F: ALCOHOL-ATTRIBUTABLE MOTOR-VEHICLE CRASHES ...................... 107
APPENDIX G: COMPARISON OF ALCOHOL-ATTRIBUTABLE CONDITIONS AND FRACTIONS TO PREVIOUS RESEARCH ........................................................ 111
REFERENCES: ..................................................................................................................................... 116

Final Report Economic Cost of Excessive Alcohol Consumption
ES-1
Executive Summary
Overview
Excessive alcohol use is responsible for an average of 79,000 deaths and 2.3 million years of potential life lost in the United States each year, making it the third leading preventable cause of death in this country. In addition to premature mortality, excessive alcohol consumption affects us all through consequences such as additional health care costs, property damage from fire and motor vehicle crashes, increased crime and criminal justice system costs, and lost productivity. The most recent detailed study of the economic costs of excessive alcohol consumption was conducted by Harwood and produced an estimate for 1992. Since then, there have been significant advances in our scientific understanding of the health and social impacts of excessive drinking. Given the huge public health impact of excessive alcohol consumption and the improvements in scientific understanding since the prior estimates, with generous support from the Robert Wood Johnson Foundation, the CDC Alcohol Team engaged The Lewin Group to develop updated estimates of the economic cost of excessive alcohol consumption in the U.S. Estimates were developed for 2006, because this is the most recent year for which cost and outcome data were generally available.
Methods
To develop estimates comparable to previous studies of the cost of excessive alcohol consumption and to studies of societal costs of other illnesses, this study follows Guidelines for PHS Cost of Illness Studies. Most previous studies of excessive alcohol consumption for the U.S. have followed these guidelines, as have most cost of illness studies performed over the past 30 years. The methods in this study are similar to those used in Harwood, however, the current study took advantage of improvements in scientific knowledge and available data.
Alcohol-attributable fractions were obtained from multiple sources, including Alcohol-Related Disease Impact software, meta-analyses, and population surveys. Economic costs were obtained from nationally representative datasets and then multiplied by the corresponding alcohol-attributable fraction. Separate estimates were made for binge drinking, underage drinking, drinking during pregnancy, and crime.
Results
Overview
The total estimated 2006 economic cost of excessive drinking (Table ES-1) was $223.5 billion, approximately $746 for each man, woman, and child in the U.S. in 2006. Of the total cost, 72.2% came from lost productivity, 11.0% from health care costs, 9.4% from criminal justice system, and 7.5% from other effects. The cost from binge drinking was $170.7 billion, underage drinking $24.6 billion, drinking during pregnancy $5.2 billion, and crime $73.3 billion.
Final Report Economic Cost of Excessive Alcohol Consumption
ES-2
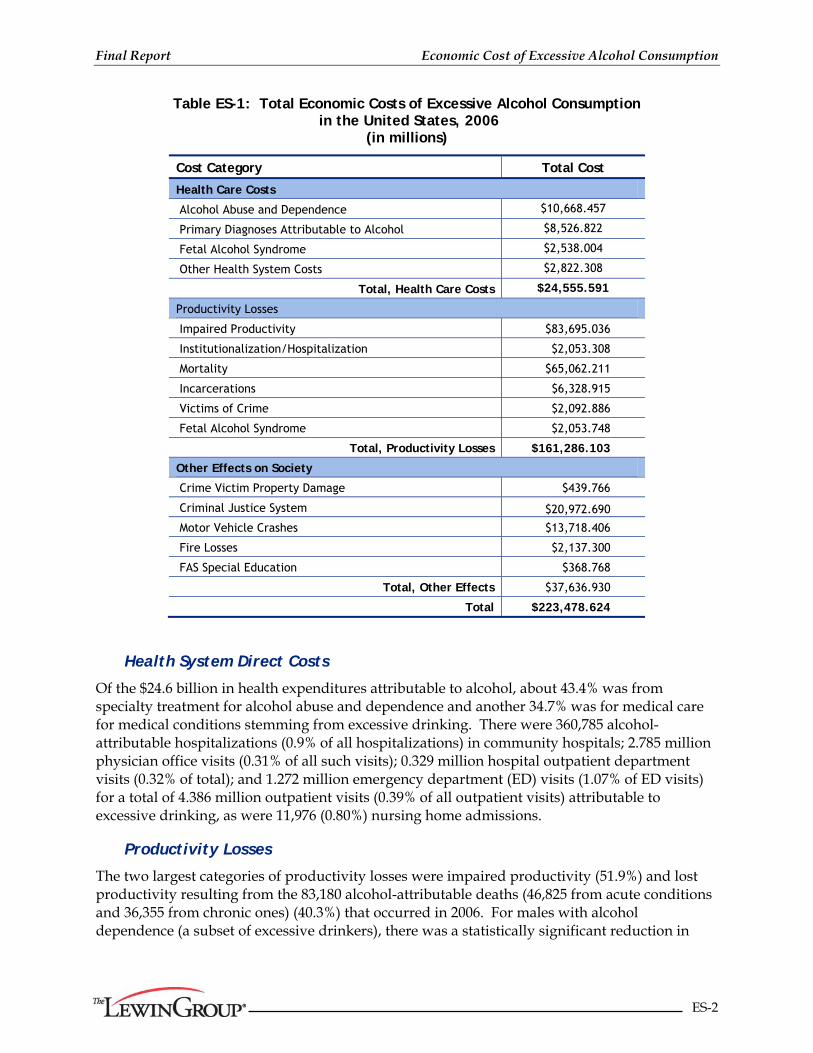
Table ES-1: Total Economic Costs of Excessive Alcohol Consumption in the United States, 2006
(in millions)
Cost Category Total Cost
Health Care Costs
Alcohol Abuse and Dependence $10,668.457
Primary Diagnoses Attributable to Alcohol $8,526.822
Fetal Alcohol Syndrome $2,538.004
Other Health System Costs $2,822.308
Total, Health Care Costs $24,555.591
Productivity Losses
Impaired Productivity $83,695.036
Institutionalization/Hospitalization $2,053.308
Mortality $65,062.211
Incarcerations $6,328.915
Victims of Crime $2,092.886
Fetal Alcohol Syndrome $2,053.748
Total, Productivity Losses $161,286.103
Other Effects on Society
Crime Victim Property Damage $439.766
Criminal Justice System $20,972.690
Motor Vehicle Crashes $13,718.406
Fire Losses $2,137.300
FAS Special Education $368.768
Total, Other Effects $37,636.930
Total $223,478.624
Health System Direct Costs
Of the $24.6 billion in health expenditures attributable to alcohol, about 43.4% was from specialty treatment for alcohol abuse and dependence and another 34.7% was for medical care for medical conditions stemming from excessive drinking. There were 360,785 alcohol-attributable hospitalizations (0.9% of all hospitalizations) in community hospitals; 2.785 million physician office visits (0.31% of all such visits); 0.329 million hospital outpatient department visits (0.32% of total); and 1.272 million emergency department (ED) visits (1.07% of ED visits) for a total of 4.386 million outpatient visits (0.39% of all outpatient visits) attributable to excessive drinking, as were 11,976 (0.80%) nursing home admissions.
Productivity Losses
The two largest categories of productivity losses were impaired productivity (51.9%) and lost productivity resulting from the 83,180 alcohol-attributable deaths (46,825 from acute conditions and 36,355 from chronic ones) (40.3%) that occurred in 2006. For males with alcohol dependence (a subset of excessive drinkers), there was a statistically significant reduction in
Final Report Economic Cost of Excessive Alcohol Consumption
ES-3
both labor force participation (2.5%) and earnings given labor force participation (5.0%). There was also an estimated 19.269 million days spent institutionalized or hospitalized for care resulting from excessive drinking and, depending on age group, 0.4-0.9 days lost to absenteeism per year for female binge drinkers and 0.5-1.2 days for male binge drinkers.
Other Costs
The two largest categories of other costs were criminal justice system costs (55.7%) and motor vehicle crashes (36.4%). Of the $21.0 billion in criminal justice system costs, 76.8% came from crimes that would not be thought of as alcohol-attributable (e.g., assault) as opposed to obviously alcohol-attributable crimes like driving under the influence of alcohol.
Who Bears the Burden
Costs related to excessive alcohol consumption may be borne by those who excessively drink and their families, government, private health insurers, employers, crime victims, and others. A full assessment of employer costs was beyond the scope of this study. Therefore, we grouped payers into 1) government, 2) excessive drinkers and their families, and 3) others.
The main payer for excessive alcohol consumption was government (42.1% of costs), followed by excessive drinkers and their families (41.5%) and then others in society (16.4%). Overall, $94.2 billion of the total economic cost of excessive alcohol use was paid by government, including federal, state, and local government agencies.
The share of payments from each payer varied considerably by type of cost. The excessive drinker and their household bear a very small share (10.3%) of the health-related expenses. Government paid the largest share (60.9%) of the health expenses. In contrast, the excessive drinker and their family paid the largest share of productivity losses (54.6%). Government paid 35.1% of these losses. The remaining costs are primarily criminal justice system and motor vehicle crash related costs. Criminal justice system costs were paid almost exclusively by government (98.9%). Motor vehicle crash costs were paid mainly by others in society (85.8%) including private insurance and the general public.
Conclusion
The estimated $223.5 billion cost of excessive drinking in 2006 is on a par with the costs of other major health risk behaviors. For example, smoking cost the U.S. over $172 billion annually — $96.8 billion from lost productivity (2000-2004) and $75.5 billion in health care costs in 1998. The total direct and indirect cost of physical inactivity in 2000 was also estimated to be in excess of $150 billion.
According to the National Institute on Alcohol Abuse and Alcoholism, 7,538,026,000 total gallons of beer, wine, and spirits were consumed in the U.S. in 2006. Considering the $94.2 billion paid by government for excessive alcohol consumption, this cost amounted to $12.50 per gallon of alcoholic beverages consumed.
Most costs for excessive alcohol consumption were attributable to binge drinking (76.4%) and resulted from lost productivity. Our estimates reflect not only the substantial health impact of excessive drinking, but the significant social impact of this behavior as reflected in the cost of
Final Report Economic Cost of Excessive Alcohol Consumption
ES-4
alcohol-attributable crime and productivity losses. Effective interventions to reduce excessive alcohol consumption — including increasing alcohol excise taxes, limiting alcohol outlet density, and maintaining and enforcing the age 21 minimum legal drinking age — are available but are underutilized and some of these interventions (e.g., increasing alcohol excise taxes) could even be used to help fund prevention and treatment activities.

Final Report Economic Cost of Excessive Alcohol Consumption
1
I. Introduction
Excessive alcohol consumption is responsible for an average of 79,000 deaths and 2.3 million years of potential life lost in the U.S. each year (1), making it the third leading preventable cause of death in this country (2). Excessive alcohol consumption is associated with multiple adverse health and social consequences, including liver cirrhosis, certain cancers, unintentional injuries, unintended pregnancy, and fetal alcohol spectrum. In addition, the link between excessive alcohol consumption and crime especially violent crime including homicide and child maltreatment is well established.
Excessive alcohol consumption affects us all through consequences such as premature death, additional health care costs, property damage from fire and motor vehicle crashes, increased crime and criminal justice system costs, and lost productivity. The most recent detailed study of the economic costs of excessive alcohol consumption was conducted by Harwood (1998) and produced an estimate of $148 billion for 1992 (3). That estimate was subsequently updated for population growth and inflation to 1998 and amounted to $185 billion (4). However, since then, there have been significant advances in our scientific understanding of the health and social impacts of excessive drinking. One such advance, made by Centers for Disease Control and Prevention (CDC) scientists working with a panel of health experts, was the development of the Alcohol-Related Disease Impact (ARDI) system (http://www.cdc.gov/alcohol/ardi.htm) which defined a set of alcohol-attributable health conditions and associated disease-specific attribution factors for excessive alcohol consumption.
Given the huge public health impact of excessive alcohol consumption, new scientific findings on the effectiveness of prevention strategies (www.thecommunityguide.org/alcohol), and health care reform, it appeared timely to update the cost estimates to better understand the importance of the problem. Accordingly, with generous support from the Robert Wood Johnson Foundation, the CDC Alcohol Team engaged The Lewin Group to conduct such a study. The purpose of the study was develop a more current estimate of the economic cost of excessive alcohol consumption in the U.S. and also to estimate the cost of binge drinking, drinking by underage youth, and drinking during pregnancy. It is our hope that these estimates will be used to more fully assess the public health impact of excessive drinking and inform discussions of public policy.
II. General Methodological Approach
An initial consideration in developing updated estimates was selecting a year for the update. Estimates were developed for 2006, because this is the most recent year for which observed cost and outcome data were generally available.
Our general approach to producing estimates of economic costs focused on three issues that were important across all components of our estimates: 1) comparability to other research (including previous cost of excessive alcohol consumption research and cost studies for other illnesses); 2) focus on excessive drinking, including binge and underage drinking as well as alcohol dependence and abuse; and 3) the assessment of the proportion of costs that were due to excessive drinking, i.e., the alcohol-attributable fraction (AAF). We discuss each of these issues in turn, below.
Final Report Economic Cost of Excessive Alcohol Consumption
2
A. Comparability to Other Research
To develop estimates comparable to previous studies of the cost of excessive alcohol consumption and to studies of societal costs of other illnesses, this study follows Guidelines for PHS Cost of Illness Studies (5). Most previous studies of excessive alcohol consumption (3,4,6) for the U.S. have followed these guidelines, as have most cost of illness studies performed over the past 30 years.
Additionally, to make the estimates more comparable across illnesses, this study developed estimates when possible as a share of national control totals. For example, national health spending is tracked annually by the Centers for Medicare and Medicaid Services (CMS) in the National Health Expenditure Accounts (NHEA). To estimate medical costs of excessive alcohol consumption, we estimated the proportion of a national total that could plausibly be attributed to excessive alcohol consumption. Similarly, for crime-related costs, the Bureau of Justice Statistics compiles national spending estimates for the criminal justice system in the “Justice Expenditure and Employment Extract Series.” Therefore, we estimated the share of those expenditures that were attributable to excessive alcohol consumption.
B. Definition of Excessive Consumption
This study is specifically directed at assessing the consequences and costs of excessive alcohol consumption. There are two primary and overlapping patterns of excessive alcohol consumption: “binge drinking” and “heavy drinking.” Binge drinking is defined as a pattern of alcohol consumption that results in a blood alcohol concentration of .08 gm/dL or greater which is typically achieved by a female consuming four or more drinks on a single occasion or a male consuming five or more drinks. Heavy drinking is the consumption of an average of more than one drink per day for females and more than two drinks per day for males. In addition to binge drinking and heavy drinking, any consumption of alcohol by pregnant women or by individuals under age 21 years is deemed excessive consumption.
This problem definition encompasses alcohol-attributable health and social outcomes resulting from alcohol dependence and alcohol abuse, but also includes the broader range of health and social problems that are associated with non-dependent excessive drinking, including a wide range of acute and chronic health problems; productivity losses due to absenteeism; and crimes committed while intoxicated. This broader focus on excessive drinking is consistent with the public health focus on excessive drinking as a risk factor for various health and social harms, and is consistent with the World Health Organization’s (WHO’s) emphasis on reducing the harmful use of alcohol, as described in the draft Global Alcohol Strategy.
While we assessed a broad range of economic costs associated with excessive drinking, our methods remained consistent with the Guidelines for PHS Cost of Illness Studies (5), as previously noted. Furthermore, the costs that we assessed in this report, and the methods we used to do so, were consistent with the methods used in the previous cost studies done by Harwood in 1992 and 1998, even though these reports were ostensibly focused on costs due to alcohol abuse, perhaps implying that they were restricted to costs that were largely attributable to clinical alcohol use disorders. We did, however, make use of the best available science for assessing the economic costs of alcohol-attributable health and social outcomes, and as a result, some of the

Final Report Economic Cost of Excessive Alcohol Consumption
3
specific conditions or approaches that we used to obtain alcohol-attributable fractions (AAFs) (e.g., AAFs for crime), differed somewhat from those that were used in previous cost studies.
C. Alcohol-Attributable Fractions (AAFs)
Several components of this study use AAFs - that is the proportion of a condition or outcome that is due to excessive alcohol consumption. For some outcomes, AAFs already existed; for others we developed AAFs based on literature review. Following is a summary of how we chose diagnosis- and criminal offense-specific AAFs. The choices of other AAFs are discussed elsewhere in the relevant section.
1. Diagnosis-Specific AAFs
The CDC’s ARDI system produces estimates of alcohol-attributable deaths and years of potential life lost due to excessive alcohol consumption for conditions identified by a panel of public health experts as fully or partially attributable to alcohol. This panel also guided the selection or calculation of attribution factors for each cause of death.
For this study, the conditions and attribution factors used for fatalities were fully adopted from ARDI. For each fatal outcome in ARDI, a nonfatal equivalent was defined, e.g., fatal = homicide; nonfatal = assault (see Appendix Table A). For non-fatal chronic health conditions, the study used the AAFs for the equivalent fatal condition from ARDI. For nonfatal injuries, the AAFs for fatal injuries in ARDI would not be appropriate as they would overestimate the contribution of excessive drinking to the nonfatal outcome. Based on a CDC literature review in 2009, this study identified AAFs for motor vehicle injuries, unintentional injuries other than motor vehicle injuries, and injuries from violence. These AAF were used for the given category of injuries irrespective of the treatment setting as noted in Table II-1.
Table II-1: AAFs for Non-Fatal Injury
Type of Non-Fatal Injury AAF Source
Motor Vehicle Traffic Injuries .061
Blincoe L, Seay A, Zaloshnja E, Miller T, Romano E, Luchter S, Spicer R. The Economic Impact of Motor Vehicle Crashes, 2000 (NHTSA Technical Report). May 2002. Washington, DC: U.S. Department of Transportation, National Highway Traffic Safety Administration. Table 10.
Unintentional Injuries .058
Cherpitel (2005) “Attributable Risk of Injury Associated with Alcohol Use: Cross National Data from the Emergency Room Collaborative Alcohol Analysis Project.” American Journal of Public Health. 95, No 2: 266-272. Table 3.
Injuries from Violence .267
Cherpitel (2005) “Attributable Risk of Injury Associated with Alcohol Use: Cross National Data from the Emergency Room Collaborative Alcohol Analysis Project.” American Journal of Public Health. 95, No 2: 266-272. Table 3.
2. Criminal Offense-Specific AAFs
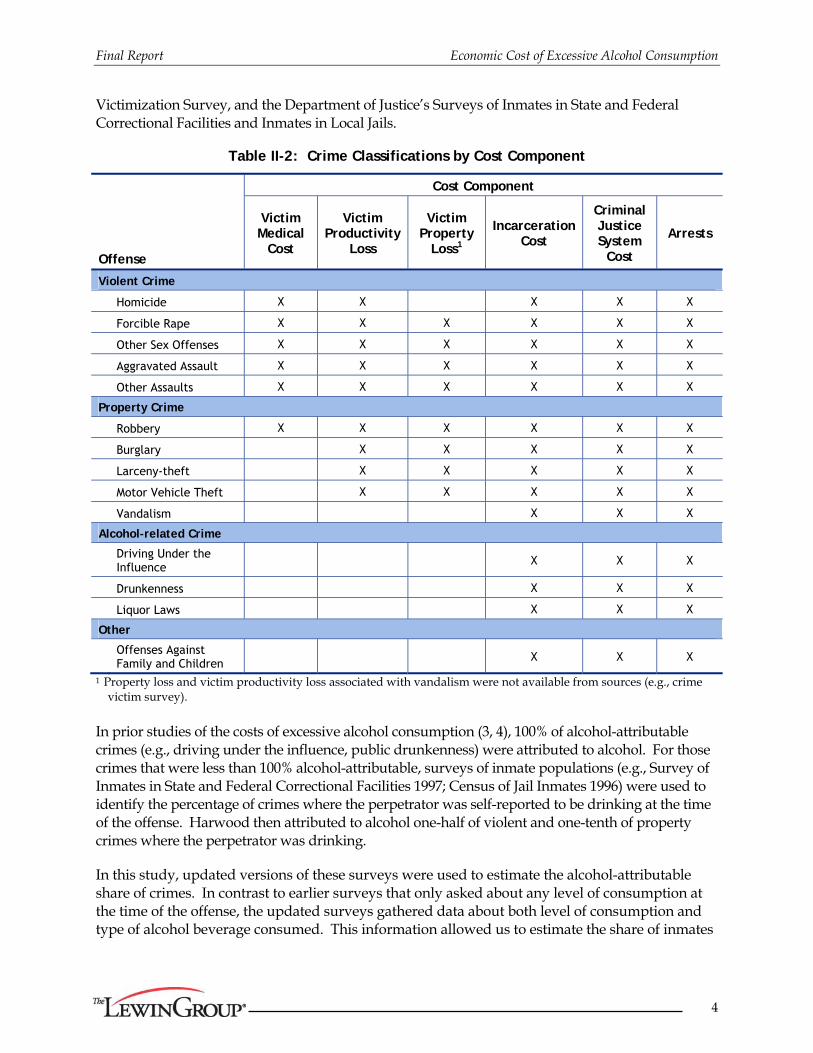
Table II-2 displays the categories of offenses this study attributes to excessive alcohol consumption and the cost components that were assessed by offense. These categories were developed to align with our primary data sources: Sourcebook of Criminal Justice Statistics Online, Federal Bureau of Investigations’ “Arrests by Offense and Age, 2006,” the Bureau of Justice Statistics’ National Crime
Final Report Economic Cost of Excessive Alcohol Consumption
4
Victimization Survey, and the Department of Justice’s Surveys of Inmates in State and Federal Correctional Facilities and Inmates in Local Jails.
Table II-2: Crime Classifications by Cost Component
Offense
Cost Component
Victim Medical
Cost
Victim Productivity
Loss
Victim Property
Loss1
Incarceration Cost
Criminal Justice System
Cost
Arrests
Violent Crime
Homicide X X X X X
Forcible Rape X X X X X X
Other Sex Offenses X X X X X X
Aggravated Assault X X X X X X
Other Assaults X X X X X X
Property Crime
Robbery X X X X X X
Burglary X X X X X
Larceny-theft X X X X X
Motor Vehicle Theft X X X X X
Vandalism X X X
Alcohol-related Crime
Driving Under the Influence X X X
Drunkenness X X X
Liquor Laws X X X
Other
Offenses Against Family and Children X X X
1 Property loss and victim productivity loss associated with vandalism were not available from sources (e.g., crime victim survey).
In prior studies of the costs of excessive alcohol consumption (3, 4), 100% of alcohol-attributable crimes (e.g., driving under the influence, public drunkenness) were attributed to alcohol. For those crimes that were less than 100% alcohol-attributable, surveys of inmate populations (e.g., Survey of Inmates in State and Federal Correctional Facilities 1997; Census of Jail Inmates 1996) were used to identify the percentage of crimes where the perpetrator was self-reported to be drinking at the time of the offense. Harwood then attributed to alcohol one-half of violent and one-tenth of property crimes where the perpetrator was drinking.
In this study, updated versions of these surveys were used to estimate the alcohol-attributable share of crimes. In contrast to earlier surveys that only asked about any level of consumption at the time of the offense, the updated surveys gathered data about both level of consumption and type of alcohol beverage consumed. This information allowed us to estimate the share of inmates

Final Report Economic Cost of Excessive Alcohol Consumption
5
intoxicated at the time of the offense (Table II-3); inmates were categorized by controlling offense, i.e., the crime for which they were punished.
Table II-3: Site- and Crime-specific Percentage of Incarcerated Persons Under the Influence of Alcohol and Intoxicated at the Time of Their Offense
Type of Offense
Federal & State Prisons Local Jails
Percent Drinking1
Percent Intoxicated1
Percent Drinking1
Percent Intoxicated1
Violent Crime
Homicide 40.8% 33.1% 15.2% 13.8%
Forcible Rape 37.0% 28.3% 34.4% 31.1%
Other Sex Offenses 27.4% 21.5% 21.0% 18.8%
Aggravated Assault 38.7% 29.4% 27.9% 22.6%
Other Assault 25.0% 18.8% 17.3% 13.8%
Property Crime
Robbery 32.1% 26.5% 20.8% 18.7%
Burglary 33.0% 27.2% 25.5% 21.9%
Larceny – theft 25.1% 19.9% 20.7% 16.1%
Motor vehicle theft 27.5% 22.2% 26.8% 23.1%
Vandalism 29.1% 26.8% 32.6% 19.2%
Alcohol-Related Crime2
Driving Under The Influence 90.7% 68.5% 82.0% 63.3%
Public Drunkenness3 49.9% 35.3% 45.4% 34.8%
Liquor laws 100.0% 100.0% 53.0% 53.0%
Other
Offenses Against Family and Children 16.2% 12.5% 14.0% 9.5%
All Other 21.6% 15.9% 17.7% 12.6%
Total 30.3% 23.6% 24.6% 19.0%
Source: Analysis of the Jail Inmate Survey, 2002 and the Survey of State and Federal Prison Inmates, 2004. 1 Percent drinking indicates the percentage of incarcerated persons who had been drinking any alcohol at the time of
the offense. Intoxicated was defined as having four or more drinks for a female or five or more drinks for a male at the time of or immediately prior to the offense.
2 Alcohol-related crimes were 100% attributed to alcohol regardless of inmate reports of intoxication. 3 This category includes drunkenness, disorderly conduct, vagrancy, begging, loitering, and unlawful assembly. It
was not possible to identify drunkenness separately.
The AAF for homicide was drawn from ARDI (note: it is a perpetrator-based AAF). Alcohol-related crimes including driving under the influence of alcohol, public drunkenness, and liquor law violations were fully attributed to alcohol. For other offenses, attribution, i.e., the AAF was estimated as the percentage of offenders intoxicated at the time of their offense (Table II-4). Use of intoxication at the time of the offense is consistent with the literature and assures that alcohol played a significant role in the event. AAFs for state and federal inmates were used to attribute costs for these incarcerations. AAFs for jail inmates were used to attribute costs for jail incarcerations, as well as for arrests and victim costs by offense. Crimes that were less than 100% attributable to alcohol were only counted if the offender was 15 years of age or older.

Final Report Economic Cost of Excessive Alcohol Consumption
6
Table II-4: Criminal Offense-Specific AAFs
Type of Crime
Federal & State Incarceration
Costs
Jail Incarceration,
Arrests, & Victim Costs
Violent Crime
Homicide 47.0% 47.0%
Forcible Rape 28.3% 31.1%
Other Sex Offenses 21.5% 18.8%
Aggravated Assault 29.4% 22.6%
Other Assault 18.8% 13.8%
Property Crime
Robbery 26.5% 18.7%
Burglary 27.2% 21.9%
Larceny - theft 19.9% 16.1%
Motor vehicle theft 22.2% 23.1%
Vandalism 26.8% 19.2%
Alcohol-Related Crime
Driving Under The Influence 100.0% 100.0%
Public Drunkenness 100.0% 100.0%
Liquor laws 100.0% 100.0%
Other
Offenses Against Family and Children 12.5% 9.5%
III. Health System Direct Costs
Health system direct costs are the use of goods or services for treatment of a health problem. We estimated health system direct costs for the 54 chronic and acute conditions included in ARDI, including alcohol dependence and abuse. We also assessed other health system costs and the cost of medical services for crime victims. Inpatient and outpatient costs were only assessed for persons with a primary diagnosis of an alcohol-attributable condition, as defined by ARDI.
In the next section, we provide a summary of the estimated health system direct costs. Then, we provide a discussion of the methods related to each component of the estimates.
A. Summary
Table III-1 itemizes the $24.6 billion in health expenditures attributable to alcohol in 2006. About 43.4% of the costs ($10.7 billion) were from treatment of alcohol abuse and dependence. Another 34.7% ($8.5 billion) was for medical care for medical conditions stemming from excessive drinking excluding fetal alcohol syndrome.

Final Report Economic Cost of Excessive Alcohol Consumption
7
Table III-1 Total Health Care Expenditure, 2006 (in millions of $)
Cost Category Total Cost
Alcohol Abuse and Dependence $10,668.457
Primary Diagnoses Attributable to Alcohol $8,526.822
Inpatient Hospital $5,115.568
Physician Office and Hospital Ambulatory Care $1,195.946
Nursing Home Care $1,002.888
Retail Pharmacy and Other Health Professional $1,212.420
Fetal Alcohol Syndrome $2,538.004
Other Health System Costs $2,822.308
Prevention and Research $1,207.120
Training $29.527
Health Insurance Administration $1,585.660
Total, Health Care Costs $24,555.591
B. Treatment Costs for Alcohol Abuse and Dependence
Estimates of treatment costs for alcohol abuse and dependence were drawn directly from SAMHSA’s National Mental Health (MH) and Substance Abuse (SA) Treatment Spending Estimates Project (SEP). Designed to be consistent with the NHEA, the most recent SEP estimates available were through 2003 (7). A companion study by Levit (8) projected expenditures for SA treatment from 2004-2014, but did not break-out alcohol spending (although it was calculated during development of the published estimates). These unpublished projections were obtained from SAMHSA for 2006 and used here.
The diagnoses included in these estimates were: 1) Alcohol Abuse (305.0); 2) Alcohol Dependence (303.0 and 303.9); and 3) Alcohol Psychosis (291.x). Estimates included treatment expenditures for these diagnoses at specialty SA treatment facilities and non-specialty providers in general hospitals, ambulatory care settings, nursing homes, and pharmacies. Federal spending by the VA and Indian Health Service are included in these estimates. Spending for specialty treatment for alcohol abuse was calculated based on the National Survey of Substance Abuse Treatment Services (N-SSATS). For non-specialty providers numerous data sets, such as the National Ambulatory Medical Care Survey (NAMCS) and the Healthcare Cost and Utilization Project (HCUP), and the Nationwide Inpatient Sample were used to determine the proportion of total service use and expenditures that involved a primary alcohol disorder.
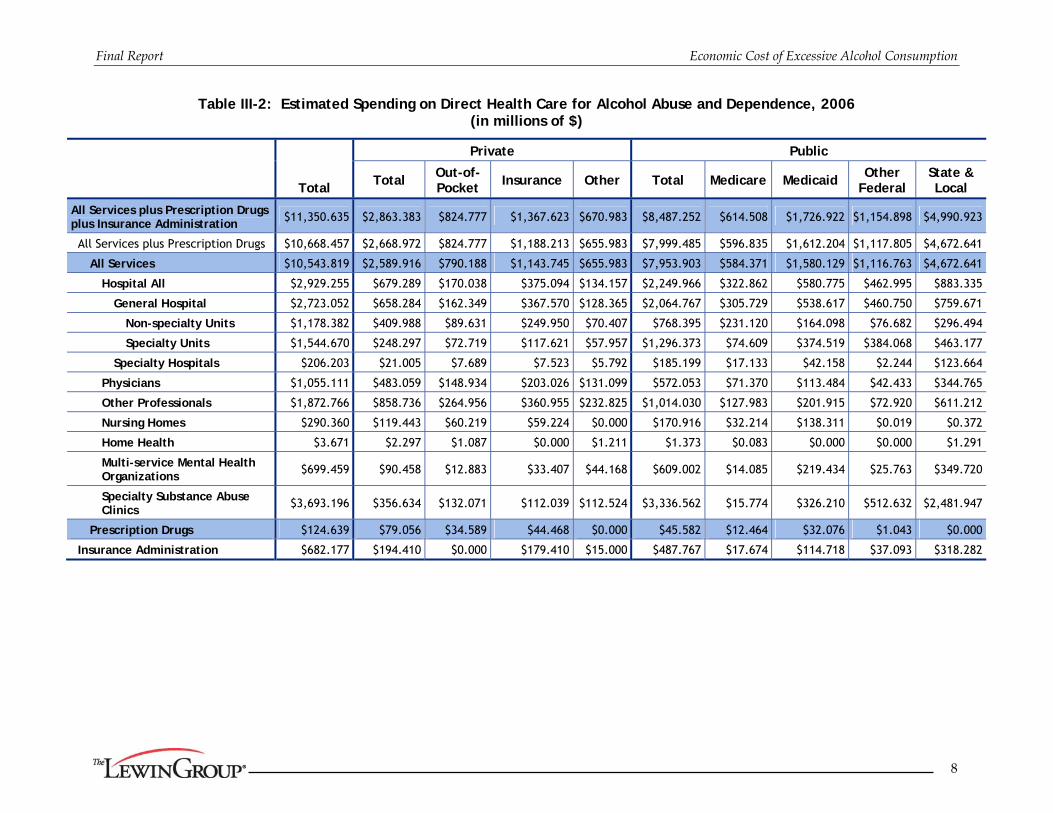
Total spending for treatment of primary diagnoses of alcohol disorders was $10,668 million in 2006 with an additional $682 million for related health insurance administration costs (Table III-2). Of the $23,572 millions spent for SA treatment, alcohol-related costs represented 48.1% of the total.
Final Report Economic Cost of Excessive Alcohol Consumption
8
Table III-2: Estimated Spending on Direct Health Care for Alcohol Abuse and Dependence, 2006 (in millions of $)
Total
Private Public
Total Out-of-Pocket
Insurance Other Total Medicare Medicaid Other
Federal State & Local
All Services plus Prescription Drugs plus Insurance Administration $11,350.635 $2,863.383 $824.777 $1,367.623 $670.983 $8,487.252 $614.508 $1,726.922 $1,154.898 $4,990.923
All Services plus Prescription Drugs $10,668.457 $2,668.972 $824.777 $1,188.213 $655.983 $7,999.485 $596.835 $1,612.204 $1,117.805 $4,672.641
All Services $10,543.819 $2,589.916 $790.188 $1,143.745 $655.983 $7,953.903 $584.371 $1,580.129 $1,116.763 $4,672.641
Hospital All $2,929.255 $679.289 $170.038 $375.094 $134.157 $2,249.966 $322.862 $580.775 $462.995 $883.335
General Hospital $2,723.052 $658.284 $162.349 $367.570 $128.365 $2,064.767 $305.729 $538.617 $460.750 $759.671
Non-specialty Units $1,178.382 $409.988 $89.631 $249.950 $70.407 $768.395 $231.120 $164.098 $76.682 $296.494
Specialty Units $1,544.670 $248.297 $72.719 $117.621 $57.957 $1,296.373 $74.609 $374.519 $384.068 $463.177
Specialty Hospitals $206.203 $21.005 $7.689 $7.523 $5.792 $185.199 $17.133 $42.158 $2.244 $123.664
Physicians $1,055.111 $483.059 $148.934 $203.026 $131.099 $572.053 $71.370 $113.484 $42.433 $344.765
Other Professionals $1,872.766 $858.736 $264.956 $360.955 $232.825 $1,014.030 $127.983 $201.915 $72.920 $611.212
Nursing Homes $290.360 $119.443 $60.219 $59.224 $0.000 $170.916 $32.214 $138.311 $0.019 $0.372
Home Health $3.671 $2.297 $1.087 $0.000 $1.211 $1.373 $0.083 $0.000 $0.000 $1.291
Multi-service Mental Health Organizations $699.459 $90.458 $12.883 $33.407 $44.168 $609.002 $14.085 $219.434 $25.763 $349.720
Specialty Substance Abuse Clinics $3,693.196 $356.634 $132.071 $112.039 $112.524 $3,336.562 $15.774 $326.210 $512.632 $2,481.947
Prescription Drugs $124.639 $79.056 $34.589 $44.468 $0.000 $45.582 $12.464 $32.076 $1.043 $0.000
Insurance Administration $682.177 $194.410 $0.000 $179.410 $15.000 $487.767 $17.674 $114.718 $37.093 $318.282

Final Report Economic Cost of Excessive Alcohol Consumption
9
C. Treatment Costs for Primary Diagnoses Attributable to Alcohol
Estimated costs for conditions fully or partially caused by alcohol were derived by multiplying three components: 1) the number of alcohol-related conditions or causes of injury based on ARDI in 2006, 2) the relevant AAF (indicating the proportion of each condition or injury attributable to alcohol), and 3) the total (or mean) estimated costs for each condition or cause of injury in 2006.
Both fatal and non-fatal conditions were included in this analysis (Appendix A). The AAFs used for each outcome are described in Section II.C. For chronic conditions where attribution was indirectly estimated, CDC provided alcohol consumption estimates specific to the 2006 population.
Costs related to treatment of alcohol abuse and dependence (ICD-9 = 303.xx Alcohol Dependence Syndrome or 305.0x – Alcohol Abuse or 291.xx -- Alcohol Psychoses, where x=any number) were not included here as they are reported in Section III.B. Similarly, costs for fetal alcohol syndrome were not included in this section as they are reported in Section III.E.
Health care costs were estimated for the following categories: inpatient hospitalizations, ambulatory care visits (hospital outpatient department, emergency department, and physician offices), nursing home admissions, retail pharmacy and other health professional costs.
1. Inpatient Hospital Care for Alcohol-Attributable Conditions
Cost estimates for non-federal and federal hospitals were developed separately, because federal hospitals are not included in the Healthcare Cost and Utilization Project (HCUP) National Inpatient Sample (NIS), the primary data source for the estimating non-federal hospital costs. Methods for non-federal hospitals are described in the next section. Then, methods for estimating federal hospital costs are described.
a. Non-Federal Hospitals
(1) Data Sources
Hospital discharges and the associated charges for each alcohol-attributable condition were identified in the HCUP, NIS based on primary diagnosis. NIS included data from about 8 million discharges from approximately 1,000 hospitals in 38 states, representing 90% of hospital discharges nationally. HCUP includes weights for producing national estimates; those estimates may be biased to the extent that patterns of care and excessive drinking in the 12 unrepresented states are different from those in the 38 represented states. Discharges from smaller states are underrepresented in the HCUP. Nonetheless, the HCUP is frequently used in federal and academic analyses to develop national estimates for spending and costs of hospital inpatient care, and is particularly valuable for analysis of less frequent conditions.
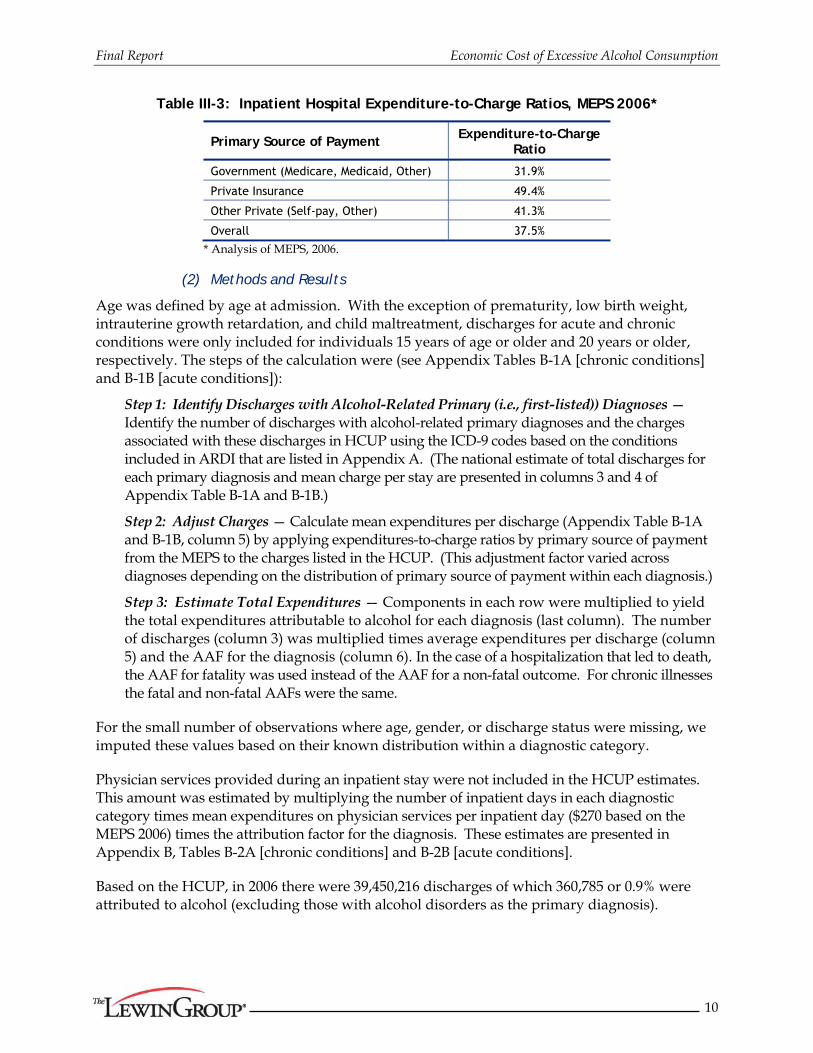
Instead of using national estimates of average per diem inpatient costs as Harwood did, we used HCUP data on charges, as these data, while not directly associated with payments, provide information on which discharges tend to be more costly. We used expenditure-to-charge ratios by payer developed from the MEPS for inpatient care for all diagnoses to adjust the charge estimates to expenditures, i.e., payments (Table III-3).
Final Report Economic Cost of Excessive Alcohol Consumption
10
Table III-3: Inpatient Hospital Expenditure-to-Charge Ratios, MEPS 2006*
Primary Source of Payment Expenditure-to-Charge
Ratio
Government (Medicare, Medicaid, Other) 31.9%
Private Insurance 49.4%
Other Private (Self-pay, Other) 41.3%
Overall 37.5%
* Analysis of MEPS, 2006. (2) Methods and Results
Age was defined by age at admission. With the exception of prematurity, low birth weight, intrauterine growth retardation, and child maltreatment, discharges for acute and chronic conditions were only included for individuals 15 years of age or older and 20 years or older, respectively. The steps of the calculation were (see Appendix Tables B-1A [chronic conditions] and B-1B [acute conditions]):
Step 1: Identify Discharges with Alcohol-Related Primary (i.e., first-listed)) Diagnoses — Identify the number of discharges with alcohol-related primary diagnoses and the charges associated with these discharges in HCUP using the ICD-9 codes based on the conditions included in ARDI that are listed in Appendix A. (The national estimate of total discharges for each primary diagnosis and mean charge per stay are presented in columns 3 and 4 of Appendix Table B-1A and B-1B.)
Step 2: Adjust Charges — Calculate mean expenditures per discharge (Appendix Table B-1A and B-1B, column 5) by applying expenditures-to-charge ratios by primary source of payment from the MEPS to the charges listed in the HCUP. (This adjustment factor varied across diagnoses depending on the distribution of primary source of payment within each diagnosis.)
Step 3: Estimate Total Expenditures — Components in each row were multiplied to yield the total expenditures attributable to alcohol for each diagnosis (last column). The number of discharges (column 3) was multiplied times average expenditures per discharge (column 5) and the AAF for the diagnosis (column 6). In the case of a hospitalization that led to death, the AAF for fatality was used instead of the AAF for a non-fatal outcome. For chronic illnesses the fatal and non-fatal AAFs were the same.
For the small number of observations where age, gender, or discharge status were missing, we imputed these values based on their known distribution within a diagnostic category.
Physician services provided during an inpatient stay were not included in the HCUP estimates. This amount was estimated by multiplying the number of inpatient days in each diagnostic category times mean expenditures on physician services per inpatient day ($270 based on the MEPS 2006) times the attribution factor for the diagnosis. These estimates are presented in Appendix B, Tables B-2A [chronic conditions] and B-2B [acute conditions].
Based on the HCUP, in 2006 there were 39,450,216 discharges of which 360,785 or 0.9% were attributed to alcohol (excluding those with alcohol disorders as the primary diagnosis).
Final Report Economic Cost of Excessive Alcohol Consumption
11
b. Federal Hospitals
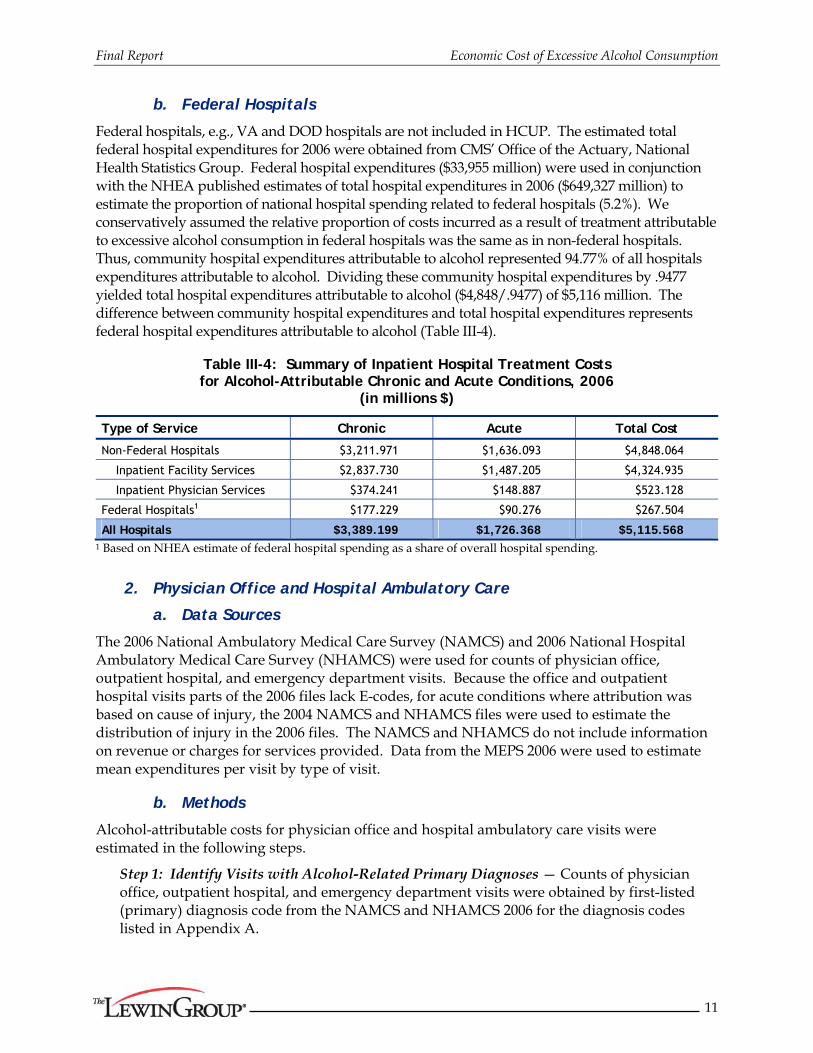
Federal hospitals, e.g., VA and DOD hospitals are not included in HCUP. The estimated total federal hospital expenditures for 2006 were obtained from CMS’ Office of the Actuary, National Health Statistics Group. Federal hospital expenditures ($33,955 million) were used in conjunction with the NHEA published estimates of total hospital expenditures in 2006 ($649,327 million) to estimate the proportion of national hospital spending related to federal hospitals (5.2%). We conservatively assumed the relative proportion of costs incurred as a result of treatment attributable to excessive alcohol consumption in federal hospitals was the same as in non-federal hospitals. Thus, community hospital expenditures attributable to alcohol represented 94.77% of all hospitals expenditures attributable to alcohol. Dividing these community hospital expenditures by .9477 yielded total hospital expenditures attributable to alcohol ($4,848/.9477) of $5,116 million. The difference between community hospital expenditures and total hospital expenditures represents federal hospital expenditures attributable to alcohol (Table III-4).
Table III-4: Summary of Inpatient Hospital Treatment Costs for Alcohol-Attributable Chronic and Acute Conditions, 2006
(in millions $)
Type of Service Chronic Acute Total Cost
Non-Federal Hospitals $3,211.971 $1,636.093 $4,848.064
Inpatient Facility Services $2,837.730 $1,487.205 $4,324.935
Inpatient Physician Services $374.241 $148.887 $523.128
Federal Hospitals1 $177.229 $90.276 $267.504
All Hospitals $3,389.199 $1,726.368 $5,115.568 1 Based on NHEA estimate of federal hospital spending as a share of overall hospital spending.
2. Physician Office and Hospital Ambulatory Care
a. Data Sources
The 2006 National Ambulatory Medical Care Survey (NAMCS) and 2006 National Hospital Ambulatory Medical Care Survey (NHAMCS) were used for counts of physician office, outpatient hospital, and emergency department visits. Because the office and outpatient hospital visits parts of the 2006 files lack E-codes, for acute conditions where attribution was based on cause of injury, the 2004 NAMCS and NHAMCS files were used to estimate the distribution of injury in the 2006 files. The NAMCS and NHAMCS do not include information on revenue or charges for services provided. Data from the MEPS 2006 were used to estimate mean expenditures per visit by type of visit.
b. Methods
Alcohol-attributable costs for physician office and hospital ambulatory care visits were estimated in the following steps.
Step 1: Identify Visits with Alcohol-Related Primary Diagnoses — Counts of physician office, outpatient hospital, and emergency department visits were obtained by first-listed (primary) diagnosis code from the NAMCS and NHAMCS 2006 for the diagnosis codes listed in Appendix A.

Final Report Economic Cost of Excessive Alcohol Consumption
12
Step 2: Estimate Expenditures per Visit — Data from the MEPS 2006 were used to estimate mean expenditures per visit by type of visit (Table III-5). To develop the estimates, we truncated the report distribution of expenditures at the 95th percentile to reduce the impact of outliers. We believe this method is consistent with the conservative approach used throughout this study. Without truncation, the estimates would increase to: emergency department visit – admitted = $152, emergency department visit – not admitted = $738, hospital outpatient department visit = $690, and an office visit = $161.
Table III-5: Mean Physician Visit Expenditures by Type of Visit MEPS, 2006
Type of Visit Mean Expenditure per Visit
Physician Office Visit $112
Hospital Outpatient Department Visit $539
Hospital Emergency Room Visit – Admitted $143
Hospital Emergency Room Visit – Not Admitted $607
Step 3: Estimate Total Expenditures -- Counts of visits for each diagnostic category were multiplied by mean expenditures per visit and by the AAF for the diagnostic group and patient characteristics to estimate total expenditures (For simplicity, a single estimate of mean expenditures per visit was estimated across all payers).
With the exception of prematurity, low birth weight, intrauterine growth retardation, child maltreatment, and motor vehicle non-traffic crashes, acute and chronic conditions were only calculated for individuals 15 years of age or older and 20 or older, respectively.
Appendix B, Tables B-3A [chronic conditions] and B-3B [acute conditions] display these calculations by diagnosis or cause of injury and type of visit.
c. Results
Overall, $1,196 million in physician office and hospital ambulatory care treatment costs were attributed to the medical consequences of excessive alcohol consumption (Table III-6).
Table III-6: Ambulatory Treatment Costs Attributable to Alcohol, 2006
Type of Visit Chronic Conditions
Acute Conditions
Total Cost
Physician In-Office $199.312 $112.613 $311.925
Hospital Outpatient $99.426 $77.730 $177.156
Hospital Emergency – Admitted $9.767 $10.336 $20.103
Hospital Emergency Room Visit – Not Admitted $47.439 $639.323 $686.762
Total $355.944 $840.002 $1,195.946

Final Report Economic Cost of Excessive Alcohol Consumption
13
These costs resulted from 2,785,040 physician office visits, 328,678 outpatient hospital visits, and 1,271,987 emergency room visits. Alcohol-attributable visits represented 0.39% of all ambulatory care visits in 2006 (Table III-7).
Table III-7: Physician Office and Hospital Ambulatory Treatment Visits for Alcohol-Attributable (AA) Conditions, 2006
Type of Visit AA Visits All Visits AA Share
Physician In-Office 2,785,040 901,954,225 0.31%
Hospital Outpatient 328,676 102,208,171 0.32%
Hospital Emergency 1,271,987 119,191,528 1.07%
Total 4,385,703 1,123,353,924 0.39%
3. Nursing Home Care Costs
We only estimated nursing home care costs attributable to non-dependent excessive drinking because nursing home costs related to alcohol abuse or dependence were already accounted for in Section III.A. The number of current nursing home residents with an alcohol-attributable diagnosis at admission was estimated from the NNHS 2004 (the 1992 report only included costs for nursing home residents with a primary diagnosis of alcohol abuse; thus this study expands this category of costs). The costs associated with these residents were estimated as follows:
Step 1: Identify Residents with Alcohol-Attributable Diagnoses — The approximately 1.5 million nursing home residents in 2004 were divided into four groups based on primary diagnosis at admission: 1) those with alcohol abuse or dependence (these costs were excluded, as noted above, to avoid double-counting), 2) those admitted with alcohol-attributable chronic conditions (see Appendix A), 3) those admitted with injury diagnoses, and 4) those with diagnoses unrelated to alcohol. Because E-coding was unavailable in the NNHS, to count injuries for group 2 we summed a) all residents with admissions for injuries (primary diagnosis in ICD-9 range 800 – 999) and b) all residents with primary admission code of V54 (other orthopedic aftercare) and secondary or tertiary diagnosis(es) in ICD range 800 – 999 to identify those receiving such aftercare in a nursing home following an acute injury.
Step 2: Apply AAFs — We first excluded Group 1 and Group 4. We then applied AAFs to the count of residents in Group 2 by alcohol-attributable chronic condition admitting diagnosis by gender (using AAFs as appropriate from Appendix A) to determine the total number of Group 2 residents whose admission was attributable to alcohol. For Group 3, we multiplied the total number of residents admitted with either an a) injury diagnosis or b) orthopedic aftercare following an acute injury by 0.058 − the AAF used for non-fatal, unintentional injuries (Table II-1).
Step 3: Estimate Overall Percentage of Residents Whose Admission Was Attributable to Alcohol — The total number of residents who were admitted for an alcohol-attributable condition (excluding persons admitted with alcohol abuse or dependence) was then divided by the total number of residents to determine the overall proportion of residents who were admitted with an alcohol-attributable condition.
Step 4: Estimate Total Expenditures by Source of Payment -- The percentage of residents who were admitted with an alcohol-attributable condition was then multiplied times the

Final Report Economic Cost of Excessive Alcohol Consumption
14
total NHEA Nursing Home Care Expenditures for 2006 by source of payment. Because we were unable to identify a primary source of payment for each resident, and the survey provided no information on the contribution level of reported payers, the share of NHEA expenditures attributed to alcohol was held constant across payers.
Table III-8 displays estimated nursing home costs attributable to alcohol. Of the 1,492,207 nursing home residents in 2004, the admissions of 11,976 or 0.80% were attributed to alcohol. Acute conditions represented 74.0% of residents with alcohol-attributable primary diagnoses; the remainder had chronic conditions. These estimates represent about $84,000 per year for each of the nursing home residents with a stay attributable to alcohol.
Table III-8: Nursing Home Costs Attributable to Alcohol, 2006 (in millions $)
Category of Costs Private Health
Insurance Medicaid Medicare Other
Out-of-Pocket Total
Total National Expenditures1 $9,264 $54,087 $21,080 $8,204 $32,727 $125,362
Estimated Expenditures Attributable to Alcohol2 $74.111 $432.693 $168.639 $65.631 $261.814 $1,002.888
1 Downloaded from http://www.cms.hhs.gov/NationalHealthExpendData/02_NationalHealthAccountsHistorical.asp. Published NHEA estimates were rounded to the nearest million. Therefore, additional decimal places are not provided.
2 Total NHEA expenditures for each payer times the share of nursing home expenditures attributable to alcohol (0.80%).
4. Retail Pharmacy and Other Health Professional Costs
Retail pharmacy and other professional (e.g., home health technicians) costs were estimated as a percentage of NHEA costs for these services. In the 1992 Harwood report, this percentage of NHEA costs was based on the share of hospital days for conditions fully or partially caused by alcohol. Because retail pharmacy and other health professional services are ambulatory care services, for this study this share was estimated based on the share of all ambulatory visits attributed to alcohol. Of 1.123 billion ambulatory visits, we estimated that 4.386 million or 0.39% were alcohol-attributable (Table III-7) (This excludes alcohol-attributable visits for a primary diagnosis of alcohol abuse, alcohol dependence or alcohol psychosis as costs related to these diagnoses are summarized in Section A). This share was applied to NHEA costs for retail pharmacy, non-durable medical equipment, and other health professional services to estimate the share of these costs attributable to alcohol. We assumed a constant share of expenditures attributable to alcohol across all payment sources (Table III-9).

Final Report Economic Cost of Excessive Alcohol Consumption
15
Table III-9: Retail Pharmacy, Other Professional, and Non-Durable Medical Equipment Costs Attributable to Alcohol, 2006
(in millions $)
Category of Costs Private Health
Insurance Medicaid Medicare Other
Out-of-Pocket
Total
Total National Expenditures1
Retail Pharmacy $96,244 $19,723 $39,516 $14,623 $46,731 $216,837
Non-Durable Medical Equipment $0 $0 $2,299 $0 $33,043 $35,342
Other Professional Services $21,446 $3,657 $12,482 $6,125 $14,987 $58,697
Estimated Expenditures Attributable to Alcohol2
Retail Pharmacy $375.352 $76.920 $154.112 $57.030 $182.251 $845.664
Non-Durable Medical Equipment $0.000 $0.000 $8.966 $0.000 $128.868 $137.834
Other Professional Services $83.641 $14.263 $48.681 $23.888 $58.450 $228.922
Total $458.992 $91.182 $211.759 $80.918 $369.569 $1,212.420
1 CMS National Health Expenditure Totals 2006. Published NHEA estimates are rounded to the nearest million. Therefore, additional decimal places are not provided.
2 0.39% of the CMS National Health Expenditure Total 2006, based on share of total national ambulatory visits attributable to alcohol.
D. Treatment Costs for Crime Victims
1. Data Sources
The National Crime Victimization Survey (NCVS) is the primary source of information on the characteristics of criminal victimization and on the number and types of crimes not reported to law enforcement authorities. Data are obtained from a nationally representative sample of the U.S. population on the frequency, characteristics, and consequences of criminal victimization in the U.S. Using data from the 2006 NCVS, we estimated three types of crime victim losses: medical expenses, earnings lost due to missed worked days, and loss of stolen or damaged property. In this section we discuss losses from medical expenses; other types of victim losses are reported in Sections IV-E and V-B.
We focused on FBI Class I crimes or 100% alcohol-attributable crimes that were included in the NCVS. The numbers of crime victims were taken from The National Crime Victimization Survey Statistical Tables, 2006. To estimate mean medical expenses per victim, we analyzed the NCVS 2006 data on victims report of whether they received medical care as a result of the crime, and, if so where the care was received, and the amount of their medical expenses, including any expenses paid by insurance.
2. Methods and Results
The total medical expense was estimated as follows:
Step 1: Assign Victims to Crime Categories — Respondents were assigned to one of nine crime categories based on the type of crime code in the NCVS 2006. Only five of these
Final Report Economic Cost of Excessive Alcohol Consumption
16
categories are presented in Table III-10 below because the remaining categories were either not attributable to alcohol or did not have any reported medical costs.
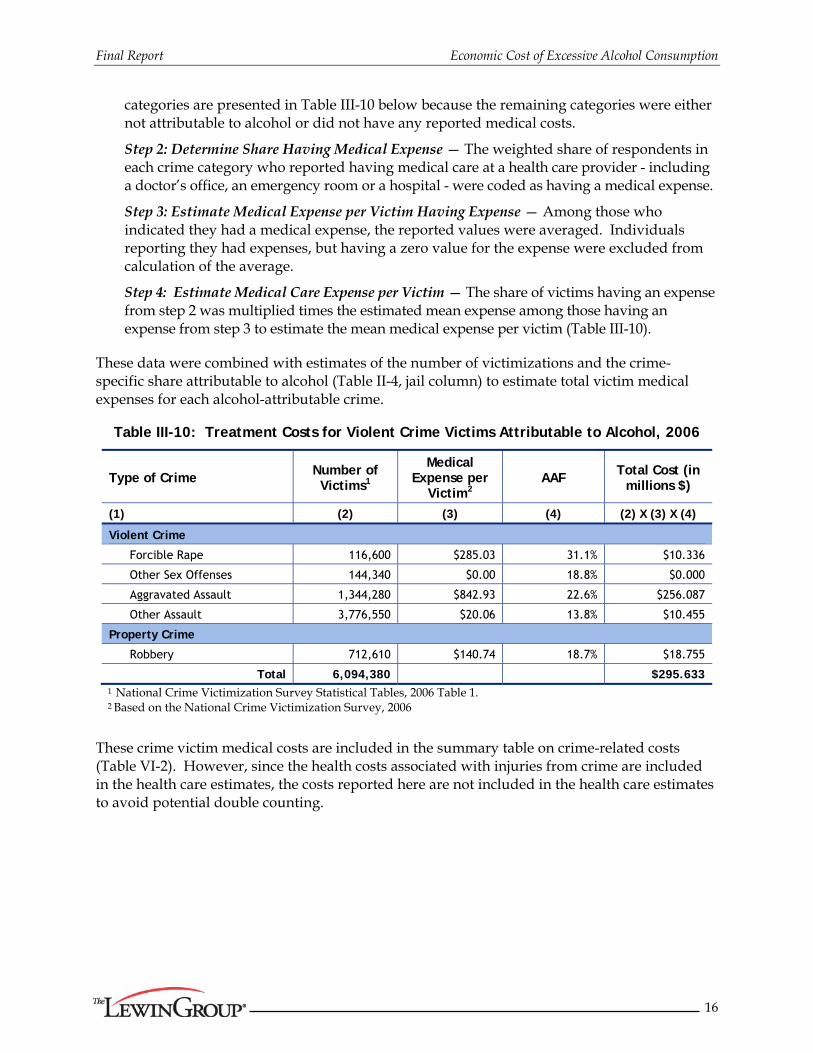
Step 2: Determine Share Having Medical Expense — The weighted share of respondents in each crime category who reported having medical care at a health care provider - including a doctor’s office, an emergency room or a hospital - were coded as having a medical expense.
Step 3: Estimate Medical Expense per Victim Having Expense — Among those who indicated they had a medical expense, the reported values were averaged. Individuals reporting they had expenses, but having a zero value for the expense were excluded from calculation of the average.
Step 4: Estimate Medical Care Expense per Victim — The share of victims having an expense from step 2 was multiplied times the estimated mean expense among those having an expense from step 3 to estimate the mean medical expense per victim (Table III-10).
These data were combined with estimates of the number of victimizations and the crime-specific share attributable to alcohol (Table II-4, jail column) to estimate total victim medical expenses for each alcohol-attributable crime.
Table III-10: Treatment Costs for Violent Crime Victims Attributable to Alcohol, 2006
Type of Crime Number of Victims1
Medical Expense per
Victim2 AAF
Total Cost (in millions $)
(1) (2) (3) (4) (2) X (3) X (4)
Violent Crime
Forcible Rape 116,600 $285.03 31.1% $10.336
Other Sex Offenses 144,340 $0.00 18.8% $0.000
Aggravated Assault 1,344,280 $842.93 22.6% $256.087
Other Assault 3,776,550 $20.06 13.8% $10.455
Property Crime
Robbery 712,610 $140.74 18.7% $18.755
Total 6,094,380 $295.633 1 National Crime Victimization Survey Statistical Tables, 2006 Table 1. 2 Based on the National Crime Victimization Survey, 2006
These crime victim medical costs are included in the summary table on crime-related costs (Table VI-2). However, since the health costs associated with injuries from crime are included in the health care estimates, the costs reported here are not included in the health care estimates to avoid potential double counting.
Final Report Economic Cost of Excessive Alcohol Consumption
17
E. Treatment Costs for Fetal Alcohol Syndrome
Despite warnings from the U.S. Surgeon General in 2005 that no amount of alcohol is safe during pregnancy, data from the 2006 and 2007 National Survey on Drug Use and Health (NSDUH) indicate that among pregnant women aged 15 to 44, an estimated 11.6 percent reported current alcohol use, 3.7 percent reported binge drinking, and 0.7 percent reported heavy drinking (9). About 4,000 infants per year are adversely affected by fetal alcohol syndrome (FAS) and other alcohol-related birth defects, termed fetal alcohol spectrum disorders (FASD).
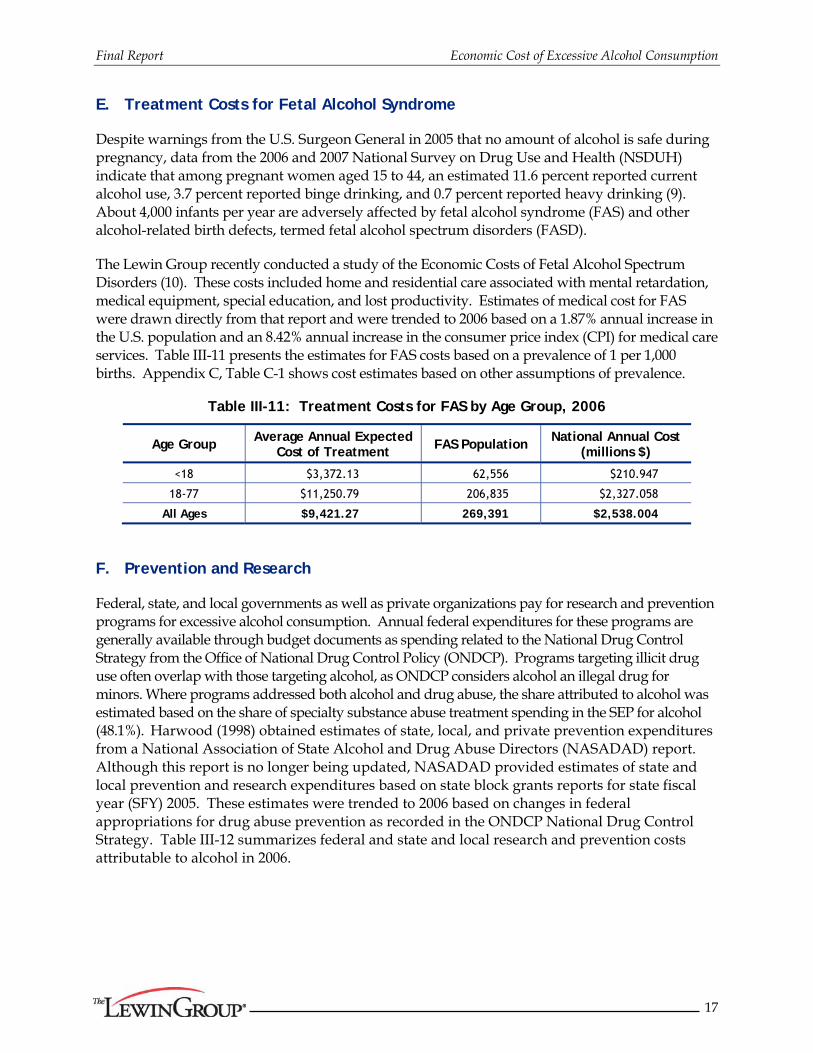
The Lewin Group recently conducted a study of the Economic Costs of Fetal Alcohol Spectrum Disorders (10). These costs included home and residential care associated with mental retardation, medical equipment, special education, and lost productivity. Estimates of medical cost for FAS were drawn directly from that report and were trended to 2006 based on a 1.87% annual increase in the U.S. population and an 8.42% annual increase in the consumer price index (CPI) for medical care services. Table III-11 presents the estimates for FAS costs based on a prevalence of 1 per 1,000 births. Appendix C, Table C-1 shows cost estimates based on other assumptions of prevalence.
Table III-11: Treatment Costs for FAS by Age Group, 2006
Age Group Average Annual Expected
Cost of Treatment FAS Population National Annual Cost
(millions $)
<18 $3,372.13 62,556 $210.947
18-77 $11,250.79 206,835 $2,327.058
All Ages $9,421.27 269,391 $2,538.004
F. Prevention and Research
Federal, state, and local governments as well as private organizations pay for research and prevention programs for excessive alcohol consumption. Annual federal expenditures for these programs are generally available through budget documents as spending related to the National Drug Control Strategy from the Office of National Drug Control Policy (ONDCP). Programs targeting illicit drug use often overlap with those targeting alcohol, as ONDCP considers alcohol an illegal drug for minors. Where programs addressed both alcohol and drug abuse, the share attributed to alcohol was estimated based on the share of specialty substance abuse treatment spending in the SEP for alcohol (48.1%). Harwood (1998) obtained estimates of state, local, and private prevention expenditures from a National Association of State Alcohol and Drug Abuse Directors (NASADAD) report. Although this report is no longer being updated, NASADAD provided estimates of state and local prevention and research expenditures based on state block grants reports for state fiscal year (SFY) 2005. These estimates were trended to 2006 based on changes in federal appropriations for drug abuse prevention as recorded in the ONDCP National Drug Control Strategy. Table III-12 summarizes federal and state and local research and prevention costs attributable to alcohol in 2006.

Final Report Economic Cost of Excessive Alcohol Consumption
18
Table III-12: Prevention and Research Costs, 2006 (in millions of $)
Source of Expenditures Overall
Spending
Share Attributable to Alcohol1
Alcohol-attributable Expenditures (in millions $)
Federal Research and Prevention
Substance Abuse Block Grant Prevention Set-Aside2 $351.485 0.481 $169.064
Projects of Regional and National Significance Prevention2 $192.767 0.481 $92.721
Safe and Drug-Free Schools and Communities3 $489.807 0.481 $235.597
DoD Prevention and Research4 $193.744 0.481 $93.191
National Institute on Alcohol Abuse and Alcoholism5 $432.000 1.000 $432.000
ONDCP Drug-Free Communities6 $79.200 0.481 $38.095
ONDCP National Youth Anti-Drug Media Campaign6 $99.000 0.481 $47.619
Enforcing Underage Drinking Laws7 $24.681 1.000 $24.681
NHTSA Public Information and Outreach on Drunk Driving8 $0.200 1.000 $0.200
CDC Fetal Alcohol Syndrome9 $9.856 1.000 $9.856
State and Local Research and Prevention10 $133.255 0.481 $64.096
Total $2,005.995 $1,207.120 1 If no other information is available, substance abuse spending related to both alcohol and illicit drugs is allocated to
alcohol based on the share of SEP substance abuse treatment spending related to alcohol ($11,351/$23,572 = 48.1%). 2 ONDCP National Drug Control Strategy Budget. http://www.ncjrs.gov/pdffiles1/ondcp/216432.pdf (page 43).
Accessed on April 5, 2010. 20% of Substance Abuse Block Grant Spending is allocated to Prevention. Includes only Federal Spending.
3 ONDCP National Drug Control Strategy Budget . http://www.ncjrs.gov/pdffiles1/ondcp/216432.pdf (page 25) . Accessed on April 5, 2010.
4 ONDCP National Drug Control Strategy Budget . http://www.ncjrs.gov/pdffiles1/ondcp/216432.pdf (page 17) . Accessed on April 5, 2010
5 The Budget for Fiscal Year 2008 at http://www.gpoaccess.gov/usbudget/fy08/pdf/appendix/hhs.pdf (page 408) . Accessed on March 10, 2010. Used to obtain actual 2006 expenditures for NIAAA.
6 ONDCP National Drug Control Strategy Budget . http://www.ncjrs.gov/pdffiles1/ondcp/216432.pdf (page 107) . Accessed on April 5, 2010.
7 ONDCP National Drug Control Strategy Budget . http://www.ncjrs.gov/pdffiles1/ondcp/216432.pdf (page 91) . Accessed on April 5, 2010.
8 ONDCP National Drug Control Strategy Budget . http://www.ncjrs.gov/pdffiles1/ondcp/216432.pdf (page 138) . Accessed on April 5, 2010.
9 CDC FY06 FAS budget CAN 69211892. 10 Includes state and local government funding derived by NASADAD based and State Block Grant applications for
SFY 2005 trended to 2006.
G. Health Insurance Administration
The cost of health insurance administration for medical care attributable to alcohol was estimated as a percentage of health treatment costs attributable to alcohol. Since administration costs vary substantially by payment source, where possible health care costs were estimated by primary source of payment. Source of payment information was also necessary for assessing burden of costs. Where such information was unavailable, the NHEA distribution of source of payment for the given type of care or an average across all payers was applied.
Final Report Economic Cost of Excessive Alcohol Consumption
19
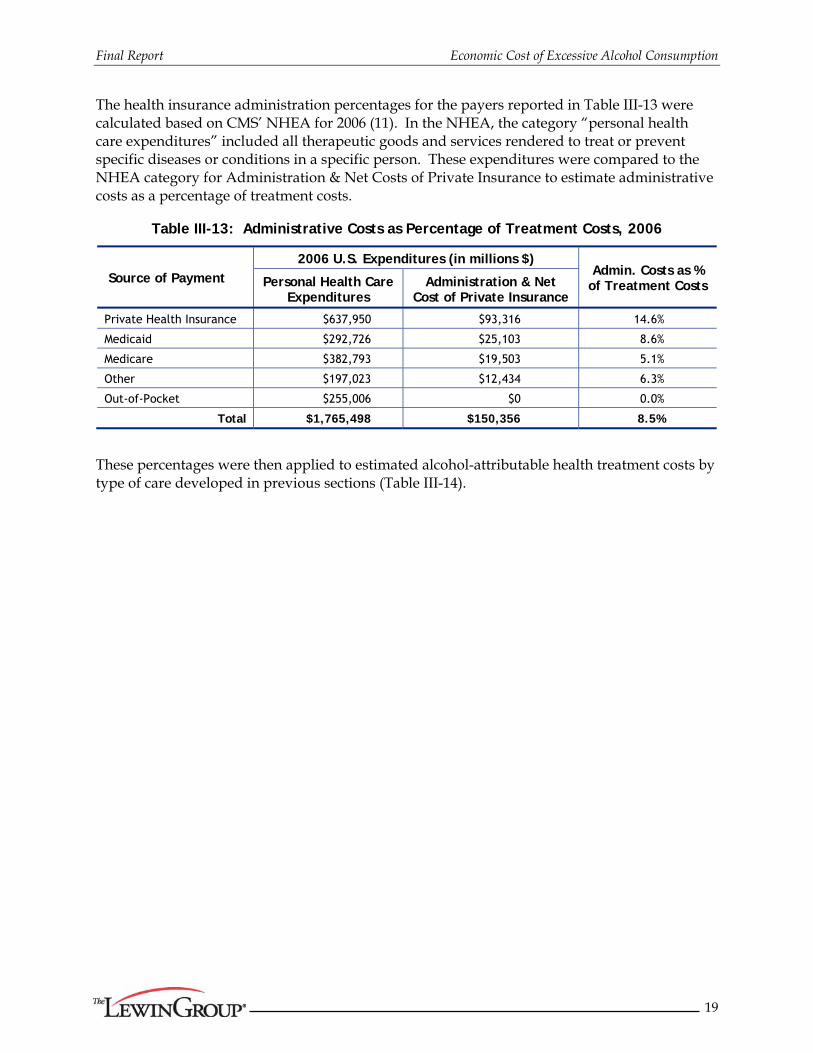
The health insurance administration percentages for the payers reported in Table III-13 were calculated based on CMS’ NHEA for 2006 (11). In the NHEA, the category “personal health care expenditures” included all therapeutic goods and services rendered to treat or prevent specific diseases or conditions in a specific person. These expenditures were compared to the NHEA category for Administration & Net Costs of Private Insurance to estimate administrative costs as a percentage of treatment costs.
Table III-13: Administrative Costs as Percentage of Treatment Costs, 2006
Source of Payment 2006 U.S. Expenditures (in millions $)
Admin. Costs as % of Treatment Costs Personal Health Care
Expenditures Administration & Net
Cost of Private Insurance
Private Health Insurance $637,950 $93,316 14.6%
Medicaid $292,726 $25,103 8.6%
Medicare $382,793 $19,503 5.1%
Other $197,023 $12,434 6.3%
Out-of-Pocket $255,006 $0 0.0%
Total $1,765,498 $150,356 8.5%
These percentages were then applied to estimated alcohol-attributable health treatment costs by type of care developed in previous sections (Table III-14).

Final Report Economic Cost of Excessive Alcohol Consumption
20
Table III-14: Health Insurance Administration Costs for Treatment of Alcohol-attributable Conditions, 2006
(in millions $)
Category of Treatment Cost
Private Health
Insurance Medicaid Medicare Other
Out-of-Pocket
Payer Dist.
Unknown Total
Alcohol-attributable Medical Expenditures
Private Hospital $1,776.349 $711.320 $1,453.269 $339.604 $567.521 NA $4,848.064
Federal Hospital NA NA NA $267.504 NA NA $267.504
Ambulatory Care Services
$451.620 $209.834 $201.246 $131.554 $201.692 NA $1,195.945
Nursing Home $74.111 $432.693 $168.639 $65.631 $261.814 NA $1,002.888
Retail Pharmacy $375.352 $76.920 $154.112 $57.030 $182.251 NA $845.664
Non-Durable Medical Equipment $0.000 $0.000 $8.966 $0.000 $128.868 NA $137.834
Other Professional Services
$83.641 $14.263 $48.681 $23.888 $58.450 NA $228.922
Fetal Alcohol Syndrome NA NA NA NA NA $2,538.004 $2,538.004
Total $2,761.073 $1,445.029 $2,034.913 $885.211 $1,400.595 $2,538.004 $11,064.826
Alcohol-attributable Health Insurance Administration Expenditures
Insurance Percentage
14.6% 8.6% 5.1% 6.3% 0.0% 8.5% 8.2%
Estimated Insurance Administration
$403.875 $123.920 $103.677 $55.865 $0.000 $216.145 $903.483
Administration costs developed as part of the SEP estimates ($682 million)(Table III-2) were added to the above Table III-14 total ($903 million) to obtain the final estimate of $1,586 million for insurance administration costs.
H. Training
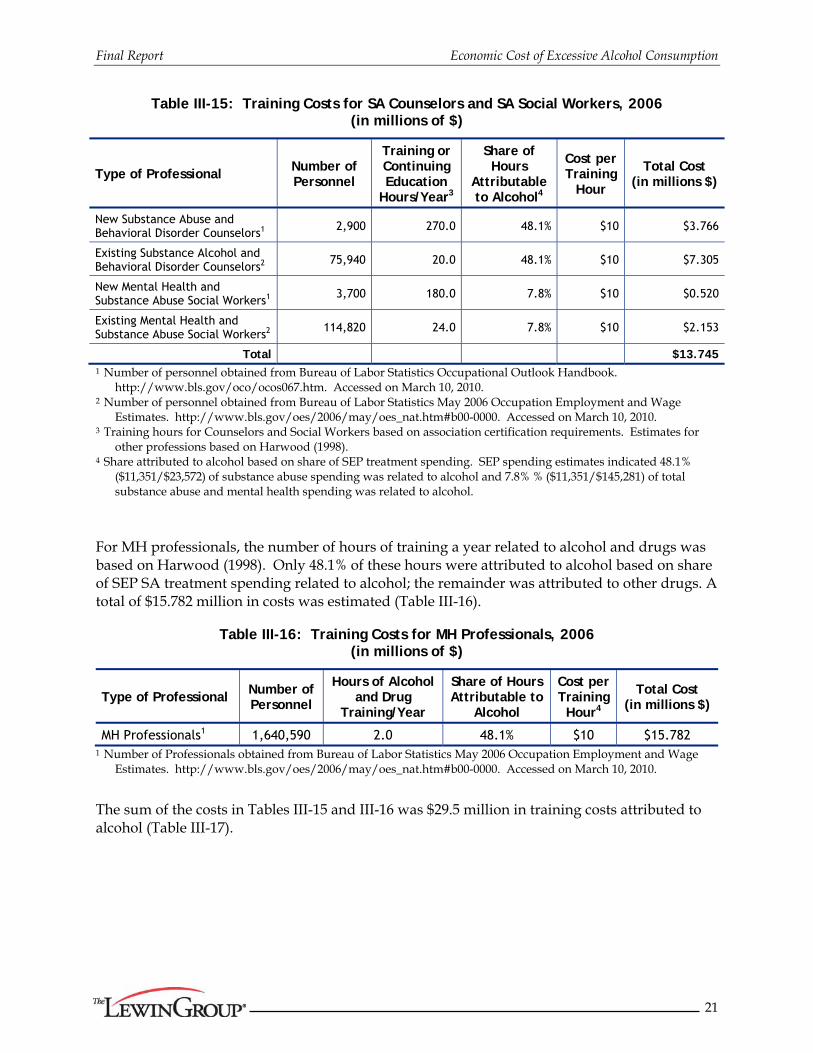
Estimates of training costs in Harwood (1998) were based on a study of SA training needs (12). Since that research has not been updated, we obtained estimates of the number of new and existing SA counselors and MH and SA social workers from the Bureau of Labor Statistics. Hours of training for new and existing professionals were based on hours required by the National Association of Addiction Professionals and the National Association of Social Workers. Assuming that the majority of continuing education was provided at conferences, Harwood (1998) estimated training costs at $16.67 per hour based on the cost of attending the National Association of Alcoholism and Drug Counselors conferences in 1992. By 2006, continuing education courses were widely available on-line for as little as $8 an hour. Due to the growing use of on-line continuing education, we assumed a cost of $10 per training hour. The alcohol-related training cost of SA counselors and social workers was estimated at $13.745 million (Table III-15).
Final Report Economic Cost of Excessive Alcohol Consumption
21
Table III-15: Training Costs for SA Counselors and SA Social Workers, 2006 (in millions of $)
Type of Professional Number of Personnel
Training or Continuing Education
Hours/Year3
Share of Hours
Attributable to Alcohol4
Cost per Training
Hour
Total Cost (in millions $)
New Substance Abuse and Behavioral Disorder Counselors1 2,900 270.0 48.1% $10 $3.766
Existing Substance Alcohol and Behavioral Disorder Counselors2 75,940 20.0 48.1% $10 $7.305
New Mental Health and Substance Abuse Social Workers1 3,700 180.0 7.8% $10 $0.520
Existing Mental Health and Substance Abuse Social Workers2 114,820 24.0 7.8% $10 $2.153
Total $13.745 1 Number of personnel obtained from Bureau of Labor Statistics Occupational Outlook Handbook.
http://www.bls.gov/oco/ocos067.htm. Accessed on March 10, 2010. 2 Number of personnel obtained from Bureau of Labor Statistics May 2006 Occupation Employment and Wage
Estimates. http://www.bls.gov/oes/2006/may/oes_nat.htm#b00-0000. Accessed on March 10, 2010. 3 Training hours for Counselors and Social Workers based on association certification requirements. Estimates for
other professions based on Harwood (1998). 4 Share attributed to alcohol based on share of SEP treatment spending. SEP spending estimates indicated 48.1%
($11,351/$23,572) of substance abuse spending was related to alcohol and 7.8% % ($11,351/$145,281) of total substance abuse and mental health spending was related to alcohol.
For MH professionals, the number of hours of training a year related to alcohol and drugs was based on Harwood (1998). Only 48.1% of these hours were attributed to alcohol based on share of SEP SA treatment spending related to alcohol; the remainder was attributed to other drugs. A total of $15.782 million in costs was estimated (Table III-16).
Table III-16: Training Costs for MH Professionals, 2006 (in millions of $)
Type of Professional Number of Personnel
Hours of Alcohol and Drug
Training/Year
Share of Hours Attributable to
Alcohol
Cost per Training
Hour4
Total Cost (in millions $)
MH Professionals1 1,640,590 2.0 48.1% $10 $15.782 1 Number of Professionals obtained from Bureau of Labor Statistics May 2006 Occupation Employment and Wage
Estimates. http://www.bls.gov/oes/2006/may/oes_nat.htm#b00-0000. Accessed on March 10, 2010.
The sum of the costs in Tables III-15 and III-16 was $29.5 million in training costs attributed to alcohol (Table III-17).

Final Report Economic Cost of Excessive Alcohol Consumption
22
Table III-17: Total Training Costs Attributed to Alcohol, 2006 (in millions of $)
Type of Professional Total Cost
(in millions $)
New Substance Abuse and Behavioral Disorder Counselors $3.766
Existing Substance Alcohol and Behavioral Disorder Counselors $7.305
New Mental Health and Substance Abuse Social Workers $0.520
Existing Mental Health and Substance Abuse Social Workers $2.153
Mental Health Professionals $15.782
Total $29.527
I. Treatment Costs for Cholelithiasis (Gallstones)
Although the health impact of excessive drinking is overwhelmingly negative, the literature suggests that there is a small reduction in cholelithiasis attributable to excessive alcohol consumption. Table III-18 summarizes this benefit.
Table III-18: Alcohol-attributable Treatment Costs Averted for Cholelithiasis by Type of Care, 2006
Type of Cost Total Cost (in millions $)
Inpatient Hospital Care -$36.076
Ambulatory Care -$1.703
Retail Pharmacy -$1.812
Non-Durable Medical Equipment -$0.295
Other Professional Services -$0.491
Total -$40.377
Estimates from HCUP indicated there were 341,723 hospital discharges related to cholelithiasis in 2006. We estimated 3,022 discharges were avoided due to excessive alcohol consumption. There were 1,037,183 ambulatory visits related to cholelithiasis in 2006. We estimated 9,388 ambulatory visits related to cholelithiasis were avoided. These 9,388 visits represented 0.00084% of all ambulatory care visits nationally. Retail pharmacy, non-durable medical equipment costs and other professional service costs were estimated by assuming this 0.00084% share of the NHEA for each category was saved as a result of excessive alcohol consumption. IV. Productivity Losses
When sickness, disability, death, or incarceration prevents an individual from their normal expected productive activities this represents a loss of potential productivity—work that would have been done, but was not because of the excessive alcohol consumption. Under the “human capital” methodology recommended by the PHS Guidelines, lost productive time is to be valued at the market equivalent to replace the effort. This means the lost productive time should be valued at the expected salary plus the value of fringe benefits plus employer payroll

Final Report Economic Cost of Excessive Alcohol Consumption
23
taxes. Productive activities include both work for hire (or self employment) and the value of effort in keeping the household.
The impact of excessive alcohol consumption on productivity is multifaceted and includes lost productivity from short term morbidity, longer term disability, impaired productivity, mortality, and crime-related losses (lost work days among crime victims and lost productivity of persons that are incarcerated because of conviction for crimes that were attributable to excessive alcohol consumption).
A. Summary
A total of $161.3 billion in productivity losses were attributed to alcohol in 2006 (Table IV-1). Impaired productivity accounted for 51.9% of all productivity losses while mortality accounted for 40.3%.
Table IV-1 Total Productivity Losses, 2006
(in millions of $)
Cost Category Total Cost
Impaired Productivity $83,695.036
Traditional Earnings $74,101.827
Household Productivity $5,355.629
Absenteeism $4,237.580
Institutionalization/Hospitalization $2,053.308
Mortality $65,062.211
Incarcerations $6,328.915
Victims of Crime $2,092.886
Fetal Alcohol Syndrome $2,053.748
Total, Productivity Losses $161,286.103
B. Impaired Productivity
Excessive alcohol consumption can interfere with an individual's ability to gain employment and with their productivity on the job and at home. Alcohol can interfere with an individual’s ability to work (physical and/or mental impairment); ability to find a job (lack of skills, experience, or reliability); and, potentially, willingness or motivation to find a job. Thus, wages or salaries among workers with excessive alcohol consumption may be lower than among similar workers without such problems.
We divide our estimate of impaired productivity losses into three components. These are: a traditional earnings model, household productivity losses, and a model of absenteeism. The first two of these components only identify losses among individuals who have a lifetime history of alcohol dependence. The third component of the productivity loss estimate identifies losses associated with individuals who binge drink, but who have no lifetime history of alcohol dependence.

Final Report Economic Cost of Excessive Alcohol Consumption
24
As was done by Harwood (1998), we estimate a traditional earnings model providing estimates of labor force productivity losses among individuals with a lifetime history of alcohol dependence. Because the data used for the earnings models does not address household productivity, estimates of household productivity losses among individuals with lifetime history of dependence are estimated as a separate component. The final component of the loss estimate, losses related to absenteeism, is estimated separately from the earnings model, because while the literature suggests (13) that individuals who binge drink, but who have no lifetime history of dependence, have increased absenteeism, the traditional earnings model has failed to identify a productivity loss for these individuals. Estimating the impact of excessive alcohol consumption on earnings is impeded because of the “income effect” of higher wages. That is, individuals with higher income tend to consume more goods (like alcohol) and services. Thus, simple models of the relationship between income and alcohol consumption tend to show alcohol consumption goes up with increasing household income. Our estimate of productivity losses associated increased absenteeism among binge drinkers, avoids this issue by directly identifying the increased absenteeism.
1. Traditional Earnings Model
The traditional human capital approach models an individual’s productivity as a function of human capital characteristics such as experience, education, and health status. As was done by Harwood (1998), we only estimated productivity losses related to lifetime alcohol dependence.
a. Data Sources
Estimates in this section are developed based on the National Epidemiologic Survey on Alcohol and Related Conditions (NESARC). NESARC was designed to determine the magnitude of alcohol use disorders and their associated disabilities. The NESARC is a representative sample of the non-institutionalized U.S. population 18 years of age and older. Our analysis used wave I fielded in 2001-2002 which obtained responses from 43,093 individuals.
Several alternative data sources were assessed for use in evaluating productivity losses related excessive alcohol consumption including the National Survey or Drug Use and Health (NSDUH) and the National Comorbidity Survey – Replication (NCS-R). While data for a more recent period is available from the NSDUH survey, this survey was not used because it does not include a measure of lifetime dependence on alcohol. The NESARC survey was preferred to the NCS-R because NESARC has a substantially larger sample size allowing for more precise estimation. NESARC also includes individuals 55-64 while individuals in this are range are excluded from the NCS-R.
b. Methods
To estimate productivity losses related to excessive alcohol consumption, Harwood (1998) used a microsimulation approach developed for and employed in many analyses of the RAND Health Insurance Experiment (Newhouse and the Health Insurance Group 1993; Manning et al. 1987; Duan, 1983(14, 15)). In contrast to the approach taken by Harwood, recent research suggests that it is important to initially test the performance of alternative specifications before selecting the appropriate specification for estimating productivity losses related to excessive alcohol consumption.

Final Report Economic Cost of Excessive Alcohol Consumption
25
The microsimulation approach taken by Harwood (1998) partitioned observations into those with and without alcohol dependence. Then, for each population subgroup earnings were estimated through a two-part model. The first part of the model estimated the probability of labor force participation and the second part estimated logged earnings conditional on labor force participation through ordinary least squares regression (OLS). Earnings were estimated in logged form because of their skewed distribution. Then, the estimates of logged dollars were transformed into dollars. Smearing techniques developed by Duan (1983) were used to adjust for retransformation bias that results from use of the log-linear model.
Manning and Mullahy (2001) (16) suggest alternative approaches to estimation may be preferable. They focus on the second-part of the two-part model and assert that use of generalized linear models (GLM) may be preferable to use of OLS depending on the data distribution. The GLM models they suggest do not require retransformation from the log scale as they estimate dollars directly. Thus, these models may be easier for researchers to implement than OLS. The OLS method can also be biased if the transformations employed are misspecified and do not appropriately address the heteroscedasticity of the data. GLM models are not always preferable to OLS, however. Homoscedastic OLS models are more precise than GLM models if their assumptions hold. Manning and Mullahy (2001) assert that “GLM models can yield very imprecise estimates if the log-scale error is heavily-tailed.
Based on this research by Manning and Mullahy, we updated the methods used by Harwood. Since we are interested in explicitly measuring the reductions in labor force participation separate from reductions in earnings, we only considered two-part models with the first part of the model estimating the probability of labor force participation and the second part estimating earnings conditional on labor force participation. In each part of the model, labor force participation and earnings were estimated as a function of age (a proxy for experience), race, educational attainment (educ), number of children under 18 (children), lifetime severe mental disorder (mental), lifetime alcohol disorder (alc), and lifetime drug disorder (drug) and gender.
),,,,,,,( genderdrugalcmentalchildreneducraceAgefEarnings
Because the labor market literature suggested that these various characteristics may have a different impact on men and women, models were estimated for men and women separately. Models that include controls for marital status tend to understate the impact of alcohol on labor force participation because of excessive alcohol consumption’s impact on reducing the likelihood of marriage or increasing the likelihood of divorce. Thus, our baseline model did not control for marital status. However, we tested the impact of controlling for marital status and provide model estimates controlling for marital status in Appendix D-1.
The functional form of the first part of the model for each specification considered was the same: a logit model of labor force participation. Then, we considered three alternative forms for our earnings model: 1) OLS regression for logged earnings with error retransformation, 2) GLM model with log link function and constant variance, and 3) GLM model with log-link function and variance proportional to the mean.
Each of these models was run for men and women in our sample. Then, the accuracy of the models for men and women with and without a lifetime history of alcohol dependence was tested
Final Report Economic Cost of Excessive Alcohol Consumption
26
by comparing the actual and mean predicted earning for each decile of the sample. The second model had the best predictive capacity by decile. Thus, this model was chosen.
c. Study Variables
Below, we provide a brief description of the study variables:
Lifetime Alcohol Dependence, Drug Dependence and Mental Disorder - The NESARC questionnaire was designed around the DSM-IV clinical standards to allow potential diagnoses to be assigned respondents based on answers to specific sequences of questions concerning alcohol and drug use and symptoms and symptoms of mental disorders. These derived lifetime defined variables were used in this study.
Labor Force Participation - Respondents were considered in the labor force if they reported positive income and working full time or part-time, or being employed but not currently at work due to illness, injury, vacation, or other absence from work.
Income – Individuals are not asked to report labor force earnings in the NESARC. Respondents were asked to report their total personal income in the last 12 months in one of 17 categories. Income is used as a proxy for earnings. Use of income as a proxy for earnings will tend to induce a negative bias on our estimate of earnings losses related to alcohol consumption because income will include transfer payments from social programs or other sources that are more likely to be received by individuals with illnesses such as alcohol dependence. Individuals reporting no income were defined as not participating in the labor force, and thus, were excluded from the income model, (e.g., the second part of the two-part model). We created a continuous income measure based on the remaining 16 categories by coding at their mid-points for the continuous measure. The highest category ($100,000 or more) was coded as $125,000 in the continuous measure.
d. Results
Descriptive statistics for the variables included in the regression analysis are presented in Table IV-2. These statistics indicate that a much larger share of individuals with a history of alcohol dependence have a history of mental illness and drug dependence relative to those with no history of alcohol dependence. For example, 71.6% of women with a history of alcohol dependence also have a history of mental illness compared to only 36.2% of women with no history of alcohol dependence. A greater share of individuals reporting a history of alcohol dependence were between 20 and 44, and a smaller share were between 55 and 64, relative to their counterparts with no history of alcohol dependence. A smaller share of individuals with a history of alcohol dependence were married relative to those with no history of dependence. Finally, the estimates indicate a smaller share of individuals with a history of alcohol dependence are in the labor force and individuals in this group have lower average earnings when in the labor force, but these differences are small.
The results from the logit model for labor force participation and the earnings model are presented in Table IV-3.
Similar to Harwood’s 1992 study, alcohol dependence had no measured effect on workplace productivity for women. The parameter estimates for the impact of alcohol dependence on

Final Report Economic Cost of Excessive Alcohol Consumption
27
labor force participation and earnings given labor force participation for women were not significant. Thus, no productivity loss for women was estimated. In contrast, for males, there was a statistically significant reduction in both labor force participation and earnings given labor force participation.

Draft Report Economic Cost of Excessive Alcohol Consumption
28
Table IV-2: Comparison of Regression Variable Means For Those With and Without a History of Alcohol Dependence Individuals 18 to 64
Variable
Men Women
No History of Alcohol Dependence
History of Alcohol Dependence
No History of Alcohol Dependence
History of Alcohol Dependence
Mean / Percent
Standard Error
Mean / Percent
Standard Error
Mean / Percent
Standard Error
Mean / Percent
Standard Error
Lifetime History of Mental Illness (%) 21.987 0.368 50.530 0.949 36.246 0.361 71.584 1.082
Lifetime History of Drug Dependence (%) 1.107 0.093 14.965 0.677 1.007 0.075 15.468 0.867
Age Group (%)
18-19 5.172 0.197 5.028 0.415 4.272 0.152 4.299 0.487
20-24 10.021 0.267 13.391 0.647 10.484 0.230 15.508 0.868
25-34 21.622 0.366 25.107 0.823 21.250 0.307 28.413 1.082
35-44 25.062 0.385 26.137 0.834 25.208 0.326 26.261 1.056
45-54 22.726 0.373 20.659 0.769 22.883 0.315 19.614 0.952
55-64 15.397 0.321 9.679 0.561 15.904 0.275 5.905 0.565
Race (%)
Non-Hispanic White 67.237 0.417 77.495 0.793 67.091 0.353 79.071 0.976
Non-Hispanic Black 11.286 0.281 7.417 0.498 13.311 0.255 7.274 0.623
Hispanic 14.342 0.312 9.467 0.556 12.517 0.248 8.150 0.656
Other 7.135 0.229 5.621 0.437 7.081 0.193 5.505 0.547
Highest Educational Attainment (%)
Less than 12 years 14.399 0.312 13.290 0.645 12.736 0.250 9.531 0.704
High School graduate 27.955 0.399 29.289 0.864 28.734 0.340 25.608 1.047
Some college 29.508 0.406 35.024 0.906 32.646 0.352 39.345 1.172
College graduate 28.138 0.400 22.397 0.792 25.885 0.329 25.516 1.046
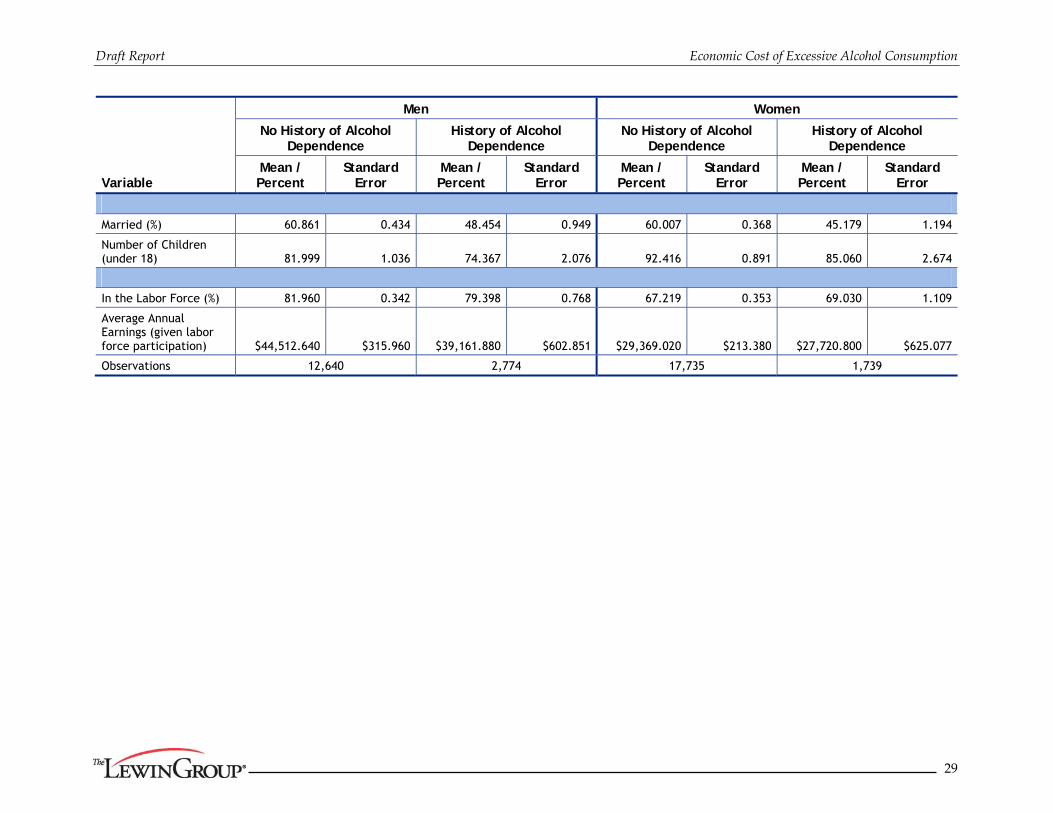
Draft Report Economic Cost of Excessive Alcohol Consumption
29
Variable
Men Women
No History of Alcohol Dependence
History of Alcohol Dependence
No History of Alcohol Dependence
History of Alcohol Dependence
Mean / Percent
Standard Error
Mean / Percent
Standard Error
Mean / Percent
Standard Error
Mean / Percent
Standard Error
Married (%) 60.861 0.434 48.454 0.949 60.007 0.368 45.179 1.194
Number of Children (under 18) 81.999 1.036 74.367 2.076 92.416 0.891 85.060 2.674
In the Labor Force (%) 81.960 0.342 79.398 0.768 67.219 0.353 69.030 1.109
Average Annual Earnings (given labor force participation) $44,512.640 $315.960 $39,161.880 $602.851 $29,369.020 $213.380 $27,720.800 $625.077
Observations 12,640 2,774 17,735 1,739
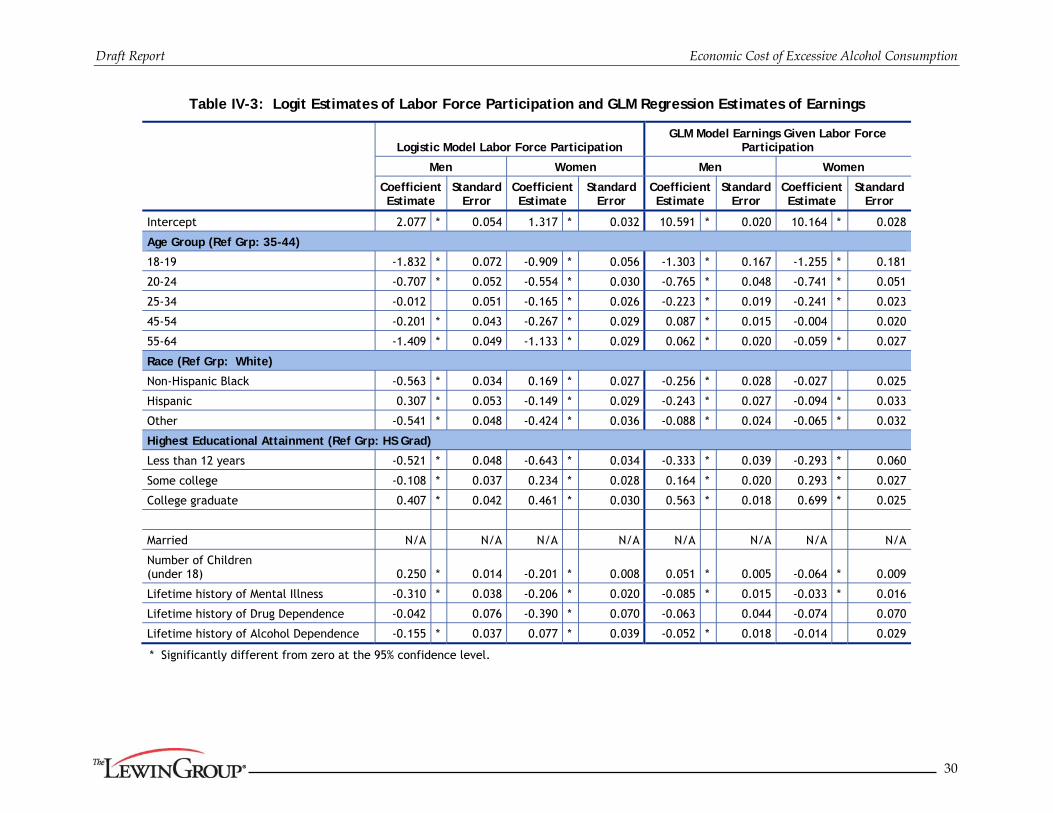
Draft Report Economic Cost of Excessive Alcohol Consumption
30
Table IV-3: Logit Estimates of Labor Force Participation and GLM Regression Estimates of Earnings
Logistic Model Labor Force Participation
GLM Model Earnings Given Labor Force Participation
Men Women Men Women
Coefficient Estimate
Standard Error
Coefficient Estimate
Standard Error
Coefficient Estimate
Standard Error
Coefficient Estimate
Standard Error
Intercept 2.077 * 0.054 1.317 * 0.032 10.591 * 0.020 10.164 * 0.028
Age Group (Ref Grp: 35-44)
18-19 -1.832 * 0.072 -0.909 * 0.056 -1.303 * 0.167 -1.255 * 0.181
20-24 -0.707 * 0.052 -0.554 * 0.030 -0.765 * 0.048 -0.741 * 0.051
25-34 -0.012 0.051 -0.165 * 0.026 -0.223 * 0.019 -0.241 * 0.023
45-54 -0.201 * 0.043 -0.267 * 0.029 0.087 * 0.015 -0.004 0.020
55-64 -1.409 * 0.049 -1.133 * 0.029 0.062 * 0.020 -0.059 * 0.027
Race (Ref Grp: White)
Non-Hispanic Black -0.563 * 0.034 0.169 * 0.027 -0.256 * 0.028 -0.027 0.025
Hispanic 0.307 * 0.053 -0.149 * 0.029 -0.243 * 0.027 -0.094 * 0.033
Other -0.541 * 0.048 -0.424 * 0.036 -0.088 * 0.024 -0.065 * 0.032
Highest Educational Attainment (Ref Grp: HS Grad)
Less than 12 years -0.521 * 0.048 -0.643 * 0.034 -0.333 * 0.039 -0.293 * 0.060
Some college -0.108 * 0.037 0.234 * 0.028 0.164 * 0.020 0.293 * 0.027
College graduate 0.407 * 0.042 0.461 * 0.030 0.563 * 0.018 0.699 * 0.025
Married N/A N/A N/A N/A N/A N/A N/A N/A
Number of Children (under 18) 0.250 * 0.014 -0.201 * 0.008 0.051 * 0.005 -0.064 * 0.009
Lifetime history of Mental Illness -0.310 * 0.038 -0.206 * 0.020 -0.085 * 0.015 -0.033 * 0.016
Lifetime history of Drug Dependence -0.042 0.076 -0.390 * 0.070 -0.063 0.044 -0.074 0.070
Lifetime history of Alcohol Dependence -0.155 * 0.037 0.077 * 0.039 -0.052 * 0.018 -0.014 0.029
* Significantly different from zero at the 95% confidence level.

Final Report Economic Cost of Excessive Alcohol Consumption
31
Averaging across all age groups the results imply a loss 2.5% reduction in labor force participation and a 5.0% reduction in earnings among those who continue working given the presence of alcohol dependence.
To estimate the earnings loss resulting from alcohol dependence, for each age group in the regression model, we estimated the predicted labor force participation rate and income given labor force participation for a male with the average characteristics of the age group with and without a lifetime history of alcohol dependence. Then, the proportion of individuals in each age group with a lifetime history of alcohol dependence in each of three groups was calculated: not in labor force as a result of factors other than alcohol dependence (i.e., share of individuals with no history of alcohol dependence who do not participate in the labor force), out of labor force due to alcohol dependence (i.e., the difference in the share working with and without alcohol dependence), and continuing to participate in labor force despite lifetime history of alcohol dependence (i.e., the share working with alcohol dependence). The first group has no predicted earnings loss. For the second group, we estimate an earnings loss equal to the predicted income of the average male in the age group without a lifetime history of alcohol dependence. For the final group, we estimate an earnings loss equal to the difference in predicted income between individuals with and without a history of alcohol dependence who participate in the labor force. Based on the share of individuals in the age group, in each of these three groups, a mean loss for each age group is calculated. The mean loss for the age group is increased by 42.9% to reflect the value of fringe benefits and 18.8% based on the CPI for all services to reflect inflation between 2001, the year of the NESARC survey, and 2006. The estimated loss for each age group is reported in column 4 of Table IV-4.
For each age group, the loss estimate was multiplied by the prevalence of alcohol disorders in that age group (estimated from the NESARC) and the Census Bureau estimate of the number of individuals in that age group. Then, losses were summed across the age groups (Table IV-4).
Table IV-4: Labor Force Earnings Losses for Men with a History of Alcohol Dependence, 2006
Demographic Group
US Population1 Prevalence of
Lifetime Alcohol Dependence2
Mean Estimated Loss per Alcohol
Dependent Individual3
Total Loss (in millions)
(1) (2) (3) (4) (2) X (3) X (4)
18-19 4,373,946 18.78% $989.86 $813.148
20-24 10,910,090 24.12% $2,061.01 $5,423.749
25-34 20,564,653 21.64% $3,655.87 $16,272.212
35-44 21,850,282 19.88% $4,680.08 $20,326.871
45-54 21,289,628 17.78% $5,395.26 $20,422.499
55-64 15,223,880 13.01% $5,475.22 $10,843.348
Total $74,101.827 1 The estimated size of the U.S. population by age/gender for 2006 is from the U.S. Census Bureau (18-19 age group
calculated as 2/5 of the 15-19 Census age group). 2 Prevalence of Lifetime alcohol dependence was estimated based on NESARC for consistency with the loss
estimates. 3 Loss per individuals includes losses related to reduction in labor force participation rate and reductions in earnings
among those continuing to participate in the labor force.

Final Report Economic Cost of Excessive Alcohol Consumption
32
2. Household Productivity Losses
Researchers have not directly estimated reductions in household (HH) productivity associated with excessive alcohol consumption because data are lacking, e.g., the NCS-R, NESARC and NSDUH do not ask about hours and level of effort in HH chores. Thus, there are no data sources available for directly estimating reductions in HH productivity associated with excessive alcohol consumption. Nevertheless, inclusion of HH productivity costs in cost of illness studies is generally accepted. Thus, we assumed that impairment from excessive alcohol consumption observed in labor market income would be similarly observed in the HH. Thus, based on the losses estimated in the second part of the traditional earnings models presented in Table IV-3, we assumed a 5.0% reduction in household productivity based on the estimated reduction in labor market productivity. A 2.5% shift from being employed to not being employed is also assumed based on the traditional earnings model results. No loss was estimated for women.
The Bureau of Labor Statistics, American Time Use Survey 2006, was used to estimate the average number of hours spent on HH chores by age/gender categories and whether the individual was employed. We followed generally accepted guidelines in valuing lost time in HH activities at the wage rate it costs to hire a person to perform these duties in the labor market. Thus, the value of HH labor hours was based on the mean hourly wage of HH workers in 2006 adjusted for fringe benefits as estimated by the Bureau of Labor Statistics (Table IV-5).
Table IV-5: Mean Annual Dollar Value of HH Productivity for Men by Age and Employment Status, 2006
Age Group
Average Number of Hours per Day on HH Labor1
Mean Annual Dollar Value of HH Productivity2
Employed in the Labor
Force
Not Employed in the Labor
Force
Employed in the Labor
Force
Not Employed in the Labor
Force
18-19 years old 0.79 1.29 $3,660.10 $5,982.22
20-24 years old 0.89 1.17 $4,134.16 $5,422.64
25-34 years old 1.42 2.02 $6,594.31 $9,376.35
35-44 years old 1.71 3.14 $7,951.44 $14,544.12
45-54 years old 1.66 2.35 $7,715.28 $10,895.76
55-64 years old 1.48 2.64 $6,877.61 $12,263.03 1 Based on analysis of the American Time Use Survey, 2006. 2 Product of hours in HH labor and BLS estimate of mean hourly earnings for childcare and household workers in
2006 adjusted for the value of fringe benefits ($12.71).
Table IV-6 combines the changes in household productivity related to reduced productivity and decreased labor force participation to produce an overall estimated loss.

Final Report Economic Cost of Excessive Alcohol Consumption
33
Table IV-6: Estimated Household Productivity Losses for Men with a History of Alcohol Dependence, 2006
Age Group US Population1 Prevalence of
Lifetime Alcohol Dependence2
Mean Estimated Loss per Individual3
Total Loss (in millions)
(1) (2) (3) (4) (2) X (3) X (4)
18-19 4,373,946 18.78% $156.28 $128.380
20-24 10,910,090 24.12% $189.23 $497.985
25-34 20,564,653 21.64% $307.73 $1,369.703
35-44 21,850,282 19.88% $345.81 $1,501.937
45-54 21,289,628 17.78% $355.15 $1,344.352
55-64 15,223,880 13.01% $259.17 $513.272
Total $5,355.629 1 From the U.S. Census Bureau for 2006 (18-19 age group calculated as 2/5 of the 15-19 Census age group). 2 Prevalence estimated based on NESARC for consistency with the loss estimates 3 Estimated based on regression results.
3. Losses Related to Absenteeism
In this section, we describe the methods and results for estimating costs associated with increased absenteeism resulting from binge drinking.
a. Data Source and Methods
NSDUH Survey
The National Survey of Drug Use and Health for 2005 through 2007 was our data source. The NSDUH is an annual household survey of the U.S., civilian, non-institutionalized population aged 12 and above with ~67,500 individuals interviewed annually. NSDUH collected data on the prevalence of illicit drug and alcohol use, problems associated with alcohol and/or other drug use, and receipt of alcohol and/or other drug treatment, as well as demographic characteristics, general health status, mental health problems, health insurance status, and utilization of health services. The participation rate for the survey was 76% in 2005, 67% in 2006, and 74% in 2007. The NSDUH also imputes missing responses; we used data items including imputations.
Model Overview
Absenteeism (absent) was assessed as a function of age, race, educational attainment (Educ), marital status (married), has children under 18 (children), current year drug dependence (drug), having one of a list of medical conditions during the past 12 months (medcond), and measures of current year alcohol dependence and binge drinking within the last 30 days (alc).
),,,,,,,( alcmedconddrugchildrenmarriedEducraceAgefAbsent
A poisson regression model was used because the number of days missed from work was reported in integers and followed a Poisson distribution.
Final Report Economic Cost of Excessive Alcohol Consumption
34
Study Variables
Below, we describe the primary variables in this analysis:
Absenteeism — We added the number of days of work missed in the last 30 days as a result of illness or injury and the number of days of work missed in the last 30 days because the respondent did not feel like going to work to identify total days missed in the last 30 days. Individuals with missing response were not included in our analysis.
Current Alcohol or Drug Dependence — The questionnaire was designed around DSM-IV clinical standards to allow potential diagnoses to be assigned respondents based on answers to specific sequences of questions on alcohol and drug experiences and symptoms and symptoms of mental disorders. These derived variables indicating dependence within the past 12 months were used in this study.
Binge Drinking in the Last 30 Days — Binge drinking was defined as drinking five or more drinks on the same occasion on at least 1 day in the past 30 days for both sexes. An “occasion" refers to having the drinks at the same time or within a couple hours of each other. An indicator of such binge drinking was included on the NSDUH public use file and adopted for this study with one adjustment. Binge drinkers who met criteria for alcohol dependence were included in the alcohol dependent population. Data on the remaining non-dependent binge drinkers were analyzed separately from data on the alcohol dependent population – that is, the indicator variables for the non-dependent binge drinkers and the alcohol dependent population included in the model were mutually exclusive.
Medical Condition in the Past 12 Months — The file includes indicators of whether a physician told the respondent they had one of the following health conditions within the last 12 months: anxiety disorder, asthma, bronchitis, depression, diabetes, heart disease, hepatitis, high blood pressure, HIV/AIDS, lung cancer, pancreatitis, pneumonia, sinusitis, sleep apnea, stroke, tinnitus, tuberculosis, or an ulcer(s). If the respondent indicated any of these conditions, they were considered to have a condition within the year. The conditions were not included individually in the model. (About 95%of the sample had 0 or 1 condition. When we modeled with 0, 1 or >2 conditions, the coefficients were of similar magnitude.) The NSDUH also includes an indicator for liver cirrhosis but this was not included in this indicator because of the causal relationship between alcohol consumption and liver cirrhosis.
Results
The unadjusted analysis of differences in mean days absent by gender and drinking status (non-dependent binge drinker vs. alcohol dependent) are presented by alcohol consumption status in Table IV-7. The means indicate that on average those who were binge drinkers or who had current alcohol dependence tended to have higher absenteeism than those who were not dependent nor binge drinkers. These means, however, did not control for other differences in the characteristics of these three groups such as the age distribution.

Final Report Economic Cost of Excessive Alcohol Consumption
35
Table IV-7: Means for Regression Variables by Alcohol Consumption Category
Variable
Male Female
Neither Non-dependent Binge Drinker
Alcohol Dependent Neither Non-dependent Binge Drinker
Alcohol Dependent
Mean Standard
Error Mean
Standard Error
Mean Standard
Error Mean
Standard Error
Mean Standard
Error Mean
Standard Error
Days Absent from Work
Total Days Missed 0.535 0.016 0.668 0.026 1.331 0.129 0.703 0.022 0.802 0.028 1.205 0.132
Days Missed to Illness 0.376 0.014 0.430 0.018 0.923 0.119 0.558 0.019 0.601 0.027 0.785 0.111
Days Missed Other 0.159 0.009 0.238 0.014 0.407 0.031 0.145 0.008 0.201 0.012 0.419 0.056
Age Group1
18-19 1.9% 0.1% 2.3% 0.1% 3.4% 0.4% 1.6% 0.1% 2.8% 0.2% 4.0% 0.5%
20-25 7.6% 0.2% 15.6% 0.3% 21.4% 0.9% 8.6% 0.2% 21.0% 0.6% 28.9% 1.8%
26-29 7.4% 0.2% 13.1% 0.4% 13.6% 1.1% 8.0% 0.3% 13.8% 0.7% 13.5% 1.7%
30-34 10.9% 0.3% 13.7% 0.5% 14.0% 1.5% 10.6% 0.3% 12.5% 0.6% 10.3% 1.5%
35-49 41.5% 0.6% 38.9% 0.7% 36.6% 1.7% 40.8% 0.6% 37.0% 0.9% 34.0% 2.3%
50-64 30.8% 0.6% 16.4% 0.7% 11.1% 1.6% 30.4% 0.6% 13.0% 1.0% 9.2% 1.8%
Race (%)
Non-Hispanic White 66.6% 0.7% 71.0% 0.8% 68.3% 1.6% 65.4% 0.6% 73.5% 0.9% 75.1% 1.9%
Non-Hispanic Black 10.0% 0.4% 8.6% 0.4% 9.5% 1.1% 14.7% 0.4% 12.0% 0.7% 11.2% 1.4%
Hispanic 15.8% 0.5% 16.4% 0.6% 18.3% 1.3% 12.6% 0.4% 11.0% 0.5% 9.0% 1.1%
Other 7.6% 0.4% 4.0% 0.3% 3.8% 0.5% 7.3% 0.4% 3.5% 0.3% 4.8% 0.8%
Highest Educational Attainment (%)
Less than 12 years 10.1% 0.4% 11.7% 0.5% 14.3% 1.1% 6.2% 0.2% 7.5% 0.5% 7.6% 1.3%
High School graduate 28.5% 0.5% 33.2% 0.7% 34.9% 1.7% 28.4% 0.5% 31.7% 0.9% 29.5% 2.7%
Some college 23.4% 0.5% 26.1% 0.6% 26.5% 1.4% 28.8% 0.5% 31.3% 0.9% 31.4% 2.0%
College graduate 34.3% 0.7% 26.4% 0.6% 21.8% 1.8% 34.6% 0.6% 28.8% 0.8% 30.8% 2.8%
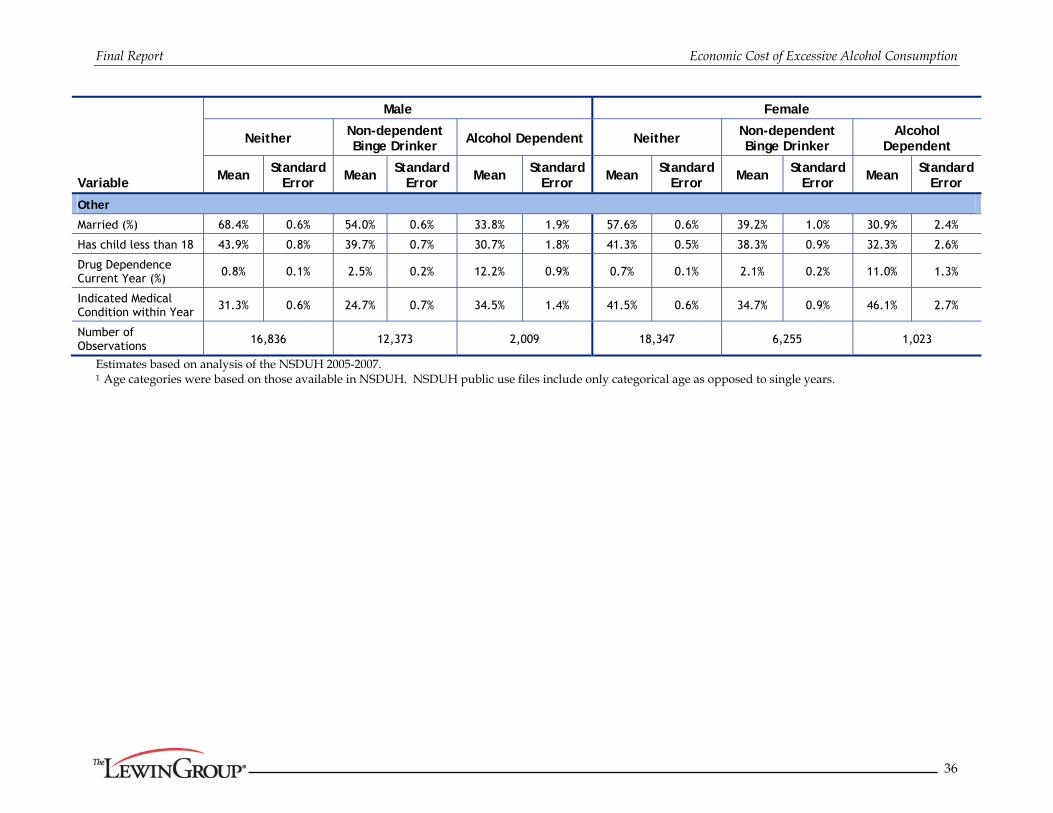
Final Report Economic Cost of Excessive Alcohol Consumption
36
Variable
Male Female
Neither Non-dependent Binge Drinker
Alcohol Dependent Neither Non-dependent Binge Drinker
Alcohol Dependent
Mean Standard Error
Mean Standard Error
Mean Standard Error
Mean Standard Error
Mean Standard Error
Mean Standard Error
Other
Married (%) 68.4% 0.6% 54.0% 0.6% 33.8% 1.9% 57.6% 0.6% 39.2% 1.0% 30.9% 2.4%
Has child less than 18 43.9% 0.8% 39.7% 0.7% 30.7% 1.8% 41.3% 0.5% 38.3% 0.9% 32.3% 2.6%
Drug Dependence Current Year (%)
0.8% 0.1% 2.5% 0.2% 12.2% 0.9% 0.7% 0.1% 2.1% 0.2% 11.0% 1.3%
Indicated Medical Condition within Year 31.3% 0.6% 24.7% 0.7% 34.5% 1.4% 41.5% 0.6% 34.7% 0.9% 46.1% 2.7%
Number of Observations 16,836 12,373 2,009 18,347 6,255 1,023
Estimates based on analysis of the NSDUH 2005-2007. 1 Age categories were based on those available in NSDUH. NSDUH public use files include only categorical age as opposed to single years.

Final Report Economic Cost of Excessive Alcohol Consumption
37
Multivariate regression results indicated a positive and significant increase in absenteeism for both men and women related to both binge drinking and alcohol dependence (Table IV-8). The increase was larger for those with current alcohol dependence.
Table IV-8: Absenteeism Regression Results
Variable
Male Female Coefficient Estimate
Standard Error
Coefficient Estimate
Standard Error
Intercept -0.4476 ** 0.0007 -0.5833 ** 0.0008 Alcohol Consumption Binge Drinker 0.1034 ** 0.0005 0.0631 ** 0.0006 Alcohol Dependence - Current Year 0.6067
** 0.0008 0.3487
** 0.0013
Age Group (Ref Group: 35-49) 18-19 0.3184 ** 0.0013 0.3975 ** 0.0015 20-25 0.2452 ** 0.0007 0.2835 ** 0.0008 26-29 0.3384 ** 0.0007 0.1631 ** 0.0009 30-34 0.1143 ** 0.0007 0.1908 ** 0.0008 50-64 -0.2188 ** 0.0007 -0.2447 ** 0.0007 Race (Ref Group: White) Non-Hispanic Black 0.2848 ** 0.0007 0.4041 ** 0.0006 Hispanic -0.1004 ** 0.0007 0.1403 ** 0.0008 Other 0.1905 ** 0.0009 0.1936 ** 0.0010 Highest Educational Attainment (Ref Group: HS Grad) Less than 12 years 0.0257 ** 0.0007 0.3370 ** 0.0009 Some college -0.1646 ** 0.0006 -0.0194 ** 0.0006 College graduate -0.3458 ** 0.0006 -0.2360 ** 0.0007 Other Married -0.3153 ** 0.0006 -0.0277 ** 0.0005 Has child less than 18 -0.0061 ** 0.0006 -0.0643 ** 0.0006 Drug Dependence Current Year 0.3888 ** 0.0011 0.3192 ** 0.0016 Indicated Medical Condition within Year 0.3322
** 0.0005 0.4580
** 0.0005
Number of Observations 31,218 25,625 Estimates based on analysis of the NSDUH 2005-2007. ** Statistically significant at the 99% confidence level.
In Tables IV-9A and IV-9B, we translate these increases in absenteeism per month into annual productivity losses related to binge drinking and current alcohol dependence respectively. Losses for increased absenteeism associated with binge drinking were added into our total estimate of productivity losses related to excessive alcohol consumption. Losses for increased absenteeism associated with current alcohol dependence were not added into this total because these losses were likely to overlap, at least partially, with reductions in earnings among individuals with alcohol dependence estimated in Section IV-B.2.
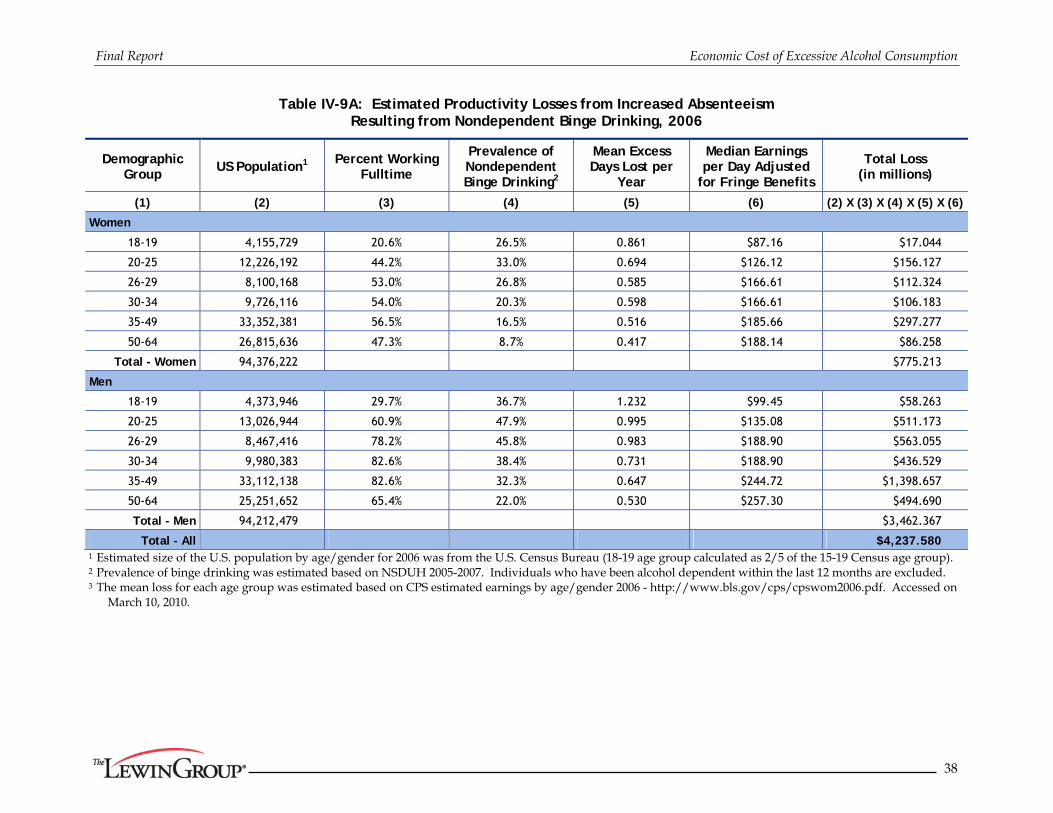
Final Report Economic Cost of Excessive Alcohol Consumption
38
Table IV-9A: Estimated Productivity Losses from Increased Absenteeism Resulting from Nondependent Binge Drinking, 2006
Demographic Group
US Population1 Percent Working Fulltime
Prevalence of Nondependent Binge Drinking2
Mean Excess Days Lost per
Year
Median Earnings per Day Adjusted
for Fringe Benefits
Total Loss (in millions)
(1) (2) (3) (4) (5) (6) (2) X (3) X (4) X (5) X (6)
Women
18-19 4,155,729 20.6% 26.5% 0.861 $87.16 $17.044
20-25 12,226,192 44.2% 33.0% 0.694 $126.12 $156.127
26-29 8,100,168 53.0% 26.8% 0.585 $166.61 $112.324
30-34 9,726,116 54.0% 20.3% 0.598 $166.61 $106.183
35-49 33,352,381 56.5% 16.5% 0.516 $185.66 $297.277
50-64 26,815,636 47.3% 8.7% 0.417 $188.14 $86.258
Total - Women 94,376,222 $775.213
Men
18-19 4,373,946 29.7% 36.7% 1.232 $99.45 $58.263
20-25 13,026,944 60.9% 47.9% 0.995 $135.08 $511.173
26-29 8,467,416 78.2% 45.8% 0.983 $188.90 $563.055
30-34 9,980,383 82.6% 38.4% 0.731 $188.90 $436.529
35-49 33,112,138 82.6% 32.3% 0.647 $244.72 $1,398.657
50-64 25,251,652 65.4% 22.0% 0.530 $257.30 $494.690
Total - Men 94,212,479 $3,462.367
Total - All $4,237.580 1 Estimated size of the U.S. population by age/gender for 2006 was from the U.S. Census Bureau (18-19 age group calculated as 2/5 of the 15-19 Census age group). 2 Prevalence of binge drinking was estimated based on NSDUH 2005-2007. Individuals who have been alcohol dependent within the last 12 months are excluded. 3 The mean loss for each age group was estimated based on CPS estimated earnings by age/gender 2006 - http://www.bls.gov/cps/cpswom2006.pdf. Accessed on
March 10, 2010.
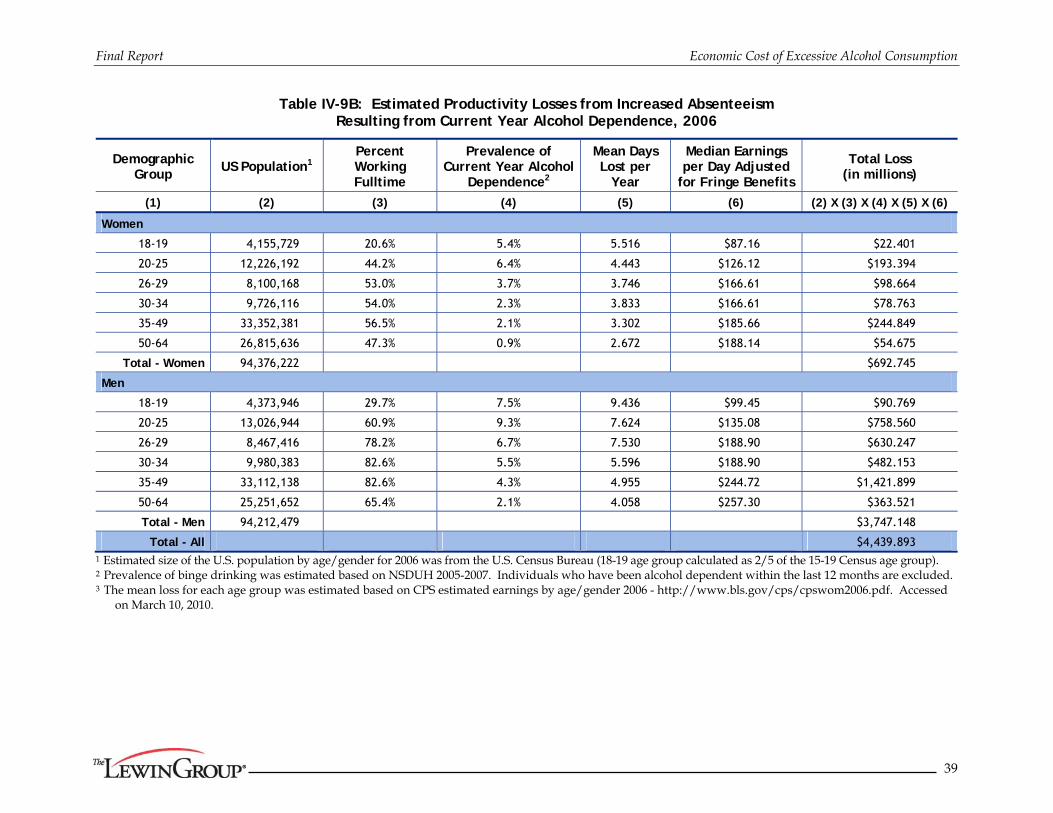
Final Report Economic Cost of Excessive Alcohol Consumption
39
Table IV-9B: Estimated Productivity Losses from Increased Absenteeism Resulting from Current Year Alcohol Dependence, 2006
Demographic Group
US Population1 Percent Working Fulltime
Prevalence of Current Year Alcohol
Dependence2
Mean Days Lost per
Year
Median Earnings per Day Adjusted
for Fringe Benefits
Total Loss (in millions)
(1) (2) (3) (4) (5) (6) (2) X (3) X (4) X (5) X (6)
Women
18-19 4,155,729 20.6% 5.4% 5.516 $87.16 $22.401
20-25 12,226,192 44.2% 6.4% 4.443 $126.12 $193.394
26-29 8,100,168 53.0% 3.7% 3.746 $166.61 $98.664
30-34 9,726,116 54.0% 2.3% 3.833 $166.61 $78.763
35-49 33,352,381 56.5% 2.1% 3.302 $185.66 $244.849
50-64 26,815,636 47.3% 0.9% 2.672 $188.14 $54.675
Total - Women 94,376,222 $692.745
Men
18-19 4,373,946 29.7% 7.5% 9.436 $99.45 $90.769
20-25 13,026,944 60.9% 9.3% 7.624 $135.08 $758.560
26-29 8,467,416 78.2% 6.7% 7.530 $188.90 $630.247
30-34 9,980,383 82.6% 5.5% 5.596 $188.90 $482.153
35-49 33,112,138 82.6% 4.3% 4.955 $244.72 $1,421.899
50-64 25,251,652 65.4% 2.1% 4.058 $257.30 $363.521
Total - Men 94,212,479 $3,747.148
Total - All $4,439.893 1 Estimated size of the U.S. population by age/gender for 2006 was from the U.S. Census Bureau (18-19 age group calculated as 2/5 of the 15-19 Census age group). 2 Prevalence of binge drinking was estimated based on NSDUH 2005-2007. Individuals who have been alcohol dependent within the last 12 months are excluded. 3 The mean loss for each age group was estimated based on CPS estimated earnings by age/gender 2006 - http://www.bls.gov/cps/cpswom2006.pdf. Accessed
on March 10, 2010.
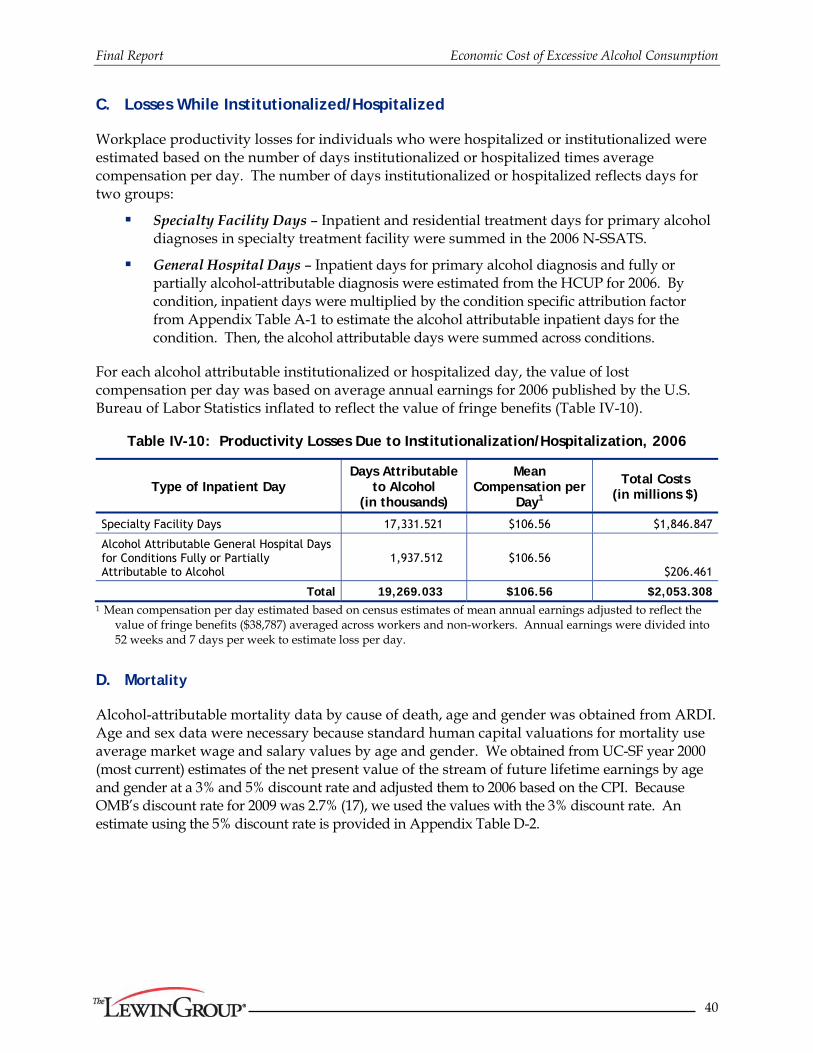
Final Report Economic Cost of Excessive Alcohol Consumption
40
C. Losses While Institutionalized/Hospitalized
Workplace productivity losses for individuals who were hospitalized or institutionalized were estimated based on the number of days institutionalized or hospitalized times average compensation per day. The number of days institutionalized or hospitalized reflects days for two groups:
Specialty Facility Days – Inpatient and residential treatment days for primary alcohol diagnoses in specialty treatment facility were summed in the 2006 N-SSATS.
General Hospital Days – Inpatient days for primary alcohol diagnosis and fully or partially alcohol-attributable diagnosis were estimated from the HCUP for 2006. By condition, inpatient days were multiplied by the condition specific attribution factor from Appendix Table A-1 to estimate the alcohol attributable inpatient days for the condition. Then, the alcohol attributable days were summed across conditions.
For each alcohol attributable institutionalized or hospitalized day, the value of lost compensation per day was based on average annual earnings for 2006 published by the U.S. Bureau of Labor Statistics inflated to reflect the value of fringe benefits (Table IV-10).
Table IV-10: Productivity Losses Due to Institutionalization/Hospitalization, 2006
Type of Inpatient Day Days Attributable
to Alcohol (in thousands)
Mean Compensation per
Day1
Total Costs (in millions $)
Specialty Facility Days 17,331.521 $106.56 $1,846.847
Alcohol Attributable General Hospital Days for Conditions Fully or Partially Attributable to Alcohol
1,937.512 $106.56 $206.461
Total 19,269.033 $106.56 $2,053.308 1 Mean compensation per day estimated based on census estimates of mean annual earnings adjusted to reflect the
value of fringe benefits ($38,787) averaged across workers and non-workers. Annual earnings were divided into 52 weeks and 7 days per week to estimate loss per day.
D. Mortality
Alcohol-attributable mortality data by cause of death, age and gender was obtained from ARDI. Age and sex data were necessary because standard human capital valuations for mortality use average market wage and salary values by age and gender. We obtained from UC-SF year 2000 (most current) estimates of the net present value of the stream of future lifetime earnings by age and gender at a 3% and 5% discount rate and adjusted them to 2006 based on the CPI. Because OMB’s discount rate for 2009 was 2.7% (17), we used the values with the 3% discount rate. An estimate using the 5% discount rate is provided in Appendix Table D-2.
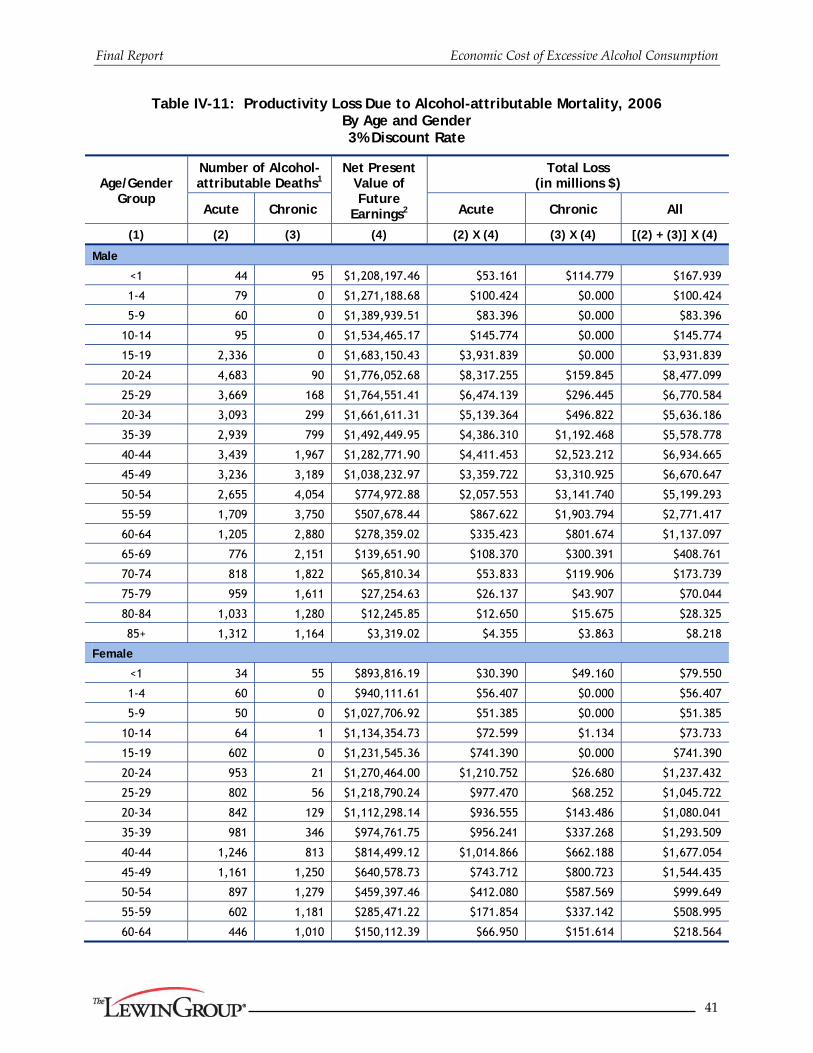
Final Report Economic Cost of Excessive Alcohol Consumption
41
Table IV-11: Productivity Loss Due to Alcohol-attributable Mortality, 2006 By Age and Gender 3% Discount Rate
Age/Gender Group
Number of Alcohol-attributable Deaths1
Net Present Value of Future
Earnings2
Total Loss (in millions $)
Acute Chronic Acute Chronic All
(1) (2) (3) (4) (2) X (4) (3) X (4) [(2) + (3)] X (4)
Male
<1 44 95 $1,208,197.46 $53.161 $114.779 $167.939
1-4 79 0 $1,271,188.68 $100.424 $0.000 $100.424
5-9 60 0 $1,389,939.51 $83.396 $0.000 $83.396
10-14 95 0 $1,534,465.17 $145.774 $0.000 $145.774
15-19 2,336 0 $1,683,150.43 $3,931.839 $0.000 $3,931.839
20-24 4,683 90 $1,776,052.68 $8,317.255 $159.845 $8,477.099
25-29 3,669 168 $1,764,551.41 $6,474.139 $296.445 $6,770.584
20-34 3,093 299 $1,661,611.31 $5,139.364 $496.822 $5,636.186
35-39 2,939 799 $1,492,449.95 $4,386.310 $1,192.468 $5,578.778
40-44 3,439 1,967 $1,282,771.90 $4,411.453 $2,523.212 $6,934.665
45-49 3,236 3,189 $1,038,232.97 $3,359.722 $3,310.925 $6,670.647
50-54 2,655 4,054 $774,972.88 $2,057.553 $3,141.740 $5,199.293
55-59 1,709 3,750 $507,678.44 $867.622 $1,903.794 $2,771.417
60-64 1,205 2,880 $278,359.02 $335.423 $801.674 $1,137.097
65-69 776 2,151 $139,651.90 $108.370 $300.391 $408.761
70-74 818 1,822 $65,810.34 $53.833 $119.906 $173.739
75-79 959 1,611 $27,254.63 $26.137 $43.907 $70.044
80-84 1,033 1,280 $12,245.85 $12.650 $15.675 $28.325
85+ 1,312 1,164 $3,319.02 $4.355 $3.863 $8.218
Female
<1 34 55 $893,816.19 $30.390 $49.160 $79.550
1-4 60 0 $940,111.61 $56.407 $0.000 $56.407
5-9 50 0 $1,027,706.92 $51.385 $0.000 $51.385
10-14 64 1 $1,134,354.73 $72.599 $1.134 $73.733
15-19 602 0 $1,231,545.36 $741.390 $0.000 $741.390
20-24 953 21 $1,270,464.00 $1,210.752 $26.680 $1,237.432
25-29 802 56 $1,218,790.24 $977.470 $68.252 $1,045.722
20-34 842 129 $1,112,298.14 $936.555 $143.486 $1,080.041
35-39 981 346 $974,761.75 $956.241 $337.268 $1,293.509
40-44 1,246 813 $814,499.12 $1,014.866 $662.188 $1,677.054
45-49 1,161 1,250 $640,578.73 $743.712 $800.723 $1,544.435
50-54 897 1,279 $459,397.46 $412.080 $587.569 $999.649
55-59 602 1,181 $285,471.22 $171.854 $337.142 $508.995
60-64 446 1,010 $150,112.39 $66.950 $151.614 $218.564
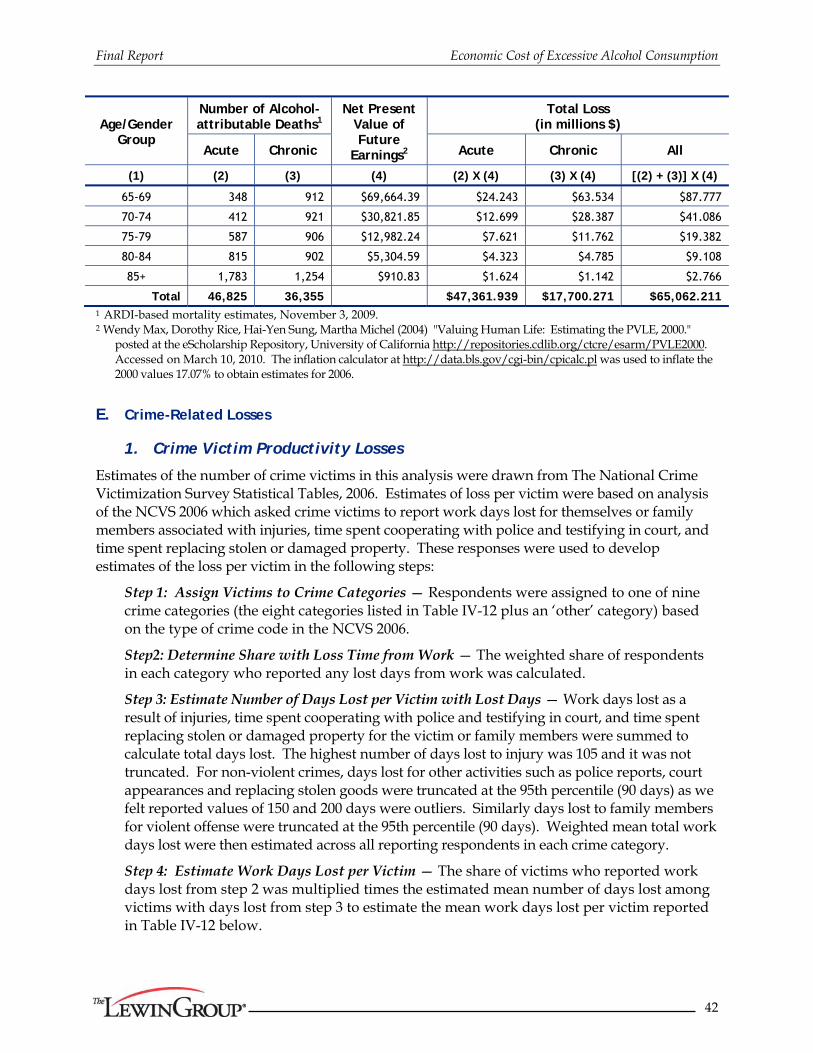
Final Report Economic Cost of Excessive Alcohol Consumption
42
Age/Gender Group
Number of Alcohol-attributable Deaths1
Net Present Value of Future
Earnings2
Total Loss (in millions $)
Acute Chronic Acute Chronic All
(1) (2) (3) (4) (2) X (4) (3) X (4) [(2) + (3)] X (4)
65-69 348 912 $69,664.39 $24.243 $63.534 $87.777
70-74 412 921 $30,821.85 $12.699 $28.387 $41.086
75-79 587 906 $12,982.24 $7.621 $11.762 $19.382
80-84 815 902 $5,304.59 $4.323 $4.785 $9.108
85+ 1,783 1,254 $910.83 $1.624 $1.142 $2.766
Total 46,825 36,355 $47,361.939 $17,700.271 $65,062.211 1 ARDI-based mortality estimates, November 3, 2009. 2 Wendy Max, Dorothy Rice, Hai-Yen Sung, Martha Michel (2004) "Valuing Human Life: Estimating the PVLE, 2000."
posted at the eScholarship Repository, University of California http://repositories.cdlib.org/ctcre/esarm/PVLE2000. Accessed on March 10, 2010. The inflation calculator at http://data.bls.gov/cgi-bin/cpicalc.pl was used to inflate the 2000 values 17.07% to obtain estimates for 2006.
E. Crime-Related Losses
1. Crime Victim Productivity Losses
Estimates of the number of crime victims in this analysis were drawn from The National Crime Victimization Survey Statistical Tables, 2006. Estimates of loss per victim were based on analysis of the NCVS 2006 which asked crime victims to report work days lost for themselves or family members associated with injuries, time spent cooperating with police and testifying in court, and time spent replacing stolen or damaged property. These responses were used to develop estimates of the loss per victim in the following steps:
Step 1: Assign Victims to Crime Categories — Respondents were assigned to one of nine crime categories (the eight categories listed in Table IV-12 plus an ‘other’ category) based on the type of crime code in the NCVS 2006.
Step2: Determine Share with Loss Time from Work — The weighted share of respondents in each category who reported any lost days from work was calculated.
Step 3: Estimate Number of Days Lost per Victim with Lost Days — Work days lost as a result of injuries, time spent cooperating with police and testifying in court, and time spent replacing stolen or damaged property for the victim or family members were summed to calculate total days lost. The highest number of days lost to injury was 105 and it was not truncated. For non-violent crimes, days lost for other activities such as police reports, court appearances and replacing stolen goods were truncated at the 95th percentile (90 days) as we felt reported values of 150 and 200 days were outliers. Similarly days lost to family members for violent offense were truncated at the 95th percentile (90 days). Weighted mean total work days lost were then estimated across all reporting respondents in each crime category.
Step 4: Estimate Work Days Lost per Victim — The share of victims who reported work days lost from step 2 was multiplied times the estimated mean number of days lost among victims with days lost from step 3 to estimate the mean work days lost per victim reported in Table IV-12 below.
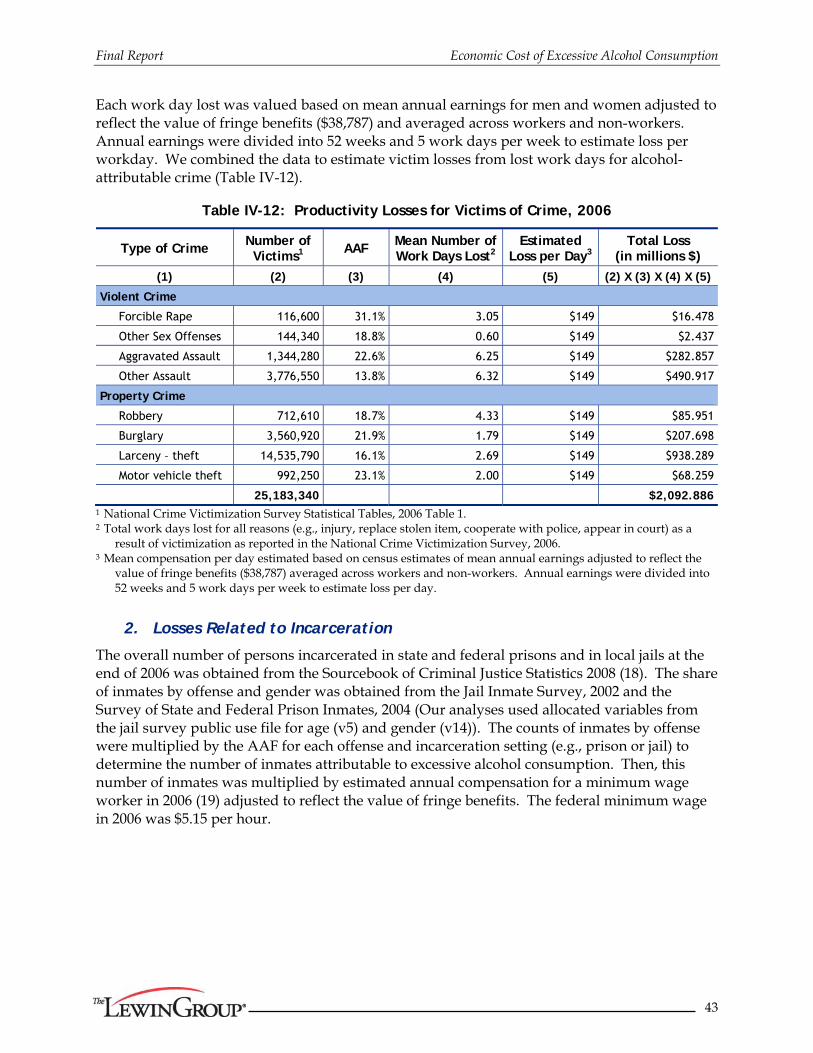
Final Report Economic Cost of Excessive Alcohol Consumption
43
Each work day lost was valued based on mean annual earnings for men and women adjusted to reflect the value of fringe benefits ($38,787) and averaged across workers and non-workers. Annual earnings were divided into 52 weeks and 5 work days per week to estimate loss per workday. We combined the data to estimate victim losses from lost work days for alcohol-attributable crime (Table IV-12).
Table IV-12: Productivity Losses for Victims of Crime, 2006
Type of Crime Number of Victims1 AAF
Mean Number of Work Days Lost2
Estimated Loss per Day3
Total Loss (in millions $)
(1) (2) (3) (4) (5) (2) X (3) X (4) X (5)
Violent Crime
Forcible Rape 116,600 31.1% 3.05 $149 $16.478
Other Sex Offenses 144,340 18.8% 0.60 $149 $2.437
Aggravated Assault 1,344,280 22.6% 6.25 $149 $282.857
Other Assault 3,776,550 13.8% 6.32 $149 $490.917
Property Crime
Robbery 712,610 18.7% 4.33 $149 $85.951
Burglary 3,560,920 21.9% 1.79 $149 $207.698
Larceny – theft 14,535,790 16.1% 2.69 $149 $938.289
Motor vehicle theft 992,250 23.1% 2.00 $149 $68.259
25,183,340 $2,092.886 1 National Crime Victimization Survey Statistical Tables, 2006 Table 1. 2 Total work days lost for all reasons (e.g., injury, replace stolen item, cooperate with police, appear in court) as a
result of victimization as reported in the National Crime Victimization Survey, 2006. 3 Mean compensation per day estimated based on census estimates of mean annual earnings adjusted to reflect the
value of fringe benefits ($38,787) averaged across workers and non-workers. Annual earnings were divided into 52 weeks and 5 work days per week to estimate loss per day.
2. Losses Related to Incarceration
The overall number of persons incarcerated in state and federal prisons and in local jails at the end of 2006 was obtained from the Sourcebook of Criminal Justice Statistics 2008 (18). The share of inmates by offense and gender was obtained from the Jail Inmate Survey, 2002 and the Survey of State and Federal Prison Inmates, 2004 (Our analyses used allocated variables from the jail survey public use file for age (v5) and gender (v14)). The counts of inmates by offense were multiplied by the AAF for each offense and incarceration setting (e.g., prison or jail) to determine the number of inmates attributable to excessive alcohol consumption. Then, this number of inmates was multiplied by estimated annual compensation for a minimum wage worker in 2006 (19) adjusted to reflect the value of fringe benefits. The federal minimum wage in 2006 was $5.15 per hour.
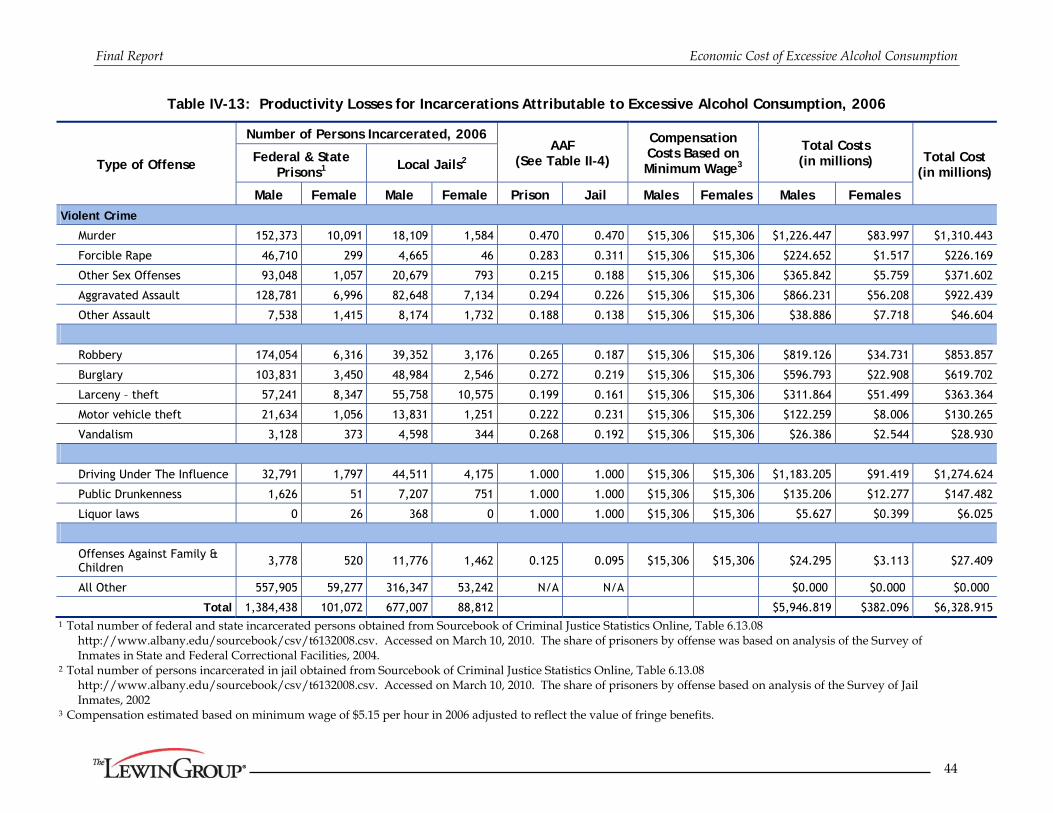
Final Report Economic Cost of Excessive Alcohol Consumption
44
Table IV-13: Productivity Losses for Incarcerations Attributable to Excessive Alcohol Consumption, 2006
Type of Offense
Number of Persons Incarcerated, 2006 AAF
(See Table II-4)
Compensation Costs Based on Minimum Wage3
Total Costs (in millions) Total Cost
(in millions) Federal & State
Prisons1 Local Jails2
Male Female Male Female Prison Jail Males Females Males Females
Violent Crime
Murder 152,373 10,091 18,109 1,584 0.470 0.470 $15,306 $15,306 $1,226.447 $83.997 $1,310.443
Forcible Rape 46,710 299 4,665 46 0.283 0.311 $15,306 $15,306 $224.652 $1.517 $226.169
Other Sex Offenses 93,048 1,057 20,679 793 0.215 0.188 $15,306 $15,306 $365.842 $5.759 $371.602
Aggravated Assault 128,781 6,996 82,648 7,134 0.294 0.226 $15,306 $15,306 $866.231 $56.208 $922.439
Other Assault 7,538 1,415 8,174 1,732 0.188 0.138 $15,306 $15,306 $38.886 $7.718 $46.604
Robbery 174,054 6,316 39,352 3,176 0.265 0.187 $15,306 $15,306 $819.126 $34.731 $853.857
Burglary 103,831 3,450 48,984 2,546 0.272 0.219 $15,306 $15,306 $596.793 $22.908 $619.702
Larceny – theft 57,241 8,347 55,758 10,575 0.199 0.161 $15,306 $15,306 $311.864 $51.499 $363.364
Motor vehicle theft 21,634 1,056 13,831 1,251 0.222 0.231 $15,306 $15,306 $122.259 $8.006 $130.265
Vandalism 3,128 373 4,598 344 0.268 0.192 $15,306 $15,306 $26.386 $2.544 $28.930
Driving Under The Influence 32,791 1,797 44,511 4,175 1.000 1.000 $15,306 $15,306 $1,183.205 $91.419 $1,274.624
Public Drunkenness 1,626 51 7,207 751 1.000 1.000 $15,306 $15,306 $135.206 $12.277 $147.482
Liquor laws 0 26 368 0 1.000 1.000 $15,306 $15,306 $5.627 $0.399 $6.025
Offenses Against Family & Children 3,778 520 11,776 1,462 0.125 0.095 $15,306 $15,306 $24.295 $3.113 $27.409
All Other 557,905 59,277 316,347 53,242 N/A N/A $0.000 $0.000 $0.000
Total 1,384,438 101,072 677,007 88,812 $5,946.819 $382.096 $6,328.915 1 Total number of federal and state incarcerated persons obtained from Sourcebook of Criminal Justice Statistics Online, Table 6.13.08
http://www.albany.edu/sourcebook/csv/t6132008.csv. Accessed on March 10, 2010. The share of prisoners by offense was based on analysis of the Survey of Inmates in State and Federal Correctional Facilities, 2004.
2 Total number of persons incarcerated in jail obtained from Sourcebook of Criminal Justice Statistics Online, Table 6.13.08 http://www.albany.edu/sourcebook/csv/t6132008.csv. Accessed on March 10, 2010. The share of prisoners by offense based on analysis of the Survey of Jail Inmates, 2002
3 Compensation estimated based on minimum wage of $5.15 per hour in 2006 adjusted to reflect the value of fringe benefits.
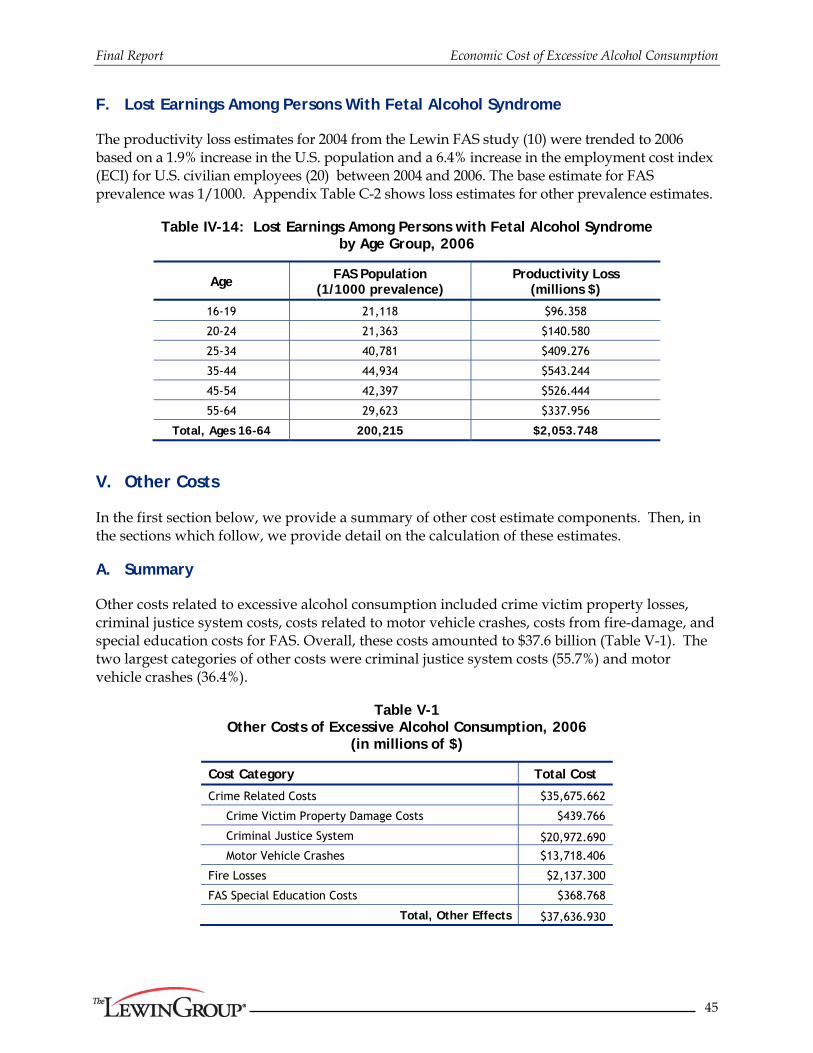
Final Report Economic Cost of Excessive Alcohol Consumption
45
F. Lost Earnings Among Persons With Fetal Alcohol Syndrome
The productivity loss estimates for 2004 from the Lewin FAS study (10) were trended to 2006 based on a 1.9% increase in the U.S. population and a 6.4% increase in the employment cost index (ECI) for U.S. civilian employees (20) between 2004 and 2006. The base estimate for FAS prevalence was 1/1000. Appendix Table C-2 shows loss estimates for other prevalence estimates.
Table IV-14: Lost Earnings Among Persons with Fetal Alcohol Syndrome by Age Group, 2006
Age FAS Population
(1/1000 prevalence) Productivity Loss
(millions $)
16-19 21,118 $96.358
20-24 21,363 $140.580
25-34 40,781 $409.276
35-44 44,934 $543.244
45-54 42,397 $526.444
55-64 29,623 $337.956
Total, Ages 16-64 200,215 $2,053.748
V. Other Costs
In the first section below, we provide a summary of other cost estimate components. Then, in the sections which follow, we provide detail on the calculation of these estimates.
A. Summary
Other costs related to excessive alcohol consumption included crime victim property losses, criminal justice system costs, costs related to motor vehicle crashes, costs from fire-damage, and special education costs for FAS. Overall, these costs amounted to $37.6 billion (Table V-1). The two largest categories of other costs were criminal justice system costs (55.7%) and motor vehicle crashes (36.4%).
Table V-1 Other Costs of Excessive Alcohol Consumption, 2006
(in millions of $)
Cost Category Total Cost
Crime Related Costs $35,675.662
Crime Victim Property Damage Costs $439.766
Criminal Justice System $20,972.690
Motor Vehicle Crashes $13,718.406
Fire Losses $2,137.300
FAS Special Education Costs $368.768
Total, Other Effects $37,636.930

Final Report Economic Cost of Excessive Alcohol Consumption
46
B. Victim Costs (Excluding Medical and Productivity Costs)
The estimates of the number of crime victims were drawn from The National Crime Victimization Survey Statistical Tables, 2006. Estimates of loss per victim were based on analysis of the NCVS 2006 which asks crime victims to report whether they had property stolen or damaged. Those who had property stolen are asked to report the value of the stolen property and whether any of the property was recovered. Those who had property damaged were asked to estimate the cost to repair the damage. We developed estimates of the loss per victim in the following steps:
Step 1: Assign Victims to Crime Categories — Respondents were assigned to one of nine crime categories (the eight categories listed in Table V-2 plus an ‘other’ category) based on the type of crime code in the NCVS 2006.
Step2: Determine Share with Loss or Damage — The weighted share of respondents in each crime category who had any property damaged or stolen was calculated.
Step 3: Estimate Loss per Victim — Variables for value of cash stolen, value of property stolen, cost to repair damaged property, amount of cash recovered, and value of property recovered were used to calculate each victim’s total property loss and loss related to property damaged. Because reported losses and recovery amounts appeared consistent with the type of crime, no truncation or adjustment of reported losses was made. Respondents who reported they had property stolen, recovered, or damaged, but did not report value amounts were not included. Weighted mean total property loss and property damage repair cost were estimated across reporting respondents in each crime category.
Step 4: Estimate loss per Victim — The share of victims with a loss or damage from step 2 was multiplied times the estimated mean loss from step 3 to estimate the total property loss per victim and cost to repair property damage per victim (Tables V-2 and V-3 below).
These data were combined with estimates of the number of victimizations and the share attributable to alcohol to estimate victim property losses for alcohol-attributable crime (Table V-2).
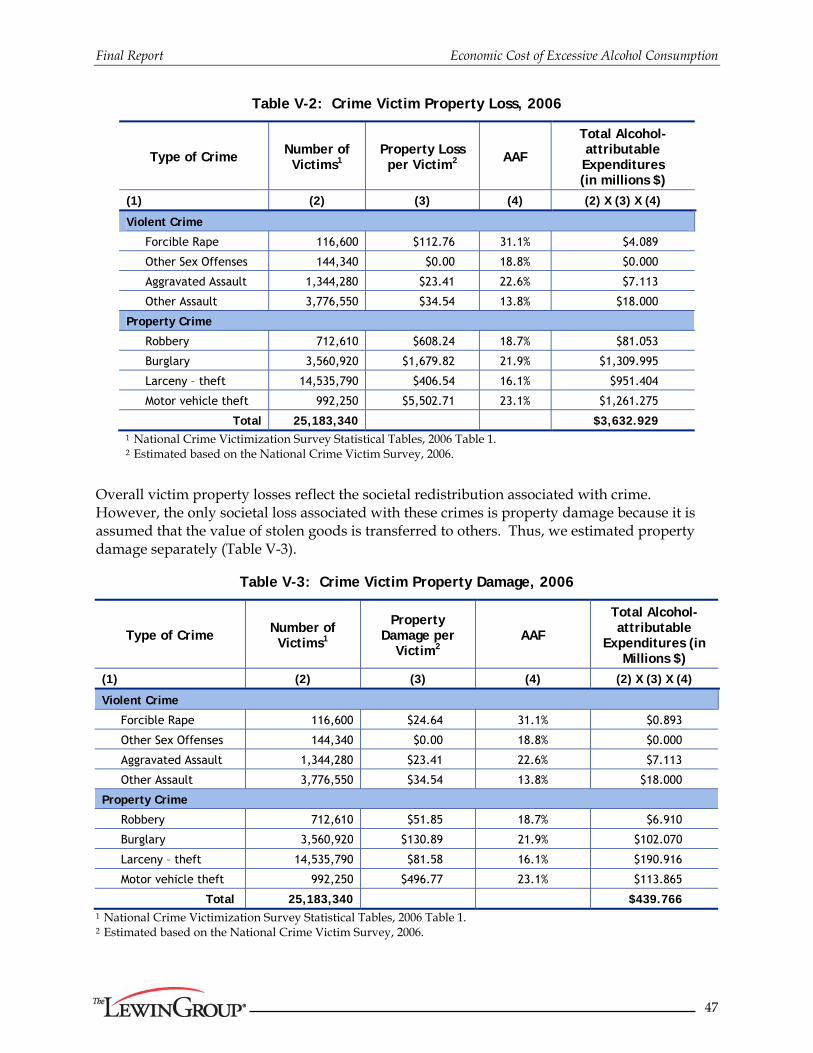
Final Report Economic Cost of Excessive Alcohol Consumption
47
Table V-2: Crime Victim Property Loss, 2006
Type of Crime Number of Victims1
Property Loss per Victim2
AAF
Total Alcohol-attributable Expenditures (in millions $)
(1) (2) (3) (4) (2) X (3) X (4)
Violent Crime
Forcible Rape 116,600 $112.76 31.1% $4.089
Other Sex Offenses 144,340 $0.00 18.8% $0.000
Aggravated Assault 1,344,280 $23.41 22.6% $7.113
Other Assault 3,776,550 $34.54 13.8% $18.000
Property Crime
Robbery 712,610 $608.24 18.7% $81.053
Burglary 3,560,920 $1,679.82 21.9% $1,309.995
Larceny – theft 14,535,790 $406.54 16.1% $951.404
Motor vehicle theft 992,250 $5,502.71 23.1% $1,261.275
Total 25,183,340 $3,632.929 1 National Crime Victimization Survey Statistical Tables, 2006 Table 1. 2 Estimated based on the National Crime Victim Survey, 2006.
Overall victim property losses reflect the societal redistribution associated with crime. However, the only societal loss associated with these crimes is property damage because it is assumed that the value of stolen goods is transferred to others. Thus, we estimated property damage separately (Table V-3).
Table V-3: Crime Victim Property Damage, 2006
Type of Crime Number of Victims1
Property Damage per
Victim2 AAF
Total Alcohol-attributable
Expenditures (in Millions $)
(1) (2) (3) (4) (2) X (3) X (4)
Violent Crime
Forcible Rape 116,600 $24.64 31.1% $0.893
Other Sex Offenses 144,340 $0.00 18.8% $0.000
Aggravated Assault 1,344,280 $23.41 22.6% $7.113
Other Assault 3,776,550 $34.54 13.8% $18.000
Property Crime
Robbery 712,610 $51.85 18.7% $6.910
Burglary 3,560,920 $130.89 21.9% $102.070
Larceny – theft 14,535,790 $81.58 16.1% $190.916
Motor vehicle theft 992,250 $496.77 23.1% $113.865
Total 25,183,340 $439.766 1 National Crime Victimization Survey Statistical Tables, 2006 Table 1. 2 Estimated based on the National Crime Victim Survey, 2006.

Final Report Economic Cost of Excessive Alcohol Consumption
48
C. Criminal Justice System Costs
Criminal justice system costs included costs for police protection, the court system, and correctional institutions. National estimates of criminal justice system expenditures are published annually by the Bureau of Justice Statistics. The most recent year of data available was for 2006 (21). Incarceration costs were estimated based on the share of inmates attributable to alcohol.
1. Correctional Costs and Private Legal Costs
The share of correctional costs attributable to alcohol was estimated based on the number of inmates in each setting for each offense and the AAF for each offense and setting (Table II-4).
Since private legal costs were not included in the BJS estimates of legal and adjudication costs, we obtained estimates of private legal costs from the U.S. Census Bureau. These costs were attributed to alcohol-related crime based on the percentage of lawyers who practice criminal law in the private sector (1.8%) and the share of arrests attributable to alcohol (5.3%). The percentage of lawyers practicing criminal law was obtained from the American Bar Association based Martindale-Hubbell survey data (personal communication, K. Gennings, 8/20/2009).
Table V-4: Criminal Justice System Expenditures Attributable to Alcohol, 2006 (in millions of $)
Type of Cost Total Cost
(in millions $) Share Attributable
to Alcohol
Total Alcohol-attributable Cost
(in millions $)
Public Expenditures
Federal Corrections2 $6,158 0.049 $301.101
State Corrections1 $40,413 0.212 $8,549.280
Local Corrections1 $22,176 0.169 $3,737.065
Private Expenditures
Private Legal Defense3 $236,166 0.001 $229.381 1 Direct expenditures for state and local justice system activities from the Sourcebook of Criminal Justice Statistics,
2006, Table 1.6 http://www.albany.edu/sourcebook/pdf/t162006.pdf. Accessed on March 10, 2010.
2 Direct expenditures for federal corrections calculated based on total expenditures for all levels of government from the Sourcebook of Criminal Justice Statistics, 2006, Table 1.2, http://www.albany.edu/sourcebook/pdf/t122006.pdf less the direct expenditures of the state and local governments. Duplicative expenditures are excluded from total expenditures.
3 Census Bureau Service Annual Survey http://www2.census.gov/services/sas/data/Historical/sas-06.pdf. (page 96), Accessed on March 10, 2010.
2. Government Expenditures for Police Protection and Legal and Adjudication Costs
In this section, we estimate costs for violent and property related crimes first. Then, we develop estimates for alcohol related costs. These calculations are presented separately because of differences in methods.

Final Report Economic Cost of Excessive Alcohol Consumption
49
a. Violent and Property Crime-Related Costs (Table V-5A)
The share of state and local police protection and legal and adjudication costs attributable to excessive alcohol consumption as a result of violent or property crimes was estimated based on the share of arrests attributable to alcohol (5.3%), which was calculated based on the number of arrests by offense and the share of each type of arrest attributable to alcohol (Appendix E, Table E-1). Equal weight was given to each arrest regardless of offense as was done in previous research.
Table V-5A: Criminal Justice System Expenditures Attributable to Alcohol, 2006 Violent and Property Crimes
(in millions of $)
Type of Cost Total Cost (in millions $)
Share Attributable to Alcohol
Total Alcohol-attributable Cost
(in millions $)
Public Expenditures
Police Protection1 $78,834 0.053 $4,178.195
Legal and Adjudication1 $36,823 0.053 $1,951.620
Total $6,129.816 1 Direct expenditures for state and local justice system activities from the Sourcebook of Criminal Justice Statistics,
2006, Table 1.6 http://www.albany.edu/sourcebook/pdf/t162006.pdf. Accessed on March 10, 2010.
b. Alcohol Crime Costs (Table V-5B)
Cost estimates for alcohol crimes were based on the number of arrests times the estimated average police and legal adjudication costs per arrest. Number of arrests by age and type of crime were available from the Sourcebook of Criminal Justice Statistics for 2006. A literature search was conducted to identify recent studies of average police and legal adjudication costs per arrest. The most recent estimates identified for police protection costs per arrest were developed by Kenkel (22) who used data on enforcement cost per arrest from the National Research Council (23) and then trended that data to estimate an enforcement cost per speeding ticket in 1985 of $64. We further trended that estimate to 2006 based on the CPI to yield an estimate of $119.91 per arrest for police protection. For legal and adjudication costs the most recent estimates available was found in Kenkel who cited data developed by Weller (24) that put the court costs for a drunk driving case resolved with a guilty plea at $250 in 1975 dollars. Noting that the vast majority of drunken driving cases were resolved by a guilty plea, Kenkel adjusted that estimate for inflation to $500 in 1985 dollars and we further inflated this estimate to 2006 dollars based on the CPI to produce an estimate of $936.80 per arrest for legal and adjudication costs.
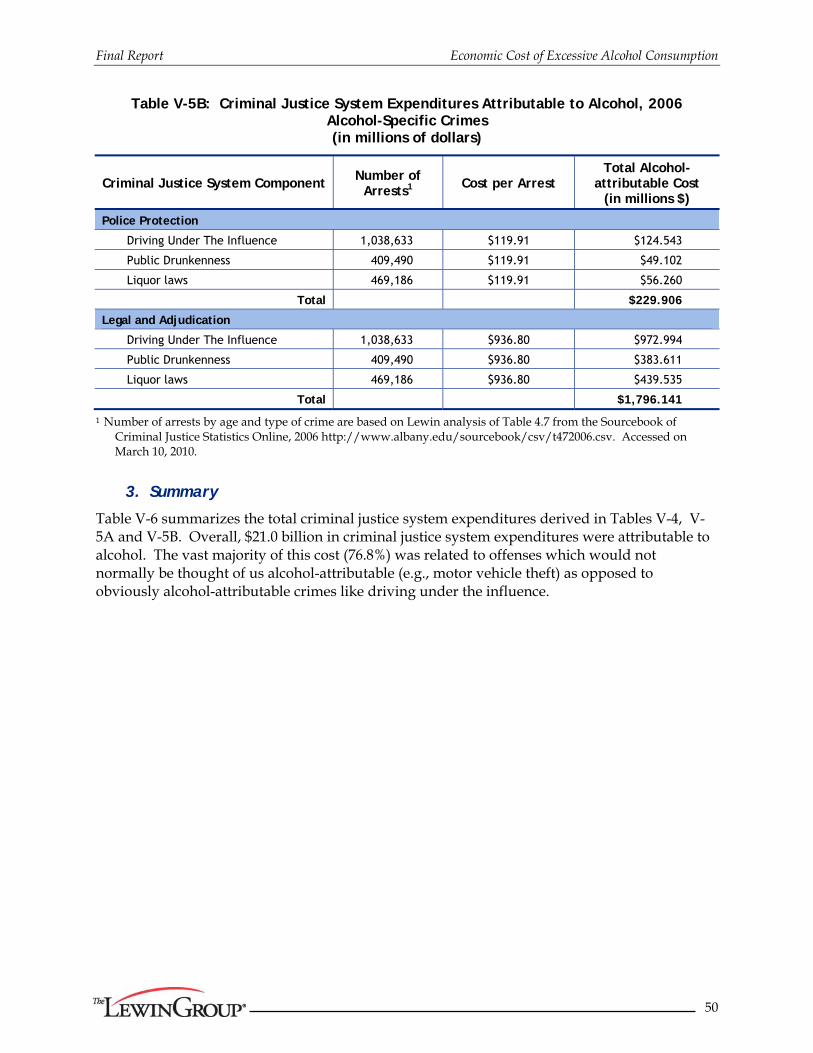
Final Report Economic Cost of Excessive Alcohol Consumption
50
Table V-5B: Criminal Justice System Expenditures Attributable to Alcohol, 2006 Alcohol-Specific Crimes (in millions of dollars)
Criminal Justice System Component Number of
Arrests1 Cost per Arrest Total Alcohol-
attributable Cost (in millions $)
Police Protection
Driving Under The Influence 1,038,633 $119.91 $124.543
Public Drunkenness 409,490 $119.91 $49.102
Liquor laws 469,186 $119.91 $56.260
Total $229.906
Legal and Adjudication
Driving Under The Influence 1,038,633 $936.80 $972.994
Public Drunkenness 409,490 $936.80 $383.611
Liquor laws 469,186 $936.80 $439.535
Total $1,796.141
1 Number of arrests by age and type of crime are based on Lewin analysis of Table 4.7 from the Sourcebook of Criminal Justice Statistics Online, 2006 http://www.albany.edu/sourcebook/csv/t472006.csv. Accessed on March 10, 2010.
3. Summary
Table V-6 summarizes the total criminal justice system expenditures derived in Tables V-4, V-5A and V-5B. Overall, $21.0 billion in criminal justice system expenditures were attributable to alcohol. The vast majority of this cost (76.8%) was related to offenses which would not normally be thought of us alcohol-attributable (e.g., motor vehicle theft) as opposed to obviously alcohol-attributable crimes like driving under the influence.

Final Report Economic Cost of Excessive Alcohol Consumption
51
Table V-6: Criminal Justice System Expenditures Attributable to Alcohol, 2006
(in millions of dollars)
Criminal Justice System Component Total Alcohol-
Attributable Cost (in millions $)
Public Expenditures
Police Protection $4,408.101
Legal and Adjudication $3,747.761
Corrections $12,587.446
Private Expenditures
Private Legal Defense $229.381
Total $20,972.690
D. Motor Vehicle Crashes (Excluding Medical and Productivity Losses)
The economic cost of alcohol-related motor vehicle crashes in 2000 was drawn from U.S. National Highway Traffic Safety Administration (NHTSA) Report, “The Economic Impact of Motor Vehicle Crashes, 2000” (25). This report provided the number of alcohol involved crashes and unit costs by type of cost (e.g., health care costs, productivity losses) for these crashes by the level of injury in the crash (e.g., property damage only, critical injuries). Using Table 10 on page 38 of this report, we noted that 323,003 (6.1%) of a total of 5,267,467 non-fatal injuries were associated with a BAC > .10. This figure formed the basis of the AAF for non-fatal motor vehicle traffic injuries (Table II-1). Appendix Table F-1 displays the calculation of alcohol-attributable costs for motor-vehicle crashes in 2000. Results for 2000 were trended forward to 2006. The price trend was based on the CPI for all goods and services. The alcohol-involved crash trend was based on trends in fatal motor vehicle crashes with at least one driver having a BAC greater than or equal to 0.08 (Table V-7).
Table V-7: Trends in Price and Alcohol-Involvement in Crashes, 2000-2006
Trend 2000 2001 2002 2003 2004 2005 2006 Average Annual Trend
CPI All Goods1 172.2 177.1 179.9 184.0 188.9 195.3 201.6 1.027
Number of Fatal Crashes with BAC=>.082
11,787 11,780 11,985 11,650 11,668 12,200 12,150 1.005
1 ftp://ftp.bls.gov/pub/special.requests/cpi/cpiai.txt. Accessed on April 5, 2010. 2 http://www-fars.nhtsa.dot.gov/Crashes/CrashesAlcohol.aspx. Accessed on March 10, 2010.
Costs exceeded $13.7 billion (Table V-8). Legal costs represented legal fees and court costs associated with civil litigation from motor vehicle crashes (25) and do not overlap with the legal defense costs associated with criminal charges for driving under the influence of alcohol (Table V-5). Health care and productivity costs related to motor-vehicle crashes are not presented here because these costs overlap with health and productivity losses associated with injuries, which are presented

Final Report Economic Cost of Excessive Alcohol Consumption
52
elsewhere. Health insurance related administration costs were excluded from the estimate of insurance administration costs (see page 78 reference 25) in Table V-8. Property damage included the value of vehicles, cargo, roadways and other items damaged in traffic crashes.
Table V-8: Alcohol-Attributable Motor-Vehicle Crash Costs, 2006
Component Costs 2000 Costs1
Trends, 2000-2006 Total Economic Cost Attributable
to Alcohol (in millions $)
Price Number of
Fatal Crashes with BAC=>.08
(1) (2) (3) (4) (5)
Insurance Administration $1,925.060 1.171 1.031 $2,323.136
Legal Costs $2,702.038 1.171 1.031 $3,260.782
Travel Delay $2,125.318 1.171 1.031 $2,564.804
Property Damage $4,615.303 1.171 1.031 $5,569.684
Total $11,367.718 1.171 1.031 $13,718.406 1 From Appendix Table F-1.
E. Fire Damage
We used U.S. Census Bureau estimates of national fire-related losses in 2006 (26) and estimates of state and local government expenditures for fire protection services (the most recent estimate available was for 2005)(27). While there is ample evidence that alcohol intoxication is a cause of over 40 percent of fire-related deaths, the link between alcohol and all fire-related property damage is less clear. A recent study by the National Fire Protection Association (28) estimated that five percent of overall property damage caused by fires was a result of fires where alcohol use contributed to the ignition. Thus, we attributed five percent of fire property loss and fire protection services to alcohol (Table V-9).
Table V-9: Alcohol-attributable Fire Losses, 2006 (in millions of dollars)
Type of Cost Total Economic Cost (in millions $)1
Share Attributable to Alcohol Misuse
Total Cost (in millions $)
Fire Property Loss $11,307 5.0% $565.350
Fire Protection Services $31,439 5.0% $1,571.950
Total $42,746 5.0% $2,137.300 1 http://www.census.gov/compendia/statab/cats/law_enforcement_courts_prisons/fire_losses.html. Accessed on March 10, 2010.
F. Fetal Alcohol Syndrome
We used the Lewin Group’s recently conducted study to ascertain special education costs related to FAS and trended the 2004 estimate to 2006 based on increases in the U.S. population and the consumer price index for all goods and services. Appendix Table C-3 shows the effect of varying prevalence on these costs.

Final Report Economic Cost of Excessive Alcohol Consumption
53
Table V-10: National Annual Direct Special Education Costs of FAS by Age Group, 2006
(in millions)
Age Group Annual
Expected Cost of Services
FAS Population
National Annual Cost (millions $)
<18 $5,520.45 62,556 $345.337
18-77 $113.28 206,835 $23.430
Total, Ages 18-77 $1,368.89 269,391 $368.768
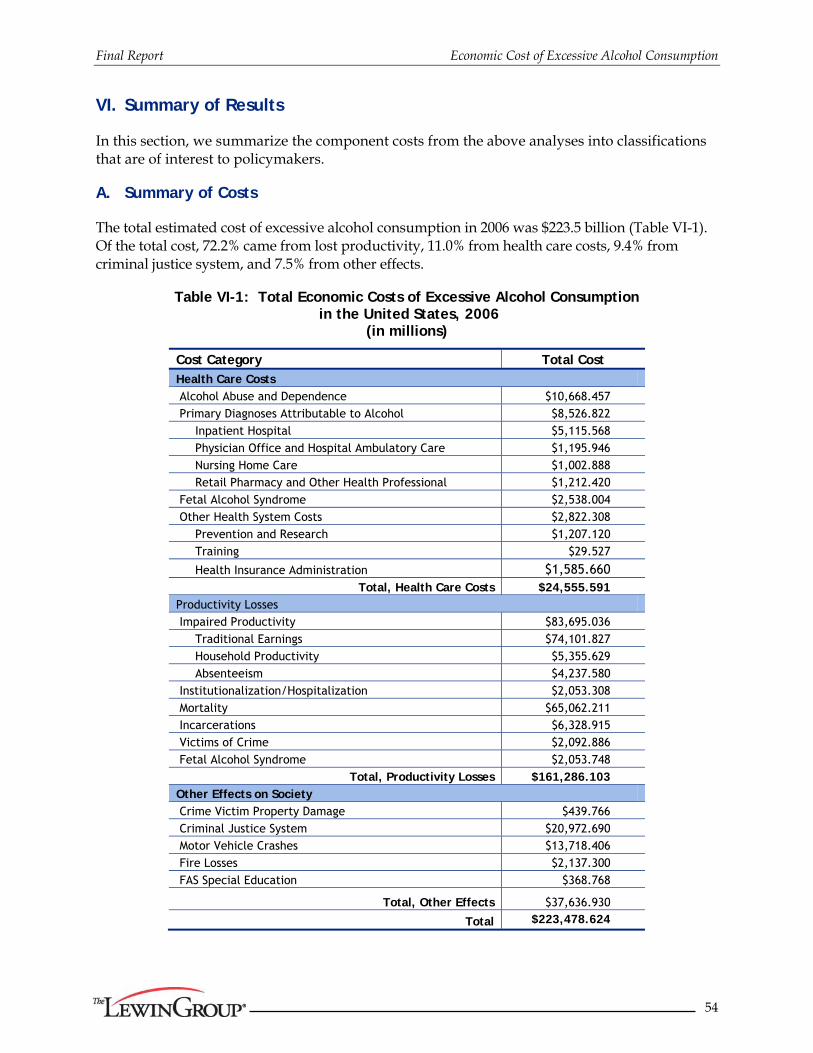
Final Report Economic Cost of Excessive Alcohol Consumption
54
VI. Summary of Results
In this section, we summarize the component costs from the above analyses into classifications that are of interest to policymakers.
A. Summary of Costs
The total estimated cost of excessive alcohol consumption in 2006 was $223.5 billion (Table VI-1). Of the total cost, 72.2% came from lost productivity, 11.0% from health care costs, 9.4% from criminal justice system, and 7.5% from other effects.
Table VI-1: Total Economic Costs of Excessive Alcohol Consumption in the United States, 2006
(in millions)
Cost Category Total Cost Health Care Costs Alcohol Abuse and Dependence $10,668.457 Primary Diagnoses Attributable to Alcohol $8,526.822
Inpatient Hospital $5,115.568 Physician Office and Hospital Ambulatory Care $1,195.946 Nursing Home Care $1,002.888 Retail Pharmacy and Other Health Professional $1,212.420
Fetal Alcohol Syndrome $2,538.004 Other Health System Costs $2,822.308
Prevention and Research $1,207.120 Training $29.527
Health Insurance Administration $1,585.660
Total, Health Care Costs $24,555.591 Productivity Losses Impaired Productivity $83,695.036
Traditional Earnings $74,101.827 Household Productivity $5,355.629 Absenteeism $4,237.580
Institutionalization/Hospitalization $2,053.308 Mortality $65,062.211 Incarcerations $6,328.915 Victims of Crime $2,092.886 Fetal Alcohol Syndrome $2,053.748
Total, Productivity Losses $161,286.103 Other Effects on Society Crime Victim Property Damage $439.766 Criminal Justice System $20,972.690 Motor Vehicle Crashes $13,718.406 Fire Losses $2,137.300 FAS Special Education $368.768
Total, Other Effects $37,636.930
Total $223,478.624
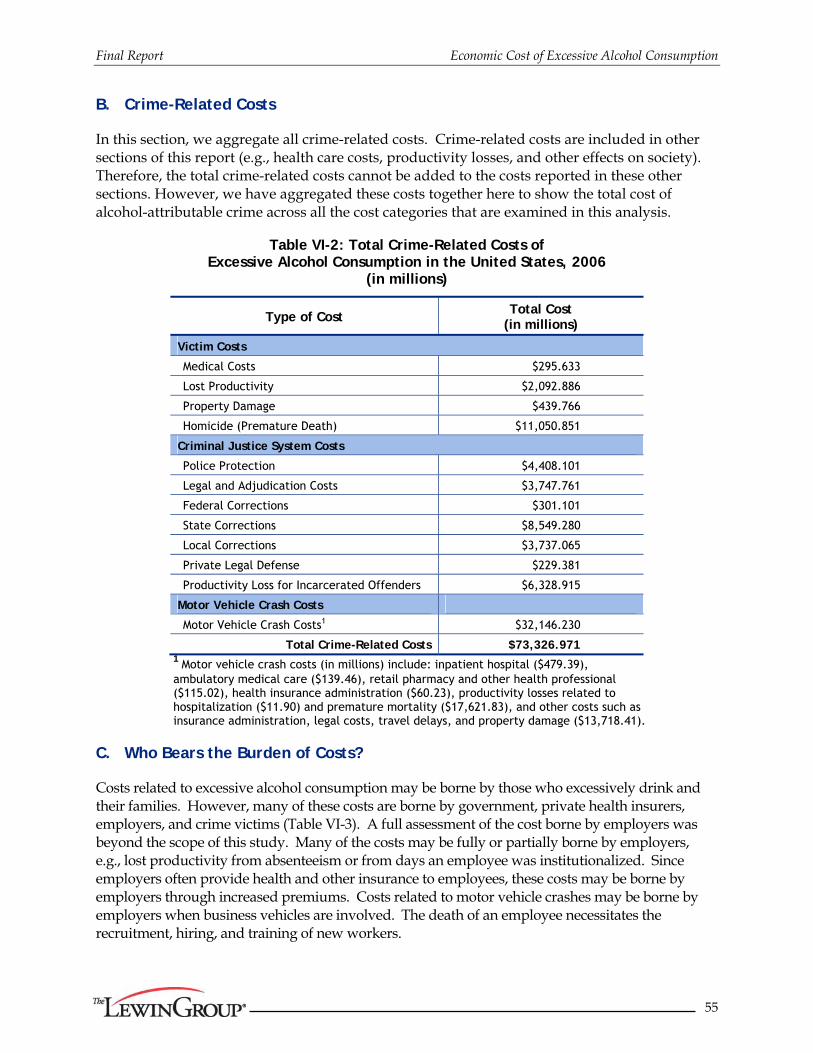
Final Report Economic Cost of Excessive Alcohol Consumption
55
B. Crime-Related Costs
In this section, we aggregate all crime-related costs. Crime-related costs are included in other sections of this report (e.g., health care costs, productivity losses, and other effects on society). Therefore, the total crime-related costs cannot be added to the costs reported in these other sections. However, we have aggregated these costs together here to show the total cost of alcohol-attributable crime across all the cost categories that are examined in this analysis.
Table VI-2: Total Crime-Related Costs of Excessive Alcohol Consumption in the United States, 2006
(in millions)
Type of Cost Total Cost
(in millions)
Victim Costs
Medical Costs $295.633
Lost Productivity $2,092.886
Property Damage $439.766
Homicide (Premature Death) $11,050.851
Criminal Justice System Costs
Police Protection $4,408.101
Legal and Adjudication Costs $3,747.761
Federal Corrections $301.101
State Corrections $8,549.280
Local Corrections $3,737.065
Private Legal Defense $229.381
Productivity Loss for Incarcerated Offenders $6,328.915
Motor Vehicle Crash Costs
Motor Vehicle Crash Costs1 $32,146.230
Total Crime-Related Costs $73,326.971 1 Motor vehicle crash costs (in millions) include: inpatient hospital ($479.39), ambulatory medical care ($139.46), retail pharmacy and other health professional ($115.02), health insurance administration ($60.23), productivity losses related to hospitalization ($11.90) and premature mortality ($17,621.83), and other costs such as insurance administration, legal costs, travel delays, and property damage ($13,718.41).
C. Who Bears the Burden of Costs?
Costs related to excessive alcohol consumption may be borne by those who excessively drink and their families. However, many of these costs are borne by government, private health insurers, employers, and crime victims (Table VI-3). A full assessment of the cost borne by employers was beyond the scope of this study. Many of the costs may be fully or partially borne by employers, e.g., lost productivity from absenteeism or from days an employee was institutionalized. Since employers often provide health and other insurance to employees, these costs may be borne by employers through increased premiums. Costs related to motor vehicle crashes may be borne by employers when business vehicles are involved. The death of an employee necessitates the recruitment, hiring, and training of new workers.

Final Report Economic Cost of Excessive Alcohol Consumption
56
Because a full assessment of employer costs was beyond the scope of this study, we focused on the sources who directly bore the costs and grouped payers into 1) government, 2) excessive drinkers and their families, and 3) others (including private insurance, crime victims and others). The main payer for excessive alcohol consumption was government (42.1% of costs), followed by excessive drinkers and their families (41.5%) and then others in society (16.3%).
1. Health System Direct Costs
Health system direct costs were divided by source of payment. For alcohol abuse and dependence treatment this distribution appears in Table III-2. For other health treatment services - including inpatient care, ambulatory care, nursing home care, retail pharmacy, non-durable medical equipment, other professional services, and fetal alcohol syndrome - the allocation of expenditures by source of payment is displayed as part of the calculation of health insurance administration costs in Table III-14 in Section III-G. These distributions were used to assign medical costs to a burden category. This allocation was straightforward with the exception of Medicaid funding which was allocated between federal (56.6%) and state (43.4%) government based on the allocation of Medicaid spending in the NHEA for 2006.
The method for allocating the burden of other health system costs is described below:
Research and Prevention — Costs related to research and prevention were borne by the government. The distribution between federal and state and local government is presented in Table III-12.
Training — Expenditures to train alcohol treatment professionals would be redirected to other sectors of the economy if the need for these professionals diminished. Thus, we allocated these resources to government based on the governments’ share of net national product and the remainder to “other” members of society who may have benefited from re-directing these resources.
Health Insurance Administration — The cost of health insurance administration was distributed as shown in Table III-2 for direct alcohol abuse and dependence treatment and Table III-14 for the medical consequences of alcohol. The exception was health

Final Report Economic Cost of Excessive Alcohol Consumption
57
insurance administration associated with FAS. Because the payment source distribution was unknown for FAS, we allocated expenditures to a payment source based on the national distribution of health expenditures in the NHEA for 2006.
Overall, these estimates indicated that the excessive drinker and their household bear a very small share (10.3%) of the health-related expenses for excessive alcohol consumption. Government paid the largest share (60.9%) of the health expenses related to excessive alcohol consumption. The government burden for excessive alcohol consumption is somewhat larger than its role in paying for health care expenses nationally. Based on the 2006 NHEA, federal, state and local governments paid 46.1% of national health expenditures. Private health insurance also paid a substantial share (22.4%) of health care costs for excessive alcohol consumption. The remaining costs (6.4%) were paid by other sources.
2. Productivity Losses
We divided productivity losses into four groups of losses and discuss each separately below. These groups are morbidity related, mortality related, crime related and other. In this section, lost earnings were allocated across the members of society affecting both the excessive drinker and their household as well as other members of society. We assumed other members of society are affected mainly because of lost federal and state and local government revenues accruing through taxes. We estimated the share of lost earning borne by government based on the share of Net National Product received by government. In 2006, Net National Product was $11,632.7 billion (29). In 2006, federal and state/local government receipts were $2,407.3 billion (30) and $1,811.4 billion (31), respectively. Thus, federal and state/local receipts represented 20.7% and 15.6% of national income, respectively. We allocated productivity losses associated with morbidity-related losses to state/local and federal government based on these shares. The remainder of lost earnings was assumed to be borne by the excessive drinker and his/her household, as were household productivity losses.
a. Morbidity
Morbidity related losses include earnings losses from the traditional model and associated household productivity losses. Morbidity related losses also include losses related to days lost to institutionalization and hospitalization and FAS. These losses were assumed to be borne by the excessive drinker and their household as well as the government because of reduced tax revenue. Because a child with fetal alcohol syndrome is assumed to be part of the excessive drinker’s household, FAS productivity losses were assigned to the household of the excessive drinker, while the government lost tax revenue associated with lost earnings.
The resulting estimates indicated that 66.1% of morbidity related losses were borne by the excessive drinker and their household. The remaining 33.9% of the losses were borne by government.
b. Mortality
Losses associated with death were first allocated to government based on the share of these lost earnings that would have accrued to federal and state and local government. Then, private life insurance was assumed to have paid $22,957 per death (based on total life insurance disbursements of $55.7 billion in 2006 (32) divided by the 2,426,264 resident deaths in 2006). Remaining losses associated with victims were allocated to victims. Victims, in this case refers to homicide or child maltreatment deaths and the 36% of the mortality for motor-vehicle crashes representing passengers

Final Report Economic Cost of Excessive Alcohol Consumption
58
and non-intoxicated pedestrians killed in these crashes (33). The remaining losses for mortality were assigned to the excessive drinker and their household. Overall, 44.2% of mortality losses were borne by the excessive drinker and their household, 36.3% by the government, 16.6% by victims of excessive drinkers, and 2.9% by private insurance.
c. Crime Losses
Productivity losses associated with incarceration were assigned to the excessive drinker and their household with the exception of the government’s loss of tax revenue. Lost productivity for victims of crime was attributed to the victims with the exception of the government’s tax losses.
d. Other
Losses related to increased absenteeism were assumed shared by government (reduced tax revenues) and others in society who bear the decrease in productivity. None of these losses were borne by the excessive drinker and their household, 36.3% were assumed to be borne by government, and the remaining 63.7% was assumed to be borne by employers and other workers.
e. Summary
Overall, 54.6% of productivity losses were borne by the excessive drinker and their household, 35.1% by government, 7.5% by victims and the remainder by private health insurance and others in society. These estimates were similar to those of Harwood (1998) who found about 59% of productivity losses were borne by the excessive drinker and 34% by government.
3. Other Costs
Other costs were allocated by payer according to the following methods:
Crime Victim Property Damage — Fully allocated to crime victims although some of these losses may have been covered by private insurance.
Criminal Justice System Costs — Police protection and legal and adjudication costs were assigned to state and local government. Corrections costs were assigned to the appropriate level of government based on the allocation in Table V-4. Private legal defense costs were assigned to the excessive drinker and their household.
Motor Vehicle Crash Losses — Health and productivity-related motor vehicle crash losses were included above. Based on NHTSA estimates (reference 25, page 59 Table 22), 65% of property damage losses were allocated to private insurance and 35% to the excessive drinker. Legal costs were fully allocated to private insurance; the cost of travel delays was allocated to other.
Fire Losses — Since local government typically provides fire protection services, we allocated the $1,572 million in fire protection service costs to state and local government. Overall fire damage losses in 2006 were $11.3 billion. Fire insurance premiums were $9.4 billion or 83% of total losses. Thus, the majority of property losses were covered by insurance. Therefore, for the remaining $565 million in property losses, we assumed that the majority of damage (75%) was paid for by private insurance and the remainder by the alcohol excessive drinker and their household.

Final Report Economic Cost of Excessive Alcohol Consumption
59
Fetal Alcohol Syndrome Special Education — Fully allocated to state and local government as they bear primary responsibility for public education.
Based on these methods, overall, government bore the largest share of the losses in the other cost group (60.3%), followed by private insurance and others in society (33.6%). The remainder was borne by excessive drinkers and their families. Criminal justice system and motor vehicle crash related costs make-up the largest share of other costs. Criminal justice system costs were paid almost exclusively by government (98.9%). Motor vehicle crash costs were paid mainly by others in society (85.8%) including private insurance and the general public.

Final Report Economic Cost of Excessive Alcohol Consumption
60
Table VI-3: Distribution of Burden of Excessive Alcohol Consumption in the United States, 2006 (in millions)
Cost Category Total Cost
Excessive Drinker and
Their Household
Government Private
Insurance Victims
Others in Society Total Federal State/Local
Health Care Costs
Alcohol Abuse and Dependence $10,668.457 $824.777 $7,999.485 $2,627.296 $5,372.189 $1,188.213 $0.000 $655.983
Primary Diagnoses Attributable to Alcohol $8,526.822 $1,400.595 $3,747.446 $3,120.436 $627.010 $2,761.073 $0.000 $617.707
Inpatient Hospital $5,115.568 $567.521 $2,432.093 $2,123.446 $308.647 $1,776.349 $0.000 $339.604
Physician Office and Hospital Ambulatory Care $1,195.946 $201.692 $411.080 $320.031 $91.049 $451.620 $0.000 $131.554
Nursing Home Care $1,002.888 $261.814 $601.331 $413.583 $187.749 $74.111 $0.000 $65.631
Retail Pharmacy and Other Health Professional $1,212.420 $369.569 $302.941 $263.377 $39.565 $458.992 $0.000 $80.918
Fetal Alcohol Syndrome $2,538.004 $306.345 $1,168.864 $850.054 $318.810 $878.488 $0.000 $184.306
Other Health System Costs $2,822.308 $0.000 $2,046.402 $1,525.002 $521.400 $668.371 $0.000 $107.535
Prevention and Research $1,207.120 $0.000 $1,207.120 $1,143.025 $64.096 $0.000 $0.000 $0.000
Training $29.527 $0.000 $10.708 $6.110 $4.598 $0.000 $0.000 $18.819
Health Insurance Administration $1,585.660 $0.000 $828.573 $375.866 $452.707 $668.371 $0.000 $88.716
Total, Health Care Costs $24,555.591 $2,531.717 $14,962.197 $8,122.788 $6,839.409 $5,496.145 $0.000 $1,565.532
Productivity Losses
Impaired Productivity $79,158.009 $49,294.662 $27,162.562 $15,499.664 $11,662.897 $0.000 $0.000 $2,700.785
Traditional Earnings $74,101.827 $47,228.154 $26,873.673 $15,334.817 $11,538.856 $0.000 $0.000 $0.000
Household Productivity $5,355.629 $5,355.629 $0.000 $0.000 $0.000 $0.000 $0.000 $0.000
Absenteeism $4,237.580 $0.000 $1,536.795 $876.935 $659.860 $0.000 $0.000 $2,700.785
Institutionalization/Hospitalization $2,053.308 $1,308.658 $744.650 $424.917 $319.733 $0.000 $0.000 $0.000
Mortality $65,062.211 $28,767.404 $23,595.378 $13,464.136 $10,131.241 $1,909.566 $10,789.863 $0.000
Incarcerations $6,328.915 $4,033.679 $2,295.236 $1,309.721 $985.515 $0.000 $0.000 $0.000
Victims of Crime $2,092.886 $0.000 $759.003 $433.107 $325.896 $0.000 $1,333.882 $0.000
Fetal Alcohol Syndrome $2,053.748 $1,308.939 $744.810 $425.008 $319.802 $0.000 $0.000 $0.000
Total, Productivity Losses $161,286.103 $88,002.462 $56,549.545 $32,268.642 $24,280.903 $1,909.566 $12,123.745 $2,700.785
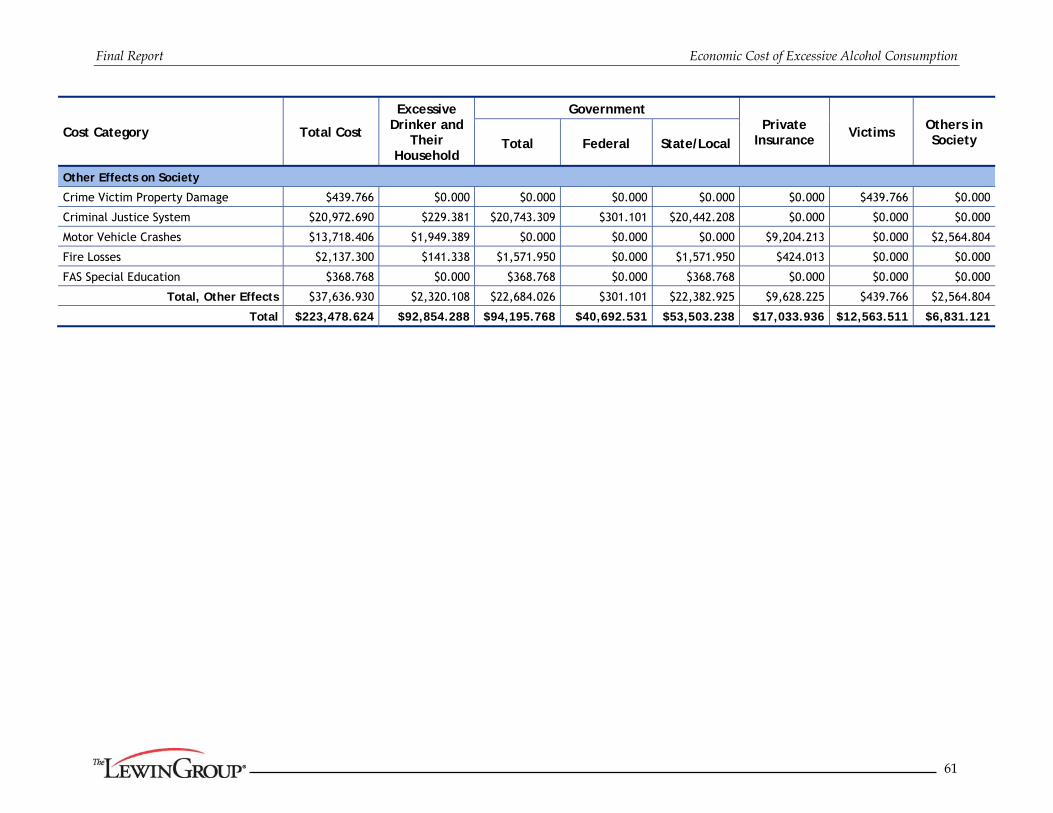
Final Report Economic Cost of Excessive Alcohol Consumption
61
Cost Category Total Cost
Excessive Drinker and
Their Household
Government Private
Insurance Victims Others in
Society Total Federal State/Local
Other Effects on Society
Crime Victim Property Damage $439.766 $0.000 $0.000 $0.000 $0.000 $0.000 $439.766 $0.000
Criminal Justice System $20,972.690 $229.381 $20,743.309 $301.101 $20,442.208 $0.000 $0.000 $0.000
Motor Vehicle Crashes $13,718.406 $1,949.389 $0.000 $0.000 $0.000 $9,204.213 $0.000 $2,564.804
Fire Losses $2,137.300 $141.338 $1,571.950 $0.000 $1,571.950 $424.013 $0.000 $0.000
FAS Special Education $368.768 $0.000 $368.768 $0.000 $368.768 $0.000 $0.000 $0.000
Total, Other Effects $37,636.930 $2,320.108 $22,684.026 $301.101 $22,382.925 $9,628.225 $439.766 $2,564.804
Total $223,478.624 $92,854.288 $94,195.768 $40,692.531 $53,503.238 $17,033.936 $12,563.511 $6,831.121

Final Report Economic Cost of Excessive Alcohol Consumption
62
D. Economic Costs Associated with Binge Drinking
In this section, we estimate the portion of the loss associated with excessive alcohol consumption that is attributable to binge drinking. Where data specific to defining binge drinking were not available, we made an approximation given the data source. For example, our estimates of binge drinking include some of the costs associated with specialty treatment costs for diagnosed alcohol abuse and dependence based on the proportion of persons who met diagnostic criteria for these conditions in the past 12 months who also reported binge drinking at least once a month (68.5%) based on analysis of the NESARC. This assured that we only attributed to binge drinking the proportion of costs associated with alcohol abuse and dependence that involved persons who were also current binge drinkers. Conversely, this approach recognized that a portion of the economic costs associated with alcohol abuse and dependence may be attributable to factors other than current excessive drinking, including chronic health problems that resulted from prior excessive drinking and the residual impact of prior excessive drinking on other outcomes, including employment and wages. Table VI-4 shows our methods for allocating cost categories to binge drinking.
Table VI-4: Approach to Assigning Costs Associated with Binge Drinking
Cost Category Method for Allocation
Health Care Costs
Alcohol Abuse and Dependence Based on the share of individuals in NESARC wave I with symptoms for abuse or dependence in the last 12 months who reported binge drinking in the last month (68.5%)
Primary Diagnoses Attributable to Alcohol
Costs related to acute conditions fully attributed to binge drinking. Costs related to chronic conditions not attributed. Since the share of NHEA pharmacy costs attributed to alcohol was estimated based on the share of ambulatory care costs attributed to alcohol, the share of pharmacy costs attributed to binge drinking was calculated using the same percentage as for ambulatory care.
Inpatient Hospital
Physician Office and Hospital Ambulatory Care
Nursing Home Care
Retail Pharmacy and Other Health Professional
Fetal Alcohol Syndrome Attributed to binge drinking based on the share of women of childbearing age (18-49) who drank any alcohol in the past 30 days who also binge drank in the last 30 days (42.2%) as calculated in the NSDUH 2006.
Other Health System Costs
Prevention and Research Attributed based on the overall share of costs of primary diagnoses attributable to alcohol and FAS costs attributed to binge drinking [($4,154+$1,071)/($8,518+$2,538)=47.3%].
Training Attributed based on the overall share of costs of primary diagnoses attributable to alcohol and FAS costs attributed to binge drinking [($4,154+$1,071)/($8,518+$2,538)=47.3%].
Health Insurance Administration
Attributed based on the share of the associated health expenditures attributed to binge drinking (68.5% of insurance administration costs related to alcohol abuse and dependence and 48.8% of insurance administration costs related to primary diagnoses attributable to alcohol and FAS)

Final Report Economic Cost of Excessive Alcohol Consumption
63
Cost Category Method for Allocation
Productivity Losses
Impaired Workplace Productivity - Traditional Earnings 68.5% based on the share of individuals in NESARC wave I with symptoms
for abuse or dependence in the last 12 months who reported binge drinking in the last month. Impaired Workplace Productivity -
Household Productivity
Impaired Workplace Productivity - Absenteeism Fully attributed to binge drinking.
Institutionalization/Hospitalization 68.5% of losses related to specialty treatment allocated to binge drinking based on the share of the dependent and abusing population who binge drink. Hospitalized days for acute conditions allocated to binge drinking.
Mortality
Deaths related to homicide, motor vehicle crashes and acute conditions fully attributed to binge drinking. 68.5% of deaths related to alcohol abuse or dependence attributed based on the share of the dependent and abusing population who binge drink.
Incarcerations Attribution required intoxication at the time of the crime, thus fully attributed to binge drinking.
Victims of Crime Attribution of crime required intoxication at the time of the crime, thus fully attributed to binge drinking.
Fetal Alcohol Syndrome Attributed to binge drinking based on the share of women of childbearing age (18-49) who drank any alcohol in the past 30 days who also binge drank in the last 30 days (42.2%) as calculated in the NSDUH 2006.
Other Effects on Society
Crime Victim Property Damage Attribution of crime required intoxication at the time of the crime, thus fully attributed to binge drinking.
Criminal Justice System Attribution of crime required intoxication at the time of the crime or alcohol crime. Fully attributed with the exception of liquor law violation costs.
Motor Vehicle Crashes Attribution of crash required intoxication at the time of the crash, therefore fully attributed.
Fire Losses Fully attributed to binge drinking.
FAS Special Education Attributed to binge drinking based on the share of women of childbearing age (18-49) who drank any alcohol in the past 30 days who also binge drank in the last 30 days (42.2%) as calculated in the NSDUH 2006.
Overall, 76.4% of costs associated with excessive alcohol consumption were attributed to binge drinking. The share of excessive alcohol consumption costs allocated to binge drinking was lower for health system direct costs (57.1%) than for productivity losses (74.2%) and other costs (98.1%) (Table VI-5).
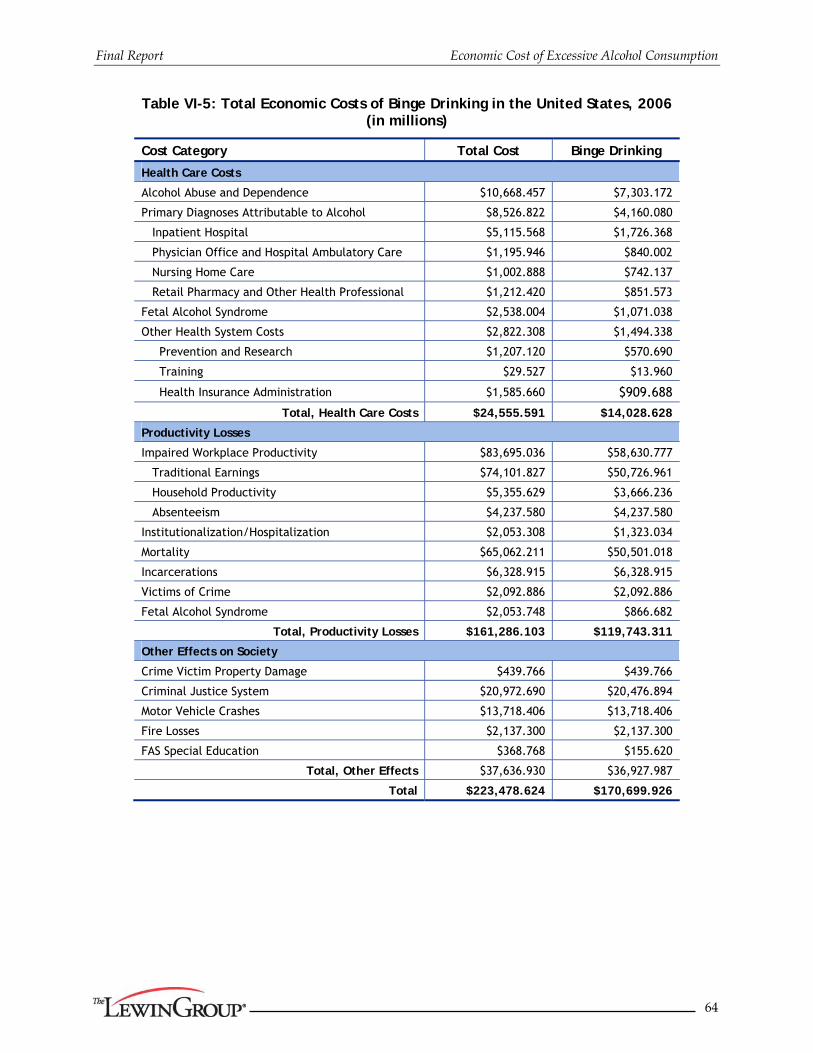
Final Report Economic Cost of Excessive Alcohol Consumption
64
Table VI-5: Total Economic Costs of Binge Drinking in the United States, 2006 (in millions)
Cost Category Total Cost Binge Drinking
Health Care Costs
Alcohol Abuse and Dependence $10,668.457 $7,303.172
Primary Diagnoses Attributable to Alcohol $8,526.822 $4,160.080
Inpatient Hospital $5,115.568 $1,726.368
Physician Office and Hospital Ambulatory Care $1,195.946 $840.002
Nursing Home Care $1,002.888 $742.137
Retail Pharmacy and Other Health Professional $1,212.420 $851.573
Fetal Alcohol Syndrome $2,538.004 $1,071.038
Other Health System Costs $2,822.308 $1,494.338
Prevention and Research $1,207.120 $570.690
Training $29.527 $13.960
Health Insurance Administration $1,585.660 $909.688
Total, Health Care Costs $24,555.591 $14,028.628
Productivity Losses
Impaired Workplace Productivity $83,695.036 $58,630.777
Traditional Earnings $74,101.827 $50,726.961
Household Productivity $5,355.629 $3,666.236
Absenteeism $4,237.580 $4,237.580
Institutionalization/Hospitalization $2,053.308 $1,323.034
Mortality $65,062.211 $50,501.018
Incarcerations $6,328.915 $6,328.915
Victims of Crime $2,092.886 $2,092.886
Fetal Alcohol Syndrome $2,053.748 $866.682
Total, Productivity Losses $161,286.103 $119,743.311
Other Effects on Society
Crime Victim Property Damage $439.766 $439.766
Criminal Justice System $20,972.690 $20,476.894
Motor Vehicle Crashes $13,718.406 $13,718.406
Fire Losses $2,137.300 $2,137.300
FAS Special Education $368.768 $155.620
Total, Other Effects $37,636.930 $36,927.987
Total $223,478.624 $170,699.926

Final Report Economic Cost of Excessive Alcohol Consumption
65
E. Economic Costs Associated with Underage Drinking
We disaggregated the economic cost of excessive alcohol consumption into that portion related to underage drinking, i.e., the share related to drinkers under age 21 years.
1. Methods of allocation to underage drinking
Methods for health system direct costs, productivity losses, and other costs are described in the following sections.
a. Health System Direct Costs
Below, we describe our methods for each category of costs:
Specialty Substance Abuse Treatment — Although the SAMHSA’s SEP project does not typically develop estimates of spending by age, a special study conducted under this project produced SA costs estimates for those under 18 and between age 19-64 (34). Costs for those 19-20 were estimated as a share of costs for those 19-64. Overall, these estimates indicated 19.3% of specialty services were for individuals less than 21.
Primary Diagnoses Attributable to Alcohol — Costs for primary diagnoses attributable to alcohol were estimated based on patient age in the HCUP, NAMCS, NHAMCS, and NNHS files for inpatient, ambulatory, and nursing home care. These estimates indicated 4.1% of alcohol-attributable hospital facility and associated inpatient physician costs were for underage drinkers. The share of ambulatory care costs for underage drinkers was 12.9%. Costs for underage drinking represented 0.23% of nursing home costs. The age of the individual using alcohol-attributable retail pharmacy, non-durable medical equipment and other health professional services could not be directly estimated. Thus, we assumed that the share of these costs attributable to underage drinking was the same as the 12.9% share of ambulatory costs allocated to underage drinking.
Fetal Alcohol Syndrome — Based on analysis of the NSDUH for 2006, the share of women of child-bearing age who were excessive drinkers who were less than 21 was 18.2 percent. Thus, we assumed 18.2% of FAS costs were related to underage drinking.
Prevention, Research and Training — Prevention programs targeted at youth including Safe and Drug Free Schools and Communities, ONDCP National Youth Anti-Drug Media Campaign, and Enforcing Underage Drinking Laws were fully allocated to underage drinking. 18.1% of remaining prevention and research costs and of all training costs were allocated to underage drinking based on the share of excessive drinkers who were underage in the NSDUH 2006.
Health Insurance Administration — In parallel to the share of specialty substance abuse treatment costs allocated to underage drinking, we allocated 19.3% of health insurance administration costs related to specialty substance abuse treatment. 6.9% of health insurance administration costs related to primary diagnoses attributable to alcohol were allocated to underage drinking based on the share of medical expenditures for primary diagnoses attributable to alcohol among underage persons.
Overall, 15.1% of health system direct costs for excessive alcohol consumption were allocated to underage drinking.

Final Report Economic Cost of Excessive Alcohol Consumption
66
b. Productivity Losses
(1) Morbidity
Reductions in labor force earnings and household productivity were broken out by age group in Tables IV-4 and IV-6, respectively. Losses for the 18-19 year old group and one-sixth of the losses for the 20-25 year old age group were allocated to underage drinking.
Alcohol-attributable inpatient days were estimated as part of the analysis of the HCUP file in Section III-B.1. Among the alcohol-attributable inpatient days, we estimated 3.5% were for persons under the age of 21 at the time of admission. This share was used to allocate productivity losses related to inpatient days to underage drinking. Analysis of specialty facility treatment expenditures estimated that 19.3% of expenditures were for individuals under age 21. We used this percentage to allocate productivity losses related to inpatient and residential days in specialty treatment to underage drinking.
Productivity costs associated with fetal alcohol syndrome were allocated to underage drinking based on the share of women of child-bearing age who were excessive drinkers who were less than 21 (18.2 percent based on the NSDUH 2006).
(2) Mortality
We divided mortality losses into three groups: motor vehicle crash-related deaths, homicide related deaths, and other deaths.
Motor Vehicle Crash Fatalities — Estimates from the Department of Transportation, National Center for Statistics and Analysis (35) indicated that in 2005, 10.0% of drivers with a BAC greater than .08 in a fatal crash were under the age of 21. We used this proportion to estimate the share of alcohol-attributable motor vehicle fatalities related to underage drinking.
Homicide-Related Fatalities — The share of homicide arrests where the individual was under 21 was estimated based on analysis of Table 4.7 from the Sourcebook of Criminal Justice Statistics Online, 2006 (36). These data indicated that 29.0% of individuals arrested for homicide were under the age of 21. We applied this share to the overall number of alcohol-attributable homicide fatalities to estimate the homicide fatalities attributable to underage drinking.
Other Fatalities — All other alcohol-attributable deaths among individuals 15 to 20 were attributed to underage drinking. This represented 1,110 deaths.
(3) Crime-Related Losses
Using the Survey of Inmates of Local Jails, 2002 and the Survey of State and Federal Inmates, 2004, we estimated that among the jail and prison populations of alcohol-attributable incarcerations 15.7% and 18.6%, respectively, were under the age of 21 at the time of initial incarceration. These shares were used to allocate alcohol-attributable lost productivity related to incarceration to underage drinking.
Victim productivity losses were allocated to underage drinking based on the percentage of alcohol-attributable arrests for individuals 15-20. We excluded alcohol related crimes, DUI,

Final Report Economic Cost of Excessive Alcohol Consumption
67
liquor laws, and public drunkenness from this calculation. We estimated 30.7% of alcohol-attributable arrests were for individuals 15-20.
c. Other Costs
Absenteeism - Losses related to absenteeism were estimated by age group (Table IV-9A). The losses for the 18-19 and one-fifth of the losses for the 20-24 year old group were allocated to underage drinking.
Crime Victim Property Damage — Victim property damage was allocated to underage drinking based on the percentage of alcohol-attributable arrests for property crimes by individuals ages 15-20. We estimated that 38.6% of alcohol-attributable property crime arrests were for individuals 15-20 years of age.
Criminal Justice System — Costs for alcohol crimes were allocated to underage drinking based on the share of arrestees who were less than 21 years old, i.e., 25.7%. (The largest share of these arrests was for liquor law violations in which 70.6% of arrestees were less than 21.) Other police protection, legal and adjudication, and private legal costs were allocated based on the percentage of arrestees for non-alcohol crimes who were less than 21, i.e., 30.7%. Corrections costs were estimated based on the share of incarcerated persons who were under age 21 at the time of their initial incarceration. Among the jail and prison populations of alcohol-attributable arrestees, the under 21 estimates were 15.7% and 18.6%, respectively; these shares of correctional costs for local and state/federal governments were allocated to underage drinking.
Motor Vehicle Crash — Estimates from the Department of Transportation, National Center for Statistics and Analysis (35) indicated that in 2005, 10.0% of drivers with a BAC greater than .08 in a fatal crash were under the age of 21. We used this proportion to estimate the share of alcohol-attributable crash costs from underage drinking.
Fire Losses — 18.1% of the costs were allocated to underage drinking based on the share of excessive drinkers who were under age 21 in the NSDUH 2006.
Fetal Alcohol Syndrome Special Education Costs — These costs were allocated to underage drinking based on the share of women of child-bearing age who were excessive drinkers who were less than 21 (18.2%) based on the NSDUH 2006.
2. Results
Overall, 11.0% of the economic costs of excessive alcohol consumption were related to underage drinking (Table VI-6).

Final Report Economic Cost of Excessive Alcohol Consumption
68
Table VI-6: Total Economic Costs of Underage Drinking in the United States, 2006 (in millions)
Cost Category Total Cost Underage Drinking
Health Care Costs
Alcohol Abuse and Dependence $10,668.457 $2,056.863
Primary Diagnoses Attributable to Alcohol $8,526.822 $524.650
Inpatient Hospital $5,115.568 $212.163
Physician Office and Hospital Ambulatory Care $1,195.946 $154.052
Nursing Home Care $1,002.888 $2.261
Retail Pharmacy and Other Health Professional $1,212.420 $156.174
Fetal Alcohol Syndrome $2,538.004 $461.917
Other Health System Costs $2,822.308 $663.115
Prevention and Research $1,207.120 $470.657
Training $29.527 $5.344
Health Insurance Administration $1,585.660 $187.113
Total, Health Care Costs $24,555.591 $3,706.544
Productivity Losses
Impaired Productivity $83,695.036 $2,418.299
Traditional Earnings $74,101.827 $2,020.775
Household Productivity $5,355.629 $211.000
Absenteeism $4,237.580 $186.524
Institutionalization/Hospitalization $2,053.308 $363.195
Mortality $65,062.211 $6,777.212
Incarcerations $6,328.915 $3,586.961
Victims of Crime $2,092.886 $641.848
Fetal Alcohol Syndrome $2,053.748 $373.782
Total, Productivity Losses $161,286.103 $14,161.297
Other Effects on Society
Crime Victim Property Damage $439.766 $169.920
Criminal Justice System $20,972.690 $4,700.490
Motor Vehicle Crashes $13,718.406 $1,378.630
Fire Losses $2,137.300 $386.851
FAS Special Education $368.768 $67.116
Total, Other Effects $37,636.930 $6,703.007
Total $223,478.624 $24,570.848
F. Economic Costs Associated with Drinking During Pregnancy
The approach used to allocate costs to drinking during pregnancy was diagnosis based. In particular, costs associated with fetal alcohol syndrome spectrum disorders, spontaneous abortion, and adverse birth outcomes (prematurity, low birth weight, intrauterine growth retardation) were attributed to drinking during pregnancy. These costs include productivity related losses for

Final Report Economic Cost of Excessive Alcohol Consumption
69
premature mortality and institutionalization associated with these diagnoses. Costs for research and prevention efforts by the CDC’s FAS group were also included. The medical treatment costs associated with these conditions represented 0.68% of medical costs for primary diagnoses attributable to alcohol. Thus, 0.68% of insurance administration costs for primary diagnoses attributable to alcohol were allocated to drinking while pregnant. These costs came to $5,203 million in 2006 (Table VI-7) and FAS accounted for 98% of the costs.
Table VI-7: Total Economic Costs of Drinking During Pregnancy in the United States, 2006
(in millions)
Cost Category Total Cost
Health Care Costs
Primary Diagnoses Attributable to Alcohol $58.309
Inpatient Hospital $44.835
Physician Office and Hospital Ambulatory Care $6.484
Nursing Home Care $0.465
Retail Pharmacy and Other Health Professional $6.524
Fetal Alcohol Syndrome $2,538.004
Other Health System Costs $16.068
Prevention and Research $9.856
Health Insurance Administration $6.183
Total, Health Care Costs $2,612.401
Productivity Losses
Institutionalization/Hospitalization $2.505
Mortality $165.581
Fetal Alcohol Syndrome $2,053.748
Total, Productivity Losses $2,221.834
Other Effects on Society
Fetal Alcohol Syndrome Special Education $368.768
Total, Other Costs $368.768
Total $5,203.002
G. Comparison to Previous Estimates
In this section, we compare the 2006 cost estimates to the Harwood-estimated costs for 1992 and 1998. We note key differences in the methods between the current study and the Harwood ones which likely affected the estimates.
1. Aggregate Cost Categories
The overall annualized increase in total cost was 3.0% (Table VI-8). The annual increase in health expenditures of 2.1 percent was substantially below the 5.4 percent annual increase that would have been expected from population growth (1.2 percent) + the CPI for medical services (4.2 percent) in this period. Similarly, the 3.0 percent annual increase in productivity losses was below the 4.4 percent annual growth anticipated from combined annual population (1.2 percent

Final Report Economic Cost of Excessive Alcohol Consumption
70
and wage growth (3.2 percent). Annual increases in other costs were closer to those that would be anticipated (3.7%) from changes in population (1.2%) and general price inflation (2.7 percent) based on the CPI for all services.
Table VI-8: Comparison of Alcohol Cost Estimates in 1992, 1998 and 2006 Studies (in millions)
Cost Category 1992 1998 2006 Annualized
Increase 1992-2006
Health System $18,360 $25,682 $24,556 2.1%
Productivity $106,997 $134,204 $161,286 3.0%
Other Costs $22,663 $24,749 $37,637 3.7%
Total Cost $148,021 $184,635 $223,479 3.0%
Figure VI-1 compares the study estimates to estimates developed based on simply inflating the 1998 estimates to 2006 based on population and price increases over this period. Based on inflation and population growth, the estimated cost would be expected to be $265 billion in contrast to $223 billion estimate from this study. Based on inflation and population growth productivity losses would be expected to be $192 billion vs. the $161 billion estimated; health losses would be $40 billion vs. the $25 billion estimated; and other costs would have been $34 billion versus the $38 billion estimated.
Figure VI-1 Total Expenditures, 2006
Analytic Study versus Inflation-Based Estimate* (in millions)
* Analytic estimate for 2006 is the estimate developed in the current study. Inflation-Based estimate is Harwood’s estimate of 1992 expenditures inflated to 2006 based on population growth and price inflation.

Final Report Economic Cost of Excessive Alcohol Consumption
71
Figure VI-2 compares the distribution of costs categories in Harwood’s 1992 and 1998 estimates and the current 2006 estimate. Shares are relatively constant with productivity costs representing the vast majority of costs (about 72%) and health and other costs having almost equal shares of the remainder. The share of costs represented by other costs in the current estimates was slightly higher than in 1992, while the share of costs represented by health care was slightly lower. The increase in the share of costs represented by other costs was related mainly to substantial increases in criminal justice system costs. The decline in the share related to health care costs was primarily due to changes in the conditions and attribution factors used to estimate expenditures.
Figure VI-2 Total Expenditure Share of Cost of Excessive Alcohol Consumption, by Category
1992, 1998 and 2006 (in millions)
2. Health System Direct Costs
We estimated $24.6 billion in health care expenditures attributed to alcohol in 2006 (Table VI-9). Compared to Harwood’s estimate of 1992 expenditures ($18.4 billion), the annual increase in health expenditures of about 2.1 percent was substantially below inflation related increases in health care of 4.2 percent as measured by the CPI for medical services in this period. The meager estimated annual increase in health expenditures was related to changes in method that have made the current estimate more conservative than Harwood’s.
SAMHSA’s MH and SA treatment spending estimates were not available in 1998 when the most recent estimates of the economic costs of alcohol abuse were developed by Harwood. However, the methods used to develop SAMHSA’s spending estimates were very similar to those used by Harwood.

Final Report Economic Cost of Excessive Alcohol Consumption
72
Attribution factors and conditions attributable to alcohol were updated. Several common conditions including diabetes and pneumonia were no longer counted as attributable to alcohol because good AAF data were lacking. A comparison of the conditions and attribution factors used in this study and those used in Harwood (1998) is provided in Appendix G.
The 2006 health system cost estimate excludes medical expenses related to comorbid alcohol diagnoses, because we were unable to adjust for confounding factors. These costs represented $881 million or 4.8% of health system costs in the 1992 estimate. The 2006 nursing home estimates addressed all alcohol-attributable diagnoses, whereas the earlier Harwood studies only included admissions for alcohol abuse and dependence. The estimate of FAS prevalence (1 per 1,000 births) was much more conservative than the 1992 estimate (2 per 1,000 births). Using the Harwood prevalence rate would double the estimated costs for 2006. Finally, the estimated training costs in the current study were more conservative than the 1992 study. Training costs did not include costs for training physicians, nurses, clergy, and law enforcement officers because data on the level of training received and cost of providing the training was unavailable.
Table VI-9: Comparison of Estimates to Major Recent Studies Total Health Care Expenditures, 1992, 1998 and 2006
(in millions)
Cost Category 1992 1998 2006 Annualized Increase
1992-2006
Specialty Alcohol Treatment Services $4,228 $5,754 $6,536 3.2%
Specialty Alcohol Treatment $4,046 $5,506 $6,144 3.0%
Insurance Administration $182 $248 $393 5.6%
Medical Consequences $12,787 $18,215 $16,783 2.0%
Other Diagnoses Attributable to Alcohol (excl. FAS) $10,667 $15,196 $13,052 1.5%
Medical Consequences of Fetal Alcohol Syndrome $1,484 $2,113 $2,538 3.9%
Insurance Administration $636 $906 $1,193 4.6%
Other Health System Costs $1,346 $1,713 $1,237 -0.6%
Prevention and Research $1,272 $1,623 $1,207 -0.4%
Training $73 $90 $30 -6.3%
Total $18,360 $25,682 $24,556 2.1%
3. Productivity Losses
$161.3 billion in productivity losses were attributed to alcohol in 2006 compared to Harwood’s estimate of $107.0 billion in 1992, an annual increase of about 3.0 percent (Table VI-10).
The 1992 study used a simulation approach and the National Longitudinal Alcohol Epidemiologic Survey to estimate productivity losses related to alcohol dependence. This study used a two-part regression model and the NESARC. Despite these differences, the findings were of a similar magnitude and both studies were unable to identify losses for women. The current estimate included losses related to increased absenteeism among binge drinkers; this item was not included in the Harwood estimates. On the other hand, Harwood included lost productivity from increased length of hospital stay associated with comorbid conditions, but this study did not. As

Final Report Economic Cost of Excessive Alcohol Consumption
73
noted previously, the FAS prevalence was half the 1992 estimate; using the Harwood prevalence rate would double the estimated costs for FAS in 2006.
Table VI-10: Comparison of Estimates to Major Recent Studies Total Productivity Losses, 1992, 1998, and 2006
(in millions)
Category of Loss 1992* 1998 2006 Annual
Increase 1992-2006
Morbidity Losses $69,209 $87,621 $87,802 1.7%
Lost Productivity from Alcohol Related Morbidity (excluding FAS) $68,219 $86,368 $81,511 1.3%
Absenteeism Due to Binge Drinking NA NA $4,238 NA
Fetal Alcohol Syndrome $990 $1,253 $2,054 5.4%
Mortality Losses $31,327 $36,498 $65,062 5.4%
Motor Vehicle Crashes $8,023 $8,592 $17,622 5.8%
Other Alcohol-Related $23,304 $27,906 $47,440 5.2%
Crime-Related Losses $6,461 $10,085 $8,422 1.9%
Incarcerations $5,449 $9,097 $6,329 1.1%
Victims of Crime $1,012 $988 $2,093 5.3%
Total $106,997 $134,204 $161,286 3.0%
* Estimates in the 1992 report were rounded to the nearest million dollars.
The 1992 study attributed 107,360 deaths to alcohol; the current study 83,180. The number of deaths caused by alcohol dependence and abuse was similar in 1992 and 2006 (6,005 versus 6,643). Likewise the number of deaths related to acute injuries was comparable (45,349 versus 46,825). However, the number of deaths from chronic conditions that were fully or partially attributable to alcohol was substantially higher in the 1992 estimate than the 2006 estimate (about 56,006 versus 29,712) (see Table 5.3 on pages 5-5 and 5-6 in reference 3). A small portion of deaths (5-8 percent) related to several common conditions (diabetes mellitus, essential hypertension, cerebrovascular disease, pneumonia and influenza) were attributed to alcohol in the 1992 study. The current study did not include these conditions. In addition, for several types of malignant neoplasms (i.e., oropharyngeal, esophageal, and larynx), the attribution factors in the current study were substantially lower than those used in the 1992 study (see Appendix G). Despite the changes in attribution, this study found a substantial increase in losses related to mortality. The 1992 study used a 6% discount rate while the current study used a 3% discount rate. The estimate of mortality losses from the 1992 study using a 3% discount rate would be $45,718 million.
Harwood valued productivity losses related to incarcerated individuals at the mean wage for individuals of the same gender. Harwood asserted that the productivity of these individuals should be valued at the average wage because the observed decrement between the earning potential of these individuals in absence of incarceration and the general population is likely to be attributable to alcohol problems. However, the current study used a far more conservative approach valuing these losses at minimum wage since these individuals have lower human capital than average individuals. Had we used the previous Harwood approach, the loss would have been $20.3 billion versus the $6.3 billion estimated (Appendix E, Table E-1).

Final Report Economic Cost of Excessive Alcohol Consumption
74
4. Other Costs
Overall, $37.6 billion in losses were related to other costs compared to Harwood’s estimate of $22.7 billion for 1992, representing an annual increase of 3.7 percent (Table VI-11).
The methods for estimating crime victim and criminal justice system costs in this study were similar to those used by Harwood. The substantial increase in costs was mainly related to the increase in criminal justice system related loss from $6.3 billion in 1992 to $21.0 billion for 2006, a 9.0% annual increase (The rate of increase for criminal justice system expenditures generally in this period was 5.9 percent annually). The remainder of the difference was related to differences in crime categories and attribution factors. The current study used higher attribution factors for homicide, forcible rape, other assaults, and property crimes and two crime categories were added—vandalism and offenses against family and children (see Table II-4).
Table VI-11: Comparison of Estimates to Major Recent Studies Total Other Losses, 1992, 1998, and 2006
(in millions)
Categories 1992* 1998 2006 Annual Increase
1992-2006
Crime Related Costs $19,930 $22,072 $35,676 4.2%
Crime Victim Property Damage Costs $28 $28 $440 21.7%
Criminal Justice System $6,283 $6,300 $20,973 9.0%
Motor Vehicle Crashes* $13,619 $15,744 $13,718 0.1%
Other Costs $2,733 $2,677 $2,506 -0.6%
Fire Losses $1,590 $1,537 $2,137 2.1%
FAS Special Education Costs $460 $656 $369 -1.6%
Social Welfare $683 $484 NA NA
Total $22,663 $24,749 $37,637 3.7%
* Driving under the influence of alcohol is a crime in all states. Even though not all the perpetrators were caught, we attributed DUI to crime just as for other crimes where the perpetrator might not have been apprehended..
While Harwood attributed 6.1 and 11.2 percent of structural damage and fire protection service costs, respectively to alcohol based on a 1973 literature review (37), we used a five percent attribution. As noted previously, the current study used an estimate of FAS prevalence half that used in Harwood (1998). Harwood et al. (1998) included costs related to social welfare program spending related to alcohol use. Beginning in March 1995, alcohol-related diagnoses were no longer qualifying diagnoses for eligibility for Social Security Disability. Therefore, this study did not include social welfare expenditures as an alcohol-attributable societal cost.
H. Limitations
This study likely underestimated the cost of excessive alcohol consumption for many reasons, but mostly because we excluded categories of cost where strong scientific evidence was lacking to precisely estimate the loss.

Final Report Economic Cost of Excessive Alcohol Consumption
75
1. Healthcare
The 54 alcohol-attributable conditions and the AAFs for chronic conditions that were used to assess health care costs in this study were adopted from the ARDI system. These AAFs are conservative, particularly the indirect estimates that are calculated using self-reported alcohol consumption from surveys which tend to underestimate the true prevalence of alcohol use because of underreporting and the inability of surveys to reach high-risk populations. In addition, these estimates were based on alcohol use in the past 30 days, and thus, exclude former excessive drinkers.
In contrast, the AAFs that we used for acute conditions (i.e., injuries) largely came from studies conducted in emergency department settings. These AAFs will tend to underestimate alcohol involvement because alcohol use by persons treated in ED settings tends to be under-reported, particularly if patients with alcohol-attributable injuries delay in seeking treatment. Furthermore, AAFs obtained in ED setting probably underestimate alcohol involvement for persons hospitalized for alcohol-attributable injuries because alcohol involvement tends to increase with injury severity.
Although alcohol is widely believed to be a risk factor for tuberculosis, pneumonia, and hepatitis C, no costs related to these conditions were attributed to alcohol because no consensus AAFs were available, and they were thus not included in ARDI.
Morbidity and mortality estimates were based on the primary cause, and thus, alcohol-associated contributing causes were not considered.
The costs related to comorbid conditions attributable to alcohol were not included although alcohol-related comorbidities are associated with significant increases in length of hospital stay. These costs were included in the Harwood study, but excluded from the current study because we were unable to adjust for potential confounding factors in the available data.
The estimate of federal hospital costs (Table III-4) assumed the same relative cost proportion attributable to alcohol as for community hospitals. To the extent that excessive alcohol consumption differs in the two clienteles we may have incorrectly estimated the federal share.
Ambulatory care costs associated with alcohol-attributable diagnoses were estimated using conservative parameters. Prior to calculating the mean cost per ambulatory visit from the MEPS data, we truncated the reported distribution of expenditures at the 95th percentile to reduce the influence of outliers on the means. This approach substantially reduced our estimate of the cost per visit, i.e., from $152 to $143 for emergency department visits – admitted, $738 to $607 for emergency department visit – not admitted, $690 to $539 for hospital outpatient department visits and $161 to $112 for an office visit.
Long term care calculations only included nursing homes. The long term care costs of many alcohol-related injuries like spinal cord injury and traumatic brain injury were not captured and could be considerable.
In contrast to Harwood 1998, the accounting for training costs in this study did not include costs for training physicians, nurses, clergy, and law enforcement officers. Although, these

Final Report Economic Cost of Excessive Alcohol Consumption
76
individuals receive training related to alcohol problems, data on the level of training received and the cost of providing the training was not available.
2. Productivity
The productivity loss estimates were conservative for several reasons. First, no productivity losses related to alcohol dependence were estimated for women. From the biologic point of view, women face similar outcomes from excessive alcohol consumption as men. Our inability to estimate a loss for women was more likely related to variability in women’s labor force participation and the lack of inclusion of measures explaining this variability in available data sources rather than biology.
We were unable to assess productivity losses due to non-dependent excessive alcohol consumption, e.g., presenteeism.
The estimates for absenteeism related to binge drinking were based on the NSDUH which does not distinguish between number of drink cut points for men and women, i.e., it uses 5 or more drinks on a single occasion to define binge drinking for both sexes. Research has shown this underestimates binge drinking among women by about 35% (38). Moreover, we did not include the $4.4 billion cost of absenteeism for alcohol-dependent drinkers (Table IV-9B) because of the possibility that some portion of these costs might overlap with diminished earnings.
Mortality estimates were based on the underlying cause of death, and thus, contributing causes of death which related to alcohol were not considered. Similarly, while days lost to institutionalization were included for primary diagnoses attributable to alcohol, losses related to institutional days for secondary (comorbid) diagnoses attributable to alcohol were not included.
Productivity losses associated with DUI conviction were not included in this study, e.g., loss of driving privileges and difficulty finding employment and keeping a job.
Productivity losses for family members who care for a sick or injured drinker were not included.
3. Other Costs
For the analysis of alcohol-attributable motor vehicle traffic crash costs, we used a 0.10 g/dL cutpoint to define such crashes. This assumption was very conservative, as scientific evidence suggests that there are attributable costs for even minimally impaired drivers. Moreover, in all states the legal limit for operating a motor vehicle is a BAC less than 0.08 g/dL. To assess the effect of using a lower limit to define these costs, we used data from the NHTSA report by Blinco which showed the incidence of “alcohol-caused” crashes by maximum injury severity (MAIS) level and reported that the AAF for such nonfatal crashes was 0.069 (page 42). We re-estimated motor vehicle crash losses with these data. Appendix Table F-2 shows the calculation of alcohol-caused crash losses related to insurance administration (excluding medical insurance), legal costs, travel delays, and property damage in 2000. These costs were trended to 2006 in Table F-3. Table F-4 shows a comparison of costs for our base case vs “alcohol-caused.” Estimated losses increased by $785 million or 4.9 percent using “alcohol-caused” as a criterion.

Final Report Economic Cost of Excessive Alcohol Consumption
77
4. Overall
This study drew on medical claims based files and survey self-reports for alcohol diagnoses and consumption. Both sources tend to under-report excessive alcohol consumption. We followed the PHS method for estimating societal cost of illness and, thus, no intangible or averting costs were estimated, e.g., pain, suffering, bereavement. A recent study (39) estimated the cost of underage drinking at $61.9 billion for 2001. Decreased quality of life (an intangible cost) accounted for 67 percent of total costs ($41.6 billion). Should a similar relationship apply here, we substantially underestimated the costs of excessive alcohol consumption by more than half.
Even though the prevalence of fetal alcohol syndrome in this study was far more conservative than that used by Harwood (1998), it is important to appreciate that many subclinical cases are not recognized in either prevalence estimate.
Estimates of crime-related costs were also conservative. The attribution factors were developed based on self-reports of consumption which were likely to be underreported. For example, even those convicted of alcohol crimes like DUI did not all report drinking (Table II-3). In addition, although alcohol was likely a factor in crimes where the offender was drinking at the time of the offense, but not intoxicated, those crimes were not attributed to alcohol. Moreover, this study only focused on certain index crimes and costs associated with other categories of crime that may have been alcohol-attributable were not included. On the other hand, because estimates were based on incarcerees, to the extent that alcohol use influences the likelihood of getting apprehended, there may be overestimation of the AAF. This potential overestimation would only apply, however, to victim-based estimates of crime costs (~6% of crime costs).
The costs attributed to underage drinking were very conservative. The AAFs for injury are likely higher for underage drinkers than for older drinkers, however, age-specific AAFs were only available for fatal motor-vehicle traffic injuries. In addition, although early age of drinking onset and heavy alcohol consumption at an early age have been associated with increased negative long-term consequences and costs (40-45), these long-term costs were excluded from the economic costs estimates for underage drinking in the interest of focusing on current expenditures as is typical in cost studies of this nature.
Scientific evidence suggested that alcohol plays a causal role in producing mental disorders and psychosocial damage in the drinker and their family. Because the relationship between alcohol consumption and mental disorders is complex and the evidence related to alcohol’s causal role is limited, these costs were not been included in this study.
In future analysis, addition of the following components to the cost estimates would provide a more comprehensive estimates of the losses related to alcohol:
Morbidity losses related to reduced earnings for women; and
Costs to employers including costs associated with reduced performance at work that have not been captured by the reduced earnings estimates.
In the meantime, it is clear that excessive drinking resulted in at least $223.5 billion in economic costs in the U.S. in 2006. According to the National Institute on Alcohol Abuse and Alcoholism, 7,538,026,000 total gallons of beer, wine, and spirits were consumed in the U.S. in 2006 (46). Considering the $94.2 billion paid by government for excessive alcohol consumption (Table VI-3),

Final Report Economic Cost of Excessive Alcohol Consumption
78
this cost amounted to $12.50 per gallon of alcoholic beverages consumed. On a per capita basis, the societal cost of excessive alcohol consumption was approximately $746 for each man, woman, and child in the U.S. in 2006. (reference 47: 2006 population = 299,398,484).
Our estimates reflect not only the substantial health impact of excessive drinking, but the significant social impact of this behavior as reflected in the cost of alcohol-attributable crime and productivity losses. Unfortunately, however, the response to this problem has not been commensurate with the health and social impact that has been conservatively attributed to it. Evidenced-based strategies to prevent excessive drinking − including increasing alcohol excise taxes, limiting alcohol outlet density, and enforcing the age 21 minimum legal drinking age − are available but are underutilized and some of these interventions (e.g., increasing alcohol excise taxes) could even be used to help provide the funds needed to support other prevention and treatment activities.

79
Appendix A: Alcohol-attributable Diagnoses

Final Report Economic Cost of Excessive Alcohol Consumption
80
Table A-1: Alcohol-attributable Chronic Fatal and Non-Fatal Conditions with Diagnosis Codes and AAFs, 2006
Fatal Condition Nonfatal Condition ICD-9 ICD-10 Fatal AAF Nonfatal AAF
100% Alcohol-attributable
Alcoholic psychosis Alcohol induced mental disorders 291 F10.3-F10.9 1.00 1.00
Alcohol abuse Acute alcoholic intoxication, nondependent alcohol abuse
305.0, 303.0 F10.0, F10.1 1.00 1.00
Alcohol dependence syndrome Other and unspecified alcohol dependence 303.9 F10.2 1.00 1.00
Alcoholic polyneuropathy Alcoholic polyneuropathy 357.5 G62.1 1.00 1.00
Degeneration of nervous system due to alcohol * G31.2 1.00 1.00
Alcoholic myopathy * G72.1 1.00 1.00
Alcoholic cardiomyopathy Alcoholic cardiomyopathy 425.5 I42.6 1.00 1.00
Alcoholic gastritis Alcoholic gastritis 535.3 K29.2 1.00 1.00
Alcoholic liver diseases Alcoholic fatty liver, hepatitis, cirrhosis, and liver damage unspecified 571.0-571.3 K70-K70.4,
K70.9 1.00 1.00
Fetal alcohol syndrome Fetal alcohol syndrome 655.4, 760.71 Q86.0 1.00 1.00
Fetus and newborn affected by maternal use of alcohol * P04.3, O35.4 1.00 1.00
Alcohol-induced chronic pancreatitis * K86.0 1.00 1.00
High Causation
Liver cirrhosis, unspecified Liver cirrhosis, unspecified 571.5-571.9 K74.3-K74.6, K76.0, K76.9 0.40 0.40
Acute pancreatitis Acute pancreatitis 577 K85 0.24 0.24
Chronic pancreatitis Chronic pancreatitis 577.1 K86.1 0.84 0.84
Portal hypertension Portal hypertension 572.3 K76.6 0.40 0.40
Gastroesophageal hemorrhage Gastroesophageal hemorrhage 530.7 K22.6 0.47 0.47
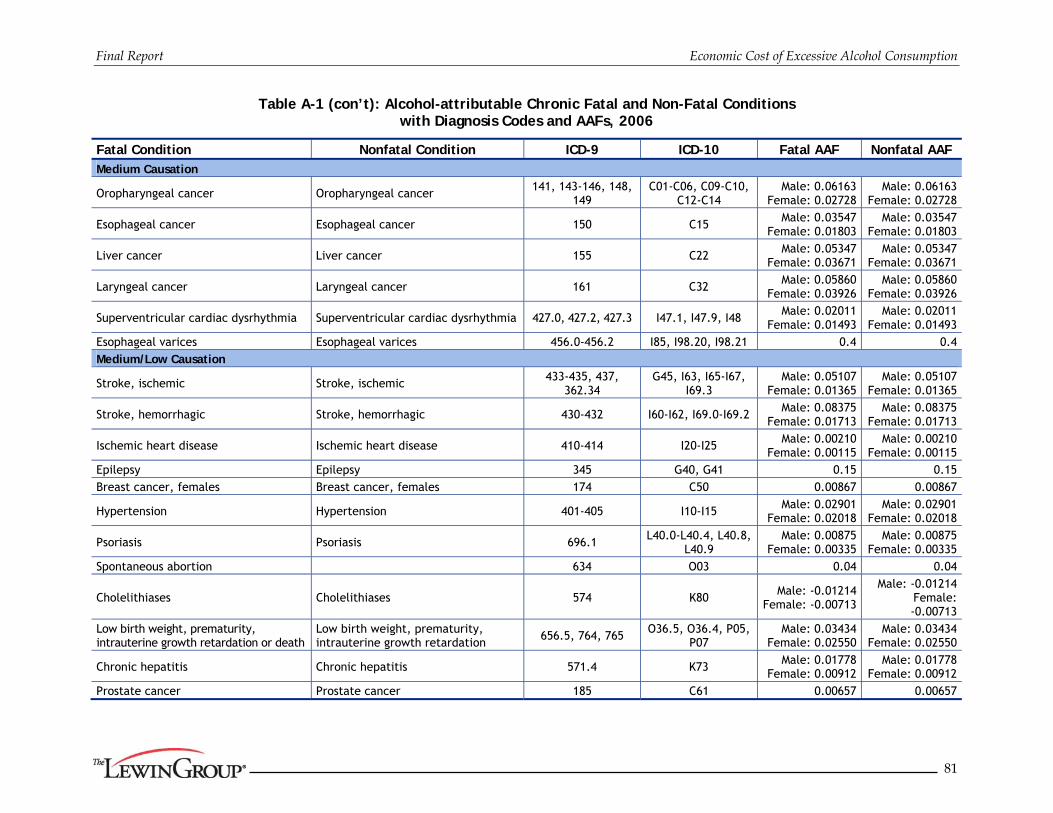
Final Report Economic Cost of Excessive Alcohol Consumption
81
Table A-1 (con’t): Alcohol-attributable Chronic Fatal and Non-Fatal Conditions with Diagnosis Codes and AAFs, 2006
Fatal Condition Nonfatal Condition ICD-9 ICD-10 Fatal AAF Nonfatal AAF Medium Causation
Oropharyngeal cancer Oropharyngeal cancer 141, 143-146, 148,
149 C01-C06, C09-C10,
C12-C14 Male: 0.06163
Female: 0.02728 Male: 0.06163
Female: 0.02728
Esophageal cancer Esophageal cancer 150 C15 Male: 0.03547
Female: 0.01803 Male: 0.03547
Female: 0.01803
Liver cancer Liver cancer 155 C22 Male: 0.05347
Female: 0.03671 Male: 0.05347
Female: 0.03671
Laryngeal cancer Laryngeal cancer 161 C32 Male: 0.05860
Female: 0.03926 Male: 0.05860
Female: 0.03926
Superventricular cardiac dysrhythmia Superventricular cardiac dysrhythmia 427.0, 427.2, 427.3 I47.1, I47.9, I48 Male: 0.02011
Female: 0.01493 Male: 0.02011
Female: 0.01493 Esophageal varices Esophageal varices 456.0-456.2 I85, I98.20, I98.21 0.4 0.4 Medium/Low Causation
Stroke, ischemic Stroke, ischemic 433-435, 437, 362.34
G45, I63, I65-I67, I69.3
Male: 0.05107 Female: 0.01365
Male: 0.05107 Female: 0.01365
Stroke, hemorrhagic Stroke, hemorrhagic 430-432 I60-I62, I69.0-I69.2 Male: 0.08375 Female: 0.01713
Male: 0.08375 Female: 0.01713
Ischemic heart disease Ischemic heart disease 410-414 I20-I25 Male: 0.00210 Female: 0.00115
Male: 0.00210 Female: 0.00115
Epilepsy Epilepsy 345 G40, G41 0.15 0.15 Breast cancer, females Breast cancer, females 174 C50 0.00867 0.00867
Hypertension Hypertension 401-405 I10-I15 Male: 0.02901 Female: 0.02018
Male: 0.02901 Female: 0.02018
Psoriasis Psoriasis 696.1 L40.0-L40.4, L40.8, L40.9
Male: 0.00875 Female: 0.00335
Male: 0.00875 Female: 0.00335
Spontaneous abortion 634 O03 0.04 0.04
Cholelithiases Cholelithiases 574 K80 Male: -0.01214 Female: -0.00713
Male: -0.01214 Female: -0.00713
Low birth weight, prematurity, intrauterine growth retardation or death
Low birth weight, prematurity, intrauterine growth retardation 656.5, 764, 765 O36.5, O36.4, P05,
P07 Male: 0.03434
Female: 0.02550 Male: 0.03434
Female: 0.02550
Chronic hepatitis Chronic hepatitis 571.4 K73 Male: 0.01778 Female: 0.00912
Male: 0.01778 Female: 0.00912
Prostate cancer Prostate cancer 185 C61 0.00657 0.00657

Final Report Economic Cost of Excessive Alcohol Consumption
82
Table A-2: Alcohol-attributable Acute Fatal and Non-Fatal Conditions with Diagnosis Codes and AAFs, 2006
Fatal Condition Nonfatal Condition ICD-9 ICD-10 Fatal AAF Nonfatal AAF
100% Alcohol-attributable
Alcohol poisoning Accidental poisoning by alcohol – alcoholic beverages, ethyl alcohol and its products, methyl alcohol, and unspecified alcohol
980.0, 980.1, E860.0, E860.1, E860.2, E860.9
X45, Y15, T51.0, T51.1,
T51.9 1.000 1.000
Suicide by and exposure to alcohol * X65 1.000 1.000
Excessive blood level of alcohol Excessive blood level of alcohol 790.3 R78.0 1.000 1.000
Direct AAF Estimate
Air-space transport Air-space transport accidents E840-E845 V95-V97 0.180 0.058
Aspiration Inhalation and ingestion of food causing obstruction of respiratory tract or suffocation
E911 W78-W79 0.180 0.058
Child maltreatment Injury purposely inflicted by other persons on a child 14 or younger
E960-E968 (patient age 14
or younger)
X85-Y09, Y87.1 (individual age 14 or younger)
0.160 0.058
Drowning injuries Unintentional drowning/submersion E910 W65-W74 0.340 0.058
Fall injuries Accidental Falls E880-E888, E848 W00-W19 0.320 0.058
Fire injuries Accidents caused by fire and flames E890-E899 X00-X09 0.420 0.058
Firearms Accidents caused by firearm and air gun missile E922 W32-W34 0.180 0.058
Homicide/Assault Injury purposely inflicted by other persons on a person 15 or older
E960-E969 (patient age 15
or older)
X85-Y09, Y87.1 (individual age
15 or older) 0.470 0.267
Hypothermia Accidents due to excessive cold E901 X31 0.420 0.058
* No ICD-9 code is available and the condition is new to ICD-10.
Accidental and unintentional can be used interchangeably.
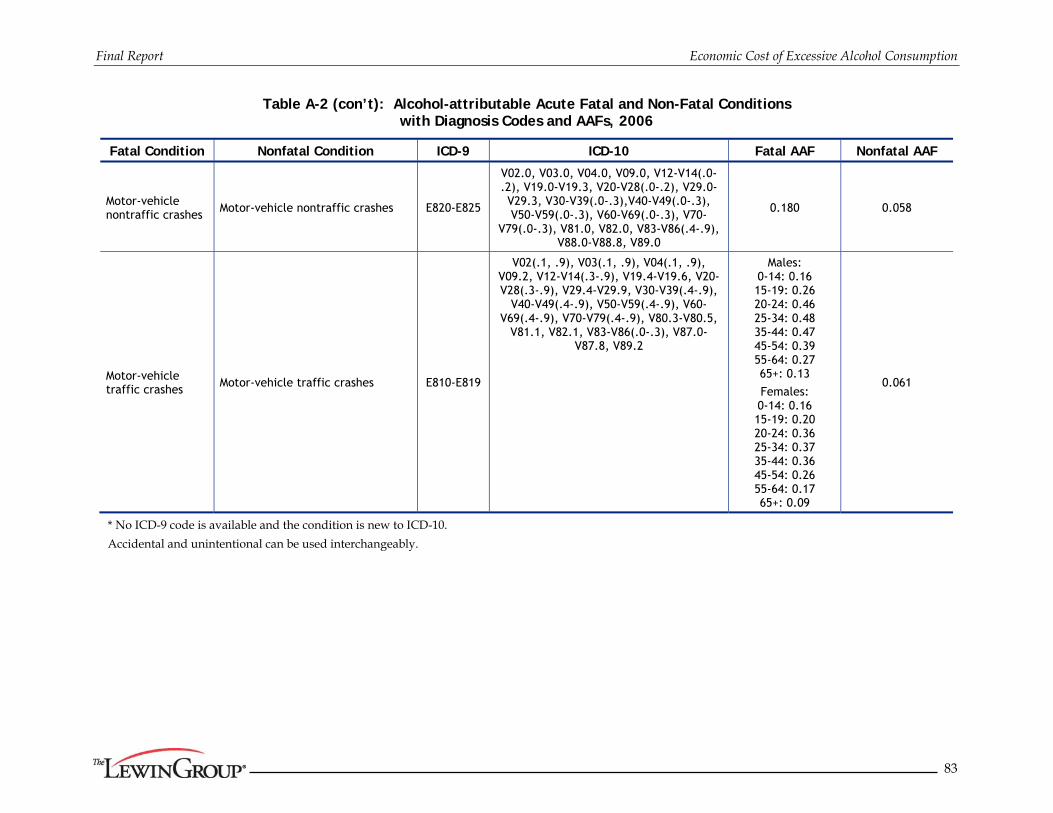
Final Report Economic Cost of Excessive Alcohol Consumption
83
Table A-2 (con’t): Alcohol-attributable Acute Fatal and Non-Fatal Conditions with Diagnosis Codes and AAFs, 2006
Fatal Condition Nonfatal Condition ICD-9 ICD-10 Fatal AAF Nonfatal AAF
Motor-vehicle nontraffic crashes
Motor-vehicle nontraffic crashes E820-E825
V02.0, V03.0, V04.0, V09.0, V12-V14(.0-.2), V19.0-V19.3, V20-V28(.0-.2), V29.0-V29.3, V30-V39(.0-.3),V40-V49(.0-.3), V50-V59(.0-.3), V60-V69(.0-.3), V70-
V79(.0-.3), V81.0, V82.0, V83-V86(.4-.9), V88.0-V88.8, V89.0
0.180 0.058
Motor-vehicle traffic crashes Motor-vehicle traffic crashes E810-E819
V02(.1, .9), V03(.1, .9), V04(.1, .9), V09.2, V12-V14(.3-.9), V19.4-V19.6, V20-V28(.3-.9), V29.4-V29.9, V30-V39(.4-.9),
V40-V49(.4-.9), V50-V59(.4-.9), V60-V69(.4-.9), V70-V79(.4-.9), V80.3-V80.5,
V81.1, V82.1, V83-V86(.0-.3), V87.0-V87.8, V89.2
Males: 0-14: 0.16 15-19: 0.26 20-24: 0.46 25-34: 0.48 35-44: 0.47 45-54: 0.39 55-64: 0.27 65+: 0.13
Females: 0-14: 0.16 15-19: 0.20 20-24: 0.36 25-34: 0.37 35-44: 0.36 45-54: 0.26 55-64: 0.17 65+: 0.09
0.061
* No ICD-9 code is available and the condition is new to ICD-10.
Accidental and unintentional can be used interchangeably.
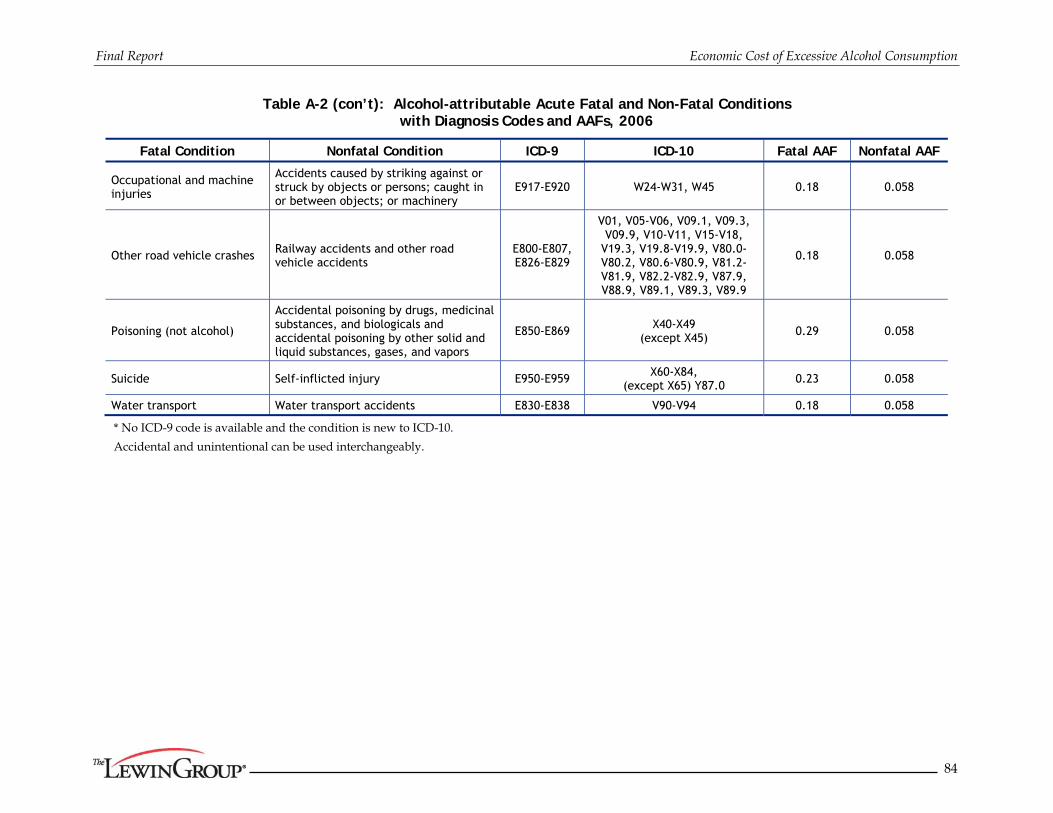
Final Report Economic Cost of Excessive Alcohol Consumption
84
Table A-2 (con’t): Alcohol-attributable Acute Fatal and Non-Fatal Conditions with Diagnosis Codes and AAFs, 2006
Fatal Condition Nonfatal Condition ICD-9 ICD-10 Fatal AAF Nonfatal AAF
Occupational and machine injuries
Accidents caused by striking against or struck by objects or persons; caught in or between objects; or machinery
E917-E920 W24-W31, W45 0.18 0.058
Other road vehicle crashes Railway accidents and other road vehicle accidents
E800-E807, E826-E829
V01, V05-V06, V09.1, V09.3, V09.9, V10-V11, V15-V18,
V19.3, V19.8-V19.9, V80.0-V80.2, V80.6-V80.9, V81.2-V81.9, V82.2-V82.9, V87.9, V88.9, V89.1, V89.3, V89.9
0.18 0.058
Poisoning (not alcohol)
Accidental poisoning by drugs, medicinal substances, and biologicals and accidental poisoning by other solid and liquid substances, gases, and vapors
E850-E869 X40-X49 (except X45) 0.29 0.058
Suicide Self-inflicted injury E950-E959 X60-X84, (except X65) Y87.0 0.23 0.058
Water transport Water transport accidents E830-E838 V90-V94 0.18 0.058
* No ICD-9 code is available and the condition is new to ICD-10.
Accidental and unintentional can be used interchangeably.
Appendix B: Detailed Health Care Treatment
Expenditure Tables
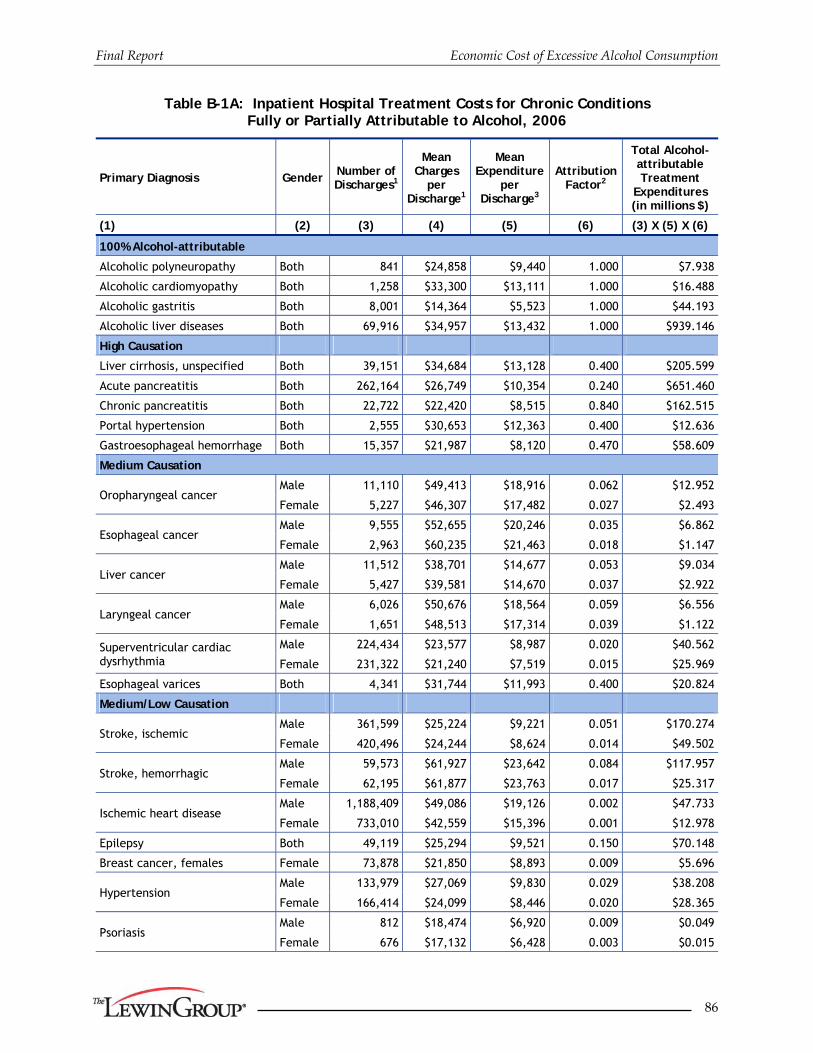
Final Report Economic Cost of Excessive Alcohol Consumption
86
Table B-1A: Inpatient Hospital Treatment Costs for Chronic Conditions Fully or Partially Attributable to Alcohol, 2006
Primary Diagnosis Gender Number of Discharges1
Mean Charges
per Discharge1
Mean Expenditure
per Discharge3
Attribution Factor2
Total Alcohol-attributable Treatment
Expenditures (in millions $)
(1) (2) (3) (4) (5) (6) (3) X (5) X (6)
100% Alcohol-attributable
Alcoholic polyneuropathy Both 841 $24,858 $9,440 1.000 $7.938
Alcoholic cardiomyopathy Both 1,258 $33,300 $13,111 1.000 $16.488
Alcoholic gastritis Both 8,001 $14,364 $5,523 1.000 $44.193
Alcoholic liver diseases Both 69,916 $34,957 $13,432 1.000 $939.146
High Causation
Liver cirrhosis, unspecified Both 39,151 $34,684 $13,128 0.400 $205.599
Acute pancreatitis Both 262,164 $26,749 $10,354 0.240 $651.460
Chronic pancreatitis Both 22,722 $22,420 $8,515 0.840 $162.515
Portal hypertension Both 2,555 $30,653 $12,363 0.400 $12.636
Gastroesophageal hemorrhage Both 15,357 $21,987 $8,120 0.470 $58.609
Medium Causation
Oropharyngeal cancer Male 11,110 $49,413 $18,916 0.062 $12.952
Female 5,227 $46,307 $17,482 0.027 $2.493
Esophageal cancer Male 9,555 $52,655 $20,246 0.035 $6.862
Female 2,963 $60,235 $21,463 0.018 $1.147
Liver cancer Male 11,512 $38,701 $14,677 0.053 $9.034
Female 5,427 $39,581 $14,670 0.037 $2.922
Laryngeal cancer Male 6,026 $50,676 $18,564 0.059 $6.556
Female 1,651 $48,513 $17,314 0.039 $1.122
Superventricular cardiac dysrhythmia
Male 224,434 $23,577 $8,987 0.020 $40.562
Female 231,322 $21,240 $7,519 0.015 $25.969
Esophageal varices Both 4,341 $31,744 $11,993 0.400 $20.824
Medium/Low Causation
Stroke, ischemic Male 361,599 $25,224 $9,221 0.051 $170.274
Female 420,496 $24,244 $8,624 0.014 $49.502
Stroke, hemorrhagic Male 59,573 $61,927 $23,642 0.084 $117.957
Female 62,195 $61,877 $23,763 0.017 $25.317
Ischemic heart disease Male 1,188,409 $49,086 $19,126 0.002 $47.733
Female 733,010 $42,559 $15,396 0.001 $12.978
Epilepsy Both 49,119 $25,294 $9,521 0.150 $70.148
Breast cancer, females Female 73,878 $21,850 $8,893 0.009 $5.696
Hypertension Male 133,979 $27,069 $9,830 0.029 $38.208
Female 166,414 $24,099 $8,446 0.020 $28.365
Psoriasis Male 812 $18,474 $6,920 0.009 $0.049
Female 676 $17,132 $6,428 0.003 $0.015
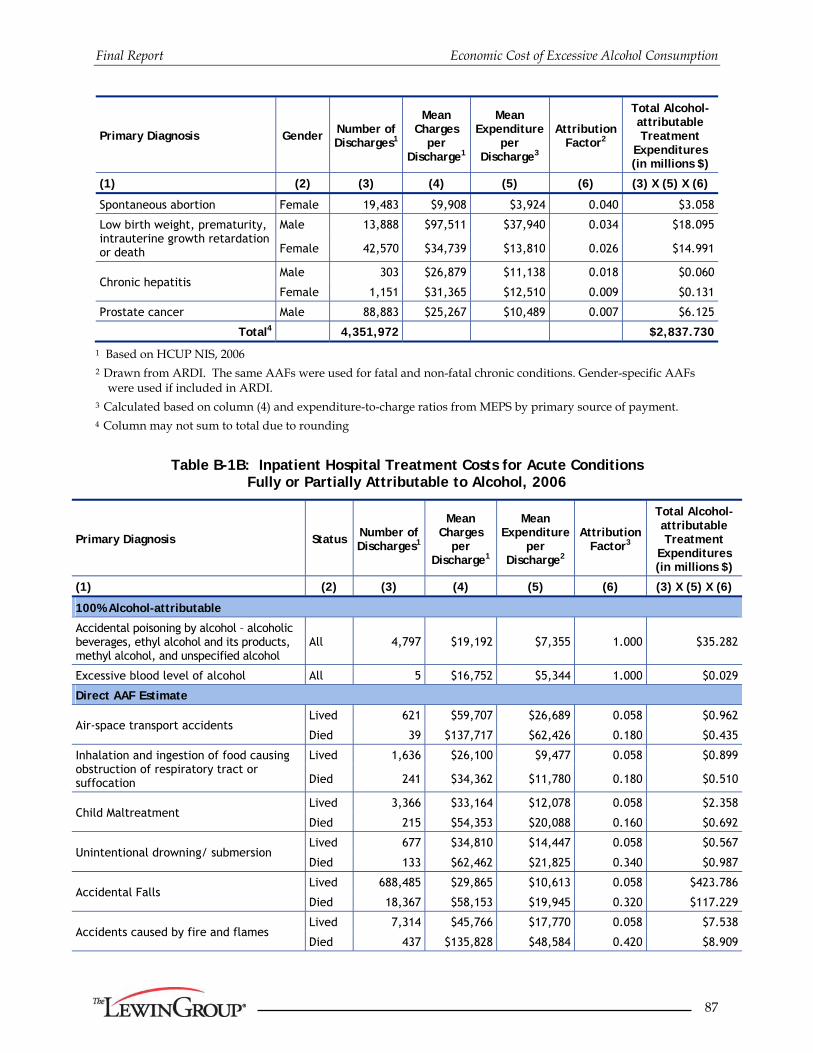
Final Report Economic Cost of Excessive Alcohol Consumption
87
Primary Diagnosis Gender Number of Discharges1
Mean Charges
per Discharge1
Mean Expenditure
per Discharge3
Attribution Factor2
Total Alcohol-attributable Treatment
Expenditures (in millions $)
(1) (2) (3) (4) (5) (6) (3) X (5) X (6)
Spontaneous abortion Female 19,483 $9,908 $3,924 0.040 $3.058
Low birth weight, prematurity, intrauterine growth retardation or death
Male 13,888 $97,511 $37,940 0.034 $18.095
Female 42,570 $34,739 $13,810 0.026 $14.991
Chronic hepatitis Male 303 $26,879 $11,138 0.018 $0.060
Female 1,151 $31,365 $12,510 0.009 $0.131
Prostate cancer Male 88,883 $25,267 $10,489 0.007 $6.125
Total4 4,351,972 $2,837.730
1 Based on HCUP NIS, 2006 2 Drawn from ARDI. The same AAFs were used for fatal and non-fatal chronic conditions. Gender-specific AAFs
were used if included in ARDI. 3 Calculated based on column (4) and expenditure-to-charge ratios from MEPS by primary source of payment. 4 Column may not sum to total due to rounding
Table B-1B: Inpatient Hospital Treatment Costs for Acute Conditions Fully or Partially Attributable to Alcohol, 2006
Primary Diagnosis Status Number of Discharges1
Mean Charges
per Discharge1
Mean Expenditure
per Discharge2
Attribution Factor3
Total Alcohol-attributable Treatment
Expenditures (in millions $)
(1) (2) (3) (4) (5) (6) (3) X (5) X (6)
100% Alcohol-attributable
Accidental poisoning by alcohol – alcoholic beverages, ethyl alcohol and its products, methyl alcohol, and unspecified alcohol
All 4,797 $19,192 $7,355 1.000 $35.282
Excessive blood level of alcohol All 5 $16,752 $5,344 1.000 $0.029
Direct AAF Estimate
Air-space transport accidents Lived 621 $59,707 $26,689 0.058 $0.962
Died 39 $137,717 $62,426 0.180 $0.435
Inhalation and ingestion of food causing obstruction of respiratory tract or suffocation
Lived 1,636 $26,100 $9,477 0.058 $0.899
Died 241 $34,362 $11,780 0.180 $0.510
Child Maltreatment Lived 3,366 $33,164 $12,078 0.058 $2.358
Died 215 $54,353 $20,088 0.160 $0.692
Unintentional drowning/ submersion Lived 677 $34,810 $14,447 0.058 $0.567
Died 133 $62,462 $21,825 0.340 $0.987
Accidental Falls Lived 688,485 $29,865 $10,613 0.058 $423.786
Died 18,367 $58,153 $19,945 0.320 $117.229
Accidents caused by fire and flames Lived 7,314 $45,766 $17,770 0.058 $7.538
Died 437 $135,828 $48,584 0.420 $8.909
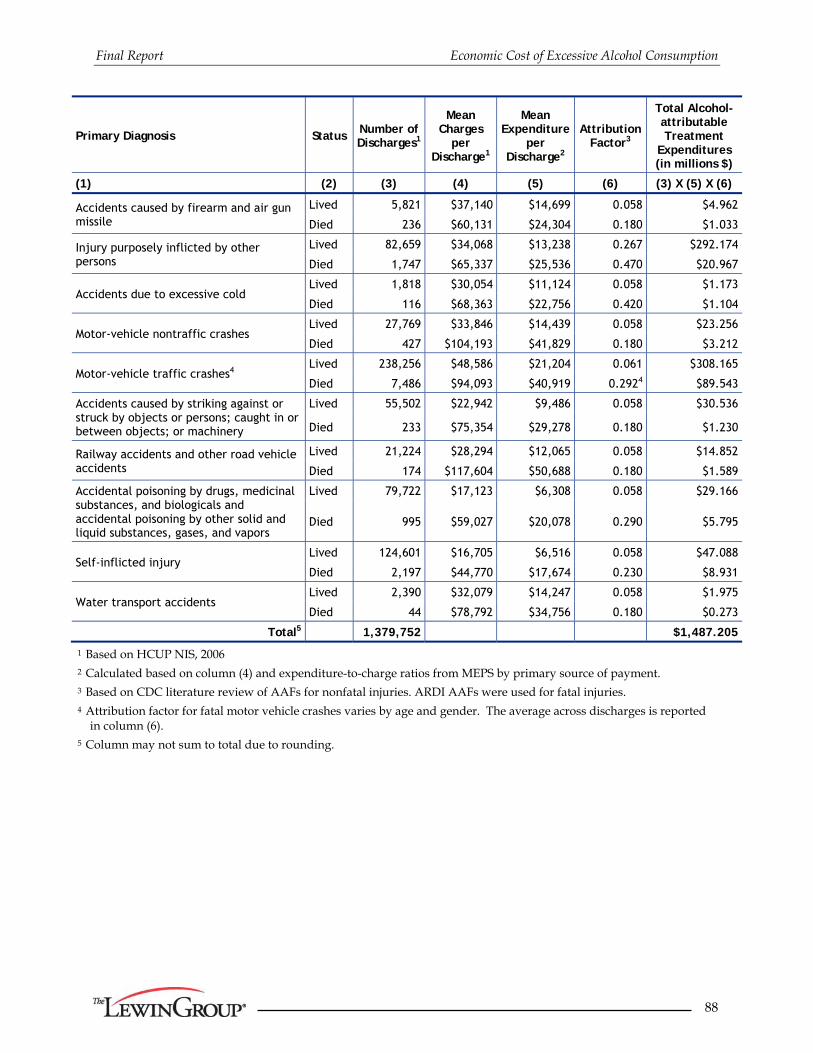
Final Report Economic Cost of Excessive Alcohol Consumption
88
Primary Diagnosis Status Number of Discharges1
Mean Charges
per Discharge1
Mean Expenditure
per Discharge2
Attribution Factor3
Total Alcohol-attributable Treatment
Expenditures (in millions $)
(1) (2) (3) (4) (5) (6) (3) X (5) X (6)
Accidents caused by firearm and air gun missile
Lived 5,821 $37,140 $14,699 0.058 $4.962
Died 236 $60,131 $24,304 0.180 $1.033
Injury purposely inflicted by other persons
Lived 82,659 $34,068 $13,238 0.267 $292.174
Died 1,747 $65,337 $25,536 0.470 $20.967
Accidents due to excessive cold Lived 1,818 $30,054 $11,124 0.058 $1.173
Died 116 $68,363 $22,756 0.420 $1.104
Motor-vehicle nontraffic crashes Lived 27,769 $33,846 $14,439 0.058 $23.256
Died 427 $104,193 $41,829 0.180 $3.212
Motor-vehicle traffic crashes4 Lived 238,256 $48,586 $21,204 0.061 $308.165
Died 7,486 $94,093 $40,919 0.2924 $89.543
Accidents caused by striking against or struck by objects or persons; caught in or between objects; or machinery
Lived 55,502 $22,942 $9,486 0.058 $30.536
Died 233 $75,354 $29,278 0.180 $1.230
Railway accidents and other road vehicle accidents
Lived 21,224 $28,294 $12,065 0.058 $14.852
Died 174 $117,604 $50,688 0.180 $1.589
Accidental poisoning by drugs, medicinal substances, and biologicals and accidental poisoning by other solid and liquid substances, gases, and vapors
Lived 79,722 $17,123 $6,308 0.058 $29.166
Died 995 $59,027 $20,078 0.290 $5.795
Self-inflicted injury Lived 124,601 $16,705 $6,516 0.058 $47.088
Died 2,197 $44,770 $17,674 0.230 $8.931
Water transport accidents Lived 2,390 $32,079 $14,247 0.058 $1.975
Died 44 $78,792 $34,756 0.180 $0.273
Total5 1,379,752 $1,487.205
1 Based on HCUP NIS, 2006
2 Calculated based on column (4) and expenditure-to-charge ratios from MEPS by primary source of payment.
3 Based on CDC literature review of AAFs for nonfatal injuries. ARDI AAFs were used for fatal injuries.
4 Attribution factor for fatal motor vehicle crashes varies by age and gender. The average across discharges is reported in column (6).
5 Column may not sum to total due to rounding.

Final Report Economic Cost of Excessive Alcohol Consumption
89
Table B-2A: Treatment Costs for Physician Services Provided During an Inpatient Stay for Chronic Conditions Fully or Partially Attributable to Alcohol, 2006
Primary Diagnosis Gender Number of Discharges1 Total LOS1
Mean LOS per
Discharge1
Mean Physician
Expenditure per Inpatient
Day2
Attribution Factor3
Total Alcohol-attributable Treatment
Expenditures (in millions $)
(1) (2) (3) (4) (5) (6) (3) X (5) X (6)
100% Alcohol-attributable
Alcoholic polyneuropathy Both 841 5,586 6.64 $270 1.000 $1.508
Alcoholic cardiomyopathy Both 1,258 5,701 4.53 $270 1.000 $1.539
Alcoholic gastritis Both 8,001 25,518 3.19 $270 1.000 $6.890
Alcoholic liver diseases Both 69,916 447,899 6.41 $270 1.000 $120.933
High Causation
Liver cirrhosis, unspecified Both 39,151 236,954 6.05 $270 0.400 $25.591
Acute pancreatitis Both 262,164 1,468,210 5.60 $270 0.240 $95.140
Chronic pancreatitis Both 22,722 118,031 5.19 $270 0.840 $26.769
Portal hypertension Both 2,555 13,025 5.10 $270 0.400 $1.407
Gastroesophageal hemorrhage Both 15,357 60,538 3.94 $270 0.470 $7.682
Medium Causation
Oropharyngeal cancer Male 11,110 83,306 7.50 $270 0.062 $1.386
Female 5,227 36,627 7.01 $270 0.027 $0.270
Esophageal cancer Male 9,555 90,169 9.44 $270 0.035 $0.864
Female 2,963 31,198 10.53 $270 0.018 $0.152
Liver cancer Male 11,512 75,272 6.54 $270 0.053 $1.087
Female 5,427 39,700 7.32 $270 0.037 $0.393
Laryngeal cancer Male 6,026 58,422 9.69 $270 0.059 $0.924
Female 1,651 14,619 8.85 $270 0.039 $0.155
Superventricular cardiac dysrhythmia
Male 224,434 751,437 3.35 $270 0.020 $4.080
Female 231,322 869,363 3.76 $270 0.015 $3.504
Esophageal varices Both 4,341 21,349 4.92 $270 0.400 $2.306
Medium/Low Causation
Stroke, ischemic Male 361,599 1,520,286 4.20 $270 0.051 $20.963
Female 420,496 1,846,479 4.39 $270 0.014 $6.805
Stroke, hemorrhagic Male 59,573 537,109 9.02 $270 0.084 $12.145
Female 62,195 541,689 8.71 $270 0.017 $2.505
Ischemic heart disease Male 1,188,409 4,527,809 3.81 $270 0.002 $2.567
Female 733,010 2,994,358 4.09 $270 0.001 $0.930
Epilepsy Both 49,119 233,885 4.76 $270 0.150 $9.472
Breast cancer, females Female 73,878 195,227 2.64 $270 0.009 $0.457
Hypertension Male 133,979 616,302 4.60 $270 0.029 $4.827
Female 166,414 761,055 4.57 $270 0.020 $4.147
Psoriasis Male 812 5,020 6.18 $270 0.009 $0.012
Female 676 3,707 5.49 $270 0.003 $0.003

Final Report Economic Cost of Excessive Alcohol Consumption
90
Primary Diagnosis Gender Number of Discharges1 Total LOS1
Mean LOS per
Discharge1
Mean Physician
Expenditure per Inpatient
Day2
Attribution Factor3
Total Alcohol-attributable Treatment
Expenditures (in millions $)
(1) (2) (3) (4) (5) (6) (3) X (5) X (6)
Spontaneous abortion Female 19,483 26,628 1.37 $270 0.040 $0.288
Low birth weight, prematurity, intrauterine growth retardation or death
Male 13,888 357,226 25.72 $270 0.034 $3.312
Female 42,570 399,067 9.37 $270 0.026 $2.748
Chronic hepatitis Male 303 2,360 7.79 $270 0.018 $0.011
Female 1,151 7,264 6.31 $270 0.009 $0.018
Prostate cancer Male 88,883 252,954 2.85 $270 0.007 $0.449
Total4 4,351,972 19,281,351 $374.241
1 Based on HCUP NIS, 2006
2 Calculated based on MEPS.
3 Drawn from ARDI. The same AAFs were used for fatal and non-fatal chronic conditions. Gender-specific AAFs were used if included in ARDI.
4 Column may not sum to total due to rounding
Table B-2B: Treatment Costs for Physician Services Provided During an Inpatient Stay for Acute Conditions Fully or Partially Attributable to Alcohol, 2006
Primary Diagnosis Status Number of Discharges1
Total LOS1
Mean LOS per
Discharge1
Mean Physician
Expenditure per Inpatient
Day2
Attribution Factor3
Total Alcohol-attributable Treatment
Expenditures (in millions $)
(1) (2) (3) (4) (5) (6) (3) X (5) X (6)
100% Alcohol-attributable
Accidental poisoning by alcohol – alcoholic beverages, ethyl alcohol and its products, methyl alcohol, and unspecified alcohol
All 4,797 14,150 2.95 $270 1.000 $3.821
Excessive blood level of alcohol All 5 16 3.00 $270 1.000 $0.004
Direct AAF Estimate
Air-space transport accidents Lived 621 3,554 5.72 $270 0.058 $0.056
Died 39 339 8.76 $270 0.180 $0.016
Inhalation and ingestion of food causing obstruction of respiratory tract or suffocation
Lived 1,636 6,726 4.11 $270 0.058 $0.105
Died 241 795 3.30 $270 0.180 $0.039
Child Maltreatment Lived 3,366 22,512 6.69 $270 0.058 $0.353
Died 215 780 3.63 $270 0.160 $0.034
Unintentional drowning/ submersion
Lived 677 3,165 4.67 $270 0.058 $0.050
Died 133 642 4.82 $270 0.340 $0.059
Accidental Falls Lived 688,485 3,538,104 5.14 $270 0.058 $55.407
Died 18,367 136,995 7.46 $270 0.320 $11.836

Final Report Economic Cost of Excessive Alcohol Consumption
91
Primary Diagnosis Status Number of Discharges1
Total LOS1
Mean LOS per
Discharge1
Mean Physician
Expenditure per Inpatient
Day2
Attribution Factor3
Total Alcohol-attributable Treatment
Expenditures (in millions $)
(1) (2) (3) (4) (5) (6) (3) X (5) X (6)
Accidents caused by fire and flames
Lived 7,314 62,387 8.53 $270 0.058 $0.977
Died 437 7,044 16.13 $270 0.420 $0.799
Accidents caused by firearm and air gun missile
Lived 5,821 32,102 5.52 $270 0.058 $0.503
Died 236 780 3.30 $270 0.180 $0.038
Injury purposely inflicted by other persons
Lived 82,659 386,458 4.68 $270 0.267 $27.860
Died 1,747 8,018 4.59 $270 0.470 $1.018
Accidents due to excessive cold Lived 1,818 12,260 6.74 $270 0.058 $0.192
Died 116 809 7.01 $270 0.420 $0.092
Motor-vehicle nontraffic crashes Lived 27,769 131,481 4.73 $270 0.058 $2.059
Died 427 3,456 8.10 $270 0.180 $0.168
Motor-vehicle traffic crashes4 Lived 238,256 1,489,623 6.25 $270 0.061 $24.534
Died 7,486 46,516 6.21 $270 0.269 $3.380
Accidents caused by striking against or struck by objects or persons; caught in or between objects; or machinery
Lived 55,502 190,245 3.43 $270 0.058 $2.979
Died 233 1,477 6.33 $270 0.180 $0.072
Railway accidents and other road vehicle accidents
Lived 21,224 83,117 3.92 $270 0.058 $1.302
Died 174 1,151 6.61 $270 0.180 $0.056
Accidental poisoning by drugs, medicinal substances, and biologicals and accidental poisoning by other solid and liquid substances, gases, and vapors
Lived 79,722 250,136 3.14 $270 0.058 $3.917
Died 995 6,483 6.51 $270 0.290 $0.508
Self-inflicted injury Lived 124,601 386,892 3.11 $270 0.058 $6.059
Died 2,197 6,834 3.11 $270 0.230 $0.424
Water transport accidents Lived 2,390 10,232 4.28 $270 0.058 $0.160
Died 44 280 6.41 $270 0.180 $0.014
Total5 1,379,752 6,845,557 $148.887
1 Based on HCUP NIS, 2006 2 Calculated based on column (3) and expenditure-to-charge ratios from MEPS by primary source of payment. 3 Based on CDC literature review of AAFs for nonfatal injuries. ARDI AAFs were used for fatal injuries. 4 Attribution factor for fatal motor vehicle crashes varies by age and gender. The average across discharges is reported
in column (6). 5 Column may not sum to total due to rounding
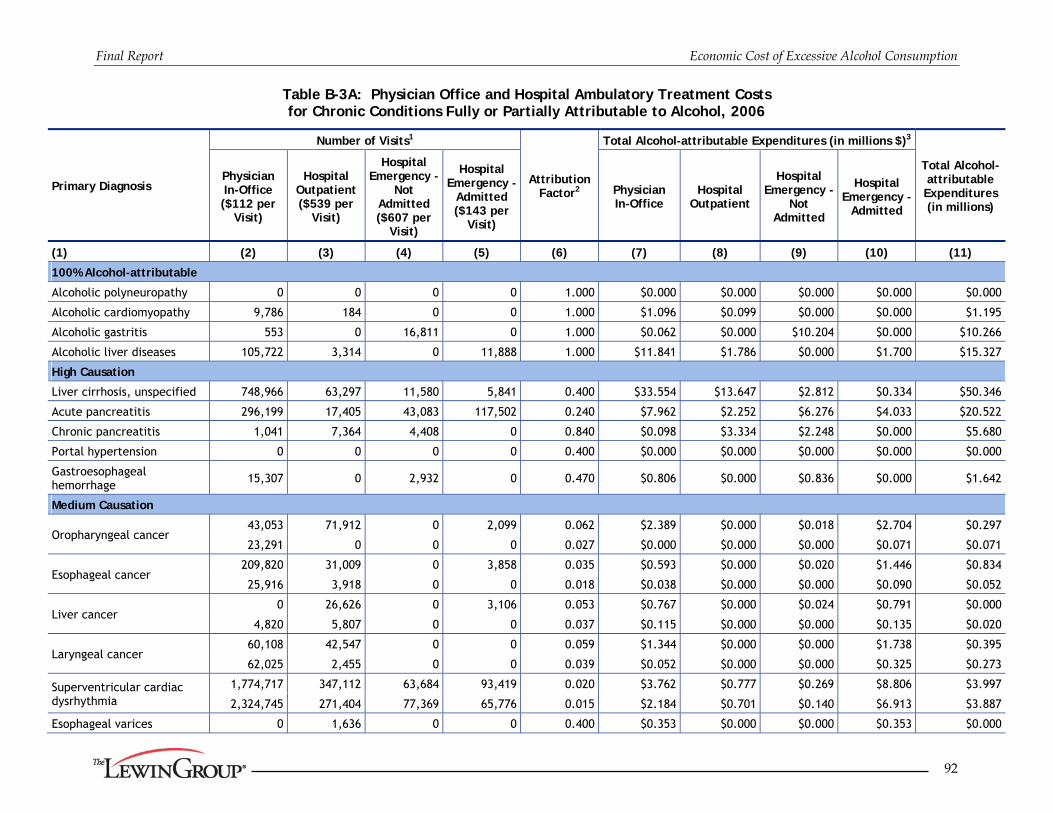
Final Report Economic Cost of Excessive Alcohol Consumption
92
Table B-3A: Physician Office and Hospital Ambulatory Treatment Costs for Chronic Conditions Fully or Partially Attributable to Alcohol, 2006
Primary Diagnosis
Number of Visits1
Attribution Factor2
Total Alcohol-attributable Expenditures (in millions $)3
Total Alcohol-attributable Expenditures (in millions)
Physician In-Office ($112 per
Visit)
Hospital Outpatient ($539 per
Visit)
Hospital Emergency -
Not Admitted ($607 per
Visit)
Hospital Emergency -
Admitted ($143 per
Visit)
Physician In-Office
Hospital Outpatient
Hospital Emergency -
Not Admitted
Hospital Emergency -
Admitted
(1) (2) (3) (4) (5) (6) (7) (8) (9) (10) (11)
100% Alcohol-attributable
Alcoholic polyneuropathy 0 0 0 0 1.000 $0.000 $0.000 $0.000 $0.000 $0.000
Alcoholic cardiomyopathy 9,786 184 0 0 1.000 $1.096 $0.099 $0.000 $0.000 $1.195
Alcoholic gastritis 553 0 16,811 0 1.000 $0.062 $0.000 $10.204 $0.000 $10.266
Alcoholic liver diseases 105,722 3,314 0 11,888 1.000 $11.841 $1.786 $0.000 $1.700 $15.327
High Causation
Liver cirrhosis, unspecified 748,966 63,297 11,580 5,841 0.400 $33.554 $13.647 $2.812 $0.334 $50.346
Acute pancreatitis 296,199 17,405 43,083 117,502 0.240 $7.962 $2.252 $6.276 $4.033 $20.522
Chronic pancreatitis 1,041 7,364 4,408 0 0.840 $0.098 $3.334 $2.248 $0.000 $5.680
Portal hypertension 0 0 0 0 0.400 $0.000 $0.000 $0.000 $0.000 $0.000
Gastroesophageal hemorrhage 15,307 0 2,932 0 0.470 $0.806 $0.000 $0.836 $0.000 $1.642
Medium Causation
Oropharyngeal cancer 43,053 71,912 0 2,099 0.062 $2.389 $0.000 $0.018 $2.704 $0.297
23,291 0 0 0 0.027 $0.000 $0.000 $0.000 $0.071 $0.071
Esophageal cancer 209,820 31,009 0 3,858 0.035 $0.593 $0.000 $0.020 $1.446 $0.834
25,916 3,918 0 0 0.018 $0.038 $0.000 $0.000 $0.090 $0.052
Liver cancer 0 26,626 0 3,106 0.053 $0.767 $0.000 $0.024 $0.791 $0.000
4,820 5,807 0 0 0.037 $0.115 $0.000 $0.000 $0.135 $0.020
Laryngeal cancer 60,108 42,547 0 0 0.059 $1.344 $0.000 $0.000 $1.738 $0.395
62,025 2,455 0 0 0.039 $0.052 $0.000 $0.000 $0.325 $0.273
Superventricular cardiac dysrhythmia
1,774,717 347,112 63,684 93,419 0.020 $3.762 $0.777 $0.269 $8.806 $3.997
2,324,745 271,404 77,369 65,776 0.015 $2.184 $0.701 $0.140 $6.913 $3.887
Esophageal varices 0 1,636 0 0 0.400 $0.353 $0.000 $0.000 $0.353 $0.000

Final Report Economic Cost of Excessive Alcohol Consumption
93
Primary Diagnosis
Number of Visits1
Attribution Factor2
Total Alcohol-attributable Expenditures (in millions $)3
Total Alcohol-attributable Expenditures (in millions)
Physician In-Office ($112 per
Visit)
Hospital Outpatient ($539 per
Visit)
Hospital Emergency -
Not Admitted ($607 per
Visit)
Hospital Emergency -
Admitted ($143 per
Visit)
Physician In-Office
Hospital Outpatient
Hospital Emergency -
Not Admitted
Hospital Emergency -
Admitted
Medium/Low Causation
Stroke, ischemic 779,023 135,904 46,832 218,490 0.051 $4.456 $3.741 $1.452 $1.596 $11.244
1,005,534 80,889 58,670 176,884 0.014 $1.537 $0.595 $0.486 $0.345 $2.964
Stroke, hemorrhagic 202,326 663 25,799 22,141 0.084 $1.898 $0.030 $1.312 $0.265 $3.504
0 2,225 15,607 34,803 0.017 $0.000 $0.021 $0.162 $0.085 $0.268
Ischemic heart disease 6,499,807 302,342 173,927 262,859 0.002 $1.529 $0.342 $0.222 $0.079 $2.172
4,358,963 249,292 90,870 212,611 0.001 $0.561 $0.155 $0.063 $0.035 $0.814
Epilepsy 766,212 73,899 59,206 14,614 0.150 $12.872 $5.975 $5.391 $0.313 $24.551
Breast cancer, females 3,759,809 770,288 12,932 10,908 0.009 $3.651 $3.600 $0.068 $0.014 $7.332
Hypertension 17,160,223 1,447,935 256,517 51,297 0.029 $55.756 $22.640 $4.517 $0.213 $83.126
21,143,367 2,458,564 517,392 64,346 0.020 $47.787 $26.742 $6.338 $0.186 $81.053
Psoriasis 376,204 62,155 0 0 0.009 $0.369 $0.293 $0.000 $0.000 $0.662
307,808 60,962 0 3,558 0.003 $0.115 $0.110 $0.000 $0.002 $0.227
Spontaneous abortion 176,244 29,369 147,169 16,994 0.040 $0.790 $0.633 $3.573 $0.097 $5.093
Low birth weight, prematurity, intrauterine growth retardation or death
21,050 18,732 0 0 0.034 $0.081 $0.347 $0.000 $0.000 $0.428
169,457 34,841 0 0 0.026 $0.484 $0.479 $0.000 $0.000 $0.963
Chronic hepatitis 0 0 0 0 0.018 $0.000 $0.000 $0.000 $0.000 $0.000
34,917 24,447 0 0 0.009 $0.036 $0.120 $0.000 $0.000 $0.156
Prostate cancer 2,916,430 251,020 184 0 0.007 $2.146 $0.889 $0.001 $0.000 $3.036
Total 65,383,443 6,899,517 1,624,972 1,392,994 $199.312 $99.426 $47.439 $9.767 $355.944 1 Based on NAMCS and NHAMCS, 2006 2 Drawn from ARDI. 3 Calculated by multiplying mean expenditures per visit from MEPS 2006 times the number of visits and alcohol attribution factor for the diagnosis.
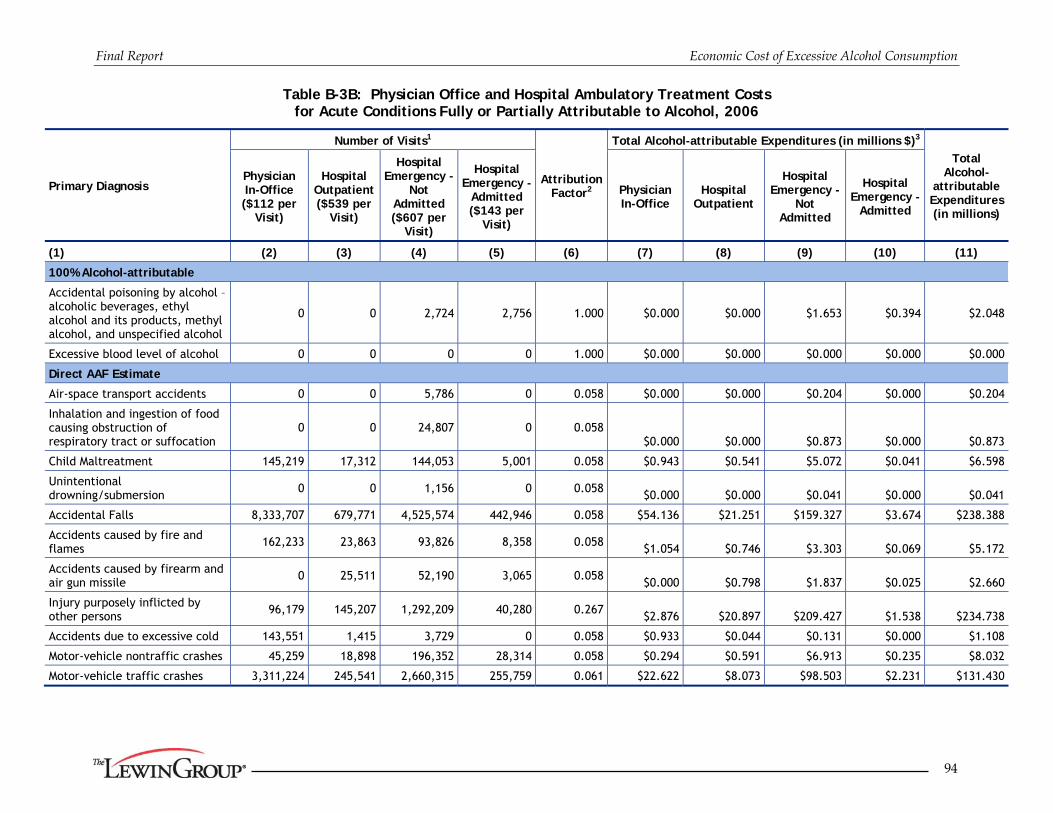
Final Report Economic Cost of Excessive Alcohol Consumption
94
Table B-3B: Physician Office and Hospital Ambulatory Treatment Costs for Acute Conditions Fully or Partially Attributable to Alcohol, 2006
Primary Diagnosis
Number of Visits1
Attribution Factor2
Total Alcohol-attributable Expenditures (in millions $)3
Total Alcohol-
attributable Expenditures (in millions)
Physician In-Office ($112 per
Visit)
Hospital Outpatient ($539 per
Visit)
Hospital Emergency -
Not Admitted ($607 per
Visit)
Hospital Emergency -
Admitted ($143 per
Visit)
Physician In-Office
Hospital Outpatient
Hospital Emergency -
Not Admitted
Hospital Emergency -
Admitted
(1) (2) (3) (4) (5) (6) (7) (8) (9) (10) (11)
100% Alcohol-attributable
Accidental poisoning by alcohol – alcoholic beverages, ethyl alcohol and its products, methyl alcohol, and unspecified alcohol
0 0 2,724 2,756 1.000 $0.000 $0.000 $1.653 $0.394 $2.048
Excessive blood level of alcohol 0 0 0 0 1.000 $0.000 $0.000 $0.000 $0.000 $0.000
Direct AAF Estimate
Air-space transport accidents 0 0 5,786 0 0.058 $0.000 $0.000 $0.204 $0.000 $0.204
Inhalation and ingestion of food causing obstruction of respiratory tract or suffocation
0 0 24,807 0 0.058 $0.000 $0.000 $0.873 $0.000 $0.873
Child Maltreatment 145,219 17,312 144,053 5,001 0.058 $0.943 $0.541 $5.072 $0.041 $6.598
Unintentional drowning/submersion 0 0 1,156 0 0.058 $0.000 $0.000 $0.041 $0.000 $0.041
Accidental Falls 8,333,707 679,771 4,525,574 442,946 0.058 $54.136 $21.251 $159.327 $3.674 $238.388
Accidents caused by fire and flames 162,233 23,863 93,826 8,358 0.058 $1.054 $0.746 $3.303 $0.069 $5.172
Accidents caused by firearm and air gun missile
0 25,511 52,190 3,065 0.058 $0.000 $0.798 $1.837 $0.025 $2.660
Injury purposely inflicted by other persons 96,179 145,207 1,292,209 40,280 0.267 $2.876 $20.897 $209.427 $1.538 $234.738
Accidents due to excessive cold 143,551 1,415 3,729 0 0.058 $0.933 $0.044 $0.131 $0.000 $1.108
Motor-vehicle nontraffic crashes 45,259 18,898 196,352 28,314 0.058 $0.294 $0.591 $6.913 $0.235 $8.032
Motor-vehicle traffic crashes 3,311,224 245,541 2,660,315 255,759 0.061 $22.622 $8.073 $98.503 $2.231 $131.430

Final Report Economic Cost of Excessive Alcohol Consumption
95
Primary Diagnosis
Number of Visits1
Attribution Factor2
Total Alcohol-attributable Expenditures (in millions $)3
Total Alcohol-
attributable Expenditures (in millions)
Physician In-Office ($112 per
Visit)
Hospital Outpatient ($539 per
Visit)
Hospital Emergency -
Not Admitted ($607 per
Visit)
Hospital Emergency -
Admitted ($143 per
Visit)
Physician In-Office
Hospital Outpatient
Hospital Emergency -
Not Admitted
Hospital Emergency -
Admitted
Accidents caused by striking against or struck by objects or persons; caught in or between objects; or machinery
3,912,475 742,299 3,686,827 52,068 0.058
$25.415
$23.206
$129.798
$0.432
$178.851
Railway accidents and other road vehicle accidents 340,042 31,225 208,039 29,616 0.058 $2.209 $0.976 $7.324 $0.246 $10.755
Accidental poisoning by drugs, medicinal substances, and biologicals and accidental poisoning by other solid and liquid substances, gases, and vapors
211,122 16,758 188,922 51,632 0.058 $1.371 $0.524 $6.651 $0.428 $8.975
Self-inflicted injury 66,905 0 207,016 111,408 0.058 $0.435 $0.000 $7.288 $0.924 $8.647
Water transport accidents 49,955 2,669 27,699 11,888 0.058 $0.325 $0.083 $0.975 $0.099 $1.482
Total 16,817,870 1,950,469 13,321,224 1,043,091 $112.613 $77.730 $639.323 $10.336 $840.002 1 Overall number of acute visits was based on NAMCS and NHAMCS, 2006. For physician office and hospital outpatient department, the distribution of visits by cause is based on the 2004 NAMCS and NHAMCS, because cause of injury is only reported in the 2006 files for emergency room visits.
2 Based on CDC literature review.
3 Calculated by multiplying mean expenditures per visit from MEPS 2006 times the number of visits and alcohol attribution factor for the diagnosis.
Appendix C: Effect of Varying
Fetal Alcohol Syndrome Prevalence Rate

Final Report Economic Cost of Excessive Alcohol Consumption
97
Appendix Table C-1: Health Care Costs Attributable to Fetal Alcohol Syndrome, 2006 (in millions $)
Age Group Annual
Expected Cost of Treatment
Conservative 0.5/1000 Prevalence
Base case 1/1000 Prevalence
Harwood (1998) 2/1000
FAS Population
National Annual Cost (millions $)
FAS Population
National Annual Cost (millions $)
FAS Population
National Annual Cost (millions $)
<18 $3,372.13 31,278 $105.473 62,556 $210.947 125,112 $421.894
18-77 $11,250.79 103,418 $1,163.535 206,835 $2,327.058 413,670 $4,654.116
Total, Ages 18-77 $9,421.27 134,696 $1,269.007 269,391 $2,538.005 538,782 $5,076.010
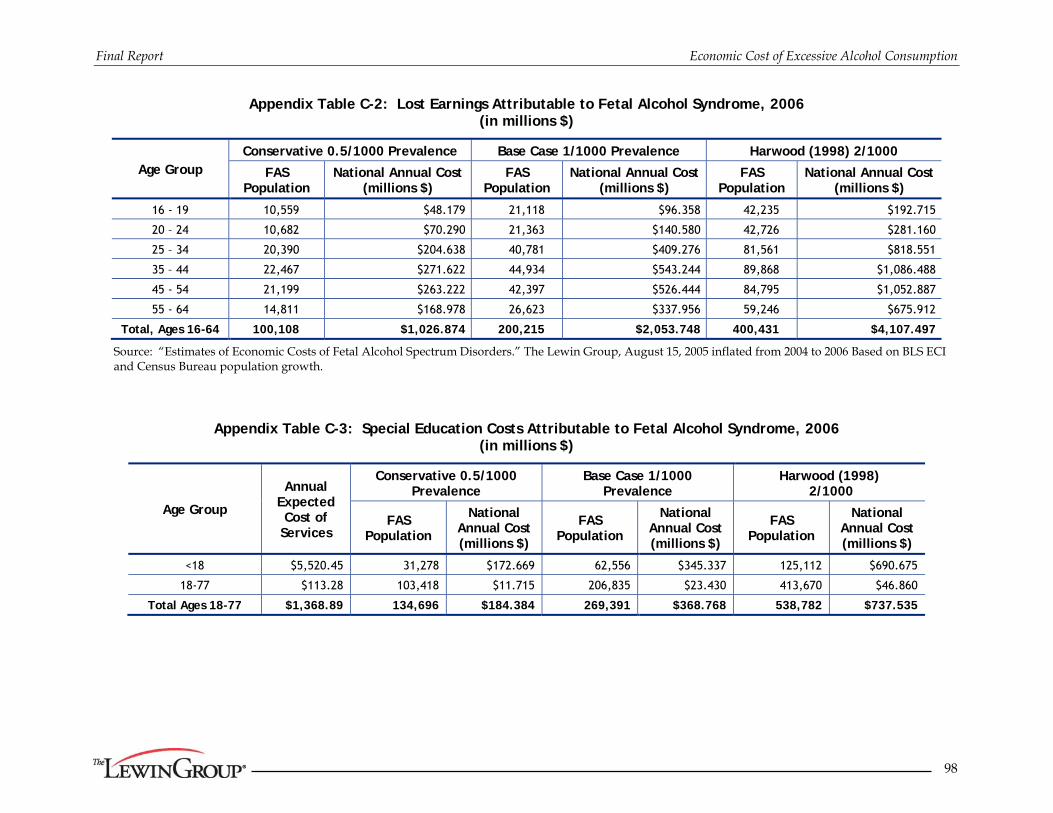
Final Report Economic Cost of Excessive Alcohol Consumption
98
Appendix Table C-2: Lost Earnings Attributable to Fetal Alcohol Syndrome, 2006 (in millions $)
Age Group Conservative 0.5/1000 Prevalence Base Case 1/1000 Prevalence Harwood (1998) 2/1000
FAS Population
National Annual Cost (millions $)
FAS Population
National Annual Cost (millions $)
FAS Population
National Annual Cost (millions $)
16 - 19 10,559 $48.179 21,118 $96.358 42,235 $192.715
20 – 24 10,682 $70.290 21,363 $140.580 42,726 $281.160
25 – 34 20,390 $204.638 40,781 $409.276 81,561 $818.551
35 – 44 22,467 $271.622 44,934 $543.244 89,868 $1,086.488
45 - 54 21,199 $263.222 42,397 $526.444 84,795 $1,052.887
55 - 64 14,811 $168.978 26,623 $337.956 59,246 $675.912
Total, Ages 16-64 100,108 $1,026.874 200,215 $2,053.748 400,431 $4,107.497
Source: “Estimates of Economic Costs of Fetal Alcohol Spectrum Disorders.” The Lewin Group, August 15, 2005 inflated from 2004 to 2006 Based on BLS ECI and Census Bureau population growth.
Appendix Table C-3: Special Education Costs Attributable to Fetal Alcohol Syndrome, 2006 (in millions $)
Age Group
Annual Expected Cost of
Services
Conservative 0.5/1000 Prevalence
Base Case 1/1000 Prevalence
Harwood (1998) 2/1000
FAS Population
National Annual Cost (millions $)
FAS Population
National Annual Cost (millions $)
FAS Population
National Annual Cost (millions $)
<18 $5,520.45 31,278 $172.669 62,556 $345.337 125,112 $690.675
18-77 $113.28 103,418 $11.715 206,835 $23.430 413,670 $46.860
Total Ages 18-77 $1,368.89 134,696 $184.384 269,391 $368.768 538,782 $737.535

Appendix D: Supplemental Tables for
Productivity Results
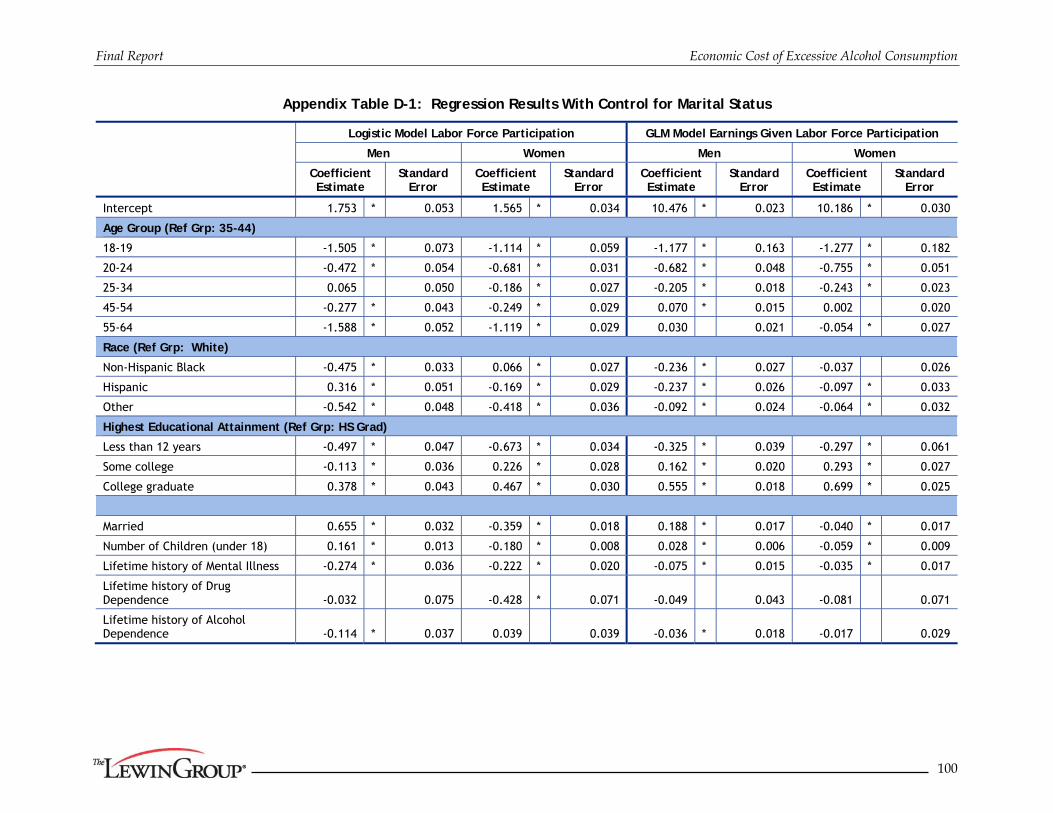
Final Report Economic Cost of Excessive Alcohol Consumption
100
Appendix Table D-1: Regression Results With Control for Marital Status
Logistic Model Labor Force Participation GLM Model Earnings Given Labor Force Participation
Men Women Men Women
Coefficient Estimate
Standard Error
Coefficient Estimate
Standard Error
Coefficient Estimate
Standard Error
Coefficient Estimate
Standard Error
Intercept 1.753 * 0.053 1.565 * 0.034 10.476 * 0.023 10.186 * 0.030
Age Group (Ref Grp: 35-44)
18-19 -1.505 * 0.073 -1.114 * 0.059 -1.177 * 0.163 -1.277 * 0.182
20-24 -0.472 * 0.054 -0.681 * 0.031 -0.682 * 0.048 -0.755 * 0.051
25-34 0.065 0.050 -0.186 * 0.027 -0.205 * 0.018 -0.243 * 0.023
45-54 -0.277 * 0.043 -0.249 * 0.029 0.070 * 0.015 0.002 0.020
55-64 -1.588 * 0.052 -1.119 * 0.029 0.030 0.021 -0.054 * 0.027
Race (Ref Grp: White)
Non-Hispanic Black -0.475 * 0.033 0.066 * 0.027 -0.236 * 0.027 -0.037 0.026
Hispanic 0.316 * 0.051 -0.169 * 0.029 -0.237 * 0.026 -0.097 * 0.033
Other -0.542 * 0.048 -0.418 * 0.036 -0.092 * 0.024 -0.064 * 0.032
Highest Educational Attainment (Ref Grp: HS Grad)
Less than 12 years -0.497 * 0.047 -0.673 * 0.034 -0.325 * 0.039 -0.297 * 0.061
Some college -0.113 * 0.036 0.226 * 0.028 0.162 * 0.020 0.293 * 0.027
College graduate 0.378 * 0.043 0.467 * 0.030 0.555 * 0.018 0.699 * 0.025
Married 0.655 * 0.032 -0.359 * 0.018 0.188 * 0.017 -0.040 * 0.017
Number of Children (under 18) 0.161 * 0.013 -0.180 * 0.008 0.028 * 0.006 -0.059 * 0.009
Lifetime history of Mental Illness -0.274 * 0.036 -0.222 * 0.020 -0.075 * 0.015 -0.035 * 0.017
Lifetime history of Drug Dependence -0.032 0.075 -0.428 * 0.071 -0.049 0.043 -0.081 0.071
Lifetime history of Alcohol Dependence -0.114 * 0.037 0.039 0.039 -0.036 * 0.018 -0.017 0.029

Appendix Table D-2: Productivity Loss Due to Mortality, 2006 by Age and Gender 5% Discount Rate
Age/Gender Group
Number of Alcohol-attributable Deaths1
Net Present Value of Future
Earnings2
Total Loss (in millions $)
Acute Chronic Acute Chronic All
(1) (2) (3) (4) (2) X (4) (3) X (4) [(2) + (3)] X (4)
Male
<1 44 95 $567,193.75 $24.957 $53.883 $78.840
1-4 79 0 $626,156.49 $49.466 $0.000 $49.466
5-9 60 0 $746,540.49 $44.792 $0.000 $44.792
10-14 95 0 $907,349.85 $86.198 $0.000 $86.198
15-19 2,336 0 $1,090,407.80 $2,547.193 $0.000 $2,547.193
20-24 4,683 90 $1,237,511.41 $5,795.266 $111.376 $5,906.642
25-29 3,669 168 $1,296,055.02 $4,755.226 $217.737 $4,972.963
20-34 3,093 299 $1,272,602.92 $3,936.161 $380.508 $4,316.669
35-39 2,939 799 $1,185,290.92 $3,483.570 $947.047 $4,430.617
40-44 3,439 1,967 $1,054,459.31 $3,626.286 $2,074.121 $5,700.407
45-49 3,236 3,189 $881,482.53 $2,852.477 $2,811.048 $5,663.525
50-54 2,655 4,054 $677,689.75 $1,799.266 $2,747.354 $4,546.621
55-59 1,709 3,750 $455,196.88 $777.931 $1,706.988 $2,484.920
60-64 1,205 2,880 $252,984.58 $304.846 $728.596 $1,033.442
65-69 776 2,151 $128,243.12 $99.517 $275.851 $375.368
70-74 818 1,822 $61,219.90 $50.078 $111.543 $161.621
75-79 959 1,611 $25,485.66 $24.441 $41.057 $65.498
80-84 1,033 1,280 $11,591.41 $11.974 $14.837 $26.811
85+ 1,312 1,164 $3,239.41 $4.250 $3.771 $8.021
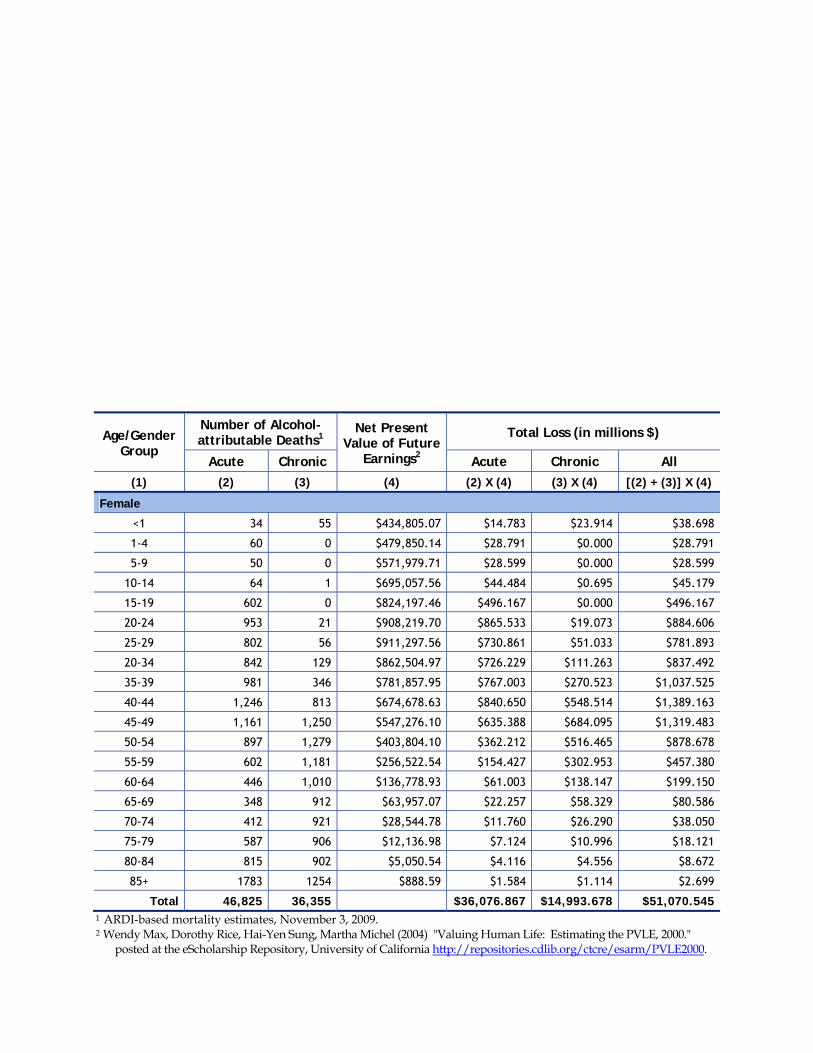
Age/Gender Group
Number of Alcohol-attributable Deaths1
Net Present Value of Future
Earnings2
Total Loss (in millions $)
Acute Chronic Acute Chronic All
(1) (2) (3) (4) (2) X (4) (3) X (4) [(2) + (3)] X (4)
Female
<1 34 55 $434,805.07 $14.783 $23.914 $38.698
1-4 60 0 $479,850.14 $28.791 $0.000 $28.791
5-9 50 0 $571,979.71 $28.599 $0.000 $28.599
10-14 64 1 $695,057.56 $44.484 $0.695 $45.179
15-19 602 0 $824,197.46 $496.167 $0.000 $496.167
20-24 953 21 $908,219.70 $865.533 $19.073 $884.606
25-29 802 56 $911,297.56 $730.861 $51.033 $781.893
20-34 842 129 $862,504.97 $726.229 $111.263 $837.492
35-39 981 346 $781,857.95 $767.003 $270.523 $1,037.525
40-44 1,246 813 $674,678.63 $840.650 $548.514 $1,389.163
45-49 1,161 1,250 $547,276.10 $635.388 $684.095 $1,319.483
50-54 897 1,279 $403,804.10 $362.212 $516.465 $878.678
55-59 602 1,181 $256,522.54 $154.427 $302.953 $457.380
60-64 446 1,010 $136,778.93 $61.003 $138.147 $199.150
65-69 348 912 $63,957.07 $22.257 $58.329 $80.586
70-74 412 921 $28,544.78 $11.760 $26.290 $38.050
75-79 587 906 $12,136.98 $7.124 $10.996 $18.121
80-84 815 902 $5,050.54 $4.116 $4.556 $8.672
85+ 1783 1254 $888.59 $1.584 $1.114 $2.699
Total 46,825 36,355 $36,076.867 $14,993.678 $51,070.545 1 ARDI-based mortality estimates, November 3, 2009. 2 Wendy Max, Dorothy Rice, Hai-Yen Sung, Martha Michel (2004) "Valuing Human Life: Estimating the PVLE, 2000."
posted at the eScholarship Repository, University of California http://repositories.cdlib.org/ctcre/esarm/PVLE2000.

The inflation calculator on http://data.bls.gov/cgi-bin/cpicalc.pl was used to inflate the 2000 values 17.07% to obtain estimates for 2006.

Appendix E: Supplemental Tables
for Criminal Justice System Costs
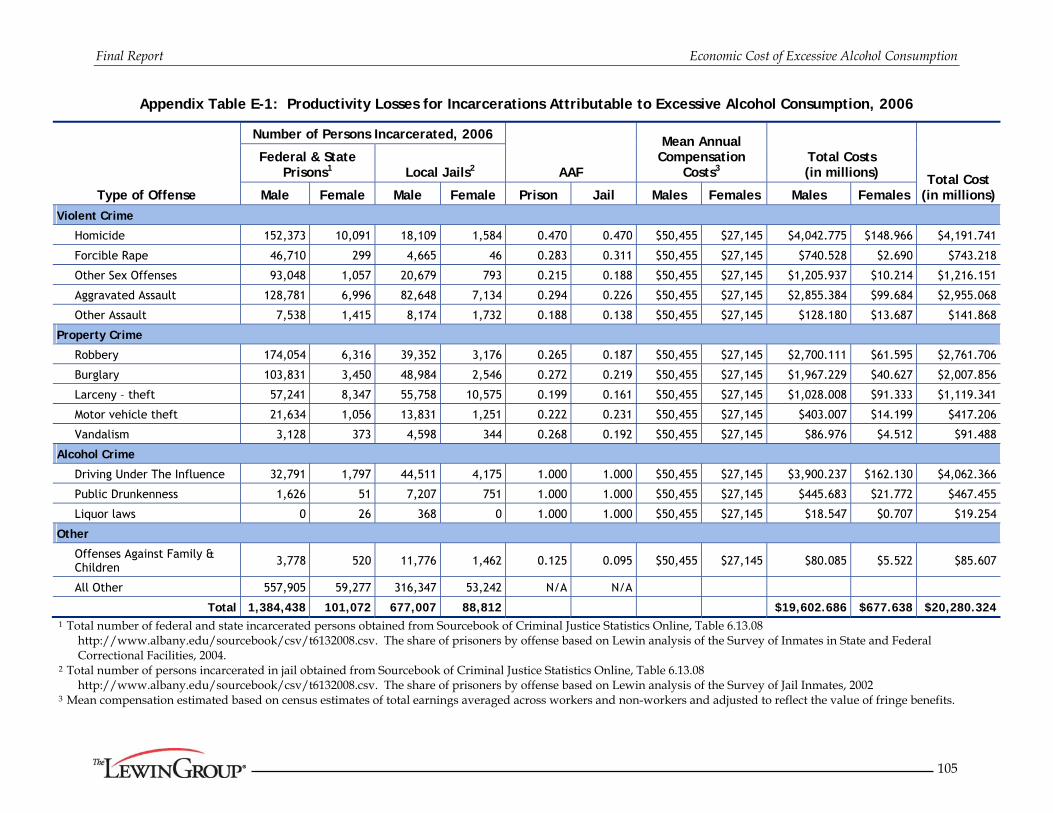
Final Report Economic Cost of Excessive Alcohol Consumption
105
Appendix Table E-1: Productivity Losses for Incarcerations Attributable to Excessive Alcohol Consumption, 2006
Type of Offense
Number of Persons Incarcerated, 2006
AAF
Mean Annual Compensation
Costs3 Total Costs (in millions) Total Cost
(in millions)
Federal & State Prisons1 Local Jails2
Male Female Male Female Prison Jail Males Females Males Females
Violent Crime
Homicide 152,373 10,091 18,109 1,584 0.470 0.470 $50,455 $27,145 $4,042.775 $148.966 $4,191.741
Forcible Rape 46,710 299 4,665 46 0.283 0.311 $50,455 $27,145 $740.528 $2.690 $743.218
Other Sex Offenses 93,048 1,057 20,679 793 0.215 0.188 $50,455 $27,145 $1,205.937 $10.214 $1,216.151
Aggravated Assault 128,781 6,996 82,648 7,134 0.294 0.226 $50,455 $27,145 $2,855.384 $99.684 $2,955.068
Other Assault 7,538 1,415 8,174 1,732 0.188 0.138 $50,455 $27,145 $128.180 $13.687 $141.868
Property Crime
Robbery 174,054 6,316 39,352 3,176 0.265 0.187 $50,455 $27,145 $2,700.111 $61.595 $2,761.706
Burglary 103,831 3,450 48,984 2,546 0.272 0.219 $50,455 $27,145 $1,967.229 $40.627 $2,007.856
Larceny – theft 57,241 8,347 55,758 10,575 0.199 0.161 $50,455 $27,145 $1,028.008 $91.333 $1,119.341
Motor vehicle theft 21,634 1,056 13,831 1,251 0.222 0.231 $50,455 $27,145 $403.007 $14.199 $417.206
Vandalism 3,128 373 4,598 344 0.268 0.192 $50,455 $27,145 $86.976 $4.512 $91.488
Alcohol Crime
Driving Under The Influence 32,791 1,797 44,511 4,175 1.000 1.000 $50,455 $27,145 $3,900.237 $162.130 $4,062.366
Public Drunkenness 1,626 51 7,207 751 1.000 1.000 $50,455 $27,145 $445.683 $21.772 $467.455
Liquor laws 0 26 368 0 1.000 1.000 $50,455 $27,145 $18.547 $0.707 $19.254
Other
Offenses Against Family & Children 3,778 520 11,776 1,462 0.125 0.095 $50,455 $27,145 $80.085 $5.522 $85.607
All Other 557,905 59,277 316,347 53,242 N/A N/A
Total 1,384,438 101,072 677,007 88,812 $19,602.686 $677.638 $20,280.324 1 Total number of federal and state incarcerated persons obtained from Sourcebook of Criminal Justice Statistics Online, Table 6.13.08
http://www.albany.edu/sourcebook/csv/t6132008.csv. The share of prisoners by offense based on Lewin analysis of the Survey of Inmates in State and Federal Correctional Facilities, 2004.
2 Total number of persons incarcerated in jail obtained from Sourcebook of Criminal Justice Statistics Online, Table 6.13.08 http://www.albany.edu/sourcebook/csv/t6132008.csv. The share of prisoners by offense based on Lewin analysis of the Survey of Jail Inmates, 2002
3 Mean compensation estimated based on census estimates of total earnings averaged across workers and non-workers and adjusted to reflect the value of fringe benefits.

Final Report Economic Cost of Excessive Alcohol Consumption
106
Appendix Table E-2: Share of Arrests Attributable to Alcohol, 2006
Offense Number of Arrests1
AAF2
Number of Alcohol-attributable Arrests
Under Age 15
Age 15-20 Age 21 or
Older Under Age
153 Age 15-20 Age 21 or
Older Total
(1) (2) (3) (4) (5) (6) (3) X (5) (4) X (5)
Violent Crime
Homicide 81 2,827 6,907 47.0% 0 1,329 3,246 4,575
Forcible Rape 916 4,099 12,097 31.1% 0 1,275 3,762 5,037
Other Sex Offenses 5,467 13,051 44,725 18.8% 0 2,454 8,408 10,862
Aggravated Assault 14,405 66,981 246,092 22.6% 0 15,138 55,617 70,754
Other Assault 71,704 203,743 677,294 13.8% 0 28,117 93,467 121,583
Property Crime
Robbery 6,023 40,003 47,501 18.7% 0 7,481 8,883 16,363
Burglary 19,514 81,655 121,023 21.9% 0 17,882 26,504 44,386
Larceny – theft 69,542 254,632 477,459 16.1% 0 40,996 76,871 117,867
Motor vehicle theft 5,913 36,481 58,381 23.1% 0 8,427 13,486 21,913
Vandalism 35,214 85,604 99,604 19.2% 0 16,436 19,124 35,560
Other
Offenses Against Family and Children 1,110 8,274 82,681 9.5% 0 786 7,855 8,641
Total 474,555 2,618,920 7,378,957 NA 0 140,319 317,222 457,542 1 Number of arrests by age and type of crime are based on Lewin analysis of Table 4.7 from the Sourcebook of Criminal Justice Statistics Online, 2006
http://www.albany.edu/sourcebook/csv/t472006.csv 2 AAFs are discussed in Section II.C.2. 3 Arrests for individuals under 15 were not attributed to alcohol unless the offense was 100% attributable to alcohol.
Appendix Table E-3: Share of Arrests Attributable to Alcohol, 2006
Under Age 15 Age 15-20 Age 21 or Older Total
Number of Alcohol Crimes 11,146 480,726 1,425,437 1,917,309
Number of Violent and Property Alcohol-attributable Arrests 0 140,319 317,222 457,542
Total Number of Arrests 474,555 2,618,920 7,378,957 10,472,432
% of Arrests Attributable to Alcohol 0.0% 5.4% 4.3% 5.3%
Appendix F: Alcohol-attributable Motor-Vehicle
Crashes

Final Report Economic Cost of Excessive Alcohol Consumption
108
Table F-1: Alcohol-Involved and Alcohol-Attributable (BAC =>.10) Motor-Vehicle Crash Costs, 2000
PDO MAIS 0 MAIS 1 MAIS 2 MAIS 3 MAIS 4 MAIS 5 Fatal Total
Number of Alcohol-Involved Crashes1 2,301,199 262,991 372,247 91,714 36,244 8,578 3,771 16,792 3,093,536
Number of Crashes with BAC>0.102 1,984,677 161,879 221,575 69,286 23,060 6,100 2,981 13,277 2,482,835
Alcohol-attributable % of Alcohol-Involved Crashes3
86.2% 61.6% 59.5% 75.5% 63.6% 71.1% 79.1% 79.1% 80.3%
Unit Costs for Alcohol-Involved Crashes4
Insurance Administration $116 $80 $495 $6,240 $16,390 $24,184 $48,232 $35,472 NA
Legal Costs $0 $0 $172 $6,023 $17,223 $37,464 $88,753 $102,138 NA
Travel Delay $803 $773 $777 $846 $940 $999 $9,148 $9,148 NA
Property Damage $1,484 $1,019 $3,844 $3,954 $6,799 $9,833 $9,446 $10,273 NA
Total $2,403 $1,872 $5,288 $17,063 $41,352 $72,480 $155,579 $157,031 NA
Total Cost for Alcohol-attributable Crashes with BAC =>.10 (in Millions)
Insurance Administration $230.101 $12.948 $109.637 $432.056 $377.800 $147.496 $143.870 $471.152 $1,925.060
Legal Costs $0.000 $0.000 $38.096 $417.057 $397.011 $228.491 $264.738 $1,356.645 $2,702.038
Travel Delay $1,592.858 $125.228 $172.095 $58.580 $21.668 $6.093 $27.287 $121.508 $2,125.318
Property Damage $2,943.712 $165.081 $851.396 $273.791 $156.725 $59.971 $28.176 $136.451 $4,615.303
Total $4,766.671 $303.257 $1,171.224 $1,181.484 $953.204 $442.051 $464.071 $2,085.756 $11,367.718
Source: "The Economic Impact of Motor Vehicle Crashes, 2000" (NHTSA Technical Report). May 2002. 1 Alcohol-involved Crashes drawn from Table 10 column 6 page 38. 2 Number of crashes with a BAC>0.10 drawn from Table 10 column 4 page 38. 3 Alcohol-attributable share was equal to the share of all alcohol-involved crashes with a BAC >0.10. 4 Unit cost estimates drawn from Table 12 page 41. Unit costs are on a per-person basis for all injury levels. PDO costs are on a per damaged vehicle basis.
Medical Insurance costs were excluded from the insurance administration costs as these costs are summarized in the health care section of this report.
MAIS: Maximum Abbreviated Injury Scale - a classification system for assessing impact injury severity
PDO: Property damage only

Final Report Economic Cost of Excessive Alcohol Consumption
109
Table F-2: Alcohol-Involved and Alcohol-Caused Motor Vehicle Crash Costs, 2000
PDO MAIS 0 MAIS 1 MAIS 2 MAIS 3 MAIS 4 MAIS 5 Fatal Total
Number of Alcohol-Involved Crashes1 2,301,199 262,991 372,247 91,714 36,244 8,578 3,771 16,792 3,093,536
Number of Alcohol- Caused Crashes2 1,963,718 183,511 254,989 72,082 25,763 6,502 3,047 13,570 2,523,182
Alcohol-attributable % of Alcohol-Involved Crashes3 85.3% 69.8% 68.5% 78.6% 71.1% 75.8% 80.8% 80.8% 81.6%
Unit Costs for Alcohol-Involved Crashes4
Insurance Administration $116 $80 $495 $6,240 $16,390 $24,184 $48,232 $35,472 NA
Legal Costs $0 $0 $172 $6,023 $17,223 $37,464 $88,753 $102,138 NA
Travel Delay $803 $773 $777 $846 $940 $999 $9,148 $9,148 NA
Property Damage $1,484 $1,019 $3,844 $3,954 $6,799 $9,833 $9,446 $10,273 NA
Total $2,403 $1,872 $5,288 $17,063 $41,352 $72,480 $155,579 $157,031 NA
Total Cost for Alcohol-Caused Crashes (in Millions)
Insurance Administration $227.699 $14.672 $126.221 $449.796 $422.352 $157.246 $146.962 $481.278 $2,026.225
Legal Costs $0.000 $0.000 $43.858 $434.181 $443.828 $243.596 $270.428 $1,385.802 $2,821.692
Travel Delay $1,576.227 $141.898 $198.127 $60.986 $24.223 $6.496 $27.874 $124.119 $2,159.949
Property Damage $2,912.977 $187.056 $980.178 $285.033 $175.207 $63.935 $28.782 $139.383 $4,772.551
Total $4,716.903 $343.625 $1,348.384 $1,229.995 $1,065.610 $471.272 $474.045 $2,130.583 $11,780.417
Source: "The Economic Impact of Motor Vehicle Crashes, 2000" (NHTSA Technical Report). May 2002. 1 Alcohol-involved crashes drawn from Table 10 column 6 page 38. 2 Number of alcohol-caused crashes drawn from Table 13 column 5 page 42. 3 Alcohol-caused share was equal to the share of all alcohol-involved crashes caused by alcohol. 4 Unit cost estimates drawn from Table 12 page 41. Unit costs are on a per-person basis for all injury levels. PDO costs are on a per damaged vehicle basis.
Medical Insurance costs (page 78, i.e., 7.46%) were excluded from the insurance administration costs as these costs are summarized in the health care section.
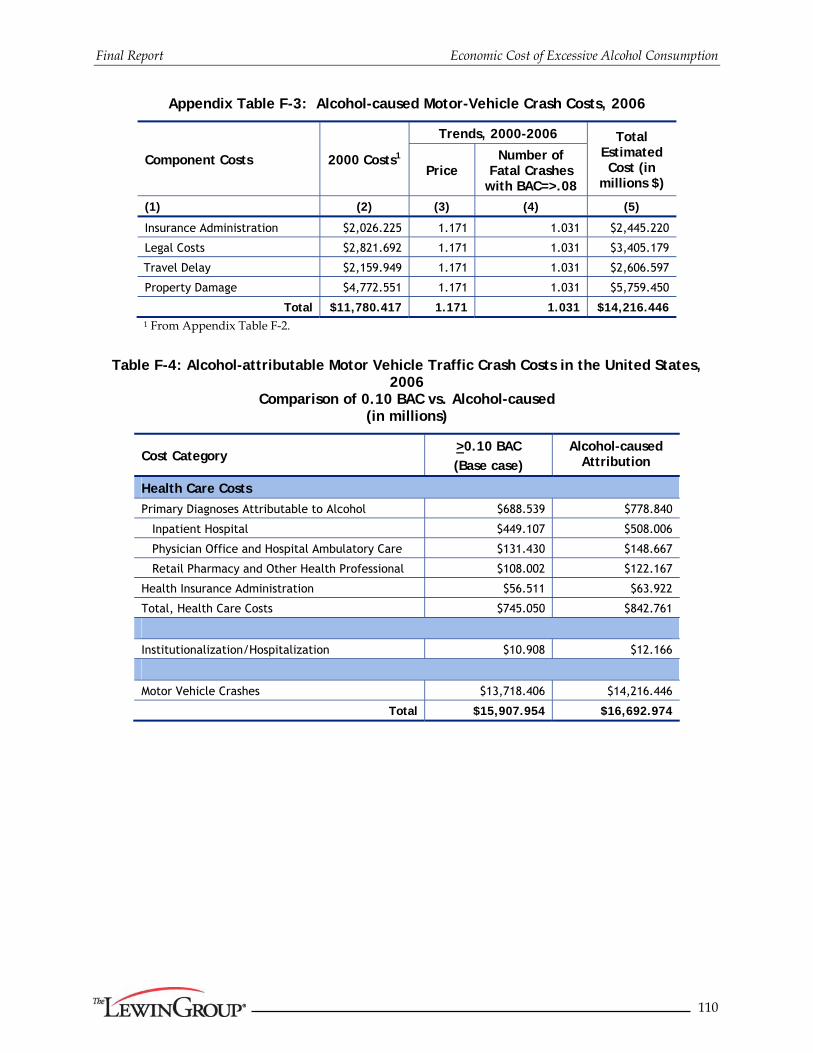
Final Report Economic Cost of Excessive Alcohol Consumption
110
Appendix Table F-3: Alcohol-caused Motor-Vehicle Crash Costs, 2006
Component Costs 2000 Costs1
Trends, 2000-2006 Total Estimated Cost (in
millions $) Price
Number of Fatal Crashes
with BAC=>.08
(1) (2) (3) (4) (5)
Insurance Administration $2,026.225 1.171 1.031 $2,445.220
Legal Costs $2,821.692 1.171 1.031 $3,405.179
Travel Delay $2,159.949 1.171 1.031 $2,606.597
Property Damage $4,772.551 1.171 1.031 $5,759.450
Total $11,780.417 1.171 1.031 $14,216.446 1 From Appendix Table F-2.
Table F-4: Alcohol-attributable Motor Vehicle Traffic Crash Costs in the United States, 2006
Comparison of 0.10 BAC vs. Alcohol-caused (in millions)
Cost Category >0.10 BAC
(Base case)
Alcohol-caused Attribution
Health Care Costs
Primary Diagnoses Attributable to Alcohol $688.539 $778.840
Inpatient Hospital $449.107 $508.006
Physician Office and Hospital Ambulatory Care $131.430 $148.667
Retail Pharmacy and Other Health Professional $108.002 $122.167
Health Insurance Administration $56.511 $63.922
Total, Health Care Costs $745.050 $842.761
Institutionalization/Hospitalization $10.908 $12.166
Motor Vehicle Crashes $13,718.406 $14,216.446
Total $15,907.954 $16,692.974
Appendix G: Comparison of Alcohol-Attributable
Conditions and Fractions to Previous Research
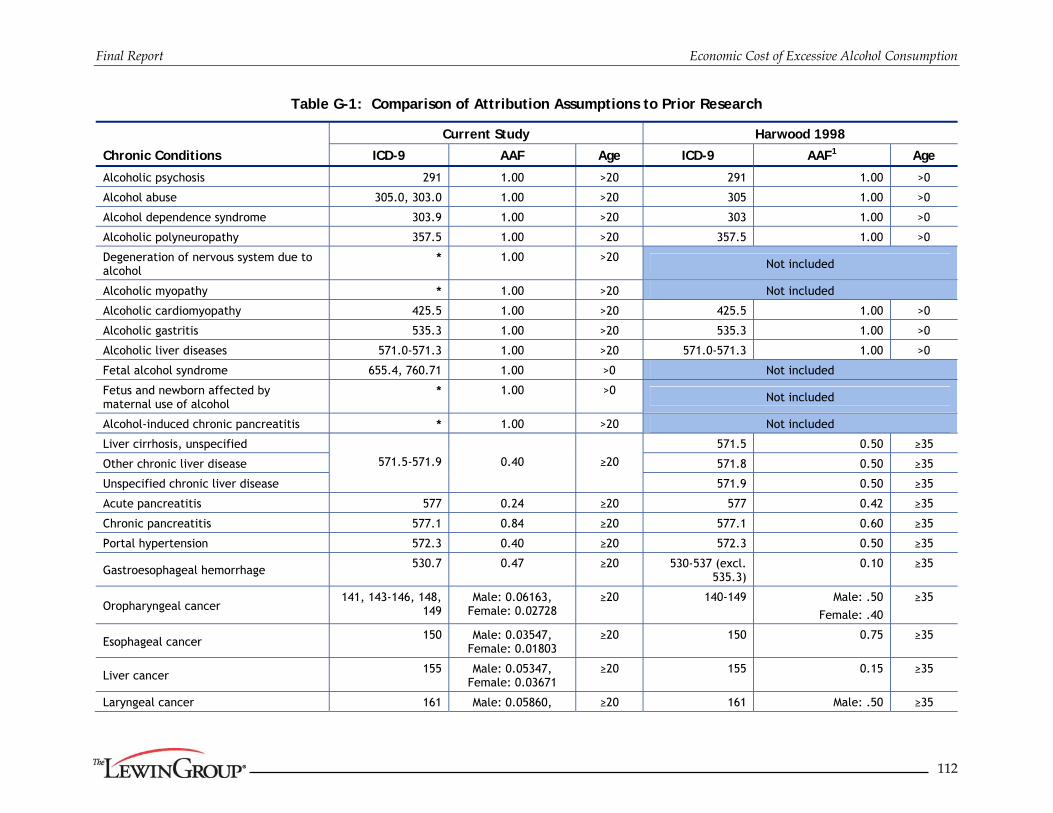
Final Report Economic Cost of Excessive Alcohol Consumption
112
Table G-1: Comparison of Attribution Assumptions to Prior Research
Chronic Conditions
Current Study Harwood 1998
ICD-9 AAF Age ICD-9 AAF1 Age
Alcoholic psychosis 291 1.00 >20 291 1.00 >0
Alcohol abuse 305.0, 303.0 1.00 >20 305 1.00 >0
Alcohol dependence syndrome 303.9 1.00 >20 303 1.00 >0
Alcoholic polyneuropathy 357.5 1.00 >20 357.5 1.00 >0
Degeneration of nervous system due to alcohol
* 1.00 >20 Not included
Alcoholic myopathy * 1.00 >20 Not included
Alcoholic cardiomyopathy 425.5 1.00 >20 425.5 1.00 >0
Alcoholic gastritis 535.3 1.00 >20 535.3 1.00 >0
Alcoholic liver diseases 571.0-571.3 1.00 >20 571.0-571.3 1.00 >0
Fetal alcohol syndrome 655.4, 760.71 1.00 >0 Not included
Fetus and newborn affected by maternal use of alcohol
* 1.00 >0 Not included
Alcohol-induced chronic pancreatitis * 1.00 >20 Not included
Liver cirrhosis, unspecified
571.5-571.9
0.40
≥20
571.5 0.50 ≥35
Other chronic liver disease 571.8 0.50 ≥35
Unspecified chronic liver disease 571.9 0.50 ≥35
Acute pancreatitis 577 0.24 ≥20 577 0.42 ≥35
Chronic pancreatitis 577.1 0.84 ≥20 577.1 0.60 ≥35
Portal hypertension 572.3 0.40 ≥20 572.3 0.50 ≥35
Gastroesophageal hemorrhage 530.7 0.47 ≥20 530-537 (excl. 535.3)
0.10 ≥35
Oropharyngeal cancer 141, 143-146, 148,
149 Male: 0.06163,
Female: 0.02728 ≥20 140-149 Male: .50
Female: .40
≥35
Esophageal cancer 150 Male: 0.03547, Female: 0.01803
≥20 150 0.75 ≥35
Liver cancer 155 Male: 0.05347, Female: 0.03671
≥20 155 0.15 ≥35
Laryngeal cancer 161 Male: 0.05860, ≥20 161 Male: .50 ≥35

Final Report Economic Cost of Excessive Alcohol Consumption
113
Chronic Conditions
Current Study Harwood 1998
ICD-9 AAF Age ICD-9 AAF1 Age Female: 0.03926 Female: .40
Superventricular cardiac dysrhythmia 427.0, 427.2, 427.3 Male: 0.02011, Female: 0.01493
≥20 Not included
Esophageal varices 456.0-456.2 0.40 ≥20 Not included
Stroke, ischemic 433-435, 437, 362.34
Male: 0.05107, Female: 0.01365
≥20
430-438
0.07
≥35
Stroke, hemorrhagic 430-432 Male: 0.08375, Female: 0.01713
≥20
Ischemic heart disease 410-414 Male: 0.00210, Female: 0.00115
≥20 Not included
Epilepsy 345 0.15 ≥20 Not included
Breast cancer, females 174 Male: 0,
Female: 0.00867
≥20 Not included
Hypertension 401-405 Male: 0.02901, Female: 0.02018
≥20 401 0.08 ≥35
Psoriasis 696.1 Male: 0.00875, Female: 0.00335
≥20 Not included
Spontaneous abortion 634 0.04 ≥20 Not included
Cholelithiases 574 Male: -0.01214, Female: -0.00713
≥20 Not included
Low birth weight, prematurity, intrauterine growth retardation
656.5, 764, 765 Male: 0.03434, Female: 0.02550
>0 Not included
Chronic hepatitis 571.4 Male: 0.01778, Female: 0.00912
≥20 571.4 0.50 ≥35
Prostate cancer 185 Male: 0.00657, Female: 0
≥20 Not included
Diabetes mellitus Not included 250 0.05 ≥35
Pneumonia and influenza Not included 480-487 0.05 ≥35
Stomach Cancer Not included 151 0.20 ≥35
Tuberculosis Not included 011-012 0.25 ≥35
1 1994 Alcohol Attribution Factors taken from tables 5.5 and A.1. Nonfatal Acute AAFs taken from table 4.9

Final Report Economic Cost of Excessive Alcohol Consumption
114
Table G-1: Comparison of Attribution Assumptions to Prior Research
Acute Conditions
Current Study Harwood 1998
ICD-9 AAF Age ICD-9 AAF1 Age
Alcohol poisoning 980.0, 980.1, E860.0,
E860.1, E860.2, E860.9
1.00 >15 E860.0, E860.1 1.00 >0
Suicide by and exposure to alcohol * 1.00 >15 Not included
Excessive blood level of alcohol 790.3 1.00 >15 790.3 1.00 >0
Air-space transport accidents E840-E845 Fatal: 0.18, Nonfatal: 0.058 ≥15 E840-E845 0.16 >0
Inhalation and ingestion of food causing obstruction of respiratory tract or suffocation
E911 Fatal: 0.18, Nonfatal: 0.058 ≥15 E911 0.25 ≥15
Child Maltreatment E960-E968 Fatal: 0.16, Nonfatal: 0.058 ≤14 Not included
Unintentional drowning/submersion E910 Fatal: 0.34, Nonfatal: 0.058 ≥15 E910 0.38 >0
Accidental Falls E880-E888, E848 Fatal: 0.32, Nonfatal: 0.058 ≥15 E880-E888 0.35 ≥15
Accidents caused by fire and flames E890-E899 Fatal: 0.42, Nonfatal: 0.058 ≥15 E890-E899 0.45 >0
Accidents caused by firearm and air gun missile
E922 Fatal: 0.18, Nonfatal: 0.058 ≥15 E922 0.25 ≥15
Assault/Homicide E960-E969 Fatal: 0.47, Nonfatal: 0.267 ≥15 E960-E969 0.46 ≥15
Accidents due to excessive cold E901 Fatal: 0.42, Nonfatal: 0.058 ≥15 E901 0.25 ≥15
Occupational and machine injuries E917-E920 Fatal: 0.18, Nonfatal: 0.058 ≥15 E917-E920 0.25 ≥15
Other road vehicle crashes E800-E807, E826-E829 Fatal: 0.18, Nonfatal: 0.058 ≥15 E826, E829 0.20 >0
Poisoning (not alcohol) E850-E869 Fatal: 0.29, Nonfatal: 0.058 ≥15 Not included
Suicide E950-E959 Fatal: 0.23, Nonfatal: 0.058 ≥15 E950-E959 0.28 ≥15
Water transport accidents E830-E838 Fatal: 0.18, Nonfatal: 0.058 ≥15 E830-E838 0.20 >0
All Nonfatal Injuries Not included 800-995 Nonfatal: 0.10 >0
Other injuries and adverse affects Not included E980 0.25 ≥15
Motor-vehicle nontraffic crashes E820-E825 Fatal: 0.18, Nonfatal: 0.058 ≥15 E810-E825 Fatal: 0.42 Nonfatal: 0.10
>0

Final Report Economic Cost of Excessive Alcohol Consumption
115
Acute Conditions
Current Study Harwood 1998
ICD-9 AAF Age ICD-9 AAF1 Age
Motor-vehicle traffic crashes E810-E819
Males:
≥0
E810-E825
Fatal: 0.42 Nonfatal: 0.10
>0
0-14: 0.16
15-19: 0.26
20-24: 0.46
25-34: 0.48
35-44: 0.47
45-54: 0.39
55-64: 0.27
65+: 0.13
Females:
0-14: 0.16
15-19: 0.20
20-24: 0.36
25-34: 0.37
35-44: 0.36
45-54: 0.26
55-64: 0.17
65+: 0.09
Nonfatal (all): 0.061
1 1994 Alcohol Attribution Factors taken from tables 5.5 and A.1. Nonfatal acute AAFs taken from table 4.9
* means not present in ICD-9
Final Report Economic Cost of Excessive Alcohol Consumption
116
References:
1. Midanik LT, Chaloupka FJ, Saitz R, Toomey TL, Fellows JL, Dufour M, Landen M, Brounstein PJ, Stahre MS, Brewer RD, Naimi TS, Miller JW. Alcohol-Attributable Deaths and Years of Potential Life Lost — United States, 2001. MMWR 2004;53(37);866-70.
2. Mokdad A, Marks J, Stroup D, Gerberding J. Actual causes of death in the United States, 2000. JAMA 2004; 291:1238-45.
3. Harwood H, Fountain D, Livermore G, et al. (1998) The Economic Costs to Society of Alcohol and Drugs in the United States: 1992. Report to the National Institute on Alcohol Abuse and Alcoholism and the National Institute on Drug Abuse, National Institute of Health, Rockville, MD.
4. http://pubs.niaaa.nih.gov/publications/economic-2000/alcoholcost.PDF. Accessed March 10, 2010.
5. Hodgson TA, Meiners MR. (1979) Guidelines for Cost-of-Illness Studies in the Public Health Service. Bethesda, MD: Public Health Service Task Force on Cost-of-Illness Studies.
6. Rice D. (1990) “The Economic Costs of Alcohol and Drug Abuse and Mental Illness: 1985.” DHHS Publication No. (ADM) 90-1694.
7. Mark TL, Levit KR, Coffey RM, McKusick DR, Harwood HJ, King EC, Bouchery E, Genuardi JS, Vandivort-Warren R, Buck JA, Ryan K: National Expenditures for Mental Health Services and Substance Abuse Treatment, 1993–2003: SAMHSA Publication SMA 07-4227. Rockville, Md, Substance Abuse and Mental Health Services Administration, 2007. Available at: http://csat.samhsa.gov/IDBSE/spendEst/reports/SAMHSAFINAL9303.pdf. Accessed March 10, 2010.
8. Levit KR, Kassed CA, Coffey RM, Mark TL, McKusick DR, King E, Vandivort R, Buck J, Ryan K, Stranges E. Projections of National Expenditures for Mental Health Services and Substance Abuse Treatment, 2004–2014. SAMHSA Publication No. SMA 08-4326. Rockville, MD: Substance Abuse and Mental Health Services Administration, 2008. Available at: http://csat.samhsa.gov/IDBSE/spendEst/reports/MHSA_Est_Spending2003_2014.pdf. Accessed March 10, 2010.
9. 2007 National Survey on Drug Use and Health National Findings. SAMHSA September 2008, p33.
10. “Estimates of Economic Costs of Fetal Alcohol Spectrum Disorders." The Lewin Group, August 15, 2005, unpublished study for the SAMHSA FASD Center for Excellence.
11. NHEA estimates were downloaded from http://www.cms.hhs.gov/NationalHealthExpendData/02_NationalHealthAccountsHistorical.asp. Accessed on March 18, 2009.
12. Harwood and Salinsky (1994) Substance Abuse Training Needs Analysis Final Report. Prepared for the Center on Substance Abuse Treatment, Substance Abuse and Mental Health Services Administration.
Final Report Economic Cost of Excessive Alcohol Consumption
117
13. McFarlin SK, Fals-Stewart W. Workplace Absenteeism and Alcohol Use: A Sequential Analysis. Psychology of Addictive Behaviors March 2002;16(1):17-21.
14. Manning W, Newhouse J, Duan N, Keeler R, Leibowitz A. Health Insurance and the Demand for Medical Care: Evidence from a Randomized Experiment. American Economic Review 1987;77:251-77.
15. Duan N. Smearing Estimates: A Non-Parametric Retransformation Technique. J Am Stat Assoc 1983;78(383):605-10.
16. Manning WG, Mullahy J. Estimating log models: to transform or not to transform? J Health Econ 2001;20:461-94.
17. Discount rates from OMB http://www.whitehouse.gov/sites/default/files/omb/assets/a94/dischist.pdf Accessed March 17, 2009
18. http://www.albany.edu/sourcebook/. Accessed March 10, 2010.
19. http://www.dol.gov/whd/state/stateMinWageHis.htm. Accessed March 10, 2010.
20. http://www.bls.gov/news.release/eci.nr0.htm. Accessed March 10, 2010.
21. http://www.ojp.usdoj.gov/bjs/pubalp2.htm#cvus. Accessed March 10, 2010.
22. Kenkel DS. Drinking, Driving, and Deterrence: The Effectiveness and Social Costs of Alternative Policies. J Law Econ 1993;877-913.
23. National Research Council, 55: A Decade of Experience (Special Report No. 204, Transportation Research Board 1984).
24. Weller D, Block M. Estimating the Cost of Judicial Services, in The Costs of Crime (Charles M. Gray ed. 1979).
25. http://lhsc.lsu.edu/Reports/SpecializedReports/EconomicImpact-1.pdf. Accessed March 10, 2010.
26. http://www.census.gov/compendia/statab/cats/law_enforcement_courts_prisons/fire_losses.html. Accessed March 10, 2010.
27. http://www.census.gov/compendia/statab/tables/09s0417.xls. Accessed March 10, 2010.
28. Ahrens M. “Possible Impairment by Alcohol or Drugs as a Factor in Reported Fires.” National Fire Protection Association. May 2009.
29. http://www.census.gov/compendia/statab/2010/tables/10s0657.xls. Accessed March 10, 2010.
30. http://www.census.gov/compendia/statab/2010/tables/10s0457.xls. Accessed March 10, 2010.
31. http://www.census.gov/compendia/statab/2010/tables/10s0418.xls. Accessed March 10, 2010.
32. http://www.census.gov/compendia/statab/2010/tables/10s1184.xls. Accessed March 10, 2010.

Final Report Economic Cost of Excessive Alcohol Consumption
118
33. http://www.madd.org/getfile/149f4a7c-7ece-4068-8f02-b8fd9795badf/2006-Alcohol-Related-NHTSA-DATA-March-2008.aspx. Accessed March 10, 2010.
34. Mark, TL, Harwood HJ, et al. Mental Health and Substance Abuse Spending by Age, 2003. J Behavioral Health Serv Research 2008;35:279-89.
35. http://www-nrd.nhtsa.dot.gov/Pubs/810644.PDF Table 3. Accessed March 10, 2010.
36. http://www.albany.edu/sourcebook/csv/t472006.csv. Accessed March 10, 2010.
37. Berry R, Boland J. (1973) The Economic Cost of Alcohol Abuse – 1972. Brookline, MA: Policy Analysis, Inc.
38. Chavez PR, Nelson DE, Naimi TS, Brewer RD. The Impact of a New Gender-Specific Definition of Binge Drinking on Prevalence Estimates for Women. Am J Prev Med 2011 (in press).
39. Miller, TR, Levy DT, Spicer RS, Taylor DM. Societal costs of underage drinking. J Studies Alc July 2006;67(4):519-28.
40. Grant BF, Dawson DA. Age at onset of alcohol use and its association with DSM-IV alcohol abuse and dependence: results from the National Longitudinal Alcohol Epidemiologic Survey. J Subst Abuse 1997;9:103–10.
41. Grant B. The impact of family history of alcoholism on the relationships between age at onset of alcohol use and DSM IV dependence. Alcohol Health Res World 1998;22:144–7.
42. Hingson R, Heeren T, Jamanka A, Howland J. Age of drinking onset and unintentional injury involvement after drinking. JAMA 2000;284:1527–33.
43. Grant BF, Stinson FS, Harford TC. Age at Onset of Alcohol Use and DSM-IV Alcohol Abuse and Dependence: a 12-Year Follow-Up. J Subst Abuse 2001;13(4):493-504.
44. Hingson RW, Heeren T, Winter MR. Age at drinking onset and alcohol dependence: age at onset, duration, and severity. Arch Pediatr Adolesc Med 2006;160:739–46.
45. Hingson RW, Heeren T, Winter MR. Age of Alcohol-Dependence Onset: Associations With Severity of Dependence and Seeking Treatment. Pediatrics September 2006;118(3):e755-e763.
46. http://www.niaaa.nih.gov/Resources/DatabaseResources/QuickFacts/AlcoholSales/consum02.htm. Accessed March 10, 2010.
47. http://www.census.gov/popest/states/tables/NST-EST2006-01.xls.