
Economic Contributions of Washington H-2A Workers - wafla Releases/2017/Econ...Economic...
18
Economic Contributions of Washington H-2A Workers May 2017 Prepared for: wafla KOIN Center 222 SW Columbia Street Suite 1600 Portland, OR 97201 503.222.6060
Transcript of Economic Contributions of Washington H-2A Workers - wafla Releases/2017/Econ...Economic...

Economic Contributions ofWashington H-2A Workers
May 2017 Prepared for: wafla
KOIN Center 222 SW Columbia Street
Suite 1600 Portland, OR 97201
503.222.6060

Economic Contributions of WA H-2A workers ECONorthwest May 2017 ii
Prepared for:
Sponsored By:

Economic Contributions of WA H-2A workers ECONorthwest May 2017 iii
Acknowledgments For over 40 years ECONorthwest has helped its clients make sound decisions based on rigorous economic planning, and financial analysis. For more information about ECONorthwest, visit www.econw.com.
ECONorthwest prepared this report for Wafla. It received assistance from the State of Washington, Office of Labor Market and Performance Analysis to calculate agricultural employment. ECONorthwest also received input from industry professionals to help calculate the costs associated with complying with the H-2A program.
That assistance notwithstanding, ECONorthwest is responsible for the content of this report. The staff at ECONorthwest prepared this report based on their general knowledge of input-output analysis and on information derived from government agencies, private statistical services, the reports of others, interviews of individuals, or other sources believed to be reliable. ECONorthwest has not independently verified the accuracy of all such information, and makes no representation regarding its accuracy or completeness. Any statements nonfactual in nature constitute the authors’ current opinions, which may change as more information becomes available.
For more information about this report:
ECONorthwest KOIN Center 222 SW Columbia Street Suite 1600 Portland, OR 97201 503.222.6060

Economic Contributions of WA H-2A workers ECONorthwest May 2017 iv
Disclaimer The information provided in this report has been obtained or derived from sources generally available to the public and believed by ECONorthwest to be reliable, but ECONorthwest does not make any representation or warranty, express or implied, as to its accuracy or completeness. The information is not intended to be used as the basis for any investment decisions by any person or entity.

Economic Contributions of WA H-2A workers ECONorthwest May 2017 v
Table of Contents
INTRODUCTION 1
H-2A LABOR AND TREE FRUIT 2
OVERVIEW OF ECONOMIC IMPACTS 6TRANSPORTATION, HOUSING, AND ADMINISTRATIVE COSTS 6H-2A DIRECT WAGES AND OUTPUT 7
RESULTS OF ECONOMIC CONTRIBUTIONS ANALYSIS 9
APPENDIX A: ECONOMIC IMPACT METHODOLOGY 11INPUT-OUTPUT MODELING 11IMPLAN ECONOMIC IMPACT MODEL 11ECONOMIC IMPACT TERMS AND DEFINITIONS 12LIMITATIONS OF ECONOMIC IMPACT ANALYSIS 13

Introduction Wafla, a membership-based agricultural association, enlisted ECONorthwest (ECO) to analyze the economic contributions of the H-2A seasonal visa program in the State of Washington.
The federal H-2A program enables agricultural employers to legally hire foreign workers if there are insufficient numbers of U.S. workers available to fill seasonal, time-sensitive agricultural positions. The agricultural industry in Washington produces a diverse range of high-value, labor-intensive crops and the industry plays a large and important role in the state’s economy. The production of these crops requires short-term labor that the domestic workforce frequently fails to supply at prevailing wages. The number of certified H-2A workers in Washington has grown from 2,981 in 2010 to 12,081 in 2015, with 64 percent working in tree fruit crops during 2015.
For this analysis, ECONorthwest measured the direct economic activity associated with the H-2A workforce in Washington in 2015 for apples, pears, and cherries using the input-output modeling software IMPLAN1 (IMpact Analysis for PLANning). To perform this analysis, ECONorthwest used publically available data from the U.S. Department of Agriculture, the U.S. Department of Labor, and the State of Washington. Due to limitations in the available data, the economic contributions analysis was performed for Washington State as a single geography.
Based on this analysis, ECONorthwest finds that H-2A workers:
§ Account for a growing share of workers harvesting apples, pears, and cherries
§ Represented $54,547 in output per worker in 2015, up from $39,598 in 2010
§ Increased their average production by 2.9 tons per worker between 2010 and 2015 Additionally, the results of our economic contributions analysis show that in 2015, the H-2A labor force for apples, pears, and cherries supported:
§ $619.0 million in total economic activity in Washington State
§ $111.5 million in total labor income for Washington State
§ 9,772 full-year equivalent (FYE) jobs in Washington State
1 IMPLAN is an economic impact assessment program that helps users develop local and regional input-output

Economic Contributions of WA H-2A workers ECONorthwest May 2017 2
H-2A Labor and Tree Fruit The H-2A program, authorized by the United States Immigration and Nationality Act, seeks to relieve pressure on agricultural employers facing domestic labor shortages. Under the program, agricultural employers that have demonstrated a shortage of available and qualified domestic labor may legally hire foreign agricultural workers for seasonal or temporary work. Foreign workers receive a guaranteed wage, an employment contract, free housing and transportation, and legal status in a highly regulated visa-based program.
The agricultural sector in Washington has experienced a decline in available domestic labor supply in recent years. This has resulted in increased use of the H-2A program to ensure an adequate number of workers are available to tend to and harvest crops. This is especially true in labor-intensive fruit crops, where non-H-2A employment2 has declined by 7 percent since 2010. Since that time, reliance on the H-2A program has increased across the industry to minimize the uncertainty of finding adequate labor.
As economic opportunities continue to improve in developing countries and the current migrant workforce ages, growers are becoming increasingly concerned about the future supply of agricultural labor. Washington State University (WSU) projects that farm labor will drop between 0.7 percent to 1.4 percent per year through 2038.3
For tree fruit, this is especially problematic given the sector’s heavy dependence on labor. For context, the WSU study finds that labor represents 17 percent of variable costs for all U.S. crops. In tree fruit, however, labor represents 48 percent of variable costs.
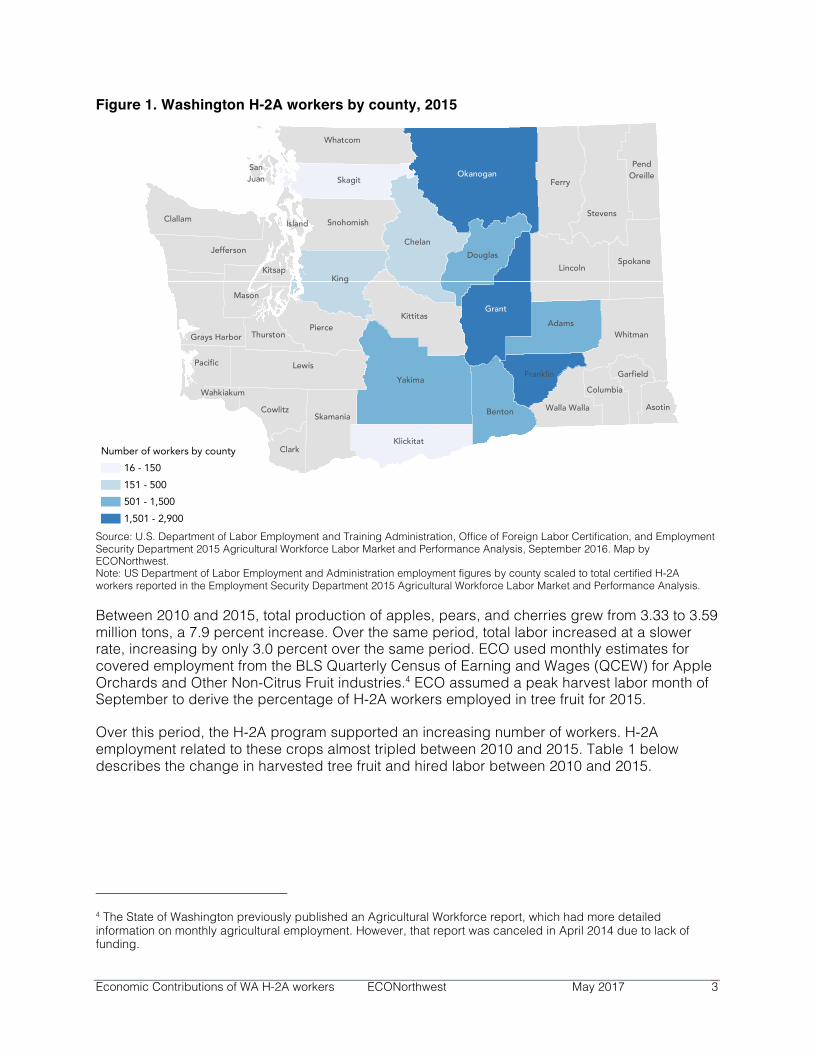
Figure 1 shows the distribution of all H-2A workers by county in 2015. Generally, counties in central Washington hosted the most H-2A workers. Using publically available survey data, information on certified H-2A labor, and the state agricultural workforce analysis report, ECO calculated the number of H-2A workers harvesting apples, pears, and cherries as 7,779 in September 2015, accounting for 14 percent of September employment for those crops that year. We assume that workers move from harvesting cherries and pears to harvesting apples throughout the harvest season. Therefore, we assumed a peak month of September to measure peak labor.
2 Defined as covered farm and domestic workers reported to the BLS Quarterly Census of Earnings and Wages. 3 Brady, Michael P. and R. Karina Gallardo. 2014. “Labor Prospects for the Washington Tree Fruit Industry.” Washington State University, School of Economic Sciences
Economic Contributions of WA H-2A workers ECONorthwest May 2017 3
Figure 1. Washington H-2A workers by county, 2015
Source: U.S. Department of Labor Employment and Training Administration, Office of Foreign Labor Certification, and Employment Security Department 2015 Agricultural Workforce Labor Market and Performance Analysis, September 2016. Map by ECONorthwest. Note: US Department of Labor Employment and Administration employment figures by county scaled to total certified H-2A workers reported in the Employment Security Department 2015 Agricultural Workforce Labor Market and Performance Analysis.
Between 2010 and 2015, total production of apples, pears, and cherries grew from 3.33 to 3.59 million tons, a 7.9 percent increase. Over the same period, total labor increased at a slower rate, increasing by only 3.0 percent over the same period. ECO used monthly estimates for covered employment from the BLS Quarterly Census of Earning and Wages (QCEW) for Apple Orchards and Other Non-Citrus Fruit industries.4 ECO assumed a peak harvest labor month of September to derive the percentage of H-2A workers employed in tree fruit for 2015.
Over this period, the H-2A program supported an increasing number of workers. H-2A employment related to these crops almost tripled between 2010 and 2015. Table 1 below describes the change in harvested tree fruit and hired labor between 2010 and 2015.
4 The State of Washington previously published an Agricultural Workforce report, which had more detailed information on monthly agricultural employment. However, that report was canceled in April 2014 due to lack of funding.
Okanogan
Grant
Ferry
Clark
Mason
Lewis
Lincoln
Pacific
SkagitSanJuan
Pierce
PendOreille
Skamania
Whitman
Yakima
Whatcom
Spokane
Snohomish
Thurston
Stevens
Wahkiakum Columbia
Douglas
Cowlitz
Grays Harbor
GarfieldFranklin
Island
AsotinBenton
ChelanJefferson
KingKitsap
Kittitas
Klickitat
Clallam
Adams
Walla Walla
Number of workers by county16 - 150151 - 500501 - 1,5001,501 - 2,900
Washington H-2A Workers by County, 2015
Economic Contributions of WA H-2A workers ECONorthwest May 2017 4
Table 1. Production of apples, pears, and cherries in Washington, 2010–2015
Source: ECONorthwest estimates using USDA Washington Agricultural Bulletin, State of Washington State of Washington Employment Security Department, Quarterly Census of Employment and Wages, and Employment Security Department 2015 Agricultural Workforce Labor Market and Performance Analysis.
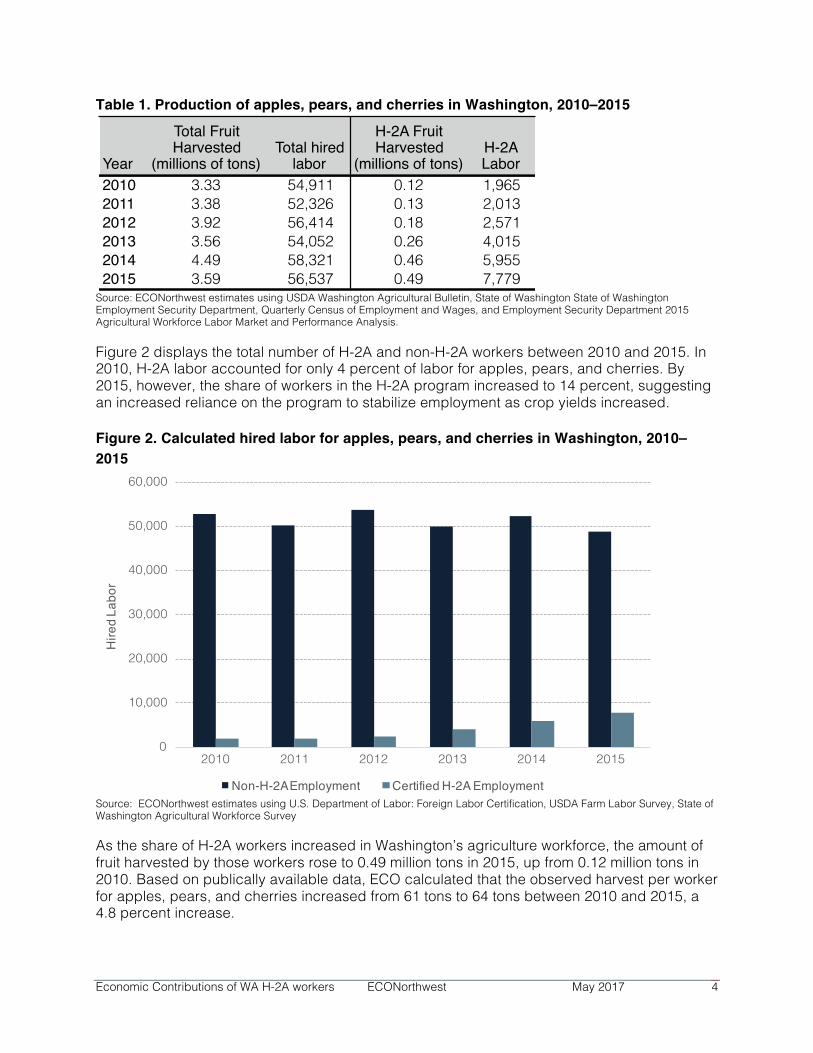
Figure 2 displays the total number of H-2A and non-H-2A workers between 2010 and 2015. In 2010, H-2A labor accounted for only 4 percent of labor for apples, pears, and cherries. By 2015, however, the share of workers in the H-2A program increased to 14 percent, suggesting an increased reliance on the program to stabilize employment as crop yields increased.
Figure 2. Calculated hired labor for apples, pears, and cherries in Washington, 2010–2015
Source: ECONorthwest estimates using U.S. Department of Labor: Foreign Labor Certification, USDA Farm Labor Survey, State of Washington Agricultural Workforce Survey
As the share of H-2A workers increased in Washington’s agriculture workforce, the amount of fruit harvested by those workers rose to 0.49 million tons in 2015, up from 0.12 million tons in 2010. Based on publically available data, ECO calculated that the observed harvest per worker for apples, pears, and cherries increased from 61 tons to 64 tons between 2010 and 2015, a 4.8 percent increase.
Year
Total Fruit Harvested
(millions of tons)Total hired
labor
H-2A Fruit Harvested
(millions of tons)H-2A Labor
2010 3.33 54,911 0.12 1,9652011 3.38 52,326 0.13 2,0132012 3.92 56,414 0.18 2,5712013 3.56 54,052 0.26 4,0152014 4.49 58,321 0.46 5,9552015 3.59 56,537 0.49 7,779
0
10,000
20,000
30,000
40,000
50,000
60,000
2010 2011 2012 2013 2014 2015
Hire
d La
bor
Non-H-2A Employment Certified H-2A Employment
Economic Contributions of WA H-2A workers ECONorthwest May 2017 5
Table 2. H-2A harvest (apples, pears, & cherries) and output per worker, 2010-2015
Source: ECONorthwest estimates using USDA Washington Agricultural Bulletin and State of Washington Employment Security Department Quarterly Census of Employment and Wages Note: ECONorthwest assumes homogeneity in production for hired labor; these estimates of output per worker apply equally to all hired labor for apples, pears, and cherries.
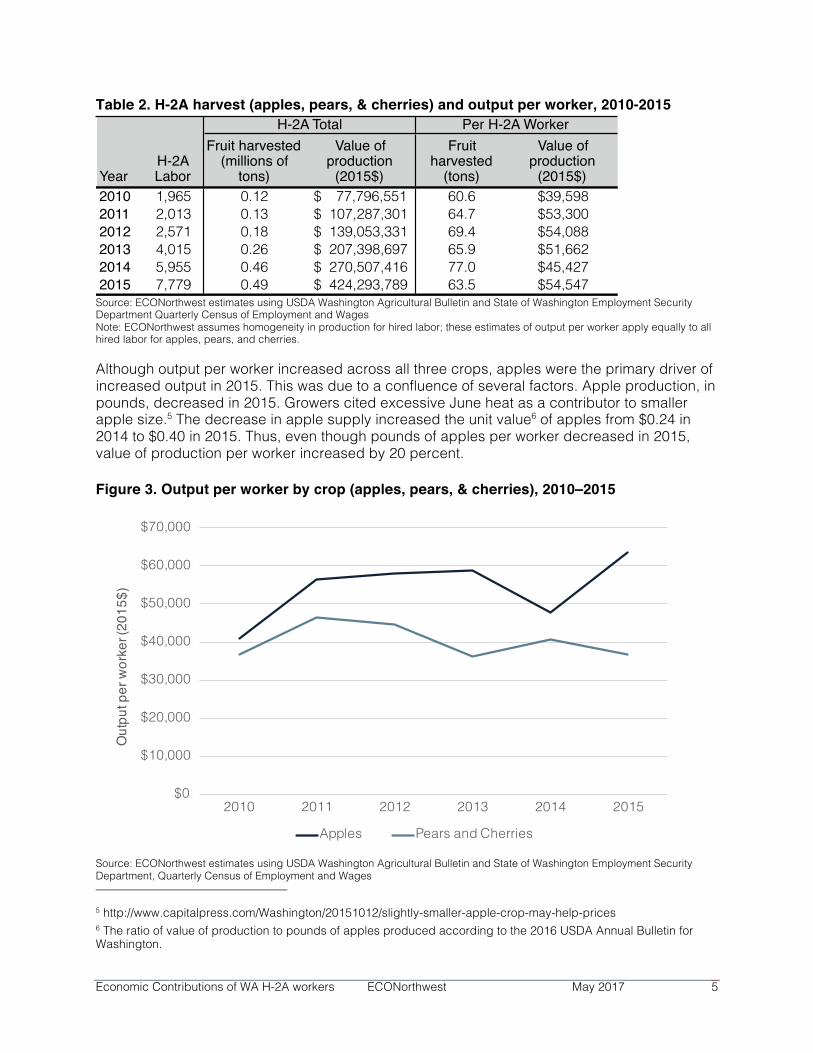
Although output per worker increased across all three crops, apples were the primary driver of increased output in 2015. This was due to a confluence of several factors. Apple production, in pounds, decreased in 2015. Growers cited excessive June heat as a contributor to smaller apple size.5 The decrease in apple supply increased the unit value6 of apples from $0.24 in 2014 to $0.40 in 2015. Thus, even though pounds of apples per worker decreased in 2015, value of production per worker increased by 20 percent.
Figure 3. Output per worker by crop (apples, pears, & cherries), 2010–2015
Source: ECONorthwest estimates using USDA Washington Agricultural Bulletin and State of Washington Employment Security Department, Quarterly Census of Employment and Wages 5 http://www.capitalpress.com/Washington/20151012/slightly-smaller-apple-crop-may-help-prices 6 The ratio of value of production to pounds of apples produced according to the 2016 USDA Annual Bulletin for Washington.
YearH-2A Labor
Fruit harvested (millions of
tons)
Value of production
(2015$)
Fruit harvested
(tons)
Value of production
(2015$)2010 1,965 0.12 77,796,551$ 60.6 $39,5982011 2,013 0.13 107,287,301$ 64.7 $53,3002012 2,571 0.18 139,053,331$ 69.4 $54,0882013 4,015 0.26 207,398,697$ 65.9 $51,6622014 5,955 0.46 270,507,416$ 77.0 $45,4272015 7,779 0.49 424,293,789$ 63.5 $54,547
H-2A Total Per H-2A Worker
$0
$10,000
$20,000
$30,000
$40,000
$50,000
$60,000
$70,000
2010 2011 2012 2013 2014 2015
Out
put p
er w
orke
r (20
15$)
Apples Pears and Cherries
Economic Contributions of WA H-2A workers ECONorthwest May 2017 6
Overview of economic contributions Economic contributions can be calculated using industry revenues or expenditures. For this analysis, ECO uses the value of production as provided in U.S. Department of Agriculture Annual Bulletin reports to estimate revenue for crop producers in Washington. Using an input-output model specified to a crop producer’s geography and spending pattern, we can then measure the short-run economic contributions associated with a grower’s operations expenditures in the study region.
This, in turn, captures the linkages between the agricultural sector and the rest of the Washington economy as the money is spent on local goods and services. We will use specific terminology to discuss the various economic effects in Washington State for the tree fruit operations attributable to H-2A labor. The three terms of interest are as follows.
§ Direct Impacts are those associated with operations spending, payroll, and employment for a grower. They also include other factors of direct output, such as taxes on imports and proprietor income, which are added to labor and non-labor operating expenses to calculate gross output.
§ Indirect Impacts are the goods and services purchased from businesses in the core study region. This spending generates the first round of indirect impacts. The businesses that supply goods and services (such as fertilizer) to growers will also purchase additional goods and services to meet that demand; this spending leads to additional rounds of indirect impacts. Because they represent interactions among businesses, these indirect effects are often referred to as “supply-chain” impacts.
§ Induced Impacts are the purchases of goods and services from household (farm workers and grower) incomes. The direct and indirect increases in employment and income enhance the overall purchasing power in the economy, thereby inducing further consumption. Farm workers who travel to the U.S. for work will also purchase food, medical services, and other goods during their stay. These induced effects are often referred to as consumption-driven impacts.
Transportation, housing, and administrative costs The H-2A program requires employers to pay for transportation; this includes travel to and from country or origin, along with travel to and from worksites. Additionally, employers are responsible for housing H-2A workers and any administrative costs associated with the program. Although the federal government does not have publically available data on total costs employers pay to participate in the program, recent estimates from Wafla place the range between $1,200 and $1,300 per worker.
Most of these dollars go toward government fees, foreign services (recruiters and hotels), and employee reimbursements and do not have a direct effect on the local economy. According to Wafla, approximately $200 of that spending go toward local non-profits (such as Wafla), which does have a direct effect on the local economy by supporting local jobs and payroll, while working to also support the Washington H-2A program.

Economic Contributions of WA H-2A workers ECONorthwest May 2017 7
Employers are responsible for transporting workers to and from worksites each day; employers also transport workers to local markets at least once per week for food and other goods. Many employers who participate in the H-2A program purchase buses to accommodate this requirement. The costs to purchase these buses or other forms of worker transport range from $10,000 to $30,000 depending on the vehicle characteristics.7
Many H-2A workers are housed in units constructed by employers. Estimates from Wafla find that, when the farmer constructs the farm labor housing, the cost ranges from $10,000 to $12,000 per bed. In Washington, nonprofits such as the Office of Rural and Farmworker Housing are also helping to develop some housing for these workers; these beds are thereafter rented to employers at a per bed cost of $200 - $300 a month.
Table 3. Economic contributions from transportation and housing expenditures, 2015
Source: ECONorthwest estimates using USDA Washington Agricultural Bulletin, State of Washington Employment Security Department, Quarterly Census of Employment and Wages, and personal communication with industry representatives Note: ECO assumed a rental price of $250 for non-profit and $300 in for-profit facilities. This cost also assumes a six-month stay for workers.
Table 3 displays the economic contributions of transportation, housing, and administrative expenditures used to support the H-2A program in 2015. As previously mentioned, the government does not release data about how much employers spend beyond administrative fees to support the requirements of the H-2A program. These costs are not meant to be comprehensive for 2015, but rather, a conservative estimate based on limited information obtained from industry representatives.
H-2A direct wages and output Beyond the transportation, housing, and administrative cost required to participate in the H-2A program, workers themselves have a stimulative effect on the local economy through the harvesting of crops. To perform the input-output analysis, we needed to determine what percentage of the value of production and associated wages were attributable to the H-2A workforce. Given the lack of publically available data, we assume a homogenous output per worker for apples, cherries, and pears, based on the value of production and estimated labor for each crop in 2015.
We also assume an average annual wage of $24,932, based on data for crop production that same year.8 Conversations with growers in the tree fruit industry suggest that H-2A workers remit most of their income to their country of origin. Although the U.S. government does not track how much H-2A workers remit to their home countries, we use an assumption of 80
7 Email correspondence with Northwest Bus Sales. 8 U.S. Department of Labor. 2014. State of Washington, Quarterly Census of Earnings and Wages.
Table 5. Sector Expense Units Cost (2015$)
412 Transporation Expenditures 20 buses 360,400$ 61 Housing Construction 474 new beds 4,935,525$
500 Housing Rent 1400 stays 2,342,800$ 516 Administrative Expenditures 7,779 H-2A workers 1,555,800$
Total Expenditures 9,194,525$
Economic Contributions of WA H-2A workers ECONorthwest May 2017 8
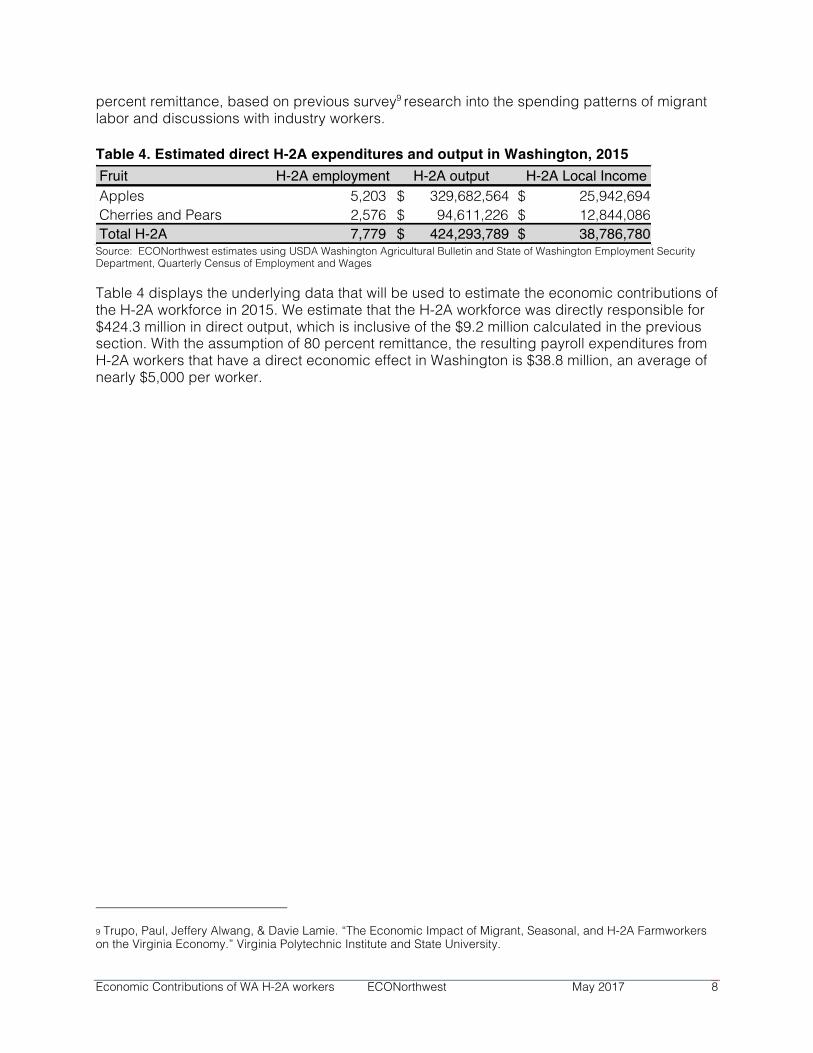
percent remittance, based on previous survey9 research into the spending patterns of migrant labor and discussions with industry workers.
Table 4. Estimated direct H-2A expenditures and output in Washington, 2015
Source: ECONorthwest estimates using USDA Washington Agricultural Bulletin and State of Washington Employment Security Department, Quarterly Census of Employment and Wages
Table 4 displays the underlying data that will be used to estimate the economic contributions of the H-2A workforce in 2015. We estimate that the H-2A workforce was directly responsible for $424.3 million in direct output, which is inclusive of the $9.2 million calculated in the previous section. With the assumption of 80 percent remittance, the resulting payroll expenditures from H-2A workers that have a direct economic effect in Washington is $38.8 million, an average of nearly $5,000 per worker.
9 Trupo, Paul, Jeffery Alwang, & Davie Lamie. “The Economic Impact of Migrant, Seasonal, and H-2A Farmworkers on the Virginia Economy.” Virginia Polytechnic Institute and State University.
Table 4. Fruit H-2A employment H-2A output H-2A Local IncomeApples 5,203 329,682,564$ 25,942,694$ Cherries and Pears 2,576 94,611,226$ 12,844,086$ Total H-2A 7,779 424,293,789$ 38,786,780$
Economic Contributions of WA H-2A workers ECONorthwest May 2017 9
Results of economic contributions analysis ECO used the 2015 version of IMPLAN and built an economic impact model for the State of Washington. The underlying data came from publically available sources, including U.S. Department of Agriculture, U.S. Department of Labor, and the State of Washington. ECO then reviewed the available literature and worked with industry representatives to determine the appropriate assumptions about H-2A worker concentration in the tree fruit industry, wages, and remittance.
The economic contributions of the H-2A labor force were measured for the value of production associated with harvesting tree fruit and for payroll expenditures. Because we were not able to obtain detailed data about where the production occurred in Washington during 2015, all economic data associated with the H-2A labor is reported at the state level.
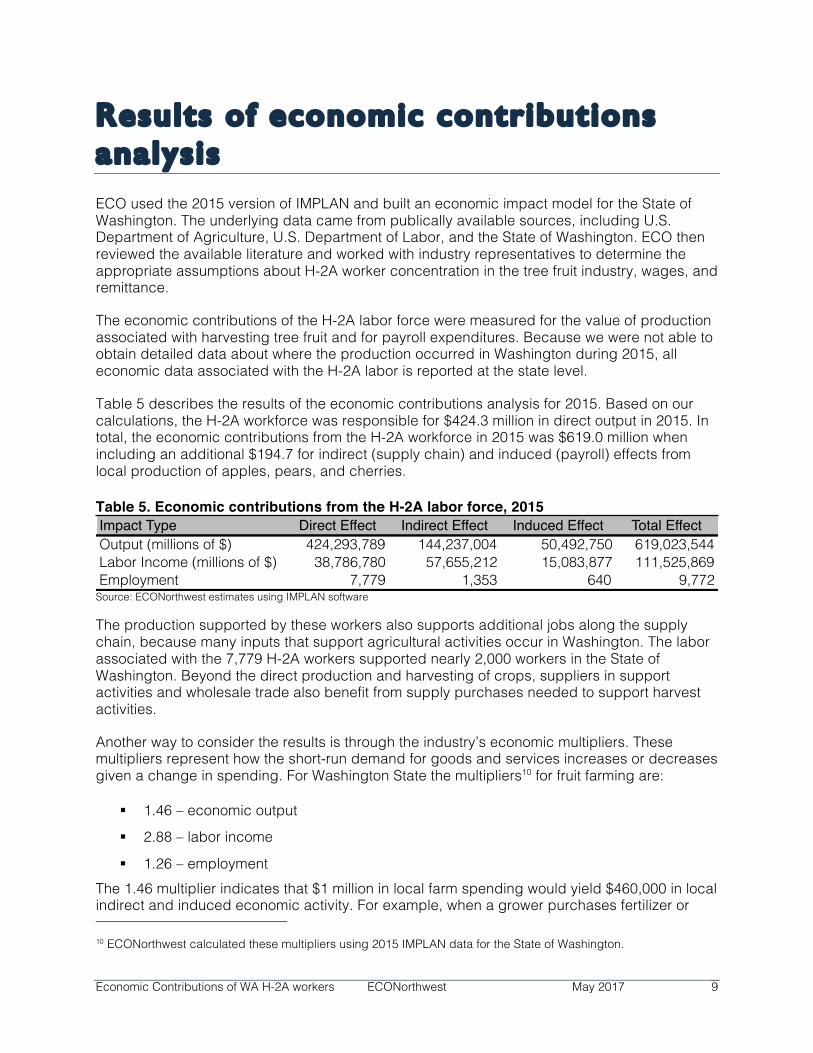
Table 5 describes the results of the economic contributions analysis for 2015. Based on our calculations, the H-2A workforce was responsible for $424.3 million in direct output in 2015. In total, the economic contributions from the H-2A workforce in 2015 was $619.0 million when including an additional $194.7 for indirect (supply chain) and induced (payroll) effects from local production of apples, pears, and cherries.
Table 5. Economic contributions from the H-2A labor force, 2015
Source: ECONorthwest estimates using IMPLAN software
The production supported by these workers also supports additional jobs along the supply chain, because many inputs that support agricultural activities occur in Washington. The labor associated with the 7,779 H-2A workers supported nearly 2,000 workers in the State of Washington. Beyond the direct production and harvesting of crops, suppliers in support activities and wholesale trade also benefit from supply purchases needed to support harvest activities.
Another way to consider the results is through the industry’s economic multipliers. These multipliers represent how the short-run demand for goods and services increases or decreases given a change in spending. For Washington State the multipliers10 for fruit farming are:
§ 1.46 – economic output
§ 2.88 – labor income
§ 1.26 – employment The 1.46 multiplier indicates that $1 million in local farm spending would yield $460,000 in local indirect and induced economic activity. For example, when a grower purchases fertilizer or 10 ECONorthwest calculated these multipliers using 2015 IMPLAN data for the State of Washington.
Impact Type Direct Effect Indirect Effect Induced Effect Total EffectOutput (millions of $) 424,293,789 144,237,004 50,492,750 619,023,544Labor Income (millions of $) 38,786,780 57,655,212 15,083,877 111,525,869Employment 7,779 1,353 640 9,772

Economic Contributions of WA H-2A workers ECONorthwest May 2017 10
seed from a local distributer, that company pays employees and other local business to support its operations. Multipliers reflect the degree to which each dollar spent recirculates in the study region. Higher multipliers suggest that purchases of goods and services for a given industry tend to occur within the study area, while lower multipliers suggest the opposite.
The labor income multiplier of 2.88 is larger than that found in similar studies performed for the apple industry in Washington based on our assumption that only 20 percent of H-2A labor income is spent in the study region. The remaining 80 percent of direct labor income are remitted to their country of origin.
Employment multipliers are like spending multipliers, but interpreted slightly differently. The employment multiplier of 1.26 indicates that each 1.0 full-year equivalent in demand for employment resulting from increased spending would result in an additional 0.26 support and non-farm “jobs” (in FYE) in Washington State.
While use of the H-2A program has increased, the overall migrant labor force in Washington agriculture appears to be declining. We cannot speculate about future policies and how they will influence the use of this program. However, studies from Washington State University project that the agriculture labor force will continue to decline by 0.7 to 1.4 percent a year through 2034. Without new technologies to replace the lost labor, we would expect to see increased wages and prices for these labor-intensive crops, along with some loss in output as crops are unable to be harvested on schedule.

Economic Contributions of WA H-2A workers ECONorthwest May 2017 11
Appendix: Economic Impact Methodology
Input-Output Modeling Input-output models are mathematical representations of the economy that show how different parts (or sectors) are linked to one another. The strengths of the input-output modeling framework include:
§ A double-entry accounting framework that results in a model structure that is well ordered, symmetric, and where inputs must be equal to outputs;
§ A reasonably comprehensive picture of the economic activities within a region, with mathematical equations that describe the flow of commodities between producing and consuming sectors, the flow of income between businesses and institutions, and the trade in commodities between regions;
§ Model construction using secondary source data that are gathered and vetted by government agencies; and
§ The ability to cost-effectively create input-output or economic impact models for any region.
Input-output models that rely on survey or primary source data are expensive to construct. As a result, special modeling techniques have been developed to estimate the necessary empirical relationships. These techniques use a combination of national technological relationships and state- and county-level measures of economic activity, and have been packaged into the IMPLAN (for IMpact Analysis for PLANning) modeling software. This is the modeling system ECO used in this analysis.
IMPLAN Economic Impact Model IMPLAN has been developed and distributed by the Minnesota IMPLAN Group, Inc., since 1993. The IMPLAN modeling system is widely used and well respected—there are currently more than 1,500 public and private users of the IMPLAN modeling software. The selection of IMPLAN by the United States Department of Agriculture (USDA) as its analysis framework for monitoring job creation associated with the American Recovery and Reinvestment Act (ARRA) of 2009 is a testament to its credibility.
In general terms, the IMPLAN model works by tracing how spending associated with an industry circulates through an economy or study area. Changes in one sector or multiple sectors trigger changes in demand and supply throughout the economy. Initial changes in the model propagate through the economy via supply- and demand-chain linkages, altering the equilibrium quantities of inputs and outputs and associated jobs, income, and value-added components. These multiplier effects continue until the initial change in final demand leaks out of the economy in the form of savings, taxes, and imports.

Economic Contributions of WA H-2A workers ECONorthwest May 2017 12
ECO used an input-output modeling framework to measure the gross economic impacts or “contributions.” A net analysis, which compares the economic effects to a counterfactual scenario, was not used for this study.
Economic Impact Terms and Definitions These three types of economic impacts are measured in terms of output, labor income, and employment resulting from spending in the study area:
§ Direct impacts are the output, jobs, and income associated with the immediate effects of final demand changes.
§ Indirect impacts are production changes in backward-linked industries caused by the changing input needs of directly affected industries. Suppliers to the directly involved industry will also purchase additional goods and services; this spending leads to additional rounds of indirect impacts. Because they represent interactions among businesses, these indirect effects are often referred to as supply-chain impacts.
§ Induced impacts are the changes in regional household spending patterns caused by changes in household income. The direct and indirect increases in employment and income enhance the overall purchasing power in the economy, thereby inducing further spending by households. Employees in these industries, for example, will use their income to purchase groceries or take their children to the doctor. These induced effects are often referred to as consumption-driven impacts.
Total economic impacts are based on the sum of the direct, indirect, and induced impacts. These three types of economic impacts are measured in terms of output, labor income, and employment resulting from spending in the study area:
§ Output represents the value of goods and services produced, and is the broadest measure of economic activity
§ Income consists of employee compensation and proprietary income, and is a subset of output. § Employee compensation includes workers’ wages and salaries, as well as other
benefits such as health, disability, and life insurance, retirement payments, and non-cash compensation.
§ Proprietary income (business income) represents the payments received by small-business owners or self-employed workers. Business income would include, for example, income received by private business owners, doctors, accountants, and lawyers.
§ Jobs are measured in terms of full-year-equivalents (FYE). One FYE job equals work over twelve months in each industry (this is the same definition used by the federal government’s Bureau of Economic Analysis). For example, two jobs that last six months each count as one FYE job. A job can be full-time or part-time, seasonal or permanent; IMPLAN counts jobs based on the duration of employment, not the number of hours a week worked. Job impacts from operations are for one year of normal operation.
Economic Contributions of WA H-2A workers ECONorthwest May 2017 13
Limitations of Economic Impact Analysis Input-output models are static models that measure the flow of inputs and outputs in an economy at a point in time. With this information and the balanced accounting structure of an input-output model, an analyst can: 1) describe an economy during one time-period, 2) introduce a change to the economy, and then 3) evaluate the economy after it has accommodated that change.
This type of “partial equilibrium” analysis permits comparison of the economy in two separate states, but does not describe how the economy moves from one equilibrium to the next. In partial equilibrium analysis, the researcher assumes that all other relationships in the economy remain the same (other than the initial economic stimulus).
Contrary to dynamic models, static models assume that there are no changes in wage rates, input prices, and property values. In addition, underlying economic relationships in input- output models are assumed constant; there are no changes in the productivity of labor and capital, and no changes in population migration or business location patterns.


![Investigating relative contributions of various precursors ... › e-library › conferences › 2014 › Salerno › ... · many workers [18]. Analysing the 3D graph for chlorine](https://static.fdocuments.in/doc/165x107/5f20810283af457c8d17e71c/investigating-relative-contributions-of-various-precursors-a-e-library-a.jpg)