Economic Contribution of the Petroleum Industry to...
65
Agribusiness and Applied Economics Report No. 599 April 2007 Economic Contribution of the Petroleum Industry to North Dakota Dean A. Bangsund F. Larry Leistritz Department of Agribusiness and Applied Economics Agricultural Experiment Station North Dakota State University Fargo, North Dakota 58105
Transcript of Economic Contribution of the Petroleum Industry to...

Agribusiness and Applied Economics Report No. 599 April 2007
Economic Contribution of the PetroleumIndustry to North Dakota
Dean A. BangsundF. Larry Leistritz
Department of Agribusiness and Applied EconomicsAgricultural Experiment StationNorth Dakota State University
Fargo, North Dakota 58105

ACKNOWLEDGMENTS
Special thanks are extended to Ron Ness, President, North Dakota Petroleum Council, forhis leadership, guidance, and information throughout the study.
Several individuals were helpful at various stages of the study. Our appreciation andthanks are extended to:
Lynn Helms (North Dakota Industrial Commission)Bruce Hicks (North Dakota Industrial Commission)Ryan Kopseng (Missouri River Royalty Corporation)Keith Bayley (State Land Department)Kathy Strombeck (Office of State Tax Commissioner)Joseph Muniz (Minerals Management Service)Larry Melvin (U.S. Forest Service)Terry Holzwarth (Nance Petroleum)Rick Ross (Whiting Oil and Gas)Robert Harms (Northern Alliance of Independent Producers)Shelly Swandal (Department of Agribusiness and Applied Economics)Norma Ackerson (Department of Agribusiness and Applied Economics)
The study authors and study sponsors would like to thank all the companies andindividuals that took the time to complete and return the industry questionnaires. This study,with its reliance on industry data, would not have been possible without industry cooperation.
Thanks are given to Norma Ackerson for document preparation and to our colleagues forreviewing this manuscript.
Financial support was provided by the North Dakota Oil and Gas Research Council andthe North Dakota Petroleum Council. We express our appreciation for their support.
The authors assume responsibility for any errors of omission, logic, or otherwise. Anyopinions, findings, or conclusions expressed in this publication are those of the authors and donot necessarily reflect the views of the North Dakota Petroleum Council or the NDSUDepartment of Agribusiness and Applied Economics.
A single copy of this publication is available free of charge. Please address your inquiryto the Department of Agribusiness and Applied Economics, North Dakota State University, POBox 5636, Fargo, ND 58105-5636, phone (701-231-7441), fax (701-231-7400), or e-mail:[email protected]. This publication is also available electronically at the followingweb site: http://ageconsearch.umn.edu/.
NDSU is equal opportunity institution.
Copyright © 2007 by Bangsund and Leistritz. All rights reserved. Readers may makeverbatim copies of this document for non-commercial purposes by any means, provided thiscopyright notice appears on all such copies.
i
TABLE OF CONTENTSPage
List of Tables . . . . . . . . . . . . . . . . . . . . . . . . . . . . . . . . . . . . . . . . . . . . . . . . . . . . . . . . . . . . . ii
List of Figures . . . . . . . . . . . . . . . . . . . . . . . . . . . . . . . . . . . . . . . . . . . . . . . . . . . . . . . . . . . . ii
Introduction . . . . . . . . . . . . . . . . . . . . . . . . . . . . . . . . . . . . . . . . . . . . . . . . . . . . . . . . . . . . . . . 1
Objectives . . . . . . . . . . . . . . . . . . . . . . . . . . . . . . . . . . . . . . . . . . . . . . . . . . . . . . . . . . . . . . . . 2
Background . . . . . . . . . . . . . . . . . . . . . . . . . . . . . . . . . . . . . . . . . . . . . . . . . . . . . . . . . . . . . . . 2Industry Organization . . . . . . . . . . . . . . . . . . . . . . . . . . . . . . . . . . . . . . . . . . . . . . . . . . 2Production Statistics . . . . . . . . . . . . . . . . . . . . . . . . . . . . . . . . . . . . . . . . . . . . . . . . . . . 4
Procedures . . . . . . . . . . . . . . . . . . . . . . . . . . . . . . . . . . . . . . . . . . . . . . . . . . . . . . . . . . . . . . . . 8Data Collection . . . . . . . . . . . . . . . . . . . . . . . . . . . . . . . . . . . . . . . . . . . . . . . . . . . . . . . 8
Oil Operators . . . . . . . . . . . . . . . . . . . . . . . . . . . . . . . . . . . . . . . . . . . . . . . . . . . 8Pipelines and Processors . . . . . . . . . . . . . . . . . . . . . . . . . . . . . . . . . . . . . . . . . . 9Service and Support . . . . . . . . . . . . . . . . . . . . . . . . . . . . . . . . . . . . . . . . . . . . . 9
Estimation Techniques . . . . . . . . . . . . . . . . . . . . . . . . . . . . . . . . . . . . . . . . . . . . . . . . 10Input-Output Analysis . . . . . . . . . . . . . . . . . . . . . . . . . . . . . . . . . . . . . . . . . . . . . . . . 11
Economic impacts . . . . . . . . . . . . . . . . . . . . . . . . . . . . . . . . . . . . . . . . . . . . . . . . . . . . . . . . . 11Direct Impacts . . . . . . . . . . . . . . . . . . . . . . . . . . . . . . . . . . . . . . . . . . . . . . . . . . . . . . 11
Exploration . . . . . . . . . . . . . . . . . . . . . . . . . . . . . . . . . . . . . . . . . . . . . . . . . . . 12Extraction . . . . . . . . . . . . . . . . . . . . . . . . . . . . . . . . . . . . . . . . . . . . . . . . . . . . 13Processing . . . . . . . . . . . . . . . . . . . . . . . . . . . . . . . . . . . . . . . . . . . . . . . . . . . . 15Total Direct Impacts . . . . . . . . . . . . . . . . . . . . . . . . . . . . . . . . . . . . . . . . . . . . 16
Secondary Impacts . . . . . . . . . . . . . . . . . . . . . . . . . . . . . . . . . . . . . . . . . . . . . . . . . . . 18Employment . . . . . . . . . . . . . . . . . . . . . . . . . . . . . . . . . . . . . . . . . . . . . . . . . . . . . . . . 19
Direct Employment . . . . . . . . . . . . . . . . . . . . . . . . . . . . . . . . . . . . . . . . . . . . . 19Secondary Employment . . . . . . . . . . . . . . . . . . . . . . . . . . . . . . . . . . . . . . . . . 21
Government Revenues . . . . . . . . . . . . . . . . . . . . . . . . . . . . . . . . . . . . . . . . . . . . . . . . 22Total Economic Impacts . . . . . . . . . . . . . . . . . . . . . . . . . . . . . . . . . . . . . . . . . . . . . . . 23
Summary . . . . . . . . . . . . . . . . . . . . . . . . . . . . . . . . . . . . . . . . . . . . . . . . . . . . . . . . . . . . . . . . 26
Conclusions . . . . . . . . . . . . . . . . . . . . . . . . . . . . . . . . . . . . . . . . . . . . . . . . . . . . . . . . . . . . . . 29
References . . . . . . . . . . . . . . . . . . . . . . . . . . . . . . . . . . . . . . . . . . . . . . . . . . . . . . . . . . . . . . . 30
AppendicesAppendix A - Questionnaire, Oil Operators, North Dakota, 2005 . . . . . . . . . . . . 32Appendix B - Questionnaire, Processors, North Dakota, 2005 . . . . . . . . . . . . . . 44Appendix C - Questionnaire, Service and Support Firms, North Dakota, 2005 . 51

ii
List of TablesTable Page
1 Basic Production Statistics from Survey of Oil Operators, North Dakota, 2005 . . . . . 9
2 Direct Impacts from General Exploration, Drilling Activities, and LeaseBonuses, North Dakota, 2005 . . . . . . . . . . . . . . . . . . . . . . . . . . . . . . . . . . . . . . . . . . . 13
3 Direct Impacts from Oil and Gas Extraction and Production Activities,North Dakota, 2005 . . . . . . . . . . . . . . . . . . . . . . . . . . . . . . . . . . . . . . . . . . . . . . . . . . 15
4 Direct Impacts from Oil and Gas Processing, North Dakota, 2005 . . . . . . . . . . . . . . 16
5 Total Direct Impacts, Petroleum Industry, North Dakota, 2005 . . . . . . . . . . . . . . . . . 17
6 Total Secondary Impacts, Petroleum Industry, North Dakota, 2005 . . . . . . . . . . . . . 19
7 State and Local Government Revenues Attributable to the Petroleum Industry,North Dakota, 2005 . . . . . . . . . . . . . . . . . . . . . . . . . . . . . . . . . . . . . . . . . . . . . . . . . . 23
8 Total (Direct and Secondary) Economic Impacts, Petroleum Industry, North Dakota, 2005 . . . . . . . . . . . . . . . . . . . . . . . . . . . . . . . . . . . . . . . . . . . . . . . . . . 25
List of FiguresFigure Page
1 Oil Producing Counties, North Dakota . . . . . . . . . . . . . . . . . . . . . . . . . . . . . . . . . . . . . 4
2 Historic Oil Production, Key Counties, North Dakota, 1952 through 2006 . . . . . . . . . 5
3 Top States in Crude Oil Production, United States, 1981 through 2005 . . . . . . . . . . . 5
4 Crude Oil Production, North Dakota, 1951 through 2006 . . . . . . . . . . . . . . . . . . . . . . 6
5 Production and Value of Crude Oil, North Dakota, 1974 through 2005 . . . . . . . . . . . 7
6 Value of Crude Oil Production in Nominal and Real Dollars, North Dakota,1974 through 2005 . . . . . . . . . . . . . . . . . . . . . . . . . . . . . . . . . . . . . . . . . . . . . . . . . . . . 7
7 Economic Effects of Key Segments of the North Dakota Petroleum Industry, 2005 . . . . . . . . . . . . . . . . . . . . . . . . . . . . . . . . . . . . . . . . . . . . . . . . . . . . . . . 28

iii
Executive Summary
The purpose of this study was to estimate the economic contribution of crude oil andnatural gas exploration, extraction, transportation, and processing in North Dakota in 2005. Expenditures made in North Dakota by oil companies represented the direct impacts of theindustry. Secondary economic impacts result from the spending and respending of the directimpacts and were estimated using the North Dakota Input-Output Model.
Surveys were used to collect production, expenditure, and employment data for thepetroleum industry in North Dakota. Oil operators (i.e., firms that own or operate oil wells)in the state were surveyed to obtain information on in-state expenses for oil and gasexploration, oil and gas extraction, general business expenditures, employment, oil and gasproduction, and leasing and drilling activity. A similar survey was conducted for firmsengaged in pipeline transportation and processing of crude oil and natural gas in NorthDakota. A third survey was used to obtain information from firms that provide service andsupport in the oil fields and collected information on the type and extent of involvement inthe petroleum industry, in-state expenditures, and employment in North Dakota.
The survey of oil operators produced financial data on about 20 percent of NorthDakota’s oil and gas production in 2005. Secondary data, obtained from governmentagencies, was combined with survey data to estimate royalties, lease bonuses, and severancetaxes.
Estimates of total in-state expenditures in 2005 for oil and gas exploration (e.g.,seismic testing, well drilling) were derived from survey data and statewide drilling statistics. The combination of in-state expenses for exploration and lease bonuses resulted in $445.1million in direct impacts in 2005. The secondary economic impacts associated withexploration activities were estimated at $775 million. The in-state gross business volume(direct and secondary impacts) of exploration activities was estimated at $1.2 billion in 2005.
Estimates of oil and gas extraction expenses, general business expenses for oiloperators, private and public mineral royalties, and state severance taxes were derived fromsurvey data and secondary information obtained from various government agencies. Totaldirect impacts for oil and gas extraction were estimated at $909.6 million in 2005. Totalsecondary economic impacts associated with extraction activities were estimated at $1.4billion. The in-state gross business volume of oil and gas extraction was estimated at $2.3billion in 2005.
In-state expenditures for pipeline operation, natural gas processing, and crude oilrefining were estimated to have a direct impact in North Dakota of $132 million. Totalsecondary economic impacts associated with processing and transporting crude oil andnatural gas were estimated at $238 million. Processing and transporting crude oil and naturalgas generated a gross business volume of $370 million in 2005.

iv
Industry-wide direct and secondary economic impacts from the petroleum industrywere estimated at $1.5 billion and $2.4 billion, respectively. The gross business volume forthe entire industry in North Dakota in 2005 was estimated at $3.9 billion.
Additional measures of the petroleum industry’s economic importance to the stateinclude direct employment for 5,267 full-time jobs, economy-wide personal income of $1.5billion, statewide retail sales of over $900 million, direct contributions to local and stategovernment tax revenues of over $280 million, indirect contribution of $55 million in stategovernment general tax collections, and secondary employment of 20,650 full-timeequivalent jobs.
The industry generally receives little outside attention when production is declining orenergy prices remain modest; however, when oil revenues increase either through expandedproduction and/or higher prices, the industry garners much attention from policymakers,business leaders, and the general public. While this study is a snapshot in time, results fromthis study would suggest that recent upswings in energy prices, drilling activity, and oil andgas production in North Dakota have made the petroleum industry the one of largest singleindustries in the state.
Considering that the industry’s direct impacts (i.e., first round of spending) areconcentrated geographically in the western portion of the state, the economic health ofwestern North Dakota is perhaps tied more to the petroleum industry than any other singleindustry. Yet, despite the strong influence of the petroleum industry in western NorthDakota, the magnitude of the contributions to the state government and the shear volume ofsecondary economic effects in nearly all sectors of the North Dakota economy would suggestthat the economic effects of the industry are felt statewide. Current activity levels in thepetroleum industry clearly make it one of the key forces in the North Dakota economy.

*Research scientist and professor, respectively, Department of Agribusiness and Applied Economics,North Dakota State University, Fargo.
Economic Contribution of the Petroleum Industryto North Dakota
Dean A. Bangsund and F. Larry Leistritz*
Introduction
North Dakota’s largest basic sector industries, which include agriculture,manufacturing, and energy, provide much of the economic stimuli for the state’s economy. These large industries are generally comprised of distinct sectors or economic groups. Forexample, agriculture in North Dakota is often considered a combination of crop productionand livestock. The energy industry in North Dakota is similar in that it is also comprised ofseveral distinct sectors that are commonly treated as separate activities. North Dakota’senergy industries can be conveniently separated into the activities that produce and distributeelectricity, coal, and petroleum.
While separating the energy industry into similar activities is relatively straightforward, identifying the economic players within those sectors is less clear. In the case ofelectricity generation, a handful of firms and generating facilities exist within the state. Thesame situation exists with coal production–a handful of companies operate at a limitednumber of locations. However, the industrial organization associated with oil and natural gasproduction is very different. Rather than having a handful of firms and a limited number ofsite-specific facilities and locations, the petroleum industry involves hundreds of firms and amultitude of facilities spread out over the western third of North Dakota.
North Dakota’s rank among the nation’s top 10 oil producing states is commonknowledge to those in the petroleum sector, and national oil production statistics are readilyavailable to the general public (U.S. Department of Energy 2007). Yet, despite the obviousimportance of oil and gas production to North Dakota and that the major economic industriesin the state are rather limited in number, there has been no assessment of the contribution ofthe petroleum industry to the state economy. As a result, from an economic perspective, thedegree of knowledge pertaining to the petroleum industry in the state is rather limited. Thisis in stark contrast to the coal industry, which has through the Lignite Energy Council,frequently funded studies to evaluate the economic importance of their industry (Coon andLeistritz 2006). Other industries and activities in the state, many of which are agriculturally-based, also have researched their economic importance. However, virtually no publicinformation is available regarding the role the petroleum industry plays in the North Dakotaeconomy.
Recent upswings in oil activity, due in-part to increased energy prices, the availabilityof improved exploration and extraction technology, and substantial potential for oil recoveryfrom various formations in the Williston Basin, have brought new attention to the petroleumindustry in North Dakota. Increase in leasing activity, more well drilling rigs operating in the

2
state, substantial increases in severance tax collections, and other financial and economicaspects of the industry have all been discussed in the media. Given the obvious value of thepetroleum industry to the state, and the level of government revenues stemming frompetroleum activities, an economic assessment of the industry would be a valuable tool forboth industry representatives, policy makers, business owners, government officials, and thegeneral public. Determining the economic contribution of a given industry quantifies itsimportance to state and local economies. Not only can the economic impacts to the state andlocal economies be measured, but the effects on specific economic sectors and relatedindustries also can be identified. Finally, economic studies can demonstrate the susceptibilityof the North Dakota economy to fluctuations in factors affecting petroleum exploration andextraction, demonstrate the economic dependence of the state on natural resource-basedindustries, and indicate the economic impacts that could result from potential changes inpolicies which affect the petroleum industry.
Objectives
The purpose of this report is to estimate the economic contribution (direct andsecondary effects) of the petroleum industry to the economy of North Dakota. Specificobjectives include:
1) estimate the economic size of petroleum exploration, extraction, and processingsectors, and
2) provide estimates of industry-wide employment, tax revenues, and other keyeconomic measures.
Background
The industrial organization of the petroleum industry in the United States is oftendivided into upstream and downstream components. The upstream components of thepetroleum industry generally include exploration, development, and production of crude oiland natural gas. The downstream components include transportation, processing,distribution, marketing, and retail delivery of petroleum products.
Industry Organization
The petroleum industry in North Dakota consists of both upstream and downstreamcomponents. For this study, the petroleum industry was defined to only include in-stateexploration, extraction, transportation, and processing of crude oil and natural gas. Exploration can be generally thought of as the process of finding mineral resources. Extraction is the process of developing and recovering mineral resources. Transportationcomponents of the industry were limited to the movement of oil and gas from wells tocollection points, and then on to processing facilities located either in-state or out-of-state. Petroleum processing in North Dakota included refining of crude oil and natural gasprocessing. The distribution, marketing, and retail sale of processed petroleum products

3
(e.g., diesel, gasoline, kerosene, motor oil, lubricants, propane, natural gas) were notincluded.
The exploration and extraction phases of the petroleum industry are not organized likeother industries in the state. Firms that own producing wells (oil operators) contract much ofthe work of exploration and extraction of oil and gas to other firms that specialize in variousaspects of those processes. As a result, much of the expenditures incurred in the state for oiland gas production start with the oil operator but flow through the various firms engaged inproviding support and service within the oil fields. While oil operators represent a mix ofsmall to large firms, a majority of the prominent oil operators in North Dakota also haveoperations in other states. For many oil operators, their operations in North Dakota do notrepresent the majority of their oil and gas revenues. As a result of having operations and/orheadquarters in other states, net revenues from North Dakota oil and gas production mayleave the state for a variety of reasons. However, North Dakota may be the beneficiary ofexploration and discovery expenses from firms that have minimal operations in the state.
Oil and gas wells typically have three types of economic interests. These players areoften referred to as royalty interests, owner/operator interests, and working interests. Royaltyinterests receive a share of the value of a well’s output but do not share in the expensesassociated with the well. Owner and working interests share, based on various percentagesor arrangements, the remaining revenues and all of the expenses of a well. The well owner oroperator is generally responsible or in charge of all operations. The owner arranges to havework completed for most of the necessary activities associated with the well, and chargesworking interests for their share of the expenses. As a result of these typical arrangements,the total number of firms receiving revenues and incurring expenses from oil and gas wells inNorth Dakota is unknown. However, the number of oil operators (firms that own or operatewells) is known.
For various reasons, the magnitude of economic effects of oil and gas production arenot necessarily equivalent to the market value (i.e., price times quantity) of oil and gasproduced. Exploration and extraction technologies use specialized inputs and services, manyof which are not available in North Dakota and must be purchased from out-of-state sources. Many oil operators have operations and/or are headquartered in other states, and revenues forsome firms may leave the state to be used for projects elsewhere. The same situation mayexist where firms use resources obtained from out-of-state operations for oil and gasexploration in the state. In addition, oil operators headquartered out-of-state often haveminimal general business expenses in the state. Similarly, firms that only have workinginterests in producing wells may or may not have physical operations in the state. All ofthese factors make it very problematic to base economic importance of the petroleumindustry solely on the value of oil and gas production.

4
BIL
LIN
GS
BOTTINEAU
BOWMAN
BURKE
DUNN
HETTINGER
MCHENRY
MCKENZIEMCLEAN
MOUNTRAIL
SLOPE
STARK
WARD
WILLIAMS
RE
NV
ILL
E
VA
LL
EY
GO
LD
EN
DIVIDE
Production Statistics
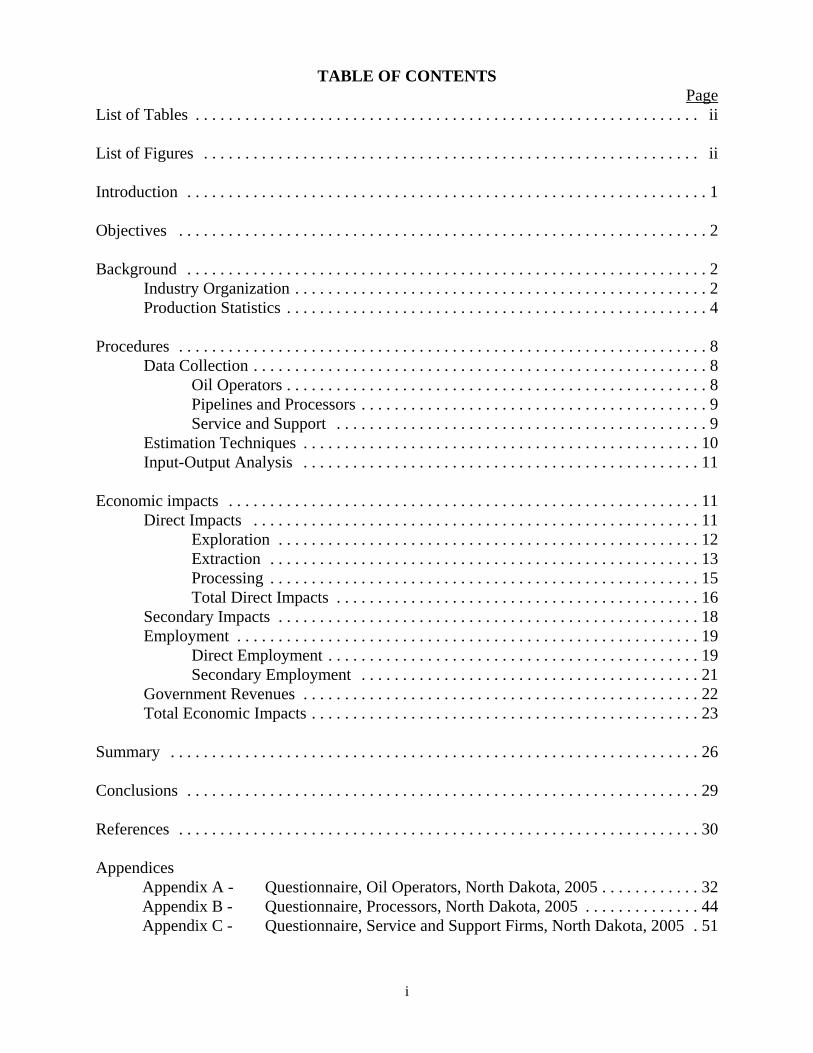
Oil and gas production is limited to the western third of North Dakota (Figure 1). While crude oil has been produced in 19 western counties, only 16 counties are currentlyproducing crude oil (North Dakota Industrial Commission 2007). Of the 16 countiesproducing oil, production is concentrated in Billings, Bottineau, Bowman, McKenzie, Stark,and Williams Counties. Those counties accounted for nearly 87 percent of state oilproduction in 2006 (North Dakota Industrial Commission 2007). Production in key countieshas fluctuated over the last 50 years as new oil deposits are found and developed in variouslocations in the state (Figure 2). From 2002 through 2006, the major increase in oilproduction has occurred in Bowman County with relatively minor increases in productionobserved in a handful of other counties in the state.
Figure 1. Oil Producing Counties, North Dakota
Nationally, North Dakota is ninth among all oil producing states based on cumulativecrude oil production from 1981 through 2005 (Figure 3) (U.S. Department of Energy 2007). Based on crude oil production in 2005, North Dakota ranked eighth nationally among oilproducing states. North Dakota accounted for about 2 percent of domestic crude oilproduction in 2005.
North Dakota is less of a factor in domestic natural gas production. From 1981through 2005, North Dakota accounted for only 0.3 percent of national production and wasranked 20th among all states (U.S. Department of Energy 2007). North Dakota was ranked21st in natural gas production in 2005.

5
1952 1958 1964 1970 1976 1982 1988 1994 2000 20060
10
20
30
40
50
60
McKenzie Billings Williams Bowman Bottineau Stark All Others
milli
ons
of b
arre
ls
ColoradoNorth Dakota
KansasNew Mexico
WyomingOklahoma
LouisianaCalifornia
AlaskaTexas
0
5,000
10,000
15,000
20,000
milli
ons
of b
arre
ls
Figure 2. Historic Oil Production, Key Counties, North Dakota, 1952 through 2006Source: North Dakota Industrial Commission (2007).
Figure 3. Top States in Crude Oil Production, United States, 1981 through 2005Source: U.S. Department of Energy (2007).

6
1954 1960 1966 1972 1978 1984 1990 1996 20020
10
20
30
40
50
60
milli
ons
of b
arre
lsOil production in North Dakota has fluctuated substantially since commercial
production began in the early 1950s (Figure 4). Overall, there have been two periods of rapidgrowth in oil production in North Dakota. The first period was from 1951 through 1962, andthe second period occurred from 1974 to 1984. After historic highs in 1984, overall oilproduction in the state declined rapidly for 10 years. Since 1994, oil production in the statehas seen two periods of expansion and one period of declining production. Crude oilproduction in the state is currently increasing, and crude oil production in 2006 was thehighest since the early 1980s.
Figure 4. Crude Oil Production, North Dakota, 1951 through 2006Source: North Dakota Industrial Commission (2007).
The annual value of oil production in North Dakota was estimated using monthlyaverage price and production data from the North Dakota Industrial Commission (2007). Theoverall value of oil production in North Dakota, in nominal terms, has generally paralleled oilproduction despite price fluctuations over time (Figure 5). Nominal oil prices wereconverted to real dollars (2006) using the Producer Price Index for Crude Energy Materials(U.S. Department of Labor 2007). In real terms, from 1980 to 2005 the value of crude oilproduction in North Dakota has largely declined (Figure 6).

7
1974 1976 1978 1980 1982 1984 1986 1988 1990 1992 1994 1996 1998 2000 2002 200410
20
30
40
50
60
0
0.5
1
1.5
2
Value ofoil output
Oilproduction
(milli
ons
of b
arre
ls)
(billi
ons
of n
omin
al d
olla
rs)
1974 1976 1978 1980 1982 1984 1986 1988 1990 1992 1994 1996 1998 2000 2002 20040
1
2
3
4
5
6
7
Nominalvalue
Real value(2006 $)
(billi
ons
of d
olla
rs)
Figure 5. Production and Market Value of Crude Oil, North Dakota, 1974 through 2005Source: North Dakota Industrial Commission (2007).
Figure 6. Value of Crude Oil Production in Nominal and Real Dollars, North Dakota, 1974through 2005

1Firms with non-deliverable addresses, those who responded with completed questionnaires, and those whoindicated they would not or could not participate were excluded in the second mailing.
8
Procedures
An economic contribution analysis, as defined in this study, represents an estimate ofall relevant in-state expenditures and returns associated with an industry. The economiccontribution approach to estimating economic activity has been used for several otherindustries in North Dakota (Bangsund and Leistritz 1995a, 1995b, 1998, 1999, 2004, 2005;Coon and Leistritz 2006).
Data Collection
Due to the complexities of how the oil and gas industry is structured, and that in-stateeffects (i.e., first round spending or direct impacts) from oil and gas production in any givenyear may not equal the market value of oil and gas production, an expenditure-basedapproach to measuring the economic size of the petroleum industry was used in this study. Inthis approach, a sample of firms active in the petroleum industry in North Dakota were askedto provide estimates of the amount of expenditures made to entities (i.e., individuals, firms,and governments) in North Dakota. Three separate survey efforts were conducted for thestudy and provided the basis for most of the economic data needed to complete the study.
Oil Operators
Firms that own or operate oil wells in the state were surveyed to obtain information onexpenditures for oil and gas exploration and extraction, general business expenses in thestate, employment, physical measures of oil and gas production, and leasing and drillingactivity (Appendix A). The North Dakota Petroleum Council provided names and addressesfor 135 oil operators in the state. The survey process started with sending cover letters and aquestionnaire to each firm on the mailing list. A second mailing was conducted one monthlater for all firms that had not responded1 to the first mailing. After two mailings with littleindustry response, the focus of the survey shifted to only the 30 largest operators in the state,based on volume of in-state oil production. Firms that were not on the original mailing listbut were among the state’s top 30 operators were added to the mailing list and included in athird mailing. The third mailing was limited to only the 30 largest operators in the state.
As a result of changing the size and composition of the initial mailing list, each top 30firm received at least one mailing, while others received three mailings. Finally, the NorthDakota Petroleum Council, along with its executive committee and the study authors,organized personal contacts with oil operators that had not responded to the survey. Industryrepresentatives from the North Dakota Petroleum Council’s executive committee volunteeredto contact firms through telephone and e-mail in an attempt to solicit cooperation with thestudy. At that point several people became involved in the process and it became impossible

9
to track how many times each firm was contacted, when they were contacted, and by whomthey were contacted.
The survey of oil operators resulted in useable information from 17 firms. The firms’production from owned/operated wells represented about 20 percent of the state’s 2005production of crude oil and natural gas (Table 1). The survey respondents had additionalproduction from working interests, but those production figures were not used in the study.
Table 1. Basic Production Statistics from Survey of Oil Operators, North Dakota, 2005
Number of firms responding with useful information 17
Number of wells owned or operated in North Dakota (17 firms) 1,633
Crude oil production in 2005 in North Dakota (17 firms) 8,062,219 barrelsa
Natural gas production in 2005 in North Dakota (17 firms) 10,289,325 mcfa
Number of oil wells drilled in 2005 (11 firms) 75
Total acreage leased in 2005 (9 firms) 221,862a Output from wells operated or owned. Does not include production from working interests.
Pipelines and Processors
Another survey was conducted for firms engaged in pipeline transportation of crudeoil and unprocessed natural gas produced in North Dakota and for firms involved withprocessing of crude oil and natural gas in North Dakota. The survey was used to obtainestimates of the amount and type of expenditures made in North Dakota and in-stateemployment by those firms (Appendix B). A mailing list of 10 firms operating pipelines, gasprocessing plants, and oil refineries was provided by the North Dakota Petroleum Council. The firms on the mailing list received two mailings, with some firms being contactednumerous times by industry representatives. A total of four firms provided useableinformation. While representative data for industry activities in this segment of the industrywas obtained through the survey, a breakout of survey data for crude oil pipelines, natural gasprocessing plants and pipelines, and crude oil refineries is not possible due to confidentialityreasons. Firms operating pipelines for the transport of refined or processed petroleumproducts were not included in the study.
Service and Support
A third survey was used to obtain information from firms that provide service andsupport to oil operators in the state. The survey solicited information on the type and extentof involvement in the petroleum industry, in-state expenditures, and employment in NorthDakota (Appendix C). The mailing list was obtained from lists of contractors or vendor lists

10
provided by firms responding to the oil operator survey. Oil operators were asked to providelists of firms with whom they contract for the provision of various exploration, extraction,and transportation services in North Dakota. The vender or contractor lists were processed toremove the names of oil operators, pipeline firms, and processors, as well as any firm withouta complete address. A total of 250 firms were randomly selected from a final list of 799firms. The random sample was weighted to account for the overall ratio of in-state versusout-of-state firms and the ratio of firms listed by more than one operator versus those listedby only one operator. Undeliverable addresses were present on 13 of the 250 firms. Onemailing resulted in 42 firms responding, with 40 firms providing useable information.
Estimation Techniques
The three surveys of firms directly involved in the petroleum industry in NorthDakota provided data for two critical aspects of the study. First, data from the oil operatorand processor surveys was used to set the level of spending in North Dakota. In other words,the data was used to determine the magnitude of spending within the state. Second, datafrom all three surveys was used to determine the type and distribution of spending amongvarious sectors of the North Dakota economy. The expenditure data from the three surveysprovided critical information on the amount of spending in the state and how those dollarswere spent.
The survey of oil operators provided financial data on about one-fifth of all oil andgas production in the state. In addition, survey respondents provided information onexploration expenses, wells drilled, and leasing data. Benchmark expenses for extraction,transportation, and operational expenses (e.g., general administrative costs) were estimatedper barrel of oil equivalent (BOE). Total state production in 2005, expressed in BOE, wasthen used with survey estimates of in-state expenditures per BOE to generate state-levelestimates for extraction, transportation, and administrative spending. In-state employment byoil operators was estimated in the same manner. Benchmark expenses for exploration wereestimated on a per-well drilled basis and were used with data on the number of wells drilledin North Dakota in 2005. Data from the Oil and Gas Division of the North Dakota IndustrialCommission on wildcat and extension wells drilled (i.e., a subset of all wells drilled) wasused with survey data on acreage and bonus payments for private leases and total wellsdrilled to arrive at state-level spending for private lease bonuses. Other economiccomponents of the petroleum industry’s direct impacts, such as severance taxes, public leasebonuses, and royalty revenues represented a combination of survey data, state-level statistics,and information obtained from various state and federal governmental agencies.
The survey of service and support firms for oil and gas production in North Dakotaprovided estimates of in-state spending by various types of expenses (e.g., salaries/wages,utilities, office supplies, business services) (Appendix C). The percentage of spending invarious categories by firms responding to the survey was used to allocate state-levelexpenditures for exploration and extraction to various economic sectors of the North DakotaInput-Output Model. The amount of spending was determined using data from the survey of

11
oil operators, while the survey of service and support firms provided insights on how thosedollars impacted various sectors of the North Dakota economy.
Input-Output Analysis
Economic activity from a project, program, policy, or activity can be categorized intodirect and secondary impacts. Direct impacts are those changes in output, employment, orincome that represent the initial or first-round effects of the project, program, policy, oractivity. Secondary impacts (sometimes further categorized into indirect and induced effects)result from subsequent rounds of spending and respending within the economy. This processof spending and respending is sometimes termed the multiplier process, and the resultantsecondary effects are sometimes referred to as multiplier effects (Leistritz and Murdock1981).
Input-output (I-O) analysis is an economic tool that traces linkages among sectors ofan economy and calculates the total business activity resulting from a direct impact in a basicsector (Coon et al. 1985). The North Dakota I-O Model has 17 economic sectors, is closedwith respect to households (households are included in the model), and was developed fromprimary (survey) data from firms and households in North Dakota. Empirical testing hasshown the North Dakota Input-Output Model is sufficiently accurate in estimating grossbusiness volume, personal income, retail activity, and gross receipts in major economicsectors in North Dakota (Coon and Leistritz 2005).
Economic Impacts
The economic contribution of the petroleum industry was primarily based onestimates of in-state expenditures from exploration, extraction, transportation, and processingof crude oil and natural gas. Estimates of in-state expenditures were combined withestimates of oil and gas royalties, state severance taxes, and lease bonuses to determine totaldirect impacts. Subsequently, the direct impacts were applied to the North Dakota Input-Output Model to estimate the secondary impacts. Secondary impacts result from therespending of direct impacts within the economy. The following section is divided into fivemajor parts: (1) direct impacts, (2) secondary impacts, (3) employment, (4) tax revenue, and(5) total economic impacts.
Direct Impacts
From an economic perspective, direct impacts are those changes in economic output,employment, or income that represent the initial or first-round effects of a project, program,or activity. The direct impacts from the petroleum industry in North Dakota includedexpenditures for (1) oil and gas exploration, (2) oil and gas extraction, (3) transportation ofcrude oil and unprocessed gas, and (4) processing crude oil and natural gas. Direct impactsalso included various revenue streams originating from either oil and gas exploration, such aslease bonuses, or oil and gas production, such as severance taxes and royalty payments. Thefollowing sections describe these direct economic impacts.

2 Antidotal evidence from industry sources indicates that average drilling costs in 2006 were nearlythree times higher than those reported for 2005.
12
Exploration
The economic effects of exploration come from expenditures within North Dakota fora variety of activities that involve searching and discovering viable oil and gas resources. Exploration was defined to include, but not limited to, seismic testing, geological research,lease expenses, other environmental research, land survey work, excavation, road building,construction of drill site, construction and delivery of electricity, pipeline development, andall other activities associated with drilling oil and/or gas wells (Appendix A).
Estimates of total in-state expenditures in 2005 for exploration were derived from thesurvey of oil operators and used with drilling statistics from the Oil and Gas Division of theNorth Dakota Industrial Commission. In-state expenditures for exploration and drilling wereestimated at about $1.5 million per well drilled2. The petroleum industry drilled 240 wells inNorth Dakota in 2005, yielding about $362.9 million in direct impacts. Lease bonuses inNorth Dakota were estimated at over $82 million in 2005, which included $12.5 million forstate leases, $4.7 million for federal leases (public domain lands only) (U.S. Department ofInterior 2007), and about $65 million for private mineral leases. The $4.7 million in federallease bonuses from public domain lands represented the portion of those leases that werereturned to North Dakota. Federal lease bonuses for acquired lands (i.e., primarily NationalGrasslands) were included in royalty payments and not included in exploration impacts. Thecombination of exploration expenses and lease bonuses resulted in $445.1 million in directimpacts in 2005 (Table 2). In-state expenditures for general exploration and drilling wereallocated to various economic sectors of the North Dakota Input-Output Model usinginformation from the survey of service and support firms (Table 2). State and federal leasebonuses were allocated to the Government sector and private lease bonuses were allocated tothe Households sector.

13
Table 2. Direct Impacts from General Exploration, DrillingActivities, and Lease Bonuses, North Dakota, 2005
Economic Sector In-state Expenditures(000s $)
Communications and PublicUtilities 6,793
Retail Trade 67,249
Finance, Insurance, and RealEstate 19,618
Business and Personal Services 25,133
Professional and Social Services 10,526
Households (personal income) 273,629
Government 42,174
Total 445,122
Extraction
The economic effects of extraction come from expenditures within North Dakota for avariety of activities that involve bringing crude oil and natural gas from undergroundformations to the earth’s surface. Extraction and production was defined to include, but notlimited to, all activities associated with the removal of crude oil and natural gas from theground, and maintenance and periodic inspections of equipment used to extract oil and gas,and other production related activities, such as well work overs, well idling, shutdown, andabandonment activities (Appendix A). Also included in this segment of the industry are thegeneral business expenditures incurred by oil operators in North Dakota. Examples of theseexpenditures include, but are not limited to, office rent, office supplies, wages and salaries,communications, public utilities, business and professional services, insurance, and interestexpenses (Appendix A). Royalty revenues, both private and public, were included as directimpacts in the extraction segment of the petroleum industry. Collections from stateseverance taxes, which include the gross production tax and extraction tax, also wereincluded in the direct impacts.
Estimates of total in-state expenditures in 2005 for extraction/production and generalbusiness expenses were derived from the survey of oil operators and estimated on a BOEbasis. North Dakota produced 35,659,583 barrels of oil and 57,970,459 mcf of natural gas in2005. Those volumes of oil and gas resulted in an estimated $304.4 million for in-stateexpenditures for extraction and $218.3 million for general business expenses. State oil andgas royalties were about $18 million (North Dakota State Land Department 2007). Total

14
federal royalties returned to North Dakota were about $19.4 million (U.S. Department of theInterior 2007, U.S. Forest Service 2007).
Private royalties were based on data obtained from the survey of oil operators anddata on the value of state oil and gas production. Total royalties reported by oil operatorswere estimated at 13 percent and 13.3 percent of well output for oil and gas, respectively. Private royalties were estimated by subtracting state and gross federal royalties fromestimated total royalties. Private royalties from oil and gas production in North Dakota in2005 were estimated at $197 million.
Total collections from the gross production tax and extraction tax in calendar year2005 were $91,567,338.26 and $60,941,425.13, respectively (Office of State TaxCommissioner 2007). Those tax collections were included in the extraction/productionsegment of the petroleum industry.
Total direct impacts in the extraction/production segment of the petroleum industry inNorth Dakota in 2005 were estimated at $909.6 million (Table 3). Data from the survey ofservice and support firms was used to allocate the in-state expenditures for extraction tovarious sectors of the North Dakota Input-Output Model. Direct impacts for general businessexpenses for oil operators, royalties, and state severance taxes were also allocated to varioussectors of the North Dakota Input-Output Model (Table 3).

15
Table 3. Direct Impacts from Oil and Gas Extraction andProduction Activities, North Dakota, 2005
Economic Sector In-state Expenditures(000s $)
Construction 983
Transportation 10,414
Communications and PublicUtilities 39,214
Agricultural Processing andMiscellaneous Manufacturing 36,822
Retail Trade 58,785
Finance, Insurance, and RealEstate 30,767
Business and Personal Services 25,713
Professional and Social Services 10,541
Households (personal income) 468,012
Government 228,318
Total 909,569
Processing
The processing segment of the petroleum industry included transportation of crude oiland natural gas by truck and pipeline to collection points and processing centers, natural gasprocessing, and crude oil refining. In-state transportation expenses paid by oil operators wereestimated on a BOE equivalent. Those expenses were extrapolated based on state productionstatistics. Estimates of in-state expenditures for natural gas pipeline operation, crude oilpipeline operation, natural gas processing, and crude oil refining were obtained from thesurvey of processors. Results from the survey of processors were combined with statestatistics to estimate state-level expenditures.
Direct impacts included $26.7 million in transportation expenses paid to in-stateentities by oil operators. Processing activities, which included pipeline transportation ofunprocessed natural gas and crude oil, natural gas processing, and crude oil refining wereestimated to have in-state expenditures of $105.8 million. Total direct impacts of $132.5million were allocated to the North Dakota Input-Output Model (Table 4). To avoid doublecounting of potential impacts, in-state purchases of crude oil and unprocessed natural gas byprocessors were excluded in the study.

16
Table 4. Direct Impacts from Oil and Gas Processing, NorthDakota, 2005
Economic Sector In-state Expenditures(000s $)
Construction 22,591
Transportation 27,479
Communications and PublicUtilities 19,691
Agricultural Processing andMiscellaneous Manufacturing 5,090
Retail Trade 4,527
Finance, Insurance, and RealEstate 6,287
Business and Personal Services 4,190
Professional and Social Services 900
Households (personal income) 31,380
Government 10,350
Total 132,485
Total Direct Impacts
Direct impacts are defined as the initial or first-round effects of project, program, oractivity. The petroleum industry in North Dakota was divided into several segments orcomponents for purposes of reporting study results. Total direct impacts for the petroleumindustry included in-state expenditures for oil and gas exploration, oil and gas extraction,transportation of crude oil and unprocessed gas, and processing crude oil and natural gas, aswell as, lease bonuses, severance taxes, and royalty payments.
Total direct impacts from the petroleum industry in North Dakota in 2005 wereestimated at $1.487 billion (Table 5). Exploration accounted for 30 percent of the industry’sdirect impacts. The largest segment of the industry was extraction with 61 percent of alldirect impacts. Processing and pipeline transportation accounted for 9 percent of theindustry’s direct impacts.

17
Expenditures and revenues which constitute the petroleum industry’s direct impactswere allocated to various economic sectors of the North Dakota Input-Output Model. Thesectors of the North Dakota economy that received the greatest direct impacts werehouseholds (economy-wide personal income) ($773 million), government (tax collections andpublic royalties) ($280 million), retail trade ($131 million), communications and publicutilities ($65 million), and finance, insurance, and real estate ($57 million) (Table 5).
Table 5. Total Direct Impacts, Petroleum Industry, North Dakota, 2005
Industry Component
Economic Sector Exploration Extraction Processing Totals
--------------------------------- 000s $ ---------------------------------
Construction 983 22,591 23,574
Transportation 10,414 27,479 37,893
Communications and PublicUtilities 6,793 39,214 19,691 65,698
Agricultural Processing andMiscellaneous Manufacturing 36,822 5,090 41,912
Retail Trade 67,249 58,785 4,527 130,561
Finance, Insurance, and RealEstate 19,618 30,767 6,287 56,672
Business and PersonalServices 25,133 25,713 4,190 55,036
Professional and SocialServices 10,526 10,541 900 21,967
Households (personal income) 273,629 468,012 31,380 773,021
Government 42,174 228,318 10,350 280,842
Total 445,122 909,569 132,485 1,487,176

18
Secondary Impacts
Secondary economic impacts result from subsequent rounds of spending andrespending within an economy. Input-output (I-O) analysis traces linkages (i.e., the amountof spending and respending) among sectors of an economy and calculates the total businessactivity resulting from a direct impact in a basic sector (Coon et al. 1985). An economic sector is a group of similar economic units (e.g., communications and public utilities, retailtrade, construction).
This process of spending and respending can be explained by using an example. Asingle dollar from an in-state wheat producer (Households sector) may be spent for a loaf ofbread at the local store (Retail Trade sector); the store uses part of that dollar to pay for thenext shipment of bread (Transportation and Agricultural Processing sectors) and part to paythe store employee (Households sector) who shelved or sold the bread; the bread supplieruses part of that dollar to pay for the grain used to make the bread (Agriculture-Crops sector)... and so on (Hamm et al. 1993).
Secondary economic impacts were estimated separately for exploration, extraction,and processing components of the petroleum industry. Results from the North Dakota Input-Output Model revealed that secondary economic impacts from exploration in North Dakotain 2005 would be nearly $775 million (Table 6). The $910 million in direct impacts for oiland gas extraction (production) activities produced an estimated $1.4 billion in secondaryeconomic impacts. Finally, the transportation and processing segment of the petroleumindustry was responsible for $238 million in secondary economic impacts. Total secondaryeconomic impacts from all components of the petroleum industry were estimated at $2.4billion. Across all three major components of the petroleum industry, considerable secondaryimpacts were generated in the retail trade ($774 million), households ($740 million),government ($121 million), and communications and public utilities sectors ($119 million)(Table 6).

19
Table 6. Total Secondary Impacts, Petroleum Industry, North Dakota, 2005
Industry Component
Economic Sector Exploration Extraction Processing Totals
--------------------------------- 000s $ ---------------------------------
Construction 31,111 54,167 7,848 93,126
Transportation 3,973 6,835 1,258 12,066
Communications and PublicUtilities 39,730 68,343 10,991 119,064
Agricultural Processing andMiscellaneous Manufacturing 16,970 53,828 7,554 78,352
Retail Trade 256,751 449,618 67,274 773,643
Finance, Insurance, and RealEstate 57,636 101,337 15,105 174,078
Business and PersonalServices 21,356 37,362 5,582 64,300
Professional and SocialServices 33,014 57,045 7,660 97,719
Households (personal income) 236,240 417,550 85,710 739,500
Government 37,854 68,665 15,287 121,806
Other sectorsa 30,320 93,695 13,842 147,857
Total 774,955 1,408,445 238,111 2,421,511a Includes various agricultural and mining sectors.
Employment
The petroleum industry is responsible for creating and supporting direct andsecondary employment. Direct employment is a measure of the number of full-time jobswithin an industry. Secondary jobs are an estimate of employment outside of an industry, butemployment that is created from the industry's economy-wide economic activity.
Direct Employment
Direct employment is a term used to describe jobs that are considered to be a part ofan industry. For example, workers operating an oil drilling rig would represent direct

20
employment in the petroleum industry. Similarly, someone who works at a natural gasprocessing plant or crude oil refinery would be considered direct employment in thepetroleum industry.
While employment figures are frequently reported by various governmental agenciesand are broken into a hierarchy of categories (e.g., North American Industry ClassificationSystem), deriving specific estimates of employment for large basic-sector industries can beproblematic. Much of the problem arises in defining the type of job, and attributing to whichindustry(s) created that employment. For example, the process of drilling an oil welltypically requires developing a road and a drilling site; work that requires heavy constructionwith earth moving or excavating equipment. Most oil companies will contract that work tolocal firms that specialize in heavy construction or excavating. The individuals performingthe road building and preparation of the drill site are likely to be employed with some type ofconstruction firm, and as a result, those jobs are typically classified and reported bygovernment agencies as construction. Government agencies (e.g., Bureau of the Census,Bureau of Labor Statistics) that track employment often base the classification of those jobson the type of activities that generate the most revenue for a firm (primary activities). In thisexample, the primary activity for this firm is likely to be construction, even if the specificactivities are road building and drill site preparation. However, in the case of assigningwhich basic-sector industry created that employment, it may be more accurate to suggestthose jobs exist as a result of the petroleum industry rather than the construction industry. Yet, in other cases, the level of oil well drilling activity may be insufficient to sustainemployment in heavy construction for an entire year. Those situations result in seasonal orpart-time job creation. The challenge is to measure or estimate the total number of full-timejobs created and sustained by the petroleum industry, even if those jobs appear to be part ofanother industry or are only created for part of a year.
Estimates of direct employment were generated from the survey of oil operators,processors, and service and support firms. The survey of oil operators and processorsspecifically asked for the number of full-time jobs in North Dakota (Appendices A and B).Employment figures from the survey of oil operators were extrapolated to state totals basedon a BOE basis, while employment data from the survey of processors was extrapolatedbased on state-level statistics for those operations (e.g., processing volumes). Thus,estimating full-time employment by oil operators, pipeline firms, and processors in NorthDakota was relatively straightforward.
Oil operators (firms owning or operating wells) contract much of the work ofexploration and extraction of oil and gas to firms that specialize in various aspects of thethose processes. While some of the work in the oil fields is performed by firms located inother states, much of the work is performed by firms located in close proximity toproduction. One of the difficulties of estimating employment in the service and supportcapacities is determining those jobs that are fully supported versus those jobs that are onlypartially supported by the petroleum industry. An additional complexity is to only attributefull-time employment to the petroleum activities located in North Dakota. For many firmslocated in the oil producing region of North Dakota, the obvious possibility is that some

3 The petroleum industry in this study did not include employment associated with transportation ofprocessed petroleum products, marketing, or retail sales. In many cases, those downstream componentsof the industry generate substantial employment. The American Petroleum Institute reported that thepetroleum industry in North Dakota was responsible for 5,796 jobs in 2005 (American Petroleum Institute2006). However, industry-wide direct employment included 1,379 jobs in transportation and 1,681 jobsin wholesale operations; two components of the petroleum industry that were only partially included inthis study. The American Petroleum Institute also estimated that retail gasoline stations in the state wereresponsible for 4,115 jobs in 2005; employment that was considered in addition to the 5,796 jobsattributable to other segments of the petroleum industry (American Petroleum Institute 2006).
4A measure of the amount of business activity needed in an economic sector to support one full-timejob.
21
employment by those firms could be partially or wholly supported by petroleum activities inMontana, Canada, or possibly in other states.
The questionnaire used in the service and support survey was designed to address thedegree of job support from the petroleum industry and the level of job support attributable toonly petroleum activities in North Dakota (Appendix C). Data from the survey was used toproduce an estimate of the average amount of gross revenue needed to support one-full timeposition within the oil field in North Dakota. Total state employment for work in the oilfields was then estimated based on examining the gross level of spending, by oil operators,for contract work in the areas of exploration, extraction, and transportation in North Dakota.
Employment in North Dakota by oil operators in 2005 was estimated at 1,794 full-time equivalent (FTE) positions. Employment in the processing segment of the industry,which included some pipeline employment, was estimated at 471 FTE jobs. Totalemployment in the oil field for contract work, which includes exploration and extractionsegments of the industry, was estimated at 3,001 FTE jobs. The petroleum industry3, asdefined and evaluated in this study, was estimated to create and support 5,267 FTE positionsin North Dakota in 2005.
Secondary Employment
Secondary employment is a term used to describe jobs that are created and supportedby the volume of business activity generated by an industry, but does not include jobs that arepart of the industry. Direct employment and secondary employment are two distinctlydifferent measures. Productivity ratios4 were used with estimates of business activity invarious sectors of the North Dakota economy to obtain estimates of secondary employment. The petroleum industry in North Dakota was estimated to generate an additional $2.4 billionin secondary business activity, which was sufficient to support 20,650 FTE jobs.

22
Government Revenues
Governmental revenues, usually based on tax collections, are another importantmeasure of the economic impact of an industry on an economy. The petroleum industry inNorth Dakota, specifically oil and gas production, is responsible for substantial amounts ofstate and local government revenues. One distinction is that unlike many other industries inNorth Dakota, severance taxes (taxes placed on the value of oil and gas removed from theground) collect money based on gross revenues produced by the industry. In contrast,taxation for most other industries is more traditional and usually limited to real property andnet income. Another distinction that makes the petroleum industry different from otherindustries in the state is that governments can hold oil and gas leases and receive royaltiesfrom the value of oil and gas production. Of course, the petroleum industry also generatesrevenues from traditional sources, such as personal income, corporate income, sales and use,and property tax collections.
Severance taxes, sales and use taxes, personal income taxes, corporate income taxes,property taxes, royalties, lease bonuses, charitable donations, and licenses, fees, and permitscombined for $280.8 million in government revenues that were directly attributable to thepetroleum industry in North Dakota in 2005 (Table 7). Exploration, extraction, andprocessing segments of the industry were responsible for about 9, 87, and 4 percent,respectively, of the total government revenues from the petroleum industry in North Dakota.
Severance taxes accounted for over half (54 percent) of all government revenues fromthe petroleum industry in North Dakota in 2005. The second largest source was the mostcommon general taxes (i.e., property, personal income, sales and use, and corporate income)at 24 percent, followed by royalties at 14 percent, and lease bonuses at 6 percent.
In addition to the government revenues that were included as direct impacts,collections from personal income and sales and use taxes were estimated based on thesecondary economic activity generated by the petroleum industry. Secondary economicimpacts in the Retail Trade sector were used to estimate revenue from sales and use taxes. Economic activity in the Households sector (which represents economy-wide personalincome) was used to estimate personal income tax collections. Total collections of personalincome and sales and use taxes arising from secondary economic activity were estimated at$55.5 million (Table 7).

23
Table 7. State and Local Government Revenues Attributable to the Petroleum Industry, North Dakota, 2005
Revenue Type
Revenue included aspart of direct
impacts
Revenue estimatedfrom secondary
economic impacts
------------------------- 000s $ -------------------------
Sales and Use Taxes 8,226 35,820
Property Taxes 13,980 not applicable
Personal Income Tax 6,741 19,663
Corporate Income Tax 8,035 not available
Royalties 38,054 not applicable
Severance Taxes 152,509 not applicable
Lease Bonuses 17,145 not applicable
Licenses, Permits, Fees 5,118 not available
Charitable Donations 184 not available
Undetermined Taxesa 30,850 not applicable
Total 280,842 55,483a Represents general in-state taxes paid that were not specifically identified by survey respondents.
Total Economic Impacts
The total economic effect of an industry on a local, state, or regional economy can bemeasured by estimating the total amount of business activity generated by that industry. Total business activity, sometimes called gross business volume, is generally defined as acombination of direct and secondary economic impacts. Direct impacts are those changes inoutput, employment, or income that represent the initial or first-round effects of a project,program, policy, or activity. Secondary impacts (sometimes further categorized into indirectand induced effects) result from subsequent rounds of spending and respending within aneconomy. This process of spending and respending is sometimes termed the multiplierprocess, and the resultant secondary effects are sometimes referred to as multiplier effects. Further, additional economic measures, such as personal income, tax revenue, andemployment, are often used to measure the relative size of an industry.

24
The petroleum industry in North Dakota was defined to include exploration,extraction, transportation, and processing of crude oil and natural gas. Direct impacts werebased on in-state expenditures, private and public royalties, taxes, and lease bonuses. Directimpacts were allocated to various sectors of the North Dakota Input-Output Model togenerate estimates of the secondary economic impacts.
The direct impact of exploration in 2005 was estimated at $445 million. Totalsecondary economic impacts associated with exploration activities were estimated at $775million. The in-state gross business volume of exploration activities was estimated at $1.2billion in 2005 (Table 8).
The direct impact of extraction in 2005 was estimated at $909.6 million. Totalsecondary economic impacts associated with extraction activities were estimated at $1.4billion. The in-state gross business volume of oil and gas extraction was estimated at $2.3billion in 2005 (Table 8).
The processing component of the petroleum industry was estimated to have a directimpact in North Dakota of $132 million. Total secondary economic impacts associated withprocessing and transporting crude oil and natural gas were estimated at $238 million. The in-state gross business volume of processing and transporting crude oil and natural gas wasestimated at $370 million in 2005 (Table 8).
Industry-wide direct impacts from the petroleum industry were estimated at $1.487billion in 2005. Total secondary economic impacts associated with the industry wereestimated at $2.4 billion. The gross business volume for the petroleum industry in NorthDakota in 2005 was estimated at $3.9 billion.

25
Table 8. Total (Direct and Secondary) Economic Impacts, Petroleum Industry, NorthDakota, 2005
Industry Component
Economic Sector Exploration Extraction Processing Totals
--------------------------------- 000s $ ---------------------------------
Construction 31,111 55,150 30,439 116,700
Transportation 3,973 17,249 28,737 49,959
Communications and PublicUtilities 46,523 107,557 30,682 184,762
Agricultural Processing andMiscellaneous Manufacturing 16,970 90,650 12,644 120,264
Retail Trade 324,000 508,403 71,801 904,204
Finance, Insurance, and RealEstate 77,254 132,104 21,392 230,750
Business and PersonalServices 46,489 63,075 9,772 119,336
Professional and SocialServices 43,540 67,586 8,560 119,686
Households (personal income) 509,869 885,562 117,090 1,512,521
Government 80,028 296,983 25,637 402,648
Other sectorsa 40,320 93,695 13,842 147,857
Gross Business Volume 1,220,077 2,318,014 370,596 3,908,687a Includes various agricultural and mining sectors.
Additional measures of the petroleum industry’s economic importance to the stateinclude direct employment for 5,267 full-time jobs, economy-wide personal income of $1.5billion, statewide retail sales of over $900 million, direct contributions to local and stategovernment revenues of over $280 million, indirect contribution of $55 million in stategovernment tax collections, and secondary employment of 20,650 full-time equivalent jobs. For every dollar spent in the state by the petroleum industry, another $1.63 in additionalbusiness activity was generated.

26
Some very generic or average impact figures can be produced for basic oil and gasproduction statistics. Based on a gross business volume of $3.9 billion for the petroleumindustry, total economic effects in North Dakota would be about $86 per BOE, or if impactswere only evaluated for crude oil production, total effects would be nearly $110 per barrel. Based on active wells in the state, the overall economic effect (direct and secondary impactsfrom all segments of the industry) per well (averaged for all producing wells) would be about$11.5 million annually.
Summary
The purpose of this study was to estimate the economic contribution of the petroleumindustry in North Dakota in 2005. The petroleum industry was defined to includeexploration, extraction, transportation, and processing of crude oil and natural gas. Exploration is the process of finding mineral resources while extraction is the process ofrecovering mineral resources. Transportation was limited to the movement of oil and gasfrom wells to collection points, and then on to processing facilities located either in-state orout-of-state. Petroleum processing in North Dakota included refining of crude oil and naturalgas processing.
Due to the complexities of how the oil and gas industry is structured, and that in-stateeffects (i.e., first round spending or direct impacts) from the petroleum industry in any givenyear may not equal the market value of oil and gas production, an expenditure-basedapproach to measuring the economic size of the petroleum industry was used in this study. Inthis approach, only money spent in North Dakota by oil companies was included in the studyand represented the direct impacts of the industry. In addition to in-state expenditures,private and public royalties, lease bonuses, and severance taxes were also included as directimpacts. Secondary economic impacts result from the spending and respending of the directimpacts and were estimated using the North Dakota Input-Output Model.
Three separate surveys were used to collect production, expenditure, and employmentdata for the petroleum industry in North Dakota. Firms that own or operate oil wells in thestate were surveyed to obtain information on in-state expenses for oil and gas exploration, oiland gas extraction, general business expenses, employment, oil and gas production, andleasing and drilling activity. A similar survey was conducted for firms engaged in pipelinetransportation of crude oil and unprocessed natural gas and included firms involved withprocessing of crude oil and natural gas in North Dakota. A third survey was used to obtaininformation from firms that provide service and support to oil operators in the state. Thesurvey solicited information on the type and extent of involvement in the petroleum industry,in-state expenditures, and employment in North Dakota.
The survey of oil operators produced financial data on about 20 percent of NorthDakota’s oil and gas production in 2005. Also, financial data was collected on pipelinetransportation, gas processing, and crude oil refining. The survey of service and supportfirms obtained employment and financial data on a number of oil field activities. Secondary

27
data, obtained from government agencies, was combined with survey data to estimateroyalties, lease bonuses, and severance taxes.
Estimates of total in-state expenditures in 2005 for oil and gas exploration werederived from the survey of oil operators and used with drilling statistics from the Oil and GasDivision of the North Dakota Industrial Commission. The combination of in-state expensesfor exploration and lease bonuses resulted in $445.1 million in direct impacts in 2005. Thesecondary economic impacts associated with exploration activities were estimated at $775million. The in-state gross business volume of exploration activities was estimated at $1.2billion in 2005 (Figure 7).
Estimates of oil and gas extraction expenses, general business expenses for oiloperators, private and public royalties, and state severance taxes were derived from surveydata and secondary information obtained from various government agencies. Total directimpacts for oil and gas extraction were estimated at $909.6 million in 2005. Total secondaryeconomic impacts associated with extraction activities were estimated at $1.4 billion. The in-state gross business volume of oil and gas extraction was estimated at $2.3 billion in 2005(Figure 7).
The processing component of the petroleum industry was estimated to have a directimpact in North Dakota of $132 million. Total secondary economic impacts associated withprocessing and transporting crude oil and natural gas were estimated at $238 million. The in-state gross business volume of processing and transporting crude oil and natural gas wasestimated at $370 million in 2005 (Figure 7).
Industry-wide direct impacts from the petroleum industry were estimated at $1.487billion in 2005. Total secondary economic impacts associated with the industry wereestimated at $2.4 billion. The gross business volume for the petroleum industry in NorthDakota in 2005 was estimated at $3.9 billion (Figure 7).
Additional measures of the petroleum industry’s economic importance to the stateinclude direct employment for 5,267 full-time jobs, economy-wide personal income of $1.5billion, statewide retail sales of over $900 million, direct contributions to local and stategovernment revenues of over $280 million, indirect contribution of $55 million in stategovernment tax collections, and secondary employment of 20,650 full-time equivalent jobs. For every dollar spent in the state by the petroleum industry, another $1.63 in additionalbusiness activity was generated.

28
North Dakota Petroleum IndustryKey Segments of the Industry
ExtractionExploration Transportation Processing Distribution Retail
drilling and locatingoil reserves
bringing oil and gasto the surface
moving oil and gasfrom pumps toprocessing centers
oil refining andnatural gas processing
moving productsfrom processorsto retail markets
selling petroleumproducts to endusers
Direct Impacts
Secondary Impacts
Gross Business Volume
Direct Employment
Secondary Employment
$445 million $910 million $132 million
$775 million $1.4 billion $238 million
$1.2 billion $2.3 billion $370 million
4,795 full-time equivalent jobs 471 full-time equivalent jobs
20,650 full-time equivalent jobs
not included
Direct GovernmentRevenues $42 million $228 million $10 million
Figure 7. Economic Effects of Key Segments of the North Dakota Petroleum Industry, 2005

29
Conclusions
Recent upswings in energy prices, drilling activity, and oil and gas production inNorth Dakota have made the petroleum industry the one of largest single industries in thestate. While previous comprehensive estimates of the petroleum industry’s economicimportance to the state are not available, based on records of historical oil production, currentindustry activity is approaching the peak oil boom period of the early 1980s. It would appearthat the industry receives little outside attention when production is declining or energyprices remain modest; however, when production increases and prices jump, the industrygarners much attention from policymakers, business leaders, and the general public.
The economic contribution of the petroleum industry was tied to activity and factorspresent in the industry in 2005. It is important to remember that the figures presented in thisreport represent a snapshot in time, and will not necessarily reflect the future economicimpact of the industry. The economic importance of the industry will increase and decreasewith changes in a host of factors that affect petroleum exploration, extraction, and processinglevels.
Few other basic-sector industries in North Dakota, outside of various agriculturalindustries, have had similar comprehensive assessments of their economic importance. However, a few comparisons to those industries are helpful in placing results from this studyin context. The wheat industry and the coal industry are two examples of basic-sectorindustries that have had economic assessments performed to measure their economiccontribution to North Dakota’s economy. From 2001 through 2003, the production,transportation, handling, and processing of wheat in North Dakota was estimated to producea gross business volume of $3.56 billion annually. In 2005, the coal industry in NorthDakota was estimated to generate $1.8 billion in gross business volume. Estimates of thegross business volume for the petroleum industry were $3.9 billion. Direct employmentfigures for the wheat industry would not be comparable to those in this study; however, directemployment in the coal industry was estimated at 3,858 FTE positions, compared to 5,267FTE jobs in the petroleum industry.
Regardless of the economic measure used, the petroleum industry is one of the largestbasic-sector industries in North Dakota. Considering that the industry’s direct impacts (i.e.,first round of spending) are concentrated geographically in the western portion of the state,the economic health of western North Dakota is perhaps tied more to the petroleum industrythan any other single industry. Yet, despite the strong influence of the petroleum industry inwestern North Dakota, the magnitude of the contributions to both the state and localgovernments and the shear volume of secondary economic effects in nearly all sectors of theNorth Dakota economy would suggest that the economic effects of the industry are feltstatewide. Current activity levels in the petroleum industry clearly make it one of the keyforces in the North Dakota economy.

30
REFERENCES
American Petroleum Institute. 2006. Basic Petroleum Data Book, 2nd Edition. Vol 25, No.2. American Petroleum Institute, Washington, D.C.
Bangsund, Dean A. and F. Larry Leistritz. 2005. Economic Contribution of the WheatIndustry to North Dakota. Agribusiness and Applied Economics Report No. 554. Department of Agribusiness and Applied Economics, North Dakota State University,Fargo.
Bangsund, Dean A. and F. Larry Leistritz. 2004. Economic Contribution of the SugarbeetIndustry in Minnesota, North Dakota, and Eastern Montana. Agribusiness andApplied Economics Report No. 532, Department of Agribusiness and AppliedEconomics, North Dakota State University, Fargo.
Bangsund, Dean A. and F. Larry Leistritz. 1999. Economic Contribution of the SoybeanIndustry in North Dakota. Agricultural Economics Report No. 416, Department ofAgricultural Economics, North Dakota State University, Fargo.
Bangsund, Dean A. and F. Larry Leistritz. 1998. Economic Contribution of the BarleyIndustry in North Dakota, South Dakota, and Minnesota. Agricultural EconomicsReport No. 391, Department of Agricultural Economics, North Dakota StateUniversity, Fargo.
Bangsund, Dean A. and F. Larry Leistritz. 1995a. Economic Contribution of the UnitedStates Sunflower Industry. Agricultural Economics Report No. 327, Department ofAgricultural Economics, North Dakota State University, Fargo.
Bangsund, Dean A. and F. Larry Leistritz. 1995b. Economic Contribution of the WheatIndustry to the North Dakota Economy. Agricultural Economics Report No. 332,Department of Agricultural Economics, North Dakota State University, Fargo.
Coon, Randal C. and F. Larry Leistritz. 2006. North Dakota Lignite Energy Industry’sContribution to the State Economy for 2005 and Projected for 2006. AAE StaffPaper 06002. Department of Agribusiness and Applied Economics, North DakotaState University, Fargo.
Coon, Randal C. and F. Larry Leistritz. 2005. The North Dakota Input-Output Model DataBase. Department of Agribusiness and Applied Economics, North Dakota StateUniversity, Fargo.
Coon, Randal C., F. Larry Leistritz, Thor A. Hertsgaard, and Arlen G. Leholm. 1985. TheNorth Dakota Input-Output Model: A Tool for Analyzing Economic Linkages. Agricultural Economics Report No. 187, Department of Agricultural Economics,North Dakota State University, Fargo.

31
Hamm, Rita R., JoAnn M. Thompson, Randal C. Coon, and F. Larry Leistritz. 1993. TheEconomic Impact of North Dakota's Health Care Industry on the State's Economy in1991. Agricultural Economics Report No. 296, Institute for Business and IndustryDevelopment and Department of Agricultural Economics, North Dakota StateUniversity, Fargo.
Leistritz, F. Larry and Steve H. Murdock. 1981. Socioeconomic Impact of ResourceDevelopment: Methods for Assessment. Westview Press, Boulder, Colorado.
North Dakota Industrial Commission. 2007. Unpublished data on oil and gas production,well drilling activity, and energy prices. Oil and Gas Division, Department ofMineral Resources, North Dakota Industrial Commission, Bismarck, ND.
North Dakota State Land Department. 2006. Oil and gas lease statistics. http://www.land.state.nd.us/ Minerals Management Division, North Dakota StateLand Department, Bismarck, ND.
Office of State Tax Commissioner. 2007. Unpublished data on state collections of grossproduction tax and extraction tax. Office of State Tax Commissioner, Bismarck, ND.
U.S. Department of Energy. 2007. http://www.eia.doe.gov/ Energy InformationAdministration, U.S. Department of Energy, Washington, D.C.
U.S. Department of the Interior. 2007. http://www.mrm.mms.gov/MRMWebStats/Home.aspx Minerals Revenue Management, Minerals Management Service, U.S. Department of theInterior, Washington, D.C.
U.S. Department of Labor. 2007. Producer Price Index. Crude Energy Materialshttp://www.bls.gov/ppi/ Bureau of Labor Statistics, U.S. Department of Labor,Washington, D.C.
U.S. Forest Service. 2007. Unpublished data. U.S. Forest Service, U.S. Department ofAgriculture, Bismarck, ND.

APPENDIX A
Questionnaire, Oil Operators,North Dakota, 2005

33
Contribution of the Petroleum Industryto the North Dakota Economy
Survey of Oil Operators
Department of Agribusiness and Applied EconomicsNorth Dakota State University
andNorth Dakota Petroleum Council

34
Instructions and Guidelines for Filling Out the Questionnaire
Data provided from this survey will be used to help estimate the economic contributionof the oil industry to the North Dakota economy. The goal is to determine how much moneythe oil industry spends in North Dakota. All expenditure data will be synthesized in a mannerthat only industry-wide totals will be reported. In no way will any information presented in thestudy identify or be reflective of any single firm or operation.
The following is a list of general guidelines for the questionnaire.
1. Use information from 2005 or your most recently completed fiscal year.
2. Expenditures should be expressed in U.S. dollars.
3. If the actual amount of the expenditure is not easily determined or is not readilyknown, please provide an estimate of the expense.
4. For contractor expenditures (Part II of this questionnaire), please include allexpenditures made for services provided in North Dakota, even if the office orheadquarters of the contractor or service provider is not located in North Dakota.
5. For general expenditures for day-to-day operations (Part III of the questionnaire),include only how much your company paid out to entities in North Dakota.
6. If you cannot identify whether an expenditure was made in North Dakota or inanother state, indicate this on the form.
7. Definitions for some expenditure items and their corresponding Standard IndustrialClassification (SIC) code listing are included to help in determining allocation ofexpenditures.
6. Please complete the survey by July 17, 2006 and mail the questionnaire in thereturn envelope.
7. If you have questions, please contact:
Dean Bangsund701-231-7471E-mail: [email protected]
or
Larry Leistritz701-231-7455E-mail: [email protected] of Agribusiness and Applied EconomicsNorth Dakota State UniversityFargo, ND 58105-5636

35
Part I - - General Information
Business Name:
Mailing Address:
Contact Person:
The following questions pertain only to wells for which your company is the operator.
Number of producing oil wells in ND in 2005 for which your company was the operator __________
Oil Gas
Total production from your operated wells in 2005 _______ bbls _______ mcf
Operator interest share of production _______ % _______ %
Overriding royalty interest share of production _______ % _______ %
Remaining working interest share of production _______ % _______ %
The following questions pertain to wells for which your company only has a working interest anddoes not serve as the operator.
Number of producing oil wells in ND in 2005 for which your company only has a workinginterest _________
Oil Gas
Total production of those wells in 2005 _______ bbls _______ mcf
Operator interest share of production _______ % _______ %
Overriding royalty interest share of production _______ % _______ %
Only your company’s working interest share of production _______ % _______ %
Total number of employees working in North Dakota: (Full-time equivalents)

36
Number of jobs (FTE’s) above dedicated to exploration/drilling
Number of jobs (FTE’s) above dedicated to general production/extraction
__________
__________
Part II. Payments made to Contractors, Sub-contractors, andConsultants
The following instructions pertain to Part II of the Questionnaire.
1) Only report contracted expenses for wells in North Dakota forwhich your company serves as the operator even if yourcompany’s stake in those wells is small. Do not includeexpenses for wells for which your company only has aworking interest share–those expenses will be reported byother oil operators.
2) Please include the total cost for the contracted service forthose wells. The total cost will include your company’s shareof the costs as well as the costs billed to the working interest holders on the well.
3) Please indicate expenses for producing wells, wells currentlybeing drilled, and wells that were drilled, but never used.
4) Only include contracted expenses for the last year.
5) Please include all expenditures made for services provided inNorth Dakota, even if the office or headquarters of thecontractor or service provider is not located in North Dakota.

37
Part II.
Type of Contracting Work Performed
Payments forwork done inNorth Dakota
General Exploration
Examples of services include lease brokerage costs (lease arrangementsand landowner negotiations), landman expenses, environmental services,seismic testing and geological research $
Drill Site Preparation
Examples of services include land survey work, excavation, road building,construction of drill site, other drill site preparations such as providingelectricity, setting up storage facilities, etc. $
Drilling Activities
Examples of services include erecting derrick, mudding operations, spuddingoperations, wellbore casing, case perforation, logging, fracing services,wellhead placement, pipeline development and construction, and any otherservices provided that are associated with drilling activitiesThis category of expenses should include all phases of drilling for bothprimary wells and secondary/tertiary/EOR injection wells $
Oil and Gas Extraction and Production
Examples of services include pump, well, and storage tank maintenance andservicing; daily & weekly well visits for tank switching, periodic inspections,general monitoring, and other activities; well stimulations; well work overs;well idling, shutdown, and/or abandonment activities $
Transportation
Include expenses for truck transportation of oil from well site to pipelinecollection points (terminal) and expenses for truck transportation of otherproducts and by-products from well site to secondary locations, also includeall charges for transportation of gas and oil by pipeline until products are soldto a purchaser or buyer $
Any other services or activities provided by contracted arrangements notlisted above:
____________________________________________ (please specify)
____________________________________________ (please specify)
____________________________________________ (please specify)
____________________________________________ (please specify)
$ ___________
$ ___________
$ ___________
$___________
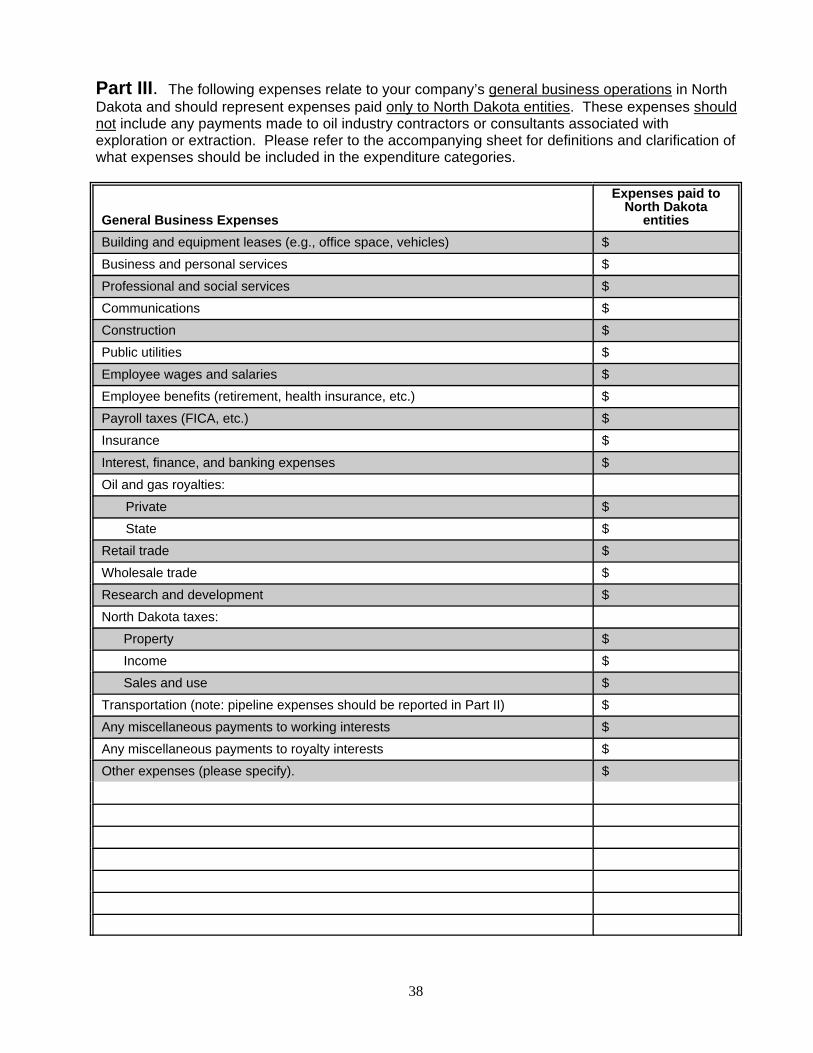
38
Part III. The following expenses relate to your company’s general business operations in NorthDakota and should represent expenses paid only to North Dakota entities. These expenses shouldnot include any payments made to oil industry contractors or consultants associated withexploration or extraction. Please refer to the accompanying sheet for definitions and clarification ofwhat expenses should be included in the expenditure categories.
General Business Expenses
Expenses paid toNorth Dakota
entitiesBuilding and equipment leases (e.g., office space, vehicles) $Business and personal services $Professional and social services $Communications $Construction $Public utilities $Employee wages and salaries $Employee benefits (retirement, health insurance, etc.) $Payroll taxes (FICA, etc.) $Insurance $
Interest, finance, and banking expenses $Oil and gas royalties:
Private $State $
Retail trade $Wholesale trade $Research and development $North Dakota taxes: Property $ Income $ Sales and use $Transportation (note: pipeline expenses should be reported in Part II) $Any miscellaneous payments to working interests $Any miscellaneous payments to royalty interests $Other expenses (please specify). $

39
Definitions for Expenditure Categories–Part III of Questionnaire
The following definitions are derived from Standard Industrial Classification Manual (SIC codes) andhave been provided to assist in allocating expenses into common categories. If needed, please referto the following web site for additional examples of the expenses included in each category: http://www.osha.gov/pls/imis/sic_manual.html Each category has several Major Group numbers,which contain additional detail on the type of activities in each category.
Construction: Includes expenses for construction projects, such as construction (including newwork, additions, alterations, remodeling, and repairs) of residential, industrial, public, office,warehouse, and other buildings and structures. (Major Groups 15, 16, and 17)
Transportation: Includes expenses for railroad, motor freight, water transportation, airtransportation, and other transportation to include packing and crating services, and rental oftransportation equipment. (Major Groups 40, 41, 42, 43, 44, 45, 46, and 47)
Communications: Includes expenditures for telephone, telegraph, radio, television, satelliteservices, Internet transactions, and other communication services. (Major Group 48)
Public Utilities: Includes expenses for natural gas, electricity, water supply, and sanitary (sewer &garbage) services. (Major Group 49)
Wholesale Trade: Expenses paid to establishments primarily engaged in selling merchandise toretailers; to industrial, commercial, institutional, or professional users; or to other wholesalers, oracting as agents in buying merchandise for or selling merchandise to such persons or companies. (Major Groups 50 and 51)
Retail Trade: Includes expenses for building materials, hardware, food, general merchandise, officesupplies, automobile fuel, computers, eating and drinking establishments, work uniforms, andmost other business and office-related supplies. (Major Groups 52, 53, 54, 55, 56, 57, 58, and59)
Finance, Insurance, and Real Estate: Includes expenses for loan service, interest on loans,investment counseling, insurance, real estate transactions, brokerage fees, and any otherfinancial service expenditures. (Major Groups 60, 61, 62, 63, 64, 65, 66, and 67)
Business and Personal Services: Examples of business and personal services include expensesfor advertising, collection services, photocopying/duplication/printing services, equipment rental,computer services, computer software, security services, tax preparation,automotive/equipment/miscellaneous repairs, entertainment, janitorial services, and overnightlodging. (Major Groups 70, 72, 73, 75, 76, 78, 79, and 87)
Professional and Social Services: Includes expenses for health/pharmaceutical, medical, legal,educational, research and development, child care, vocational training, and other professionalservices. (Major Groups 80, 81, 82, 83, 84, 86, 88, and 89)

40
Part IV. Leasing and Drilling Activity in North Dakota. Please summarize yourcompany’s lease expenditures and drilling activities over the last five years. Leaseexpenditures and drilling activities should be for North Dakota operations only.
Leasing 2001 2002 2003 2004 2005
Total lease expenditures ($)
Private leases
State leases
Federal leases
Total acreage leased
Private land
State land
Federal land
Drilling 2001 2002 2003 2004 2005
Overall number of wells drilled
Number of wells drilled that were plugged (dry holes)
Number of wells drilled that went into production (completed as a producer)

41
Part V. List of Contractors. Please provide the name and mailing address of allcompanies that your firm has contracted with over the last year to perform work in NorthDakota. Please include all companies even if they do not have a North Dakota address. If acomputer listing is not available, please use the following space to provide the information.
Name of Company Address (street, city, state, zip)
Please add sheets or attach printouts as needed.

42
Part VI. If needed, please use the space below to provide additional comments or explanations for any portion of this questionnaire (attach supporting material ifneeded):

43
Thank You for completing this questionnaire!
Please return the questionnaire in the postpaid envelope.
If you would like a copy of the study results mailed to you, make sure you have
provided a mailing address in Part I of the questionnaire. Otherwise, you may contact
Carol Jensen in the Department of Agribusiness and Applied Economics at North
Dakota State University for more information on our departmental reports. Phone
701-231 7441, fax 701-231-7400, email: [email protected] or visit our
departmental listing of research reports on the internet at http://agecon.lib.umn.edu
Study results should be available in the fall of 2006.

APPENDIX B
Questionnaire, Processors,North Dakota, 2005

Contribution of the Petroleum Industryto the North Dakota Economy
Survey of Processors
Department of Agribusiness and Applied EconomicsNorth Dakota State University
andNorth Dakota Petroleum Council

46
Instructions and Guidelines for Filling Out the Questionnaire
Data provided from this survey will be used to help estimate the economic contribution of the oilindustry to the North Dakota economy. The goal is to determine how much money the oil industryspends in North Dakota. All expenditure data will be synthesized in a manner that only industry-wide totals will be reported. In no way will any information presented in the study identify or bereflective of any single firm or operation.
The following is a list of general guidelines for the questionnaire.
1. Use information from your most recently completed fiscal year.
2. Expenditures should be expressed in U.S. dollars.
3. If the actual amount of the expenditure is not easily determined or is not readily known,please provide an estimate of the expense.
4. Only include expenditures made to businesses, governments, or individuals in NorthDakota.
5. If you cannot identify whether an expenditure was made in North Dakota or in anotherstate, indicate this on the form.
6. Definitions for some expenditure items and their corresponding Standard IndustrialClassification (SIC) code listing are included to help in determining allocation ofexpenditures.
7. We would prefer to have the questionnaire completed and returned by the end of 2006.
If you have questions, please contact:
Dean Bangsund701-231-7471E-mail: [email protected] Leistritz701-231-7455E-mail: [email protected] of Agribusiness and Applied EconomicsNorth Dakota State UniversityFargo, ND 58105-5636

Part I - - General Information
Business Name:
Mailing Address:
Contact Person:
Total barrels of oil refined/processed/transported in the last fiscal year _________Percent of those barrels purchased from North Dakota sources _________Percent of those barrels purchased from sources in other states _________Percent of those barrels purchased from Canadian sources _________
Number of employees in North Dakota (FTE) in 2005 ____________

48
Annual Expenses. The following expenditures should represent expenses paid only to North Dakotaentities. Please refer to the accompanying sheet for definitions and clarification of what expenses shouldbe included in the expenditure categories.
Operating Expenses in Fiscal Year 2005Expenses paid to
North Dakotaentities
Building and equipment leases (e.g., office space, vehicles) $
Business and personal services $
Professional and social services $
Communications $
Construction $
Public Utilities $
Employee wages and salaries $
Employee benefits (retirement, health insurance, etc.) $
Payroll taxes (FICA, etc.) $
Insurance $
Interest, finance, and banking expenses $
Purchases of crude oil (from ND sources) $
Transportation $
Retail Trade $
Research and Development $
North Dakota Taxes $
Property $
Income $
Sales and Use $
Other expenses (please specify) $
$
$

49
Definitions for Expenditure Categories
The following definitions are derived from the Standard Industrial Classification Manual (SIC codes)and have been provided to assist in allocating expenses into common categories. If needed, please referto the following web site for additional examples of the expenses included in each category: http://www.osha.gov/pls/imis/sic_manual.html Each category has several Major Group numbers, whichcontain additional detail on the type of activities in each category.
Construction: Includes expenses for construction projects, such as construction (including new work,additions, alterations, remodeling, and repairs) of residential, industrial, public, office, warehouse,and other buildings and structures. (Major Groups 15, 16, and 17)
Transportation: Includes expenses for railroad, motor freight, water transportation, air transportation,pipeline transportation of petroleum, and other transportation to include packing and crating services,and rental of transportation equipment. (Major Groups 40, 41, 42, 43, 44, 45, 46, and 47)
Communications: Includes expenditures for telephone, telegraph, radio, television, satellite services,Internet transactions, and other communication services. (Major Group 48)
Public Utilities: Includes expenses for natural gas, electricity, water supply, and sanitary (sewer &garbage) services. (Major Group 49)
Wholesale Trade: Expenses paid to establishments primarily engaged in selling merchandise toretailers; to industrial, commercial, institutional, or professional users; or to other wholesalers, oracting as agents in buying merchandise for or selling merchandise to such persons or companies. (Major Groups 50 and 51)
Retail Trade: Includes expenses for building materials, hardware, food, general merchandise, officesupplies, automobile fuel, computers, eating and drinking establishments, work uniforms, and mostother business and office-related supplies. (Major Groups 52, 53, 54, 55, 56, 57, 58, and 59)
Finance, Insurance, and Real Estate: Includes expenses for loan service, interest on loans, investmentcounseling, insurance, real estate transactions, brokerage fees, and any other financial serviceexpenditures. (Major Groups 60, 61, 62, 63, 64, 65, 66, and 67)
Business and Personal Services: Examples of business and personal services include expenses foradvertising, collection services, photocopying/duplication/printing services, equipment rental,computer services, computer software, security services, tax preparation,automotive/equipment/miscellaneous repairs, entertainment, janitorial services, and overnightlodging. (Major Groups 70, 72, 73, 75, 76, 78, 79, and 87)
Professional and Social Services: Includes expenses for health/pharmaceutical, medical, legal,educational, research and development, child care, vocational training, and other professionalservices. (Major Groups 80, 81, 82, 83, 84, 86, 88, and 89)

50
Thank You for completing this questionnaire!
Please return the questionnaire in the postpaid envelope.
If you would like a copy of the study results mailed to you, make sure you haveprovided a mailing address in Part I of the questionnaire. Otherwise, you may contactCarol Jensen in the Department of Agribusiness and Applied Economics at NorthDakota State University for more information on our departmental reports. Phone701-231 7441, fax 701-231-7400, email: [email protected] or visit ourdepartmental listing of research reports on the internet at http://agecon.lib.umn.edu
Study results should be available in the fall of 2006.

APPENDIX C
Questionnaire, Service and Support Firms,North Dakota, 2005

Contribution of the Petroleum Industryto the North Dakota Economy
Survey of Firms Providing
Department of Agribusiness and Applied EconomicsNorth Dakota State University
andNorth Dakota Petroleum Council
Service and Support

53
Instructions and Guidelines for Filling Out the Questionnaire
Data provided from this survey will be used to help estimate the economic contribution of the oilindustry to the North Dakota economy. The goal is to determine how much money the oil industryspends in North Dakota. All expenditure data will be synthesized in a manner that only industry-widetotals will be reported. In no way will any information presented in the study identify or be reflective ofany single firm or operation.
The following is a list of general guidelines for the questionnaire.
1. Use information for activities in 2005.
3. If you are unsure of a specific figure please use your best estimate. Remember, your bestestimate is going to be better than our best guess!!
4. When answering questions pertaining to spending patterns, please remember that we are onlyinterested in information on expenditures made to businesses, governments, or individuals inNorth Dakota.
5. If you cannot determine if a particular expense was incurred in North Dakota or if the expensewas made to another company or individual in a different state, please indicate this on the form.
6. Please return the questionnaire by December 5, 2006
7. If you have questions, please contact:
Dean Bangsund701-231-7471E-mail: [email protected] Leistritz701-231-7455E-mail: [email protected] of Agribusiness and Applied EconomicsNorth Dakota State UniversityFargo, ND 58105-5636

54
Part I - - General Information
Business Name:
Mailing Address:
Contact Person:
General Questions About Your Company
1) Did your company work directly in the areas of oiland/or gas exploration and/or extraction in North Dakotaat any time in 2005? Yes ___ No ___
2) Did your company provide any services, products, inputs,equipment, consultation, or conduct work in any other capacity for firms that were active in oil and/or gas exploration and/or extraction activities in North Dakota in 2005? Yes ___ No ___
If you answered “No” to bothquestions.
If you answered “Yes” to eitherquestion.
Please stop here and mail backthe questionnaire in thepre-paid envelope
Thank You.
Please continue with the questionnaire.
(

55
What percent of your company’s overall business comes from the petroleum industry?a) 1 to 20%b) 21 to 40 %c) 41 to 60%d) 61 to 80%e) 81 to 100%
Of the revenues your company receives from work in the petroleum industry, what percent of thoserevenues come from activities in North Dakota?
a) 1 to 20%b) 21 to 40 %c) 41 to 60%d) 61 to 80%e) 81 to 100%
How many total employees does your business have? _______ full-time equivalents
How many employees work in North Dakota? _______ full-time equivalents
(For part-time, seasonal, or temporary workers, please estimate how many full-time equivalents their jobswould account for. E.g., 4 part-time workers employed for 3 months each would equal 1 full-time job).

56
Part II. Description of Your Company’s Activities and Services
Type of Services Performed for the Petroleum Industry
Did yourcompany provide
any of theseservices in ND in
2005?
General Exploration and Leasing please circle
Examples of services include lease arrangements and landownernegotiations, environmental services, seismic testing, geological research,abstract and title research.
yes / no
Drill Site Preparation
Examples of services include land survey work, excavation, road building,earth moving, construction of drill site, and other drill site preparations suchas providing installation of electricity, setting up storage facilities, buildingretention ponds, or assisting in any other aspects of the developing an oilwell drill site.
yes / no
Drilling Activities
Examples of services include erecting derrick, mudding operations,spudding operations, wellbore casing, case perforation, logging, fracingservices, wellhead placement, pipeline development and construction, andany other services provided that are associated with oil drilling activities.This category of expenses should include all phases of drilling for bothprimary wells and secondary/tertiary/EOR injection wells.
yes / no
Oil and Gas Extraction and Production
Examples of services include pump, well, and storage tank maintenance andservicing; daily & weekly well visits for tank switching, periodicinspections, general monitoring, and other maintenance activities; wellstimulations; well workovers; well idling, shutdown, and/or abandonmentactivities.
yes / no

57
Type of Services Performed for the Petroleum Industry
Did yourcompany provide
any of theseservices in ND in
2005?
Transportation
Includes truck transportation of oil from well site to pipeline collectionpoints (terminal) and truck transportation of other petroleum products andby-products from well site to secondary locations, also includes generaltransportation of equipment and other supplies for firms engaged inpetroleum exploration and extraction.
yes / no
General Repair Work
Welding, metal work, fabrication of replacement parts, electrical motorrepair, custom light-duty manufacturing, custom painting, and any othergeneral repair work for machinery or equipment used in any capacity withinthe oil industry.
yes / no
Business and Professional Services
Examples include legal representation, tax preparation, accounting andbookkeeping, vocational and safety training, general business consulting,and other business services.
yes / no
Any Other Services or Activities related to the petroleum industry providedby your company not listed above: (Please Specify)
_______________________________________________________________
_______________________________________________________________
_______________________________________________________________
_______________________________________________________________
_______________________________________________________________

58
Part III. Spending Patterns in North Dakota
The next two sections ask for information on your company’s spending patterns in NorthDakota.
Section One–Expenditures as a Percentage of Revenues
Please Note:
It is important for our study that we be able to distinguish the difference betweenrevenues earned in North Dakota versus expenditures made in North Dakota. Thisholds for both firms headquartered out-of-state and firms that are headquartered inNorth Dakota.
When answering the following question, we want you to think about only your businessactivities in North Dakota and how much your company spends (expenses and costs) inthe state relative to your gross revenues from North Dakota sources.
Please estimate (make an educated guess if needed) what percent of your company’s grossrevenues associated with the petroleum industry in North Dakota are spent in North Dakota.
_________ percent
Section Two--Expenditure Patterns in North Dakota
Please think about your company’s cost of doing business in North Dakota. We would like youto estimate (or guess if needed) the approximate level of business expenses your company had in 2005.
General estimates for these figures are sufficient (e.g., $2,000 in supplies, $100,000 in services).

59
Types of Expenditures in North DakotaExpenditures inNorth Dakota in
2005
Wages and Salaries
Office expense (e.g., computers, software, photocopying, paper, postage,other supplies, office rent/lease, office equipment, subscriptions formagazines and periodicals)
Interest and Insurance (examples include bank expenses, loan interest,liability and casualty premiums)
Communications and Utilities (examples include phone, Internet,electricity, water, natural gas, sewer, garbage, etc)
Supplies and Equipment (examples include vehicles, industrialequipment, specialized machinery, fuel, lubricants, tires, tools,hardware, building materials, replacement parts, and miscellaneousinputs)
Services (examples include repairs and maintenance, tax preparation,construction work, legal, meals, lodging, snow removal, shipping andtransportation, and any miscellaneous business service)
North Dakota Taxes Property taxes Other taxes (income, unemployment)
Licenses, Permits, and Government Fees
Other Expenses (please specify the expense)
Thank You for completing this questionnaire!
Please return the questionnaire in the postpaid envelope.
If you would like a copy of the study results mailed to you, make sure you have provided a mailing addressin Part I of the questionnaire. Otherwise, you may contact Carol Jensen in the Department of Agribusinessand Applied Economics at North Dakota State University for more information on our departmental reports.Phone 701-231 7441, fax 701-231-7400, email: [email protected] or visit our departmentallisting of research reports on the internet at http://agecon.lib.umn.edu
Study results should be available in the winter of 2007.