Economic Contribution of the Film and Television Industry ...Bollywood movie Dangal’s success in...
68
Economic Contribution of the Film and Television Industry in India, 2017 March 2018
Transcript of Economic Contribution of the Film and Television Industry ...Bollywood movie Dangal’s success in...

Economic Contribution of the Film and Television Industry in India, 2017March 2018

b
Economic Contribution of the Film and Television Industry in India, 2017
Industry partners
Disclaimer:
This Report and the information contained herein has been prepared by Deloitte Touché Tohmatsu India LLP (DTTILLP) solely for the purpose of information. The reader shall not use this Report for any other purpose and in particular shall not use this Report in connection with the business decisions of any third party and for advisement purposes.
This Report contains analyses that are intended to provide high-level information on the subject and are not an exhaustive treatment of the subject. The analyses in the Report are limited by the study conducted, the time allocated, information made available to DTTILLP or collected by DTTILLP. DTTILLP accepts no responsibility or liability to any party in respect of this Report. This Report is not intended to be relied upon as a basis for any decision and the reader should take decisions only after seeking professional advice and after carrying out their own due diligence procedures, detailed analysis to ensure that they are making an informed decision. This Report is not and should not be construed in any way as giving any investment advice or any recommendations by DTTILLP to the reader or any other party. The reader shall be solely responsible for any and all decisions (including the implications thereof) made by them on the basis of this Report.
This Report has been prepared on the basis of information made available, obtained and collected by DTTILLP in association with Motion Picture Dist. Association (India) Pvt. Ltd. The sources of any material information used in the Report has been mentioned or cited herein. The information obtained and collected from the various sources primary and secondary sources has been used on an “as-is” basis without any independent verification by DTTILLP. DTTILLP shall not be responsible for any error or omissions, or for the results obtained from the use of this information and provides no assurance regarding the accuracy, timeliness, adequacy, comprehensiveness and/ or completeness of such information and provides no warranty of any kind, express or implied, including, but not limited to warranties of performance and fitness for a particular purpose. DTTILLP shall not be liable for any losses and damages arising as a result of any inaccuracy or inadequacy or incomprehensiveness or incompleteness of such information.

01
Economic Contribution of the Film and Television Industry in India, 2017
Foreword 02
Executive summary 03
Film, television, and OTT: The big picture 07
Economic impact: The multiplier effect 11
Tapping the multiplier effect: Make in India 23
A deeper look at the sub-sectors 29
Film 30
Television 37
OTT 43
Related sectors 51
Enabling the industry 55
Appendix 57
Contents

02
Economic Contribution of the Film and Television Industry in India, 2017
India’s entire media and entertainment (M&E) industry represents under 1% of its GDP. This scale often provides the lens under which the industry is viewed. This report, which focuses on the film, television, and OTT industries (which represent over half of the total M&E industry), highlights that the economic activity generated by these industries runs deeper, just like the bulk of an iceberg remains hidden below the surface.
On the surface, the television, film, and OTT industries (together referred to in this report as “creative industries”) are estimated to have a gross output of INR 101,359 cr (US$ 15.6 bn), and to employ 7.4 lac (741k) people. This is the direct impact, which is easily visible. Scratch the surface, however, and you would discover that these industries stimulate other sectors in the economy, producing a total gross output (direct + indirect) of INR 216,677 cr (US$ 33.3 bn), and generate a total employment of 23.6 lac (2.36 million).
These estimates are conservative. The iceberg effect reveals much greater economic activity. The indirect impact values above have been estimated through input-output tables, which identify 130 different sectors and their inter-relationships. Given the relatively small scale of India’s media and entertainment (M&E) industry on the surface, the industry is tagged to a sector labelled “other services” in the country’s input-output tables. While the “other services” classification includes recreation, entertainment, radio and television broadcasting services, it also includes sanitary services, and “services not elsewhere classified”. The estimates of indirect impact are diluted due to the presence of several unrelated sectors in the same bucket. For instance, sanitary services are likely to be driven as a consequence of growth in other sectors, as against a film, which will drive growth in other sectors. While there will be multiplier effects in both cases, a film is likely to have a significantly higher indirect impact.
To discover the extent of economic activity generated by the film and television industry, we need to dive well beneath the surface. A medium-large budget movie can generate tourism revenue nearly equal to its domestic box office collection (a 2x multiplier only from tourism). Indeed, a strong film with an attractive location could have a significantly greater impact – such as 3 Idiots, which increased tourist inflow to Ladakh to 2.4x, and Dilwale increasing the Indian tourist count to Iceland by a
factor of 19. Every INR 1 cr increase in tourism revenue results in employment for 87 people. Five films like 3 Idiots which may collectively employ a few hundred people directly for shooting could result in indirect tourism related employment for c. 4 lac people – a magnifying factor of greater than 100x. This tourism will also produce its own indirect impact (estimated to be 3-5x of direct employment), and so on.
Similarly, a multiplex drives food and beverage sales in its own premises to the extent of 35-40% of net box office revenue. Further, a multiplex often acts as an anchor tenant in a mall, driving up footfalls and boosting overall consumption, as well as the value of the micro market.
What does this mean for policy makers? An analysis of both direct and indirect impact should be greatly encouraged. It is natural to look at the visible (direct) industry size and employment, and often the sectors that are visibly larger may dominate attention. However, this may de-prioritize a comprehensive analysis of the indirect impact. For instance, the Make in India program could unlock significant indirect effects by focusing energies on targeting creative industries to produce in India.
India’s demographic dividend gives it the potential for rapid growth over the next few decades. As India looks to activate this potential, the role of indirect effects on the supply side are starting to be recognized, with the government’s infrastructure push, including the recent granting of infrastructure status to the logistics sector. At the same time, as India grows in power, influencing the demand side will be key. Just as Hollywood has helped the US sell the concept of American products and culture to the world, our creative industries could help drive awareness and demand for India and Indian-made products. The rest of the world is becoming increasingly receptive to India’s creative output. Bollywood movie Dangal’s success in China (it became the top grossing non-Hollywood foreign film of all-time there), followed again by the recent success of Secret Superstar are telling examples. Supporting and harnessing the power of the creative industries is likely to provide a high return on investment – both economic and social - through the multiplier effect that is characteristic of these sectors. Through this report, we hope to make stakeholders cognizant of this effect.
Uday SinghManaging Director, MPA India
Hemant JoshiPartner and Head – TMT, Deloitte in India
Ashesh JaniPartner and Head – M&E, Deloitte in India
Foreword

03
Economic Contribution of the Film and Television Industry in India, 2017
Executive Summary
04
Economic Contribution of the Film and Television Industry in India, 2017
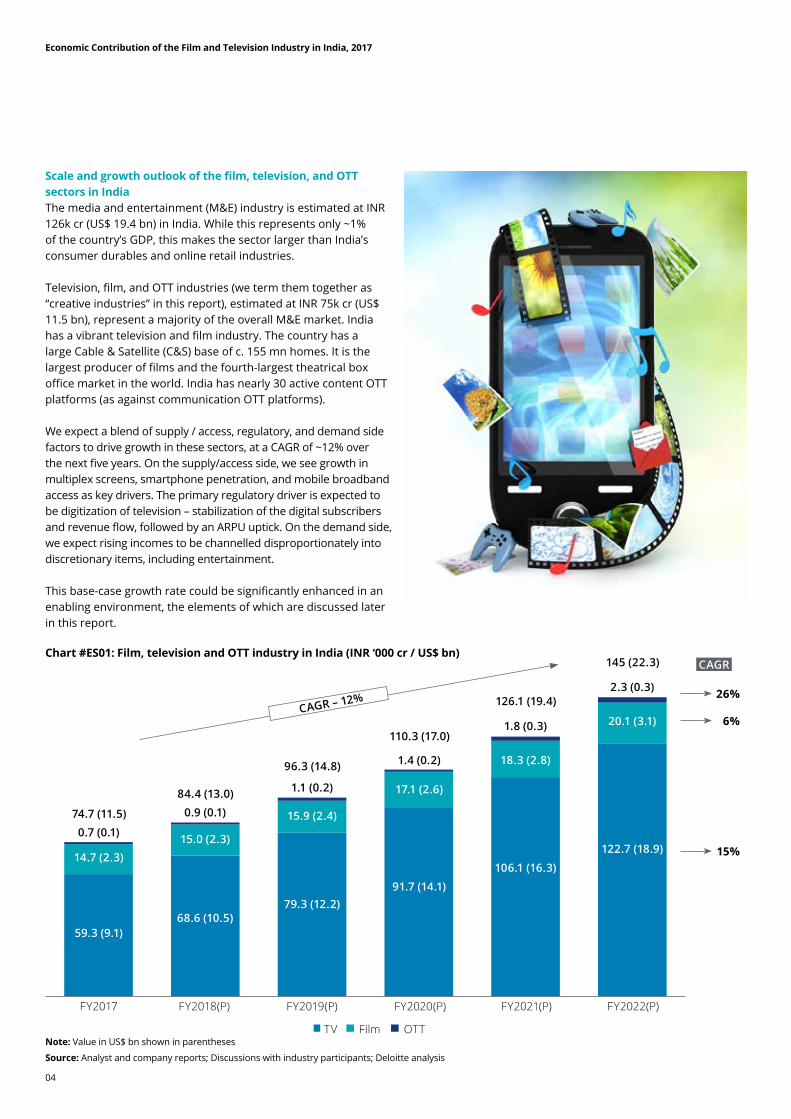
Scale and growth outlook of the film, television, and OTT sectors in IndiaThe media and entertainment (M&E) industry is estimated at INR 126k cr (US$ 19.4 bn) in India. While this represents only ~1% of the country’s GDP, this makes the sector larger than India’s consumer durables and online retail industries.
Television, film, and OTT industries (we term them together as “creative industries” in this report), estimated at INR 75k cr (US$ 11.5 bn), represent a majority of the overall M&E market. India has a vibrant television and film industry. The country has a large Cable & Satellite (C&S) base of c. 155 mn homes. It is the largest producer of films and the fourth-largest theatrical box office market in the world. India has nearly 30 active content OTT platforms (as against communication OTT platforms).
We expect a blend of supply / access, regulatory, and demand side factors to drive growth in these sectors, at a CAGR of ~12% over the next five years. On the supply/access side, we see growth in multiplex screens, smartphone penetration, and mobile broadband access as key drivers. The primary regulatory driver is expected to be digitization of television – stabilization of the digital subscribers and revenue flow, followed by an ARPU uptick. On the demand side, we expect rising incomes to be channelled disproportionately into discretionary items, including entertainment.
This base-case growth rate could be significantly enhanced in an enabling environment, the elements of which are discussed later in this report.
Note: Value in US$ bn shown in parentheses
Source: Analyst and company reports; Discussions with industry participants; Deloitte analysis
FY2017
59.3 (9.1)
14.7 (2.3)
0.7 (0.1)
FY2018(P)
68.6 (10.5)
15.0 (2.3)
0.9 (0.1)
TV Film OTT
26%
6%
15%
FY2019(P)
79.3 (12.2)
15.9 (2.4)
1.1 (0.2)
FY2020(P)
91.7 (14.1)
17.1 (2.6)
1.4 (0.2)
FY2021(P)
106.1 (16.3)
18.3 (2.8)
1.8 (0.3)
FY2022(P)
122.7 (18.9)
20.1 (3.1)
2.3 (0.3)
CAGR
CAGR – 12%
74.7 (11.5)
84.4 (13.0)
96.3 (14.8)
110.3 (17.0)
126.1 (19.4)
145 (22.3)Chart #ES01: Film, television and OTT industry in India (INR ‘000 cr / US$ bn)

05
Economic Contribution of the Film and Television Industry in India, 2017
Economic impact of the film, television, and OTT industryThe film, television, and OTT industry generates a direct gross output of INR 101k cr (US$ 15.6 bn), and directly provides employment to 7.4 lac (741k) people. Accounting for indirect effects, the industry generates a total gross output of INR 217k cr (US$ 33.3 bn) and a total employment of 23.6 lac (2.36 million).
We estimate that the industry could add INR 204k cr (US$ 31.4 bn) of total gross output and 17.6 lac (1.76 million) total jobs over the next five years. As indicated in our foreword, the indirect impact estimates are conservative, since India’s input-output tables dilute the indirect impact of the entertainment industry. For instance, five films like 3 Idiots, while employing only a few hundred employees directly for production, could generate employment of c. 4 lac in tourism alone – a magnifying factor greater than 100x.
The representation alongside shows the direct and total economic impact of the industry.
Snapshot of direct and total (i.e. direct + indirect) economic impact
Factors that could shift the growth trajectory of the industry
Head FY2017 FY2022
01 Gross output (INR ‘000 cr)Combined revenue of all industry participants (may involve an element of double counting, depending on how value chain is broken). Includes indirect tax
02 Total value added (INR ‘000 cr)Value added to key factors of production – capital and labor – in the form of EBITDA and wages respectively. Also includes indirect taxes
03 Employment (lacs)Jobs created as a result of industry activity
217
101 196
421
186
41.2
96
23.6
7.4 13.0
43 83
Enabling the industryThe industry could travel a rapid growth trajectory (16-18% CAGR vis-à-vis the expected 12%) if key stakeholders step up and address some of the main challenges and bottlenecks. This is likely to translate into a 20% higher industry size five years down the line, and also bring with it the associated indirect effects. To put this in perspective, this optimistic growth trajectory would translate into 8-12 lac additional jobs five years down the line (over and above the base-case growth trajectory).
Source: Deloitte analysisNote: The direct impact (smaller, darker icon) is enclosed within the total impact i.e. the sum of direct and indirect impact (larger, lighter icon).
• Implementation of the objectives enshrined in the National IPR Policy 2016
• Strengthening the access infrastructure for carriage of creative products
• More liberal censorship regime, allowing creation of content per consumers’ preferences; preferably move towards a ratings system
• Ease in clearances / permissions, especially in broadcasting. Wider implementation of single-window clearance for shoots and screen building
• Address GST related challenges – Highest slab (28%) for movie tickets priced over
INR 100 dampens demand – The state of Tamil Nadu has levied Local Body
Entertainment Tax (LBET) on top of GST; non-Tamil language tickets bear indirect tax of 48%
– Different rates of GST across the value chain make set-off a challenge
• Incentives for movie production, to encourage shooting within India
• Anti-piracy laws with more teeth; the broader industry ecosystem like ISPs and telcos also need to work together to curb piracy
• Thrust to close out last leg of cable digitization• Decrease in data costs by telecom operators;
penetration and growth of smartphones
Policy and Regulatory / External
• Skilling, for increased content volume as well as tasks in the new media environment
• Improving screen density, in particular creating a presence in screen-dark areas – Policy makers could create
incentives for exhibitors to build infrastructure, such as bringing back the five year tax holiday for multiplexes which was granted in the 2000’s
• Moving forward in a time-bound manner to action the copyright rules to their logical conclusion (copyright societies putting out tariffs is yet to happen)
• Arriving at a fair and sustainable solution to share subscription revenue across the television value chain
External + Internal
• Raising the quality of content• Leveraging analytics (including
recommendation engines) for relevant creation and curating of content
• Creating content for a global audience
• Focusing on profitable growth• Adequately monetizing creative
content across platforms
Industry / Internal

06
Economic Contribution of the Film and Television Industry in India, 2017
07
Economic Contribution of the Film and Television Industry in India, 2017
Film, Television, and OTT: The Big Picture

08
Economic Contribution of the Film and Television Industry in India, 2017
Scale of the film, television, and OTT sectors in IndiaThe Indian media and entertainment (M&E) industry is estimated at INR 126k cr (US$ 19.4 bn) i.e. 1% of India’s GDP. However, this makes the sector larger than India’s consumer durables and online retail industries.
Film, television, and OTT industries, estimated at INR 75k cr (US$ 11.5 bn), represent a majority of the overall M&E market. India has a vibrant television and film industry. The country has a large Cable & Satellite (C&S) base of c. 155 mn homes. It is the largest producer of films and the fourth-largest theatrical box office market in the world. India has nearly 30 active OTT platforms.
At the same time, the industry has the potential to be much larger. Television ARPUs are low, at US$ 3-4 per month. OTT is at a very nascent stage. The size of India’s entire movie industry is less than a single Hollywood blockbuster movie (such as Avatar or Titanic, which have grossed in excess of US$ 2 bn). Interestingly, India’s film industry has been called a US$ 10 bn business trapped in a US$ 2 bn body1.
1. Forbes.com article by Rob Cain
Chart #01: Size of M&E industry versus other key industries
Chart #02: Film, television, and OTT industry in India (INR ‘000 cr / US$ bn)
Base-case growthWe expect a blend of supply / access, regulatory, and demand side factors to drive growth in these sectors, at a CAGR of ~12% over the next five years. On the supply / access side, we see growth in multiplex screens, smartphone penetration, and mobile broadband access as key drivers. The primary regulatory driver is expected to be digitization of television – stabilization of digital subscribers and revenue flow, followed by an ARPU
uptick. On the demand side, we expect rising incomes to be channelled disproportionately into discretionary items, including entertainment.
This base-case growth rate could be significantly enhanced in an enabling environment. Please refer the sections on challenges faced by the industry, and on external and internal enablers elsewhere in this report.
Source: IBEF; Deloitte analysis
Note: Value in US$ bn shown in parentheses
Source: Analyst and company reports; Discussions with industry participants; Deloitte analysis
Film,television, and OTT
Broader M&E
Online retail
Consumer durables
Revenue in FY17 (US$ bn)
0 5
12.5
15.0
11.5
19.4
10 15 20 25
FY2017
59.3 (9.1)
14.7 (2.3)
0.7 (0.1)74.7 (11.5)
FY2018(P)
68.6 (10.5)
15 (2.3)
0.9 (0.1)84.4 (13.0)
TV Film OTT
26%
6%
15%
FY2019(P)
79.3 (12.2)
15.9 (2.4)
1.1 (0.2)96.3 (14.8)
FY2020(P)
91.7 (14.1)
17.1 (2.6)
1.4 (0.2)110.3 (17.0)
FY2021(P)
106.1 (16.3)
18.3 (2.8)
1.8 (0.3)126.1 (19.4)
FY2022(P)
122.7 (18.9)
20.1 (3.1)
2.3 (0.3)145 (22.3) CAGR
CAGR – 12%
09
Economic Contribution of the Film and Television Industry in India, 2017
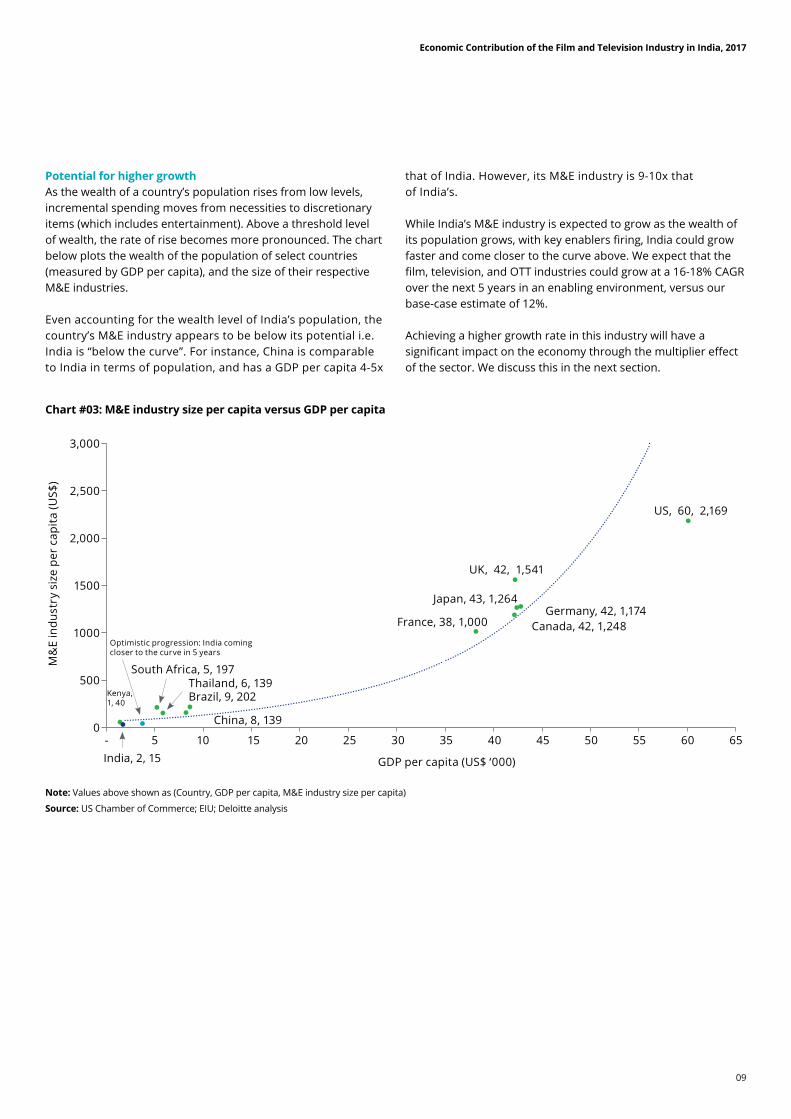
Potential for higher growthAs the wealth of a country’s population rises from low levels, incremental spending moves from necessities to discretionary items (which includes entertainment). Above a threshold level of wealth, the rate of rise becomes more pronounced. The chart below plots the wealth of the population of select countries (measured by GDP per capita), and the size of their respective M&E industries.
Even accounting for the wealth level of India’s population, the country’s M&E industry appears to be below its potential i.e. India is “below the curve”. For instance, China is comparable to India in terms of population, and has a GDP per capita 4-5x
that of India. However, its M&E industry is 9-10x that of India’s.
While India’s M&E industry is expected to grow as the wealth of its population grows, with key enablers firing, India could grow faster and come closer to the curve above. We expect that the film, television, and OTT industries could grow at a 16-18% CAGR over the next 5 years in an enabling environment, versus our base-case estimate of 12%.
Achieving a higher growth rate in this industry will have a significant impact on the economy through the multiplier effect of the sector. We discuss this in the next section.
Chart #03: M&E industry size per capita versus GDP per capita
Note: Values above shown as (Country, GDP per capita, M&E industry size per capita)
Source: US Chamber of Commerce; EIU; Deloitte analysis
3,000
M&
E in
dust
ry s
ize
per
capi
ta (U
S$)
2,500
2,000
US, 60, 2,169
UK, 42, 1,541
Japan, 43, 1,264
France, 38, 1,000Germany, 42, 1,174
Canada, 42, 1,248Optimistic progression: India coming closer to the curve in 5 years
South Africa, 5, 197
Kenya, 1, 40
Thailand, 6, 139Brazil, 9, 202
China, 8, 139
India, 2, 15 GDP per capita (US$ ‘000)
6560555045403530252015105-
1500
1000
500
0
10
Economic Contribution of the Film and Television Industry in India, 2017

11
Economic Contribution of the Film and Television Industry in India, 2017
Economic Impact: The Multiplier Effect
12
Economic Contribution of the Film and Television Industry in India, 2017
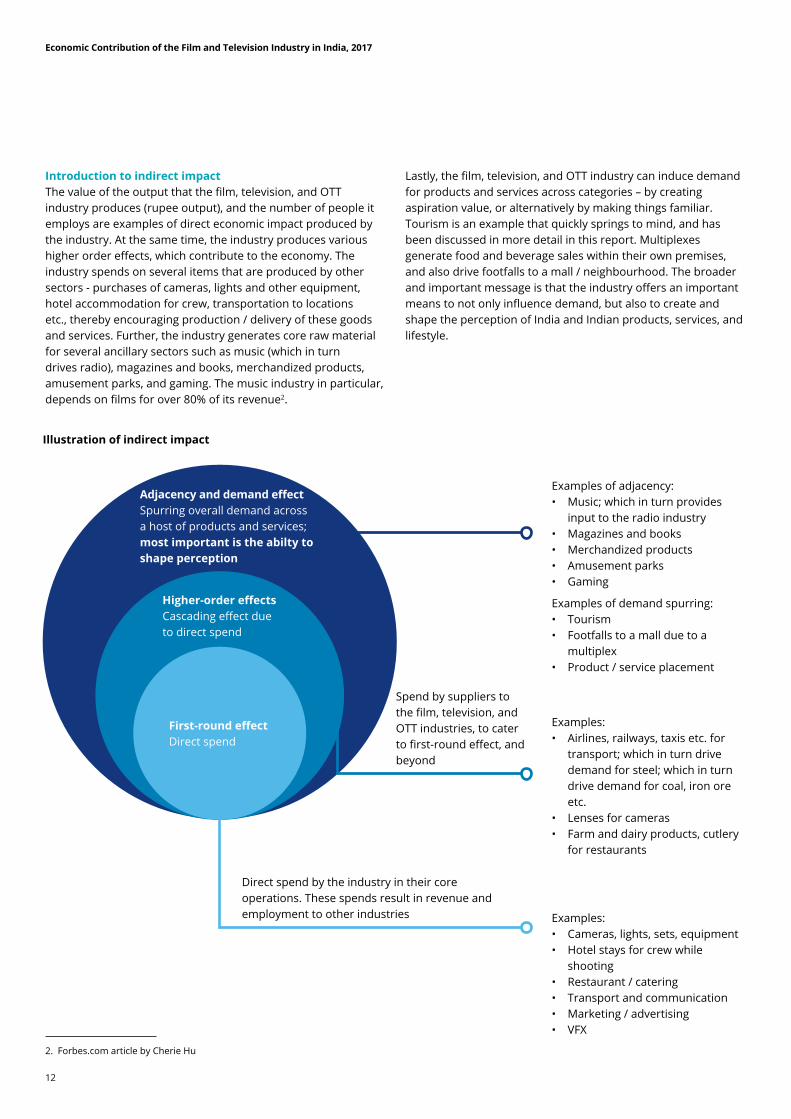
Introduction to indirect impactThe value of the output that the film, television, and OTT industry produces (rupee output), and the number of people it employs are examples of direct economic impact produced by the industry. At the same time, the industry produces various higher order effects, which contribute to the economy. The industry spends on several items that are produced by other sectors - purchases of cameras, lights and other equipment, hotel accommodation for crew, transportation to locations etc., thereby encouraging production / delivery of these goods and services. Further, the industry generates core raw material for several ancillary sectors such as music (which in turn drives radio), magazines and books, merchandized products, amusement parks, and gaming. The music industry in particular, depends on films for over 80% of its revenue2.
Lastly, the film, television, and OTT industry can induce demand for products and services across categories – by creating aspiration value, or alternatively by making things familiar. Tourism is an example that quickly springs to mind, and has been discussed in more detail in this report. Multiplexes generate food and beverage sales within their own premises, and also drive footfalls to a mall / neighbourhood. The broader and important message is that the industry offers an important means to not only influence demand, but also to create and shape the perception of India and Indian products, services, and lifestyle.
2. Forbes.com article by Cherie Hu
Examples of adjacency:• Music; which in turn provides
input to the radio industry• Magazines and books• Merchandized products• Amusement parks• Gaming
Examples of demand spurring:• Tourism• Footfalls to a mall due to a
multiplex• Product / service placement
Examples:• Airlines, railways, taxis etc. for
transport; which in turn drive demand for steel; which in turn drive demand for coal, iron ore etc.
• Lenses for cameras• Farm and dairy products, cutlery
for restaurants
Spend by suppliers to the film, television, and OTT industries, to cater to first-round effect, and beyond
Direct spend by the industry in their core operations. These spends result in revenue and employment to other industries Examples:
• Cameras, lights, sets, equipment• Hotel stays for crew while
shooting• Restaurant / catering• Transport and communication• Marketing / advertising• VFX
Adjacency and demand effectSpurring overall demand across a host of products and services; most important is the abilty to shape perception
Higher-order effectsCascading effect due to direct spend
First-round effectDirect spend
Illustration of indirect impact
13
Economic Contribution of the Film and Television Industry in India, 2017
Estimating the indirect impact: Input-output tablesInput-output tables provide a detailed dissection of intermediate transactions in an economy, and are thus a means of describing the supply and use of the products of an entire economic system. They are a tool to quantify the relationships between various sectors in the economy.
The tables attempt to answer the question: If an industry has to grow its output by INR 1, how much should the output of all the industries in the economy grow by? This is best explained through a simplified example.
Suppose the television industry requires only two inputs to produce an output worth INR 100, viz. INR 10 worth of cameras and INR 20 worth of catering. Now, if the television industry were to increase its output by INR 10, the camera industry would need to increase its output by INR 1, and the catering industry by INR 2. This total INR 3 of increased production by suppliers to the television industry is called the first-round effect.
However, to increase output by INR 1, the camera industry would require the plastic industry to raise output by INR 0.2, and the lens industry to raise its output by INR 0.3. Thus there is a second order effect of INR 0.5. Those sectors, in turn, will have backward linkages for their increased output. This is essentially an iterative process, which can be solved mathematically, and the input-output tables enable us to determine the total indirect impact after the full set of iterations.
At the core, we have leveraged the concept of input-output tables to estimate the indirect impact of the film, television, and
OTT industry. This is a well-accepted tool to study the impact of one sector on others, and on the overall economy.
India’s input-output tables identify 130 sectors and their cross linkages. The film, television, and OTT industry falls under the “Other Services” sector (#129), which includes, among others, recreation & entertainment, and radio & TV broadcasting services.
More details about these tables are provided in the appendix.
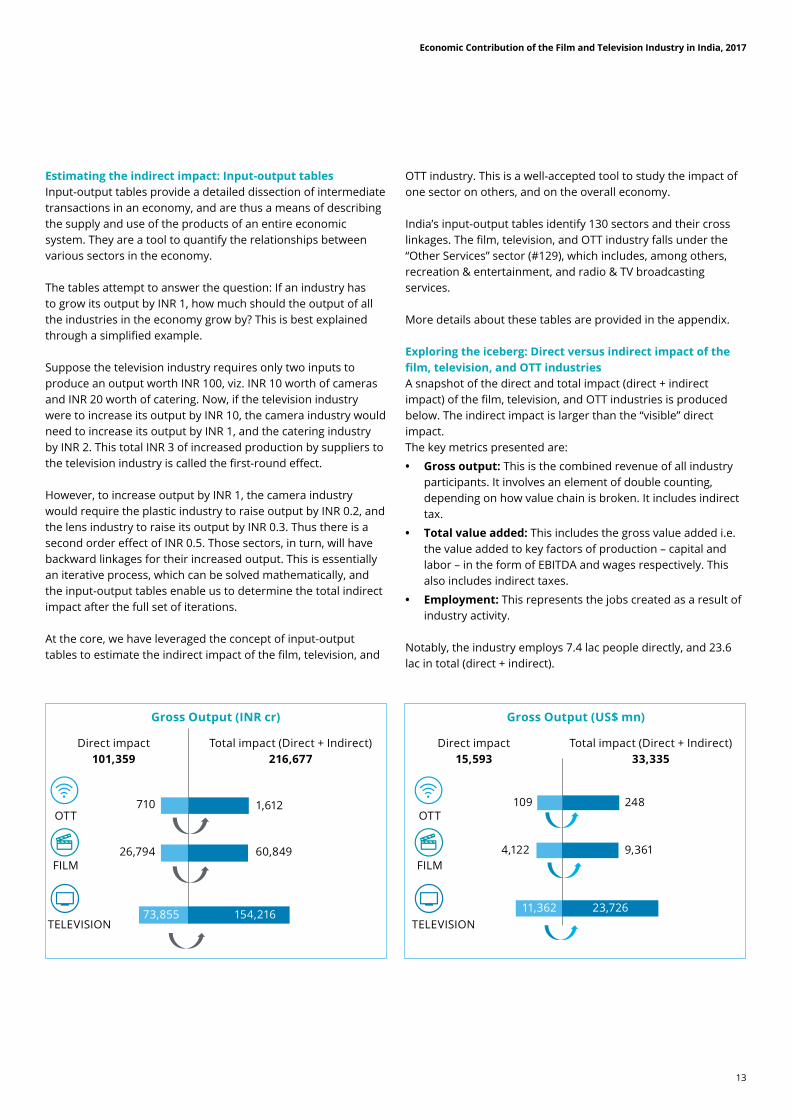
Exploring the iceberg: Direct versus indirect impact of the film, television, and OTT industriesA snapshot of the direct and total impact (direct + indirect impact) of the film, television, and OTT industries is produced below. The indirect impact is larger than the “visible” direct impact.The key metrics presented are:
• Gross output: This is the combined revenue of all industry participants. It involves an element of double counting, depending on how value chain is broken. It includes indirect tax.
• Total value added: This includes the gross value added i.e. the value added to key factors of production – capital and labor – in the form of EBITDA and wages respectively. This also includes indirect taxes.
• Employment: This represents the jobs created as a result of industry activity.
Notably, the industry employs 7.4 lac people directly, and 23.6 lac in total (direct + indirect).
Gross Output (INR cr)
Direct impact101,359
OTT
FILM
TELEVISION
Total impact (Direct + Indirect) 216,677
1,612
60,84926,794
710
154,21673,855
Gross Output (US$ mn)
Direct impact15,593
OTT
FILM
TELEVISION
Total impact (Direct + Indirect) 33,335
248
9,3614,122
109
23,72611,362

14
Economic Contribution of the Film and Television Industry in India, 2017
Employment (lacs)
Direct employment7.41
OTT
FILM
TELEVISION
Total (Direct + Indirect) employment
23.57
0.180.01
2.47 6.95
16.444.93
Employment (‘000)
Direct employment741
OTT
FILM
TELEVISION
Total (Direct + Indirect) employment
2,357
181
247 695
1,644493
Value added (INR cr)
Direct impact42,495
OTT
FILM
TELEVISION
Total impact (Direct + Indirect) 96,696
222
20,550
75,92438,15428,411
Gross Value AddedNet Indirect taxes
4,5442,041
2, 503
GVA = (298)NIT = 95
9,743
Value added (US$ mn)
Direct impact6,538
OTT
FILM
TELEVISION
Total impact (Direct + Indirect) 14,877
34
3,162
11,6815,8704,371
Gross Value AddedNet Indirect taxes
699314
385
GVA = (46)NIT = 15
1,499
Additional detailed analysis by sub-sector is presented later in this report.
Source: Deloitte analysis
15
Economic Contribution of the Film and Television Industry in India, 2017
Actual indirect impact likely to be higherOur formal calculations above using the input-output approach may understate the indirect economic impact that the film, television, and OTT industries create. The entire media and entertainment industry in India represents under 1% of the country’s GDP. Perhaps because the “visible” direct metrics are small, our sectors of interest do not get a classification of their own in India’s input-output tables. They fall under the “Other Services” sector (#129), which includes:
• Sanitary services
• Recreation & entertainment
• Radio & TV
• Broadcasting services
• International and other territorial bodies and services not elsewhere classified
We expect the estimates of indirect impact to be diluted due to the presence of several unrelated sectors in the same bucket. For instance, sanitary services are likely to be driven as a consequence of growth in other sectors, as against a film, which will drive growth in other sectors. While there will be multiplier effects in both cases, a film is likely to have a significantly higher indirect impact.
Hence, there is a strong possibility that the estimates above may be lower than the indirect impact that the film, television, and OTT industries have on the economy.
To give a flavour of the extent of the indirect impact the film, television, and OTT industry creates, we explore the impact of movies on the tourism sector, and then estimate how a medium-large movie might influence tourism.
Kulmeet Makkar, CEO, Producers Guild of India
To capture the true impact of the film industry, it is important to not only look at the direct contribution of the industry to GDP and employment, but also the ripple effect it creates for the entire ecosystem. The film industry has an indirect impact on many industries including tourism, airlines, hotels and equipment, which make a sizable contribution to the economy and to employment.
Multiplier effect in action: Impact of movies on tourism
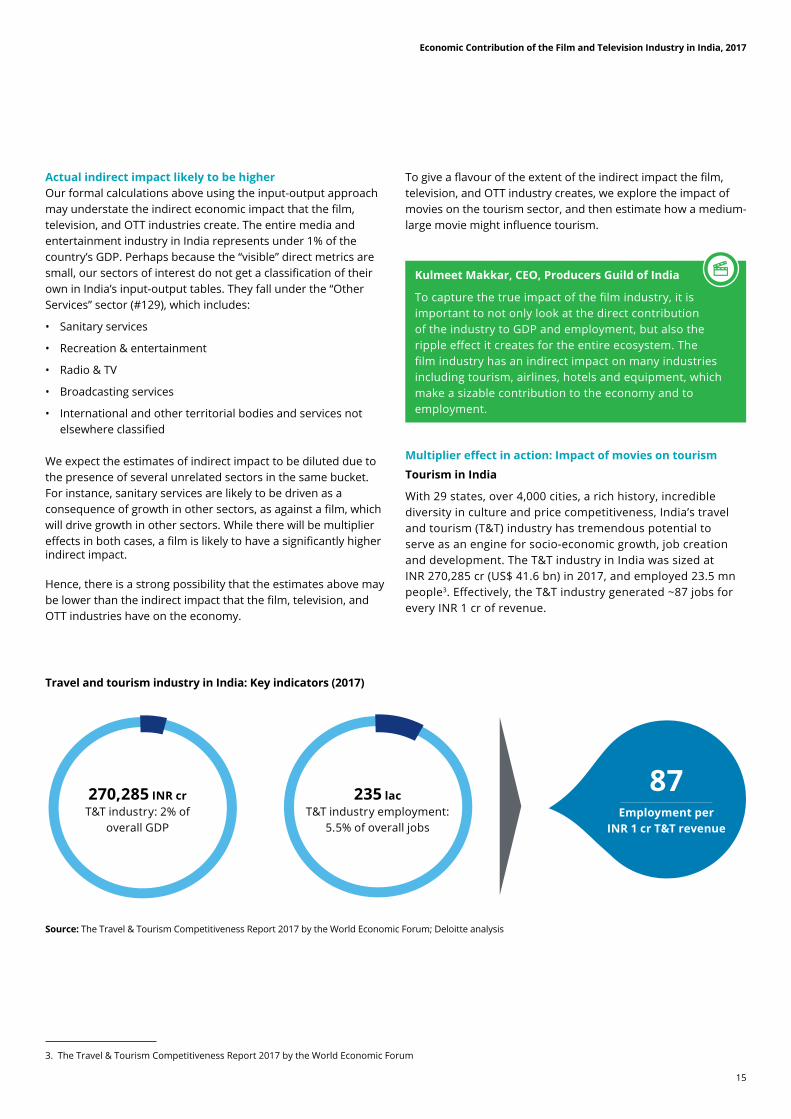
Tourism in India
With 29 states, over 4,000 cities, a rich history, incredible diversity in culture and price competitiveness, India’s travel and tourism (T&T) industry has tremendous potential to serve as an engine for socio-economic growth, job creation and development. The T&T industry in India was sized at INR 270,285 cr (US$ 41.6 bn) in 2017, and employed 23.5 mn people3. Effectively, the T&T industry generated ~87 jobs for every INR 1 cr of revenue.
3. The Travel & Tourism Competitiveness Report 2017 by the World Economic Forum
Travel and tourism industry in India: Key indicators (2017)
Source: The Travel & Tourism Competitiveness Report 2017 by the World Economic Forum; Deloitte analysis
270,285 INR crT&T industry: 2% of
overall GDP
235 lacT&T industry employment:
5.5% of overall jobs
87Employment per
INR 1 cr T&T revenue
16
Economic Contribution of the Film and Television Industry in India, 2017
• London (movie Harry Potter)
• New Zealand (movie The Lord of the Rings)
16
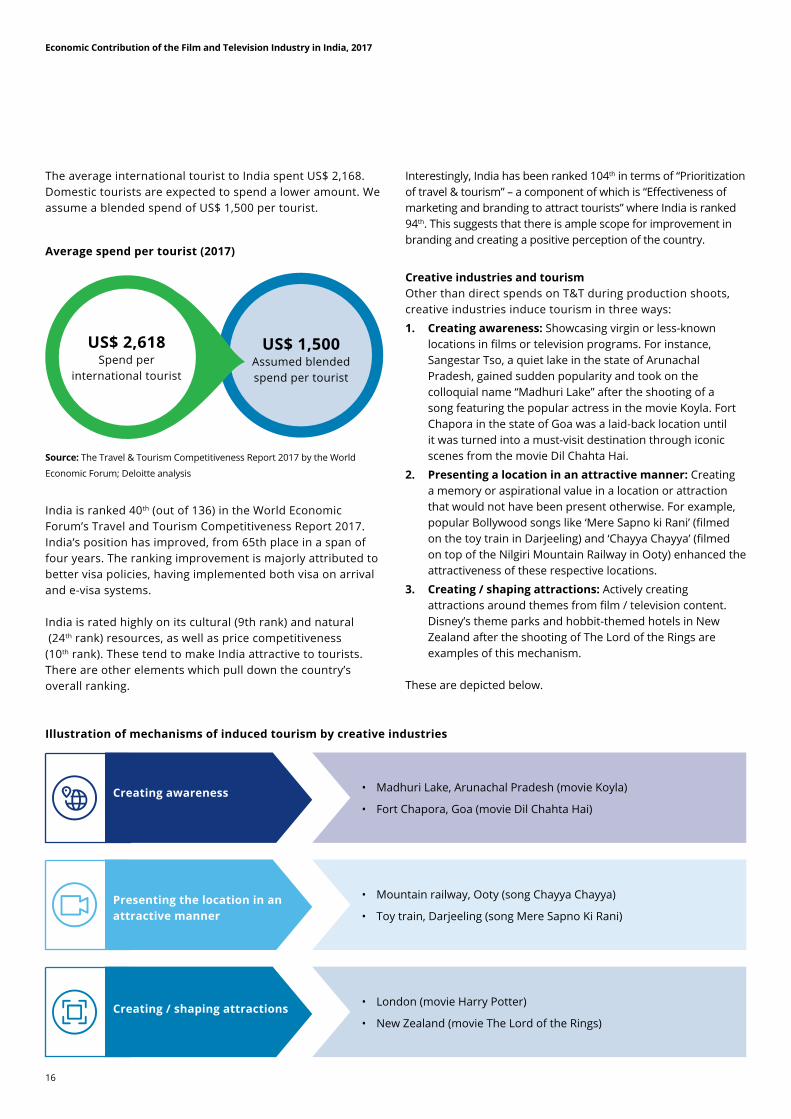
The average international tourist to India spent US$ 2,168. Domestic tourists are expected to spend a lower amount. We assume a blended spend of US$ 1,500 per tourist.
Average spend per tourist (2017)
US$ 2,618 Spend per
international tourist
US$ 1,500 Assumed blended spend per tourist
Source: The Travel & Tourism Competitiveness Report 2017 by the World
Economic Forum; Deloitte analysis
India is ranked 40th (out of 136) in the World Economic Forum’s Travel and Tourism Competitiveness Report 2017. India’s position has improved, from 65th place in a span of four years. The ranking improvement is majorly attributed to better visa policies, having implemented both visa on arrival and e-visa systems.
India is rated highly on its cultural (9th rank) and natural (24th rank) resources, as well as price competitiveness (10th rank). These tend to make India attractive to tourists. There are other elements which pull down the country’s overall ranking.
Interestingly, India has been ranked 104th in terms of “Prioritization of travel & tourism” – a component of which is “Effectiveness of marketing and branding to attract tourists” where India is ranked 94th. This suggests that there is ample scope for improvement in branding and creating a positive perception of the country.
Creative industries and tourismOther than direct spends on T&T during production shoots, creative industries induce tourism in three ways:
1. Creating awareness: Showcasing virgin or less-known locations in films or television programs. For instance, Sangestar Tso, a quiet lake in the state of Arunachal Pradesh, gained sudden popularity and took on the colloquial name “Madhuri Lake” after the shooting of a song featuring the popular actress in the movie Koyla. Fort Chapora in the state of Goa was a laid-back location until it was turned into a must-visit destination through iconic scenes from the movie Dil Chahta Hai.
2. Presenting a location in an attractive manner: Creating a memory or aspirational value in a location or attraction that would not have been present otherwise. For example, popular Bollywood songs like ‘Mere Sapno ki Rani’ (filmed on the toy train in Darjeeling) and ‘Chayya Chayya’ (filmed on top of the Nilgiri Mountain Railway in Ooty) enhanced the attractiveness of these respective locations.
3. Creating / shaping attractions: Actively creating attractions around themes from film / television content. Disney’s theme parks and hobbit-themed hotels in New Zealand after the shooting of The Lord of the Rings are examples of this mechanism.
These are depicted below.
Illustration of mechanisms of induced tourism by creative industries
Creating awareness • Madhuri Lake, Arunachal Pradesh (movie Koyla)
• Fort Chapora, Goa (movie Dil Chahta Hai)
Creating / shaping attractions
Presenting the location in an attractive manner
• Mountain railway, Ooty (song Chayya Chayya)
• Toy train, Darjeeling (song Mere Sapno Ki Rani)
17
Economic Contribution of the Film and Television Industry in India, 2017
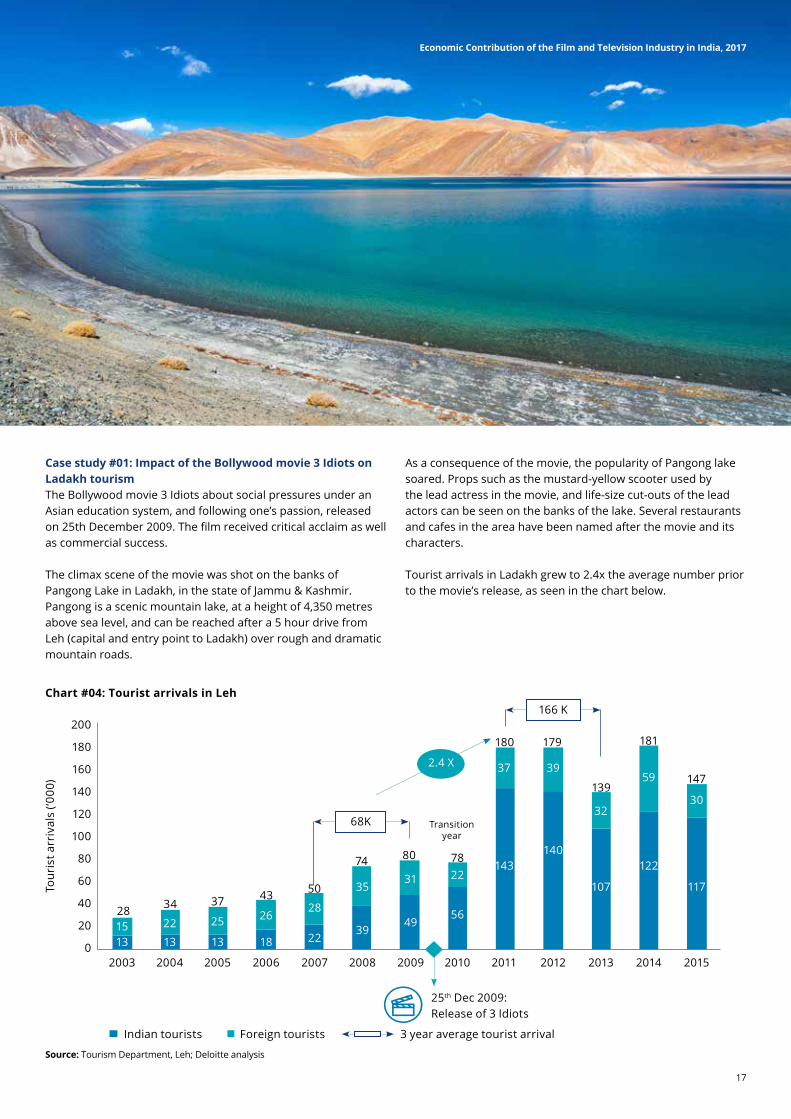
Source: Tourism Department, Leh; Deloitte analysis
Case study #01: Impact of the Bollywood movie 3 Idiots on Ladakh tourismThe Bollywood movie 3 Idiots about social pressures under an Asian education system, and following one’s passion, released on 25th December 2009. The film received critical acclaim as well as commercial success.
The climax scene of the movie was shot on the banks of Pangong Lake in Ladakh, in the state of Jammu & Kashmir. Pangong is a scenic mountain lake, at a height of 4,350 metres above sea level, and can be reached after a 5 hour drive from Leh (capital and entry point to Ladakh) over rough and dramatic mountain roads.
As a consequence of the movie, the popularity of Pangong lake soared. Props such as the mustard-yellow scooter used by the lead actress in the movie, and life-size cut-outs of the lead actors can be seen on the banks of the lake. Several restaurants and cafes in the area have been named after the movie and its characters.
Tourist arrivals in Ladakh grew to 2.4x the average number prior to the movie’s release, as seen in the chart below.
Chart #04: Tourist arrivals in Leh
Indian tourists Foreign tourists 3 year average tourist arrival
25th Dec 2009: Release of 3 Idiots
2003
Tour
ist a
rriv
als
(‘000
)
200
28 34 37 43 50
74 80 78
180 179
139
181
147
100
180
80
160
60
140
40
120
20
0 1315
2004
13
22
2005
13
25
2006
18
26
2007
22
28
2008
39
35
2009
49
31
2010
56
22
2011
143
37
2012
166 K
68K Transition year
2.4 X
140
39
2013
107
32
2014
122
59
2015
117
30

18
Economic Contribution of the Film and Television Industry in India, 2017
Considering the US$ 1,500 per tourist spend discussed earlier, we estimate an increase in tourism revenue of INR 956 cr, from the 98,000 additional tourists driven by the movie.
Tourism revenue induced by the movie 3 Idiots
Source: Deloitte analysis
98,000Rise in tourist
inflow
$ 1,500 Average spend
per tourist
956 INR crTourism revenue
induced by 3 Idiots
Contrasted against this, the box office gross collection from 3 Idiots was c. INR 275 cr in India, and c. INR 450 cr world-wide. The illustration below puts this into perspective.
In perspective: Induced tourism revenue versus box-office collection for 3 Idiots
Source: Deloitte analysis
Source: Deloitte analysis
Further, we have noted that every INR 1 cr of T&T revenue generates employment for 87 people. The induced INR 956 cr of tourism revenue from 3 Idiots would have generated employment of c. 83,000. To put this in perspective, a typical Bollywood movie shoot involves c. 150 people.
In perspective: Direct employment versus induced related employment for 3 Idiots
Direct employment
~150
Employment due to induced tourism
~83,000
The above analysis considers only the induced tourism impact. It does not consider any other effects, such as the film crew’s shooting expenses, or the multiplier effect on other sectors in the economy. This single factor alone is estimated to result in a total revenue impact of over 3.1x of the “visible” revenue (i.e. world-wide gross box-office collections), and total employment that is several orders of magnitude higher than the direct employment.
INR 275 crTip of the iceberg:Domestic gross box-office
“Hidden” bulk:Induced tourism revenue (indirect impact)
INR 450 cr “Visible” section:World-wide gross box-office
INR 956 cr

19
Economic Contribution of the Film and Television Industry in India, 2017
Case study #02: Impact of the Bollywood movie Dilwale on Iceland tourismThe Bollywood movie Dilwale, released on 18th December 2015, featured a popular lead pair of actors in a song 'Gerua'. This was shot against the backdrop of scenic visuals in Iceland. This song became popular, and spiked interest about Iceland amongst Indians.
Before the release of Dilwale, in 2015, Indian tourists to Iceland were c. 1,000 in number4. At this time, the Icelandic Tourist Board did not formally report / tag Indian nationals while tracking tourists by country.
With the release of the movie Dilwale, the Indian tourist count to Iceland in the 7 months from June to December 2017 was 10,944. Pro-rated for a year, this translates to 18,761 tourists – 19x in two years.
Chart #05: Indian tourists to Iceland (‘000)
Year 2017
Year 201518th Dec 2015: Launch of Dilwale 0 2 4 6 8 10 12 14 16 18 20
1
19
19X
Source: Icelandic Tourist Board; Financial Express; Deloitte analysis
Iceland has recognized the importance of the movie in driving the increase in Indian tourists:
• Thorir Ibsen, Ambassador of Iceland to India, indicated that the movie Dilwale boosted the tourism of Iceland: "There has been an interest among Indians to visit Iceland after the picturization of the song Gerua from the movie Dilwale in Iceland. The locales of Iceland were beautifully captured in the song. We want to leverage on this interest and increase the number of tourist arrivals from India"5. He has welcomed Indian filmmakers to explore the locations of Iceland6.
• Promote Iceland, a body that promotes Iceland as a tourist destination, conducted its maiden roadshow in Delhi, Bangalore and Mumbai to reach out to Indian travellers. According to the Trade Delegations Manager for Promote Iceland, post Dilwale, they wanted to build on the momentum that Iceland had gained in India by conducting roadshows.
Since June 2017, The Icelandic Tourist Board has reported on India as a source country for tourists.
4. Article in The Financial Express dated 15th April 2016 5. Article in The Financial Express dated 15th April 2016 6. http://www.ibtimes.co.in/shah-rukh-khans-dilwale-boosted-tourism-iceland-ambassador-thorir-ibsen-751716
20
Economic Contribution of the Film and Television Industry in India, 2017
Estimate of the tourism impact of a reasonably large budget movieDiscussions with industry stakeholders suggest the following metrics for a reasonably large budget movie with an average box office performance:
• Crew size of 125-175.
• Shooting for ~70 days.
• Total production budget of INR 55-60 cr (excluding the payment for the lead actors).
• Box office collections of INR 80 cr.
• Spend on tourism related items during the shoot of c. 10% of the production budget i.e. INR 5-6 cr.
Assuming the current annual visitor count to a tourist destination is 20,000 and the film shoot popularizes the location to the extent that it attracts 30% more visitors, the T&T revenue due to the incremental visitor count is estimated at INR 59 cr.
Along with the spend on tourism during the shoot, the total tourism spend attributable to the movie is estimated at INR 64 cr. This first-round effect represents 80% of the box office collection. The first-round effect, in turn, will create higher order effects, which have not been considered here.
Lastly, the employment generated from tourism is estimated at 5,554, which is 37 times the size of the production crew.
Tourism impact of a reasonably large budget movie
Note: Calculations may not exactly match due to rounding
Source: Discussions with industry participants; Deloitte analysis
Employment per INR 1 cr T&T revenue: 87
Employment opportunity from tourism
Overall tourism impact
59 INR crInflow to the economy due to
increased tourists
INR 60 crProduction cost
(Excluding payment to lead actors)
INR 80 crDomestic box office collection
6kAdditional
tourists(30% increase)
US$ 1,500Spend
per tourist
Lodging & catering INR 3 crOut-station travel INR 1.5 crShooting rights NR 1 crTotal INR 5-6 cr
Tourism related spend : ~10% of Production cost
Impact due to hike in tourist count
+ =5,554
37x the size of crew
64 INR cr80% of the box office collection
21
Economic Contribution of the Film and Television Industry in India, 2017
Source: Inox Leisure Limited filings and presentations; Deloitte analysis
Source: Inox Leisure Limited filings and presentations; Deloitte analysis
Effectively using the creative industries to drive tourismWe note that the creative industries could be key tools to drive tourism. We note that an unplanned and sudden increase in tourists could result in a sub-optimal experience, and put pressure on the infrastructure and ecosystem of fragile regions. For the highest impact, tourism boards and ministries could collaborate with creative industries to drive tourism in a proactive and planned manner.
The creation of a single window at the federal level is a welcome step in this direction and it will be beneficial if the Film Facilitation Office and the tourism ministry make a joint plan to tap the underlying potential of film tourism. Film incentives are a tool used by several jurisdictions to attract film tourism. The center and the states can work together to attract film shoots and provide incentives.
Local areas can stand to benefit from the significant employment and revenue stimulated by tourism. Components of this co-operation are visible, such as the Assam Film Tourism Policy, which is discussed later in this report.
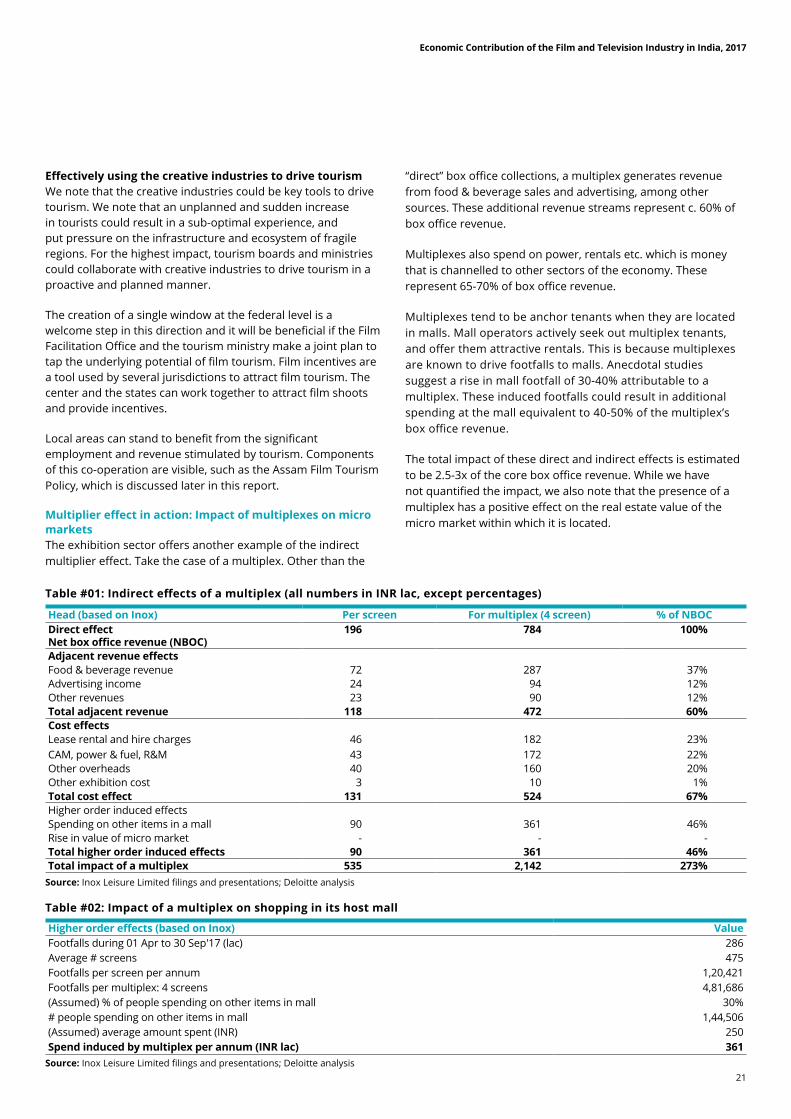
Multiplier effect in action: Impact of multiplexes on micro marketsThe exhibition sector offers another example of the indirect multiplier effect. Take the case of a multiplex. Other than the
“direct” box office collections, a multiplex generates revenue from food & beverage sales and advertising, among other sources. These additional revenue streams represent c. 60% of box office revenue.
Multiplexes also spend on power, rentals etc. which is money that is channelled to other sectors of the economy. These represent 65-70% of box office revenue.
Multiplexes tend to be anchor tenants when they are located in malls. Mall operators actively seek out multiplex tenants, and offer them attractive rentals. This is because multiplexes are known to drive footfalls to malls. Anecdotal studies suggest a rise in mall footfall of 30-40% attributable to a multiplex. These induced footfalls could result in additional spending at the mall equivalent to 40-50% of the multiplex’s box office revenue.
The total impact of these direct and indirect effects is estimated to be 2.5-3x of the core box office revenue. While we have not quantified the impact, we also note that the presence of a multiplex has a positive effect on the real estate value of the micro market within which it is located.
Table #01: Indirect effects of a multiplex (all numbers in INR lac, except percentages)
Table #02: Impact of a multiplex on shopping in its host mall
Head (based on Inox) Per screen For multiplex (4 screen) % of NBOCDirect effectNet box office revenue (NBOC)
196 784 100%
Adjacent revenue effects Food & beverage revenue 72 287 37%Advertising income 24 94 12%Other revenues 23 90 12%Total adjacent revenue 118 472 60%Cost effects Lease rental and hire charges 46 182 23%CAM, power & fuel, R&M 43 172 22%Other overheads 40 160 20%Other exhibition cost 3 10 1%Total cost effect 131 524 67%Higher order induced effects Spending on other items in a mall 90 361 46%Rise in value of micro market - - -Total higher order induced effects 90 361 46%Total impact of a multiplex 535 2,142 273%
Higher order effects (based on Inox) ValueFootfalls during 01 Apr to 30 Sep'17 (lac) 286 Average # screens 475 Footfalls per screen per annum 1,20,421 Footfalls per multiplex: 4 screens 4,81,686(Assumed) % of people spending on other items in mall 30%# people spending on other items in mall 1,44,506 (Assumed) average amount spent (INR) 250 Spend induced by multiplex per annum (INR lac) 361

22
Economic Contribution of the Film and Television Industry in India, 2017

Economic Contribution of the Film and Television Industry in India, 2017
Tapping the Multiplier Effect: Make in India
23
24
Economic Contribution of the Film and Television Industry in India, 2017
Attracting creative industriesThe previous section of this report highlighted the disproportionate indirect economic impact generated by creative industries. This has led countries to offer a range of incentives, from tax rebate, free stays, visa facilitation, and in certain cases, even bearing the cost of production. An example worth highlighting is UK’s tax incentive in form of a 25% cash rebate. The movie Wonder Woman, a recipient of this incentive, along with others such as Pirates of the Carribean, were key contributors to support 25-30% of the growth of the UK economy in the April-June quarter of 2017, through box-office and increased production spend as a result of the financial relief provided7.
Deloitte’s thought leadership report “Indywood – The Indian Film Industry” highlights benefits offered by various countries to encourage film shooting, including case studies from the UK and New Zealand.
With these considerations, it will be useful for policy makers to bear in mind the total impact (including the significant indirect impact) of the creative industries as they look to incentivize and encourage creative industries to make in India.
Introduction to the Make in India campaignThe Make in India campaign, launched by Prime Minister Narendra Modi in September 2014, is aimed at enhancing local manufacturing, fostering innovation, and facilitating investments in the Indian industries. The initiative is being led by the Department of Industrial Policy and Promotion (DIPP) and the Department of Commerce and Industry and covers 25 key sectors, including media and entertainment.
The Make in India programme endeavours to create additional employment opportunities through improving business opportunities and positioning India as a destination for manufacturing and services. The programme also aims to facilitate businesses and entry of new players in India by instating clear and transparent processes, enabling Ease of Doing Business, and simplifying laws and regulations.
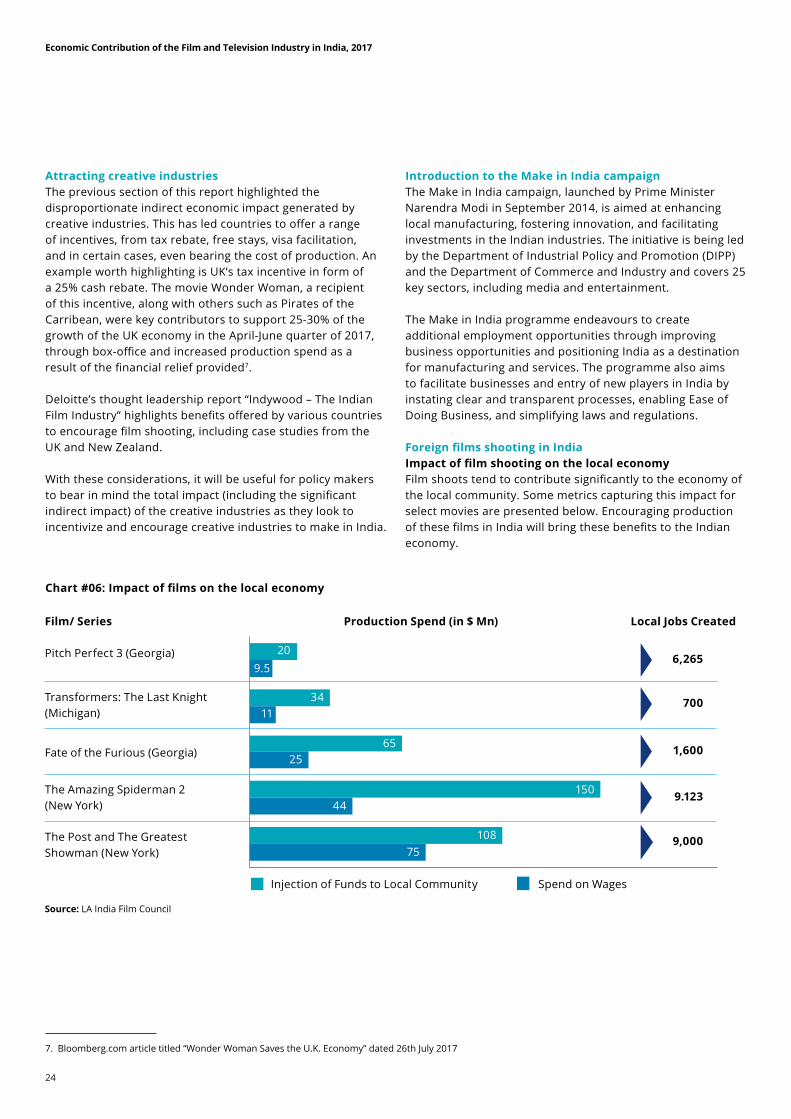
Foreign films shooting in IndiaImpact of film shooting on the local economyFilm shoots tend to contribute significantly to the economy of the local community. Some metrics capturing this impact for select movies are presented below. Encouraging production of these films in India will bring these benefits to the Indian economy.
Chart #06: Impact of films on the local economy
7. Bloomberg.com article titled “Wonder Woman Saves the U.K. Economy” dated 26th July 2017
Source: LA India Film Council
Film/ Series
Pitch Perfect 3 (Georgia) 209.5
11
25
44
10875
34
65
150
Transformers: The Last Knight (Michigan)
The Amazing Spiderman 2 (New York)
The Post and The Greatest Showman (New York)
Injection of Funds to Local Community Spend on Wages
Fate of the Furious (Georgia)
Production Spend (in $ Mn) Local Jobs Created
6,265
700
1,600
9.123
9,000
25
Economic Contribution of the Film and Television Industry in India, 2017
Source: Media Articles
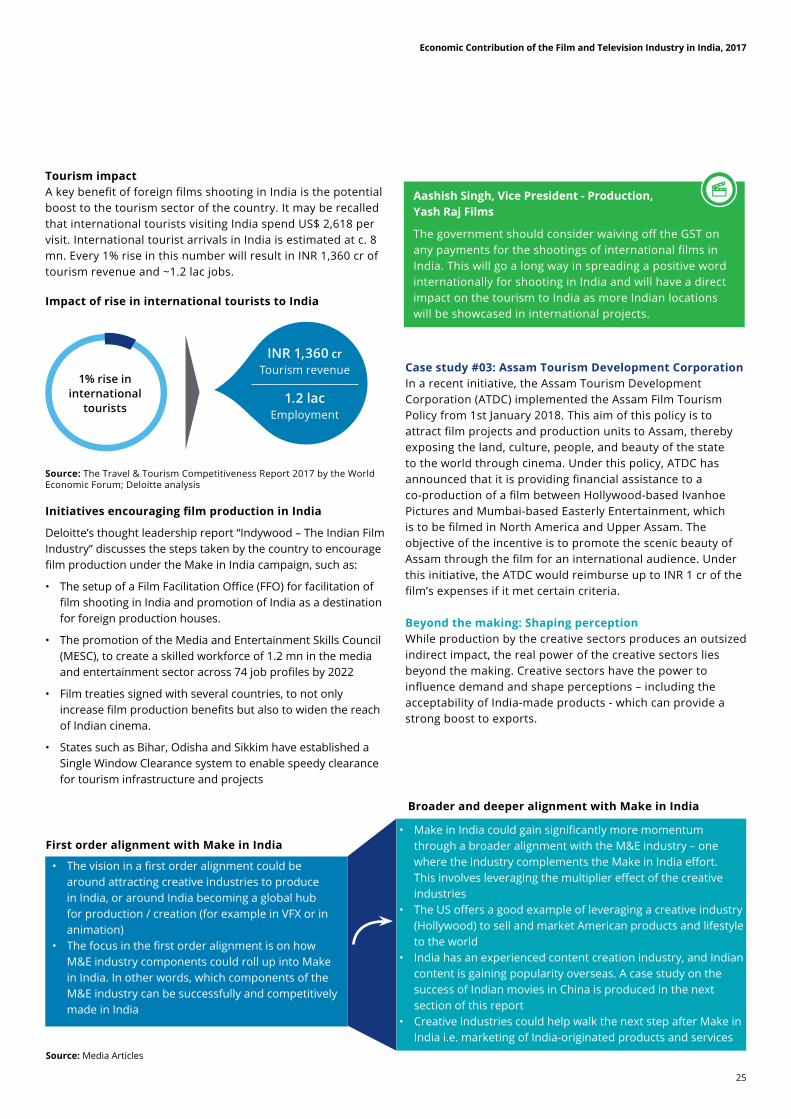
Tourism impactA key benefit of foreign films shooting in India is the potential boost to the tourism sector of the country. It may be recalled that international tourists visiting India spend US$ 2,618 per visit. International tourist arrivals in India is estimated at c. 8 mn. Every 1% rise in this number will result in INR 1,360 cr of tourism revenue and ~1.2 lac jobs.
Impact of rise in international tourists to India
1% rise in international
tourists
INR 1,360 cr Tourism revenue
1.2 lac Employment
Source: The Travel & Tourism Competitiveness Report 2017 by the World Economic Forum; Deloitte analysis
Initiatives encouraging film production in India
Deloitte’s thought leadership report “Indywood – The Indian Film Industry” discusses the steps taken by the country to encourage film production under the Make in India campaign, such as:
• The setup of a Film Facilitation Office (FFO) for facilitation of film shooting in India and promotion of India as a destination for foreign production houses.
• The promotion of the Media and Entertainment Skills Council (MESC), to create a skilled workforce of 1.2 mn in the media and entertainment sector across 74 job profiles by 2022
• Film treaties signed with several countries, to not only increase film production benefits but also to widen the reach of Indian cinema.
• States such as Bihar, Odisha and Sikkim have established a Single Window Clearance system to enable speedy clearance for tourism infrastructure and projects
Case study #03: Assam Tourism Development CorporationIn a recent initiative, the Assam Tourism Development Corporation (ATDC) implemented the Assam Film Tourism Policy from 1st January 2018. This aim of this policy is to attract film projects and production units to Assam, thereby exposing the land, culture, people, and beauty of the state to the world through cinema. Under this policy, ATDC has announced that it is providing financial assistance to a co-production of a film between Hollywood-based Ivanhoe Pictures and Mumbai-based Easterly Entertainment, which is to be filmed in North America and Upper Assam. The objective of the incentive is to promote the scenic beauty of Assam through the film for an international audience. Under this initiative, the ATDC would reimburse up to INR 1 cr of the film’s expenses if it met certain criteria.
Beyond the making: Shaping perceptionWhile production by the creative sectors produces an outsized indirect impact, the real power of the creative sectors lies beyond the making. Creative sectors have the power to influence demand and shape perceptions – including the acceptability of India-made products - which can provide a strong boost to exports.
Aashish Singh, Vice President - Production, Yash Raj Films
The government should consider waiving off the GST on any payments for the shootings of international films in India. This will go a long way in spreading a positive word internationally for shooting in India and will have a direct impact on the tourism to India as more Indian locations will be showcased in international projects.
First order alignment with Make in India
Broader and deeper alignment with Make in India
• The vision in a first order alignment could be around attracting creative industries to produce in India, or around India becoming a global hub for production / creation (for example in VFX or in animation)
• The focus in the first order alignment is on how M&E industry components could roll up into Make in India. In other words, which components of the M&E industry can be successfully and competitively made in India
• Make in India could gain significantly more momentum through a broader alignment with the M&E industry – one where the industry complements the Make in India effort. This involves leveraging the multiplier effect of the creative industries
• The US offers a good example of leveraging a creative industry (Hollywood) to sell and market American products and lifestyle to the world
• India has an experienced content creation industry, and Indian content is gaining popularity overseas. A case study on the success of Indian movies in China is produced in the next section of this report
• Creative industries could help walk the next step after Make in India i.e. marketing of India-originated products and services

26
Economic Contribution of the Film and Television Industry in India, 2017
Case study #04: Aamir Khan Productions’ success in ChinaIndian movies have traditionally been marketed and released in a limited fashion on screens in the UK and USA. A key driving factor for release has been the presence of a sizable South Asian diaspora in a country.
China has not traditionally been considered a market for Indian movies. For one, the Indian diaspora in China is small (estimated at c. 15,000 in the Chinese mainland in the sixth national population census) vis-à-vis in the USA (c. 2.5 mn) or UK (c. 1.5 mn). For another, while China and India are often categorized in one bucket as “large, fast-growing, developing markets” or bundled into a common group such as BRICS (Brazil, Russia, India, China, South Africa), the two nations have strong and distinct cultures of their own.
However, Aamir Khan Productions’ consistent and sizable success in the Chinese market is changing that perception. The table below provides a snapshot of this performance. One would note that while 2009’s 3 Idiots’ China gross collection was ~5% of the domestic gross, 2017’s Secret Superstar grossed 902% more in China than in the domestic India market.
This performance has been fuelled by local Chinese viewers, as against South Asian diaspora. The Chinese, though coming from a different culture, have been able to identify with the core themes of these movies.
3 Idiots was launched in China in December 2009 on less than 1,000 screens. This film struck a chord with Chinese viewers,
who identified with the theme of the pressure Asian society places on its children and youth to perform academically, and of the desire to follow one’s passion.
Chinese viewers then discovered and consumed on digital media older movies by Aamir Khan. By the time PK released in December 2014, there was already considerable buzz in the country. The theatrical release of PK benefited from the significant growth in exhibition across the country. PK was released across 4,000-5,000 screens in China, and grossed US$ 17 mn (INR 110 cr). This was a sizable total revenue by Indian standards, but still not noteworthy by Chinese standards.
When Dangal released in December 2016, the Chinese theatrical market provided strong support, and the movie released across 10,000 screens. Dangal went on to gross US$ 200 mn from China, becoming the highest grossing non-Hollywood foreign film in China.
Secret Superstar, a medium budget movie released in October 2017, picked up where Dangal left off, grossing US$ 118 mn in China, 9.02 times its gross in the Indian market.
While the numbers above comprise a “hard” benefit, the “soft” benefits are equally, if not more, important for long-term growth:
• Symbolizes developing relationships between nations. Notably, Chinese president Xi Jinping shared with Indian Prime Minister Narendra Modi that he had viewed Dangal, and liked it.
Table #03: Aamir Khan Productions – Evolution of performance in China
Source: Media articles; Discussions with industry participants
3 Idiots PK Dangal Secret Superstar
Release date 25th Dec 2009 19th Dec 2014 23rd Dec 2016 19th Oct 2017
Movie budget Large Large Large Medium
Domestic gross INR 275 cr(US$ 42 mn)
INR 500 cr(US$ 77 mn)
INR 600 cr(US$ 92 mn)
INR 85 cr(US$ 13 mn)
China gross INR 14 cr(US$ 2.2 mn)
INR 110 cr(US$ 17 mn)
INR 1,300 cr(US$ 200 mn)
INR 765 cr(US$ 118 mn)
China:India gross 5% 22% 217% 902%
# screens in China 900-1,000 4,000-5000 10,000 11,000
Theme of movie Social pressures under an Asian education system, and following one’s passion
Having an open mind, and questioning things
Pressure to perform (sports), women empowerment in a patriarchal society
Women empowerment, and following a dream

27
Economic Contribution of the Film and Television Industry in India, 2017
• Creates buzz and interest around India.
• Helps to shape perception, and offers a platform to promote Indian products, services, and lifestyle.
Shamath Mazumdar, Head - Marketing & Content Development, Aamir Khan Productions
If given more support and impetus, the Indian film industry can become the archetype of 'Make in India'. It is not simply that our product is made by Indians; our movies also spread India’s culture and ethos, which has a very different, yet significant impact.
Social impactMovies can create social benefits, and these have an associated economic and cultural benefit. Dangal and Secret Superstar provide a perspective on the concepts of women empowerment and gender equality in a traditional and patriarchal society. Following the film’s release, several state governments announced the set-up of wrestling rings for women.
Similarly, Toilet: Ek Prem Katha provided impetus to India’s Swachh Bharat Abhiyan (Clean India) movement. Basic cleanliness and hygiene improvements can reduce health costs and improve productivity, translating into hard economic benefits.
Still from Dangal. Image credit: Aamir Khan Productions

28
Economic Contribution of the Film and Television Industry in India, 2017
Still from Secret Superstar. Image credit: Amir Khan Productions
29
Economic Contribution of the Film and Television Industry in India, 2017
A Deeper Look at the Sub-Sectors
30
Economic Contribution of the Film and Television Industry in India, 2017
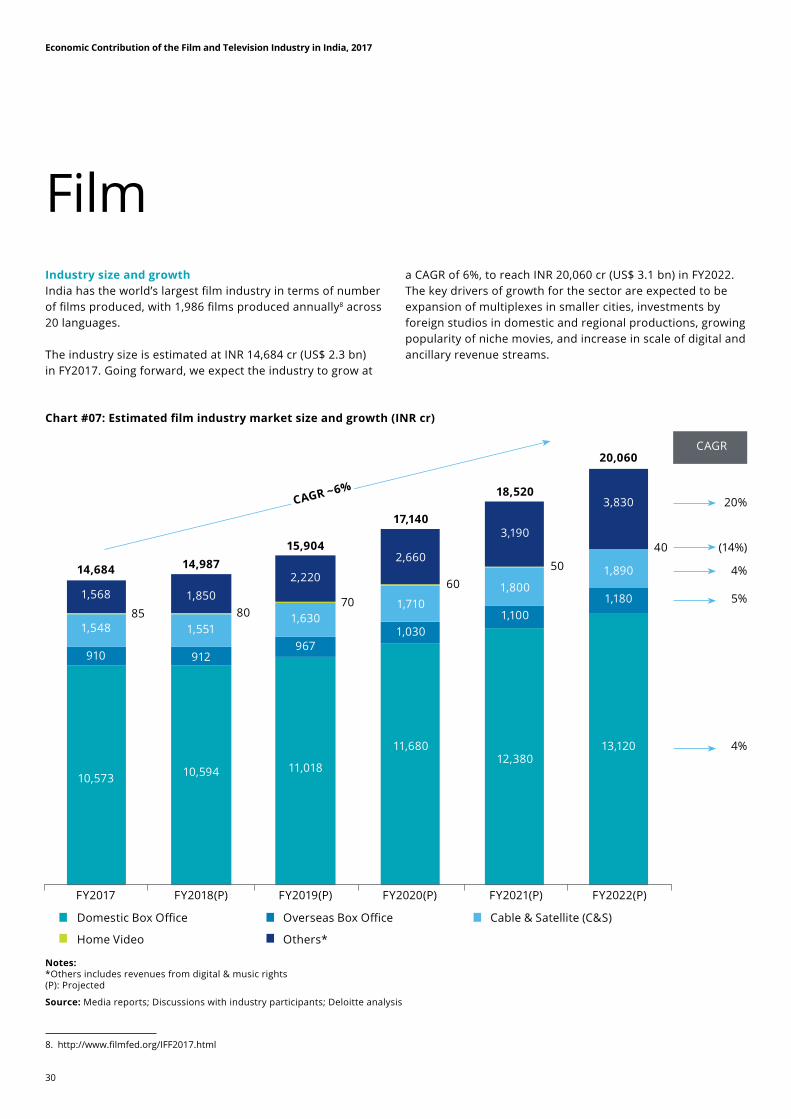
Industry size and growthIndia has the world’s largest film industry in terms of number of films produced, with 1,986 films produced annually8 across 20 languages.
The industry size is estimated at INR 14,684 cr (US$ 2.3 bn) in FY2017. Going forward, we expect the industry to grow at
a CAGR of 6%, to reach INR 20,060 cr (US$ 3.1 bn) in FY2022. The key drivers of growth for the sector are expected to be expansion of multiplexes in smaller cities, investments by foreign studios in domestic and regional productions, growing popularity of niche movies, and increase in scale of digital and ancillary revenue streams.
Film
Chart #07: Estimated film industry market size and growth (INR cr)
Notes:*Others includes revenues from digital & music rights(P): Projected
Source: Media reports; Discussions with industry participants; Deloitte analysis
8. http://www.filmfed.org/IFF2017.html
FY2017
Domestic Box Office Overseas Box Office Cable & Satellite (C&S)
13,120
1,180
1,890
3,830
20,060CAGR
40
12,380
1,100
1,800
3,190
18,520
50
11,680
1,030
1,710
2,660
17,140
60
11,018
967
1,630
2,220
15,904
70
10,594
912
1,551
1,850
14,987
80
10,573
910
1,548
1,568
14,684
85
Home Video Others*
FY2018(P) FY2019(P) FY2020(P) FY2021(P) FY2022(P)
20%
(14%)
4%
5%
4%
CAGR ~6%
31
Economic Contribution of the Film and Television Industry in India, 2017
Chart #08: Box office net revenue by language in FY2017 Table #04: Box office net revenue by language in FY2017
Source: Box office reports; Discussions with industry participants; Deloitte analysis
9. Article in Mint titled “Success of Baahubali 2 raises profile of Indian regional cinema over Bollywood” dated 26th May 2017
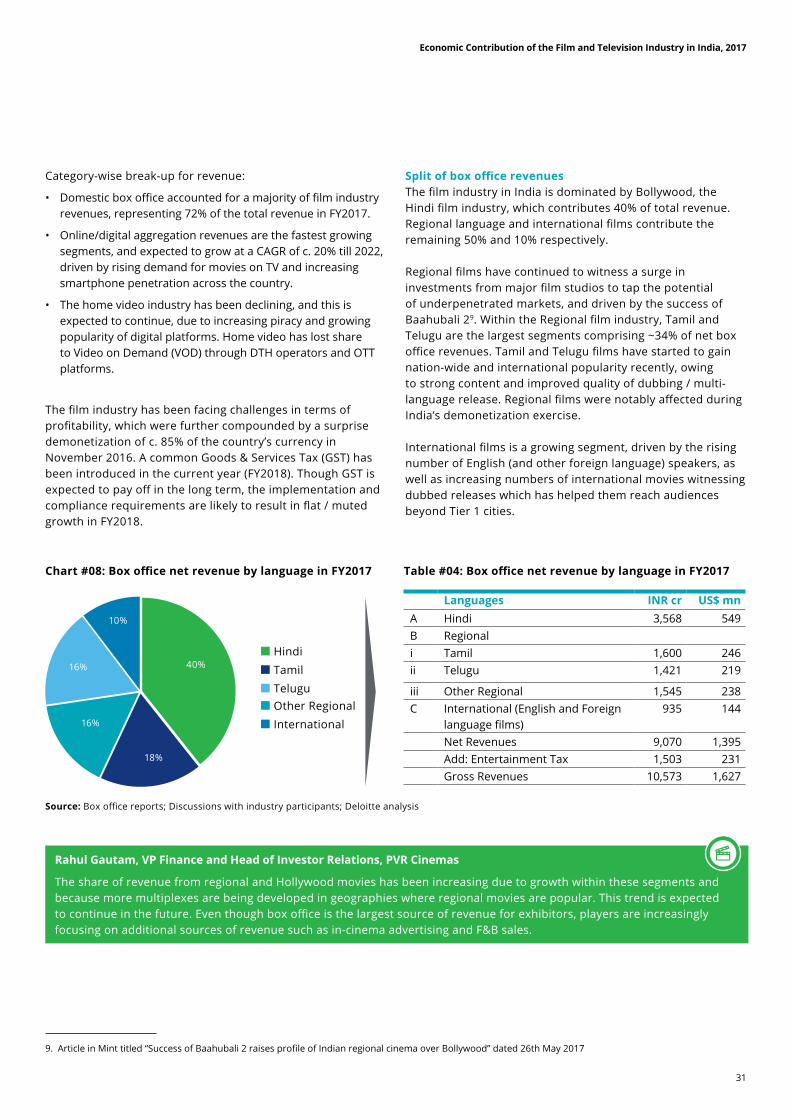
Category-wise break-up for revenue:
• Domestic box office accounted for a majority of film industry revenues, representing 72% of the total revenue in FY2017.
• Online/digital aggregation revenues are the fastest growing segments, and expected to grow at a CAGR of c. 20% till 2022, driven by rising demand for movies on TV and increasing smartphone penetration across the country.
• The home video industry has been declining, and this is expected to continue, due to increasing piracy and growing popularity of digital platforms. Home video has lost share to Video on Demand (VOD) through DTH operators and OTT platforms.
The film industry has been facing challenges in terms of profitability, which were further compounded by a surprise demonetization of c. 85% of the country’s currency in November 2016. A common Goods & Services Tax (GST) has been introduced in the current year (FY2018). Though GST is expected to pay off in the long term, the implementation and compliance requirements are likely to result in flat / muted growth in FY2018.
Split of box office revenuesThe film industry in India is dominated by Bollywood, the Hindi film industry, which contributes 40% of total revenue. Regional language and international films contribute the remaining 50% and 10% respectively.
Regional films have continued to witness a surge in investments from major film studios to tap the potential of underpenetrated markets, and driven by the success of Baahubali 29. Within the Regional film industry, Tamil and Telugu are the largest segments comprising ~34% of net box office revenues. Tamil and Telugu films have started to gain nation-wide and international popularity recently, owing to strong content and improved quality of dubbing / multi-language release. Regional films were notably affected during India’s demonetization exercise.
International films is a growing segment, driven by the rising number of English (and other foreign language) speakers, as well as increasing numbers of international movies witnessing dubbed releases which has helped them reach audiences beyond Tier 1 cities.
Rahul Gautam, VP Finance and Head of Investor Relations, PVR Cinemas
The share of revenue from regional and Hollywood movies has been increasing due to growth within these segments and because more multiplexes are being developed in geographies where regional movies are popular. This trend is expected to continue in the future. Even though box office is the largest source of revenue for exhibitors, players are increasingly focusing on additional sources of revenue such as in-cinema advertising and F&B sales.
18%
40%
10%
16%
16%
Languages INR cr US$ mnA Hindi 3,568 549B Regionali Tamil 1,600 246ii Telugu 1,421 219
iii Other Regional 1,545 238C International (English and Foreign
language films)935 144
Net Revenues 9,070 1,395Add: Entertainment Tax 1,503 231Gross Revenues 10,573 1,627
HindiTamilTeluguOther RegionalInternational

32
Economic Contribution of the Film and Television Industry in India, 2017
Bahubali poster. Image credit: Arka Media Works Pvt. Ltd.

33
Economic Contribution of the Film and Television Industry in India, 2017
Key shifts for the film industry in IndiaThe key trends in the film industry in India are discussed below.
1. Rise of “content focused” movies: Movies where the “script is the hero” continue to make their presence felt. There were several movies in FY2017, and into FY2018, where the story and the script were allowed to dominate, even when the cast had popular stars such as Amitabh Bachchan, Akshay Kumar etc. This trend is expected to continue in the future, leading to an increase in creative jobs in the industry.
2. Growing revenue from OTT players: Entry of players such as Amazon Prime Video has enabled film producers to gain an additional revenue stream. Since the C&S revenue has not declined significantly, there is a net additive impact.
3. International / foreign films gaining share: The box office net revenues from international movies has increased from 6% in 2013 to 10% in 2016. Increase in share of Hollywood movies can be attributed to dubbing of Hollywood movies in several Indian languages, increase in promotional spend, and rise of multiplexes. In 2016, Jungle Book became the top Hollywood release in India, grossing c. INR 250 cr – taking it to an elite “INR 200 cr club”.
4. Growing potential of regional films: While demonetization impacted the regional film industry, the industry exhibits an overall growth trend. It may be noted that average occupancy in regional films increased from 40% in 2016 to 45% in 2017. There are several reasons for the broader appeal of regional films. Firstly, the number of regional movies being produced have increased. Secondly, mega-plexes with 14-15 screens allow longer run for movies and provide a suitable platform for alternative content. Thirdly, strong path-breaking content is being seen in some regional films.
Economic impact of the film industryDirect impactThe table below provides a snapshot of the direct economic impact of the film industry.
Table #05: Direct economic impact of the film industry in FY2017 (INR cr)
Gross Output
EBITDA Wages Gross Value Added
Net Indirect Taxes
Total Value added
Employment in lacs
A B C D = B + C E F = D + E GProduction & Distribution
9,812 (3,285) 2,127 (1,158) 538 (620) 0.76
Exhibition 14,783 1,464 975 2,439 1,503 3,942 1.70
Home Video 97 2 11 13 - 13 0.00
Online aggregators 1,472 736 177 913 - 913 0.00
Digital distribution 630 190 108 298 - 298 0.01
Total 26,794 (894) 3,398 2,503 2,041 4,544 2.47
Source: Deloitte analysis
34
Economic Contribution of the Film and Television Industry in India, 2017
Table #06: Indirect and total economic impact of the film industry in FY2017
Source: Deloitte analysis
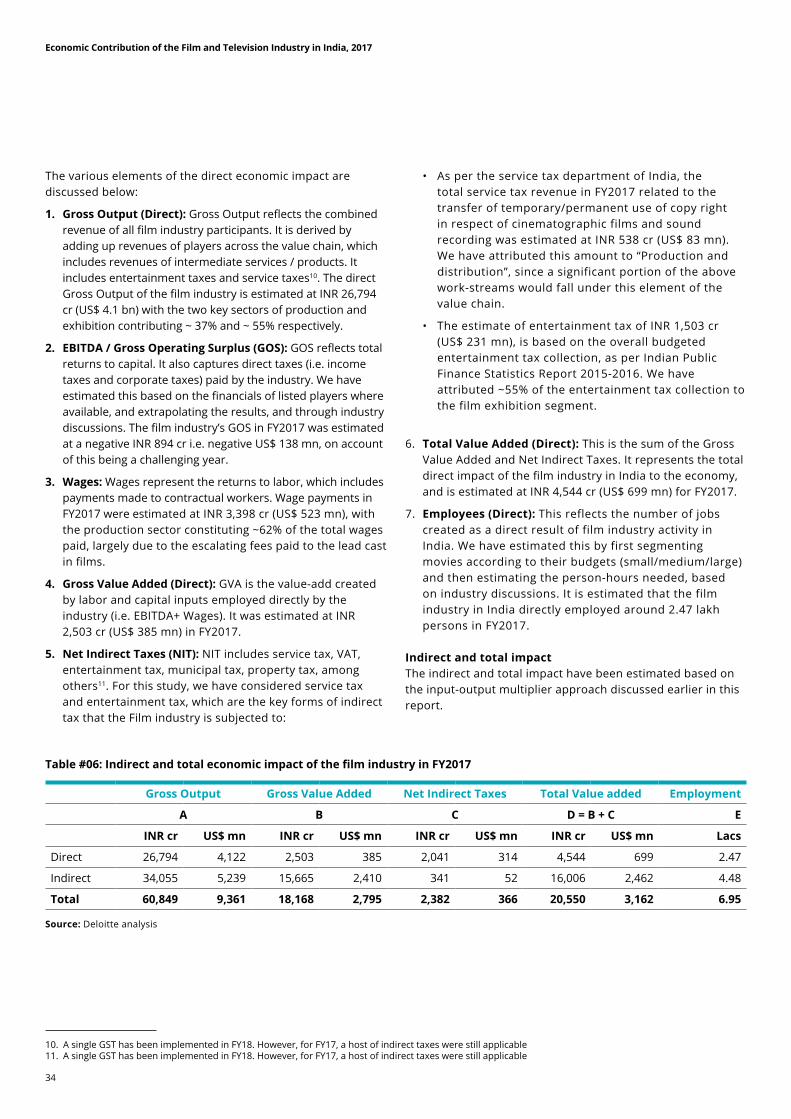
The various elements of the direct economic impact are discussed below:
1. Gross Output (Direct): Gross Output reflects the combined revenue of all film industry participants. It is derived by adding up revenues of players across the value chain, which includes revenues of intermediate services / products. It includes entertainment taxes and service taxes10. The direct Gross Output of the film industry is estimated at INR 26,794 cr (US$ 4.1 bn) with the two key sectors of production and exhibition contributing ~ 37% and ~ 55% respectively.
2. EBITDA / Gross Operating Surplus (GOS): GOS reflects total returns to capital. It also captures direct taxes (i.e. income taxes and corporate taxes) paid by the industry. We have estimated this based on the financials of listed players where available, and extrapolating the results, and through industry discussions. The film industry’s GOS in FY2017 was estimated at a negative INR 894 cr i.e. negative US$ 138 mn, on account of this being a challenging year.
3. Wages: Wages represent the returns to labor, which includes payments made to contractual workers. Wage payments in FY2017 were estimated at INR 3,398 cr (US$ 523 mn), with the production sector constituting ~62% of the total wages paid, largely due to the escalating fees paid to the lead cast in films.
4. Gross Value Added (Direct): GVA is the value-add created by labor and capital inputs employed directly by the industry (i.e. EBITDA+ Wages). It was estimated at INR 2,503 cr (US$ 385 mn) in FY2017.
5. Net Indirect Taxes (NIT): NIT includes service tax, VAT, entertainment tax, municipal tax, property tax, among others11. For this study, we have considered service tax and entertainment tax, which are the key forms of indirect tax that the Film industry is subjected to:
• As per the service tax department of India, the total service tax revenue in FY2017 related to the transfer of temporary/permanent use of copy right in respect of cinematographic films and sound recording was estimated at INR 538 cr (US$ 83 mn). We have attributed this amount to “Production and distribution”, since a significant portion of the above work-streams would fall under this element of the value chain.
• The estimate of entertainment tax of INR 1,503 cr (US$ 231 mn), is based on the overall budgeted entertainment tax collection, as per Indian Public Finance Statistics Report 2015-2016. We have attributed ~55% of the entertainment tax collection to the film exhibition segment.
6. Total Value Added (Direct): This is the sum of the Gross Value Added and Net Indirect Taxes. It represents the total direct impact of the film industry in India to the economy, and is estimated at INR 4,544 cr (US$ 699 mn) for FY2017.
7. Employees (Direct): This reflects the number of jobs created as a direct result of film industry activity in India. We have estimated this by first segmenting movies according to their budgets (small/medium/large) and then estimating the person-hours needed, based on industry discussions. It is estimated that the film industry in India directly employed around 2.47 lakh persons in FY2017.
Indirect and total impactThe indirect and total impact have been estimated based on the input-output multiplier approach discussed earlier in this report.
Gross Output Gross Value Added Net Indirect Taxes Total Value added Employment
A B C D = B + C E
INR cr US$ mn INR cr US$ mn INR cr US$ mn INR cr US$ mn Lacs
Direct 26,794 4,122 2,503 385 2,041 314 4,544 699 2.47
Indirect 34,055 5,239 15,665 2,410 341 52 16,006 2,462 4.48
Total 60,849 9,361 18,168 2,795 2,382 366 20,550 3,162 6.95
10. A single GST has been implemented in FY18. However, for FY17, a host of indirect taxes were still applicable11. A single GST has been implemented in FY18. However, for FY17, a host of indirect taxes were still applicable

35
Economic Contribution of the Film and Television Industry in India, 2017
Challenges faced by the film industry in IndiaDespite being the largest producer of movies in the world, the Indian film industry faces several challenges on operational as well as revenue fronts. Addressing these challenges can put the industry on a higher growth trajectory.
1. Censorship: Industry participants suggest that a more liberal censorship approach than the current one will allow the industry to create content to cater to the preferences of different sets of consumers, thereby growing the sector. The industry would benefit from a move towards a ratings / classification system.
2. Clearances / permissions: While single window clearances have been implemented well in some regions (notably Goa), the industry will greatly benefit if this is implemented in key cities where shoots often take place, in particular in Mumbai and Delhi.
3. GST and taxation: Industry participants indicated several challenges arising from GST.
a. Applying the highest tax slab (28%) for movie tickets priced over INR 100 acts as a demand dampener
b. Various elements in the cinema value chain fall under different GST slabs – 12%, 18%, and 28%. As a result, companies are losing value because they are not able to do a proper set-off.
c. The state of Tamil Nadu has levied Local Body Entertainment Tax (LBET) on top of GST. While the state initially planned to levy a 30% LBET on top of the 28% GST, this was later lowered to 10% for Tamil language
movies and 20% for non-Tamil movies. After significant objections were raised and multiplexes shut down in protest, the LBET for Tamil movies was lowered to 8%. While the GST framework allows for states to levy LBET, industry participants highlight that this amounts to double taxation, in an industry which is already heavily taxed.
Devang Sampat, Director – Strategic Initiatives, Cinepolis
Ours is a capex heavy industry, and investments are committed for a long duration. Hence uncertainties such as LBET have a strong impact and can throw business plan calculations awry.
d. Regional film industries which previously used to avail of tax subsidies or reductions, are now also liable to pay the full tax structure. A scheme to provide subsidies or tax relief, is yet to be incorporated under the GST era.
Ravi Kottarakara, Secretary, South Indian Film Chamber of Commerce
Post introduction of GST, footfall in theatres has decreased substantially due to the 28% increase in ticket prices. Addressing GST and other tax related challenges could help in putting back the film industry on the right track.
4. Piracy: Piracy continues to be a major challenge for the industry. Co-operation of the broader ecosystem like ISPs

36
Economic Contribution of the Film and Television Industry in India, 2017
and telcos to battle piracy will be important. Governments have started taking initial steps in the right direction, including the formation of Telangana Intellectual Property Crime Unit (TIPCU) and Maharashtra’s Digital Crime Unit (DCU) to deal with online piracy.
Siddharth Roy Kapur, Founder, Roy Kapur Films
Anti-piracy steps are being taken, but the laws could do with more teeth. The broader industry ecosystem like ISPs and Telcos also need to work together to curb piracy.
5. Skilling: The demand for content is rapidly set to rise, with OTT providing an additional platform, and smart devices driving up content consumption. It is critical to have the quantum of skilled workforce that can deliver this volume of content. New media platforms also demand a new set of skills – notably around analytics and cloud, which will require significant skilling / re-skilling. Lastly, to deliver on the Make in India promise, India will require a workforce with skill sets to position the country as an attractive option – on the lines of how the Information Technology sector created a value proposition for itself.
6. Screen density: India has a screen density of 6 per million. In comparison, the screen density in China is 30 per million. While large cities in India have adequate screen density, there are large swathes of cinema-dark areas in smaller towns. Industry participants suggest that improving the screen density can have a strong impact on industry revenue. Policy makers could create incentives for exhibitors to build infrastructure, such as the bringing back the five year tax holiday for multiplexes which was granted in the 2000's. Addressing the following key challenges will also help the screen density rise faster:
• Complex regulatory framework where an owner of a cinema theatre is required to approach different approving authorities in order to seek various licenses required. Further, the regulatory clearances for opening a new theatre take a period of at least 3-6 months
• The policies for providing licenses vary from state to state. For an industry with standard operating rules, having different set of rules per state is not justified except in the interest of public health, safety and security.
• The rate at which shopping malls are being constructed is not adequate enough (multiplexes are ideally located within shopping malls).
7. Copyright: While copyright rules were discussed and notified, the next logical step of copyright societies putting out tariffs for their content is still in process. Hence, there is a “suspense account” on the books of many industry participants. Moving forward in a time-bound manner to action this will help the industry.
It should also be borne in mind that a major chunk of financing of films in India, as is also the case globally, comes from the sale of broadcast rights. However, the tariff framework governing the pay TV ecosystem is still regulated by the Telecom Regulatory Authority of India (TRAI) through price ceilings and restrictions. This is not fully aligned with the Copyright Act and does not allow authors and copyright owners/producers (including broadcasters) to monetize and license their creations appropriately as per free market forces. It may be noted that the mechanism of Copyright Board ensures that in case negotiations between parties fail, then the said Board can intervene on behest of either parties to adjudicate upon terms of license and price.
8. Rising cost of production: Margins for producers in the industry (especially Bollywood) are declining as the large production costs have not been offset by a commensurate increase in box office revenue. Talent constitutes a major portion of the production costs due to limited supply of bankable actors and profit sharing contracts in favor of the actors. Even for movies without A-list actors, marketing and distribution costs are high. It may be noted that Disney has discontinued production of Hindi movies, while Balaji has suspended further production of new films.

37
Economic Contribution of the Film and Television Industry in India, 2017
Industry size and growthTelevision is the largest sub-sector within India’s broader M&E landscape.
The industry size is estimated at INR 59,274 cr (US$ 9,2 bn) in FY2017. Going forward, we expect the industry to grow at a CAGR of 15%, to reach INR 122,734 cr (US$ 18.9 bn) in FY2022. Subscription revenues are slated to grow marginally faster (CAGR 16%) than ad revenues (CAGR 15%) over FY2017-22.
The key growth drivers are digitization of cable, higher uptake of HD channels driving ARPU, and rising smart device penetration resulting in increased consumption through additional platforms (OTT).
Chart #9: Estimated television industry market size and growth (INR cr)
Notes: (P): Projected
Source: Media reports; Discussions with industry participants; Deloitte analysis
CAGR
140,000
80,000
120,000
60,000
20,000
FY2017 FY2018 (P)
FY2019 (P) FY2020 (P) FY2021 (P) FY2022 (P)
100,000
40,000
-
Subscription Advertisement
39,474
19,800
59,274
45,790
22,770
68,560
53,116
26,186
79,302
61,615
30,113
91,728
71,473
34,630
1,06,104
82,909 16%
39,825 15%
1,22,734
CAGR - 15%
Television
Nitin Nadkarni, CFO, Sony Pictures Networks India Pvt. Ltd.
The previous two years were generally good, with sports taking the limelight. Along the way, there were some shocks such as demonetization and GST implementation which had an adverse impact on advertisement revenues. However, we have weathered the storm and the industry has normalized, with ad-spend returning to earlier levels. Overall, there is a positive growth expectation for the television industry.

38
Economic Contribution of the Film and Television Industry in India, 2017
Details of subscription base and ad revenueIndia’s regulator TRAI pegged the active Pay TV households at 155 mn at the end of FY2017.
Driven by regulation, India has been on the path of digitizing its considerable analog cable subscriber base from c. 70 mn in FY2012, to 47 mn in FY2017. Digitization was mandated in four phases (four metros, cities with population > 1 mn, all urban areas, and rest of the country), with a different analog sunset date for each phase. This move was expected to raise transparency in the industry, raise ARPUs (ARPUs were suppressed in an analog cable world because very little subscription revenue was ploughed back into the value chain, enabling subscription revenue at the customers’ end to be subsidized), help plough back subscription revenue into the value chain and thereby also improve the quality of content by allowing more investment.
The original timeline envisaged an analog sunset across the country by 31st December 2014, which has been revised several times, acknowledging the challenges faced by industry stakeholders.
Post FY2017, the current year (i.e. FY2018) has witnessed an important movement in the digitization initiative with the state of Tamil Nadu taking the conversion drive upon its agenda12. The metro city of Chennai in Tamil Nadu, while part of the first phase of digitization, had not been digitized in a material manner due to political reasons. Overall, the current year (FY2018) may witness significant digitization of analog cable.
FreeDish, owned by India’s national broadcaster Doordarshan, has witnessed notable growth since the digitization mandate. Freedish carries free-to-air (FTA) channels, and is estimated to have a subscriber base of c. 20 mn subscribers13 in FY17. These subscribers have not been counted in the DTH base above, since they are not “Pay” TV.
On the advertising side of the television industry, Hindi language channels (GECs, movies, news and other niche genres) contributed c. 35% to the ad market in FY2017, followed by Tamil with a share of 11%. Industry discussions suggest that regional channels are expected to continue to grow at a faster pace than Hindi channels. The television ad-revenue between FY2016 and FY2017 grew by 14%14.
12. Article from the Deccan Chronicle titled “Arasu Cable goes digital” dated 2nd Sep 201713. Indiantelevision.com – DTH subscriber growth down in second quarter14. Forbes.com - Print and TV still dominate advertising in India, but digital is fast catching up
Chart #10: Active subscriber base by technology in FY2017 (mn)
Source: TRAI; Media reports
63
45
DTH Digital cable Analog cable
47
Chart #11: Estimated advertising revenue by language (FY2017)
Source: Pitch Madison; Media articles; Discussions with industry participants
Hindi
3%
4%
4%
4%5% 5%
11%
35%
28%
Kannada
Tamil
Marathi
English
Malayalam
Telugu
Others
Bengali

39
Economic Contribution of the Film and Television Industry in India, 2017
Key shifts for the television industry in IndiaThe key trends in the television industry in India are discussed below.
1. Realizing benefit of digitization of cable: As issues with digitization are sorted out, and aided by the regulator TRAI, the benefits of digitization are expected to be realized over the next 3-4 years. This is likely to have several positive effects, most notably the pool of subscription revenue which could become available for investment in programming / content. TRAI’s new tariff order, which specifies INR 130 to be charged for rental, puts limits on discounts that can be offered to television channel prices in bouquets, and also caps the price of a channel in a bouquet, is a new development that the industry is adjusting to.
As stated above, the digitalized cable TV network infrastructure can be used by the Government under its “Digital India” vision to provide broadband services to the farthest corners of the country. It will be beneficial to create an enabling policy framework to open the last mile and create sufficient incentives for cable network operators to upgrade their existing infrastructure.
One of the most effective ways of using this cable infra is to open the last mile to all service providers desirous of providing broadband services through them based upon market based compensation to the owners of such network Use of satellite communications (“SATCOM”) needs to be enhanced as well for broadband penetration including use of DTH and high throughput satellites by making available of Ka-band.
2. Changing content preferences: Consumer viewing preferences are fast changing; the following trends are noted:
• The advent of Free to Air (FTA) channels such as Sony WAH, compounded with FreeDish’s rising popularity.
• Sports as a segment gaining prominence, as significant domestic and international sporting events are now broadcasted live across Cable TV/ DTH & Online platforms.
• Uptake of HD channels by consumers to view content in high quality (this is also improving the ARPUs of distributors).
3. New Technology: In the same vein as the global trend, the lines between Technology-Media-Telecom are blurring in India, and companies are faced with non-traditional competitors.
• The online platform, Hotstar, which recently won the media and digital broadcasting rights for the Indian Premier League, intends to broadcast the IPL using Virtual Reality technology. This will further drive up data and video consumption15.
• Increasing broadband speed and affordability has given a boost to OTT offerings. Reliance Jio recently launched
15. Gadgets.ndtv.com – IPL 2018 to be Live Streamed in VR by Hotstar
Subhashish Mazumdar, Senior Vice President - Operations, IMCL (InCable)
Implementation of the new tariff order will level the playing field for distribution participants. There also exists significant collaboration opportunities among different verticals in the M&E industry to take it to greater heights.
Harit Nagpal, MD and CEO, Tata Sky
In India, traditional channels in live TV will continue to have relevance despite growth of OTT players. This is because of the much lower price point of C&S offered in India compared to Europe and the US. In order to monetize digital TV opportunities, the industry should create good quality content, especially for the high value urban customer (which the industry has forgotten, going after the mass market) and explore innovative offerings such as distributing new release movies on DTH/cable at a premium.
in India after investing c. US$ 25 bn in a 4G network, with a price per GB of c. 20 US cents - causing industry mobile data pricing to more than halve.
• Content producers & broadcasters are launching their own digital platforms to enter into a Direct To Customer (DTC) business.
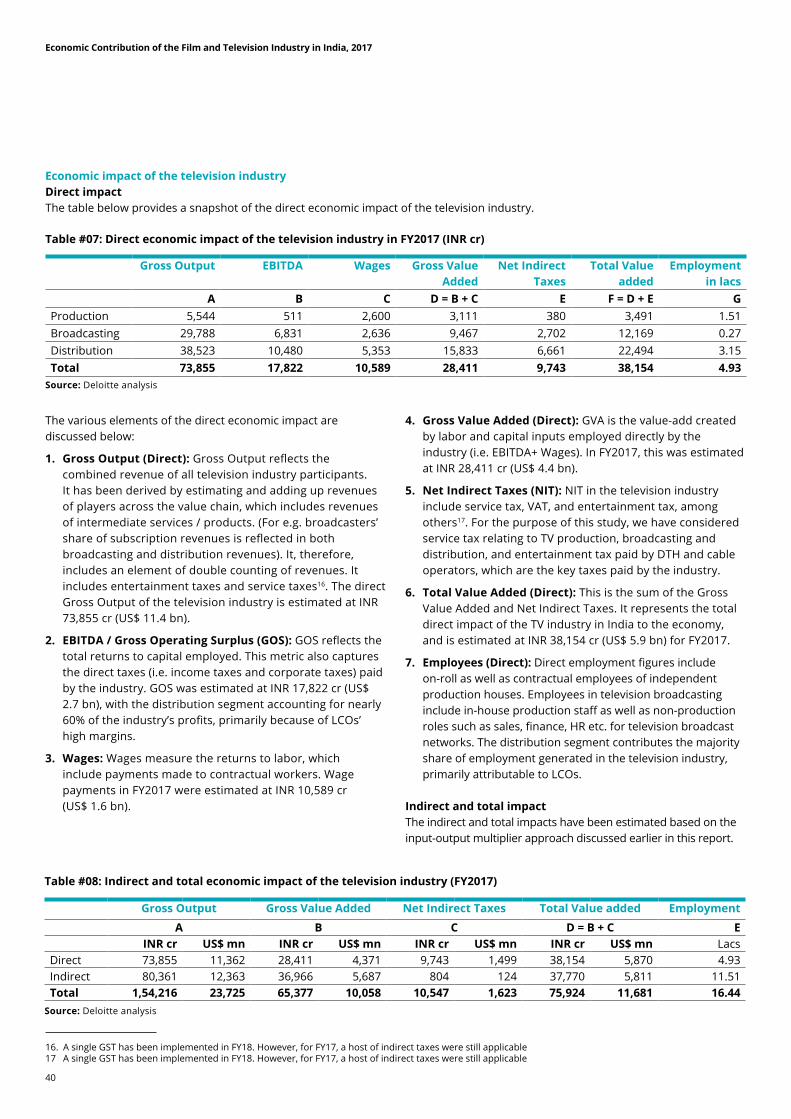
40
Economic Contribution of the Film and Television Industry in India, 2017
16. A single GST has been implemented in FY18. However, for FY17, a host of indirect taxes were still applicable17 A single GST has been implemented in FY18. However, for FY17, a host of indirect taxes were still applicable
Economic impact of the television industryDirect impactThe table below provides a snapshot of the direct economic impact of the television industry.
Table #07: Direct economic impact of the television industry in FY2017 (INR cr)
Gross Output EBITDA Wages Gross Value Added
Net Indirect Taxes
Total Value added
Employment in lacs
A B C D = B + C E F = D + E GProduction 5,544 511 2,600 3,111 380 3,491 1.51Broadcasting 29,788 6,831 2,636 9,467 2,702 12,169 0.27Distribution 38,523 10,480 5,353 15,833 6,661 22,494 3.15Total 73,855 17,822 10,589 28,411 9,743 38,154 4.93
Source: Deloitte analysis
The various elements of the direct economic impact are discussed below:
1. Gross Output (Direct): Gross Output reflects the combined revenue of all television industry participants. It has been derived by estimating and adding up revenues of players across the value chain, which includes revenues of intermediate services / products. (For e.g. broadcasters’ share of subscription revenues is reflected in both broadcasting and distribution revenues). It, therefore, includes an element of double counting of revenues. It includes entertainment taxes and service taxes16. The direct Gross Output of the television industry is estimated at INR 73,855 cr (US$ 11.4 bn).
2. EBITDA / Gross Operating Surplus (GOS): GOS reflects the total returns to capital employed. This metric also captures the direct taxes (i.e. income taxes and corporate taxes) paid by the industry. GOS was estimated at INR 17,822 cr (US$ 2.7 bn), with the distribution segment accounting for nearly 60% of the industry’s profits, primarily because of LCOs’ high margins.
3. Wages: Wages measure the returns to labor, which include payments made to contractual workers. Wage payments in FY2017 were estimated at INR 10,589 cr (US$ 1.6 bn).
4. Gross Value Added (Direct): GVA is the value-add created by labor and capital inputs employed directly by the industry (i.e. EBITDA+ Wages). In FY2017, this was estimated at INR 28,411 cr (US$ 4.4 bn).
5. Net Indirect Taxes (NIT): NIT in the television industry include service tax, VAT, and entertainment tax, among others17. For the purpose of this study, we have considered service tax relating to TV production, broadcasting and distribution, and entertainment tax paid by DTH and cable operators, which are the key taxes paid by the industry.
6. Total Value Added (Direct): This is the sum of the Gross Value Added and Net Indirect Taxes. It represents the total direct impact of the TV industry in India to the economy, and is estimated at INR 38,154 cr (US$ 5.9 bn) for FY2017.
7. Employees (Direct): Direct employment figures include on-roll as well as contractual employees of independent production houses. Employees in television broadcasting include in-house production staff as well as non-production roles such as sales, finance, HR etc. for television broadcast networks. The distribution segment contributes the majority share of employment generated in the television industry, primarily attributable to LCOs.
Indirect and total impactThe indirect and total impacts have been estimated based on the input-output multiplier approach discussed earlier in this report.
Table #08: Indirect and total economic impact of the television industry (FY2017)
Source: Deloitte analysis
Gross Output Gross Value Added Net Indirect Taxes Total Value added Employment
A B C D = B + C E INR cr US$ mn INR cr US$ mn INR cr US$ mn INR cr US$ mn LacsDirect 73,855 11,362 28,411 4,371 9,743 1,499 38,154 5,870 4.93Indirect 80,361 12,363 36,966 5,687 804 124 37,770 5,811 11.51Total 1,54,216 23,725 65,377 10,058 10,547 1,623 75,924 11,681 16.44
41
Economic Contribution of the Film and Television Industry in India, 2017
Challenges faced by the television industry in IndiaSome of the challenges faced by the Indian television industry, as gathered from industry interactions are listed below. Addressing these challenges could put the industry on a higher growth trajectory.
1. Incomplete digitization program: Media reports and industry discussions suggest that while STBs have been seeded in cable homes that have been converted to digital, analog signals are yet to be completely terminated and subscription revenue figures even in digital cable remain a point of contention between LCOs, MSOs and Broadcasters. This has resulted in the benefits of digitization (except carriage fee reduction to some extent) not fully reaching the value chain.
2. Copyright: The Copyright Act is a complete code governing the rights of content owners/producers/rights holders to monetize and license their product including broadcasts. This is in line with international WIPO administered treaties such as Berne and the Rome Conventions. Within the Copyright Act, there are multiple rights guaranteed to broadcasting organizations including the Broadcast Reproduction Right enshrined in Section 37. This right allows broadcasters to price and license their linear TV channels based upon negotiations with all prospective licensees, including distribution platforms such as cable and DTH. After the 2012 amendment to the Copyright Act, broadcasters can form copyright societies and publish tariff schemes to further streamline the process of licensing and in case there is any dispute between broadcaster(s) and distribution platform(s), then Copyright Board has been entrusted with the power to adjudicate upon the fair and reasonable terms of license and pricing.
However, as per industry discussions, there are multiple regulations on the TV industry which are not completely in sync with one another. For example: TRAI has issued Tariff Orders and Interconnection Regulations that have limited the rights of broadcasters to license and monetize their channels through price ceilings and restrictions on manner of offering.
Industry participants suggest that India can better realize its creative dividend by having a single copyright framework in consonance with the objectives of the National IPR Policy 2016.
3. Regulatory uncertainties: Industry discussions suggest that two key regulatory uncertainties exist:
a. FreeDish, the state carrier, auctions available DTH slots to private broadcasters through an e-Auction process.
As of October 2017, the Ministry of Information and Broadcasting suspended auction of available slots to review the process. Several broadcasters have created FTA channels that are carried on FreeDish with a view to target rural customers. They had been paying increasing sums of money (as per the last auction – an average of INR 8 cr. per slot) to get a FreeDish slot. However, the current uncertainty is a challenge, and also a loss of ad revenue for the industry18.
b. While a policy level change is yet to be implemented, recent developments indicate that the Ministry of Information and Broadcasting is increasingly denying applications for broadcasting licenses on the grounds that domestic satellites are not utilized for uplinking. At present, broadcasters use a mix of foreign and domestic satellites for uplink of their channels. Interestingly, recent TRAI recommendations for providing voice services on airplanes also included provisions for using domestic and foreign satellites in contrast to the broadcasting licensing process19.
c. In the recent TRAI Consultation Paper on “Up-linking and Downlinking of TV channels”, suggestions have been made to introduce telecom style revenue sharing license fee mechanisms based on “Adjusted Gross Revenue” (AGR) in broadcasting as well. In addition, there are suggestions to auction up-linking permissions in a standalone manner or in a combined manner with attached satellite spectrum. Industry discussions suggest that this would create a unique issue for both the broadcasters and satellite service providers as any attempt at auctioning either the satellite spectrum or the up-link permissions results in significant increase in CAPEX for them. With respect to auctioning of satellite spectrum, such spectrum is shared and is not considered scarce, therefore as per industry stakeholders, auctioning may not be the most appropriate manner of assignment. If auctioning method is adopted, then several international coordination issues would arise. Globally, there is an emerging thought that ideally, all fees should be commensurate to the administration costs to the Government/Regulatory Authority and should not necessarily be used as a lever to increase revenue receipts. Therefore, introduction of telecom sector related constructs such as revenue sharing based on AGR in broadcasting may cause fall in prospective investments and affect small regional broadcasters. Therefore, any policy elements from the telecom sector should be adopted in broadcasting after taking into consideration the overall size, market composition and financial health of the latter.
18. Livemint.com - I&B ministry suspends auction of slots on DD Free Dish, to review process19. Indiantelevision.com – MIB, DoS nudge TV channel to use Indian satellites
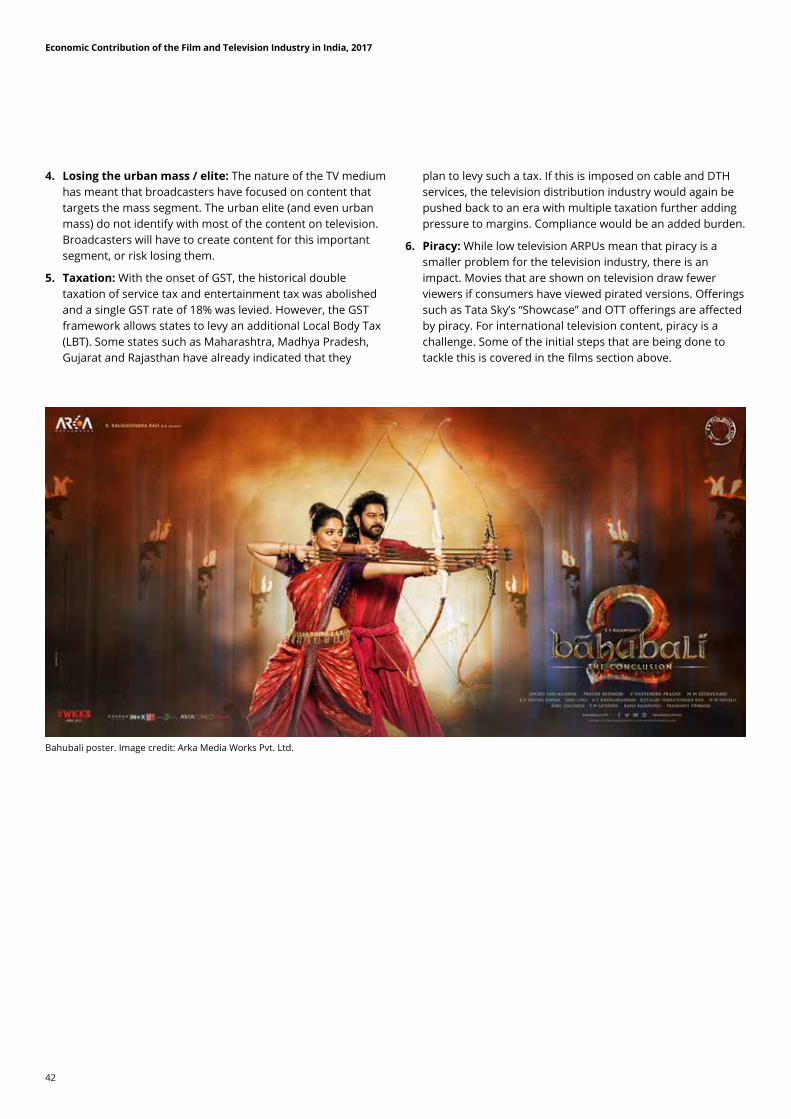
42
Economic Contribution of the Film and Television Industry in India, 2017
4. Losing the urban mass / elite: The nature of the TV medium has meant that broadcasters have focused on content that targets the mass segment. The urban elite (and even urban mass) do not identify with most of the content on television. Broadcasters will have to create content for this important segment, or risk losing them.
5. Taxation: With the onset of GST, the historical double taxation of service tax and entertainment tax was abolished and a single GST rate of 18% was levied. However, the GST framework allows states to levy an additional Local Body Tax (LBT). Some states such as Maharashtra, Madhya Pradesh, Gujarat and Rajasthan have already indicated that they
plan to levy such a tax. If this is imposed on cable and DTH services, the television distribution industry would again be pushed back to an era with multiple taxation further adding pressure to margins. Compliance would be an added burden.
6. Piracy: While low television ARPUs mean that piracy is a smaller problem for the television industry, there is an impact. Movies that are shown on television draw fewer viewers if consumers have viewed pirated versions. Offerings such as Tata Sky’s “Showcase” and OTT offerings are affected by piracy. For international television content, piracy is a challenge. Some of the initial steps that are being done to tackle this is covered in the films section above.
Bahubali poster. Image credit: Arka Media Works Pvt. Ltd.
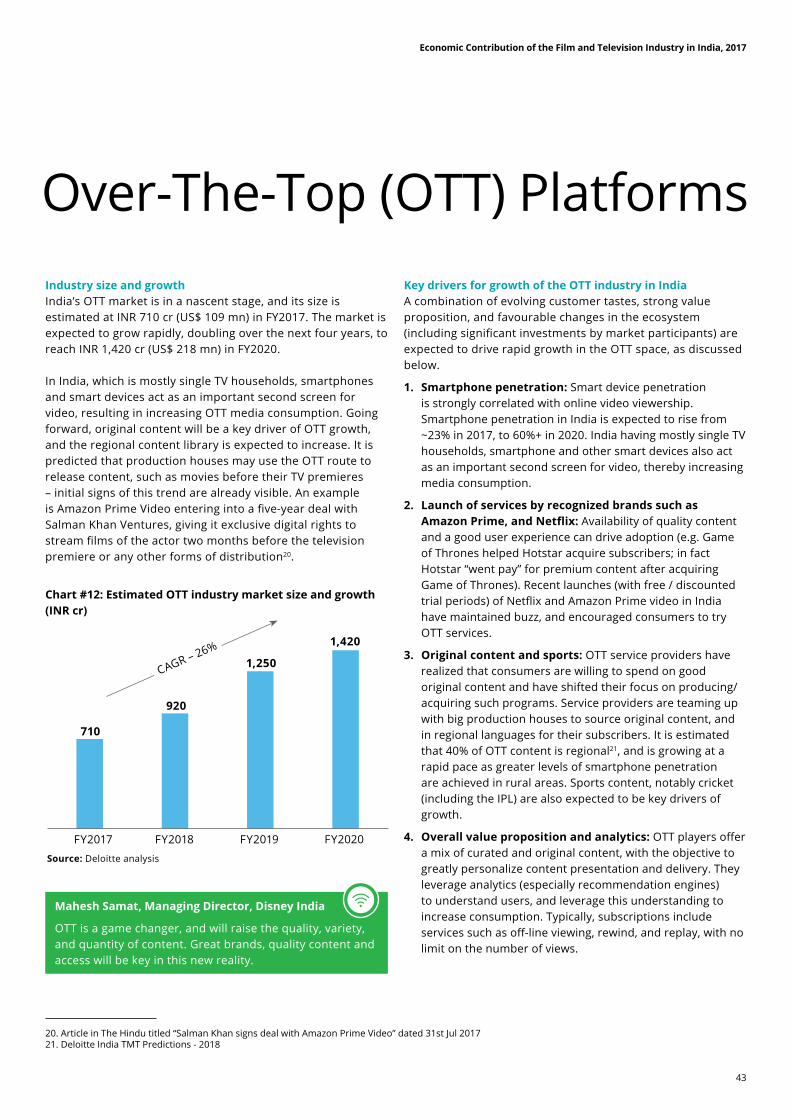
43
Economic Contribution of the Film and Television Industry in India, 2017
Industry size and growthIndia’s OTT market is in a nascent stage, and its size is estimated at INR 710 cr (US$ 109 mn) in FY2017. The market is expected to grow rapidly, doubling over the next four years, to reach INR 1,420 cr (US$ 218 mn) in FY2020.
In India, which is mostly single TV households, smartphones and smart devices act as an important second screen for video, resulting in increasing OTT media consumption. Going forward, original content will be a key driver of OTT growth, and the regional content library is expected to increase. It is predicted that production houses may use the OTT route to release content, such as movies before their TV premieres – initial signs of this trend are already visible. An example is Amazon Prime Video entering into a five-year deal with Salman Khan Ventures, giving it exclusive digital rights to stream films of the actor two months before the television premiere or any other forms of distribution20.
Chart #12: Estimated OTT industry market size and growth (INR cr)
Source: Deloitte analysis
FY2017 FY2018 FY2019 FY2020
1,420
1,250
920
710
CAGR – 26%
Mahesh Samat, Managing Director, Disney India
OTT is a game changer, and will raise the quality, variety, and quantity of content. Great brands, quality content and access will be key in this new reality.
Key drivers for growth of the OTT industry in IndiaA combination of evolving customer tastes, strong value proposition, and favourable changes in the ecosystem (including significant investments by market participants) are expected to drive rapid growth in the OTT space, as discussed below.
1. Smartphone penetration: Smart device penetration is strongly correlated with online video viewership. Smartphone penetration in India is expected to rise from ~23% in 2017, to 60%+ in 2020. India having mostly single TV households, smartphone and other smart devices also act as an important second screen for video, thereby increasing media consumption.
2. Launch of services by recognized brands such as Amazon Prime, and Netflix: Availability of quality content and a good user experience can drive adoption (e.g. Game of Thrones helped Hotstar acquire subscribers; in fact Hotstar “went pay” for premium content after acquiring Game of Thrones). Recent launches (with free / discounted trial periods) of Netflix and Amazon Prime video in India have maintained buzz, and encouraged consumers to try OTT services.
3. Original content and sports: OTT service providers have realized that consumers are willing to spend on good original content and have shifted their focus on producing/ acquiring such programs. Service providers are teaming up with big production houses to source original content, and in regional languages for their subscribers. It is estimated that 40% of OTT content is regional21, and is growing at a rapid pace as greater levels of smartphone penetration are achieved in rural areas. Sports content, notably cricket (including the IPL) are also expected to be key drivers of growth.
4. Overall value proposition and analytics: OTT players offer a mix of curated and original content, with the objective to greatly personalize content presentation and delivery. They leverage analytics (especially recommendation engines) to understand users, and leverage this understanding to increase consumption. Typically, subscriptions include services such as off-line viewing, rewind, and replay, with no limit on the number of views.
20. Article in The Hindu titled “Salman Khan signs deal with Amazon Prime Video” dated 31st Jul 201721. Deloitte India TMT Predictions - 2018
Over-The-Top (OTT) Platforms

44
Economic Contribution of the Film and Television Industry in India, 2017
22. Deloitte India TMT Predictions - 201823. Deloitte Analysis
5. Better broadband infrastructure and increasing data consumption: High speed internet at affordable tariff rates, and low-cost smartphones are the two key contributors to the growth of internet users in India. India has nearly 432 million internet users and this number is estimated to grow between 4-8%22. With the government’s demonetization drive in 2016, rural population is driven to take up digitization seriously. This, coupled with access to the internet, has led to a surge in rural customers shifting to consuming digital content.
6. Increasing disposable income and shift in customer preference23: India’s rising affluence is likely to be the biggest driver of increasing consumption in the country. This has also resulted in nominal y-o-y expenditure growth of 12% (more than double the global rate of 5%). Consumers are now willing to pay for premium content and improved user experience.
7. Snackable content: The average length of time spent on video viewing in India is less than 20 minutes. Short and entertaining story-telling form a driver for the growth of digital content in India.
Girish Dwibhashyam, Head of Content, Spuul
Currently, there are several OTT players in the market operating under different business models. In order to be sustainable, OTT players will have to find their own niche and offer differentiated content. As the importance of content grows even further, it will lead to an increase in the number of content creation jobs in the industry.
Indicators of growth expectations: Mobile data and video consumptionMobile data traffic in India is expected to grow at a CAGR of 40%, to reach 5.5 exabytes per month in 2021. Video will contribute 75% of this data traffic in 2021 (up from 53% in 2017). We note that most of the video consumption is related to entertainment, primarily from the film and television sector.
The entry of 4G operator Reliance Jio in September 2016 with attractively priced data offerings (initially free) has resulted in a major shift in data consumption habits of users by providing them high speeds at affordable prices. This has also resulted in other players providing competitive speed and prices to their customers.
Chart #13: Mobile data traffic in India Chart #14: Contribution of video to mobile data consumption
Source: CISCO VNI; TRAI; Ericsson Mobility; Deloitte analysis
2021
5.5
2020
3.6
2019
2.3
2018
1.5
2017
1.0
2016
0.1
CAGR – 40%
2017 2021
75%
53%
Ajit Mohan, CEO, Hotstar
The growth of streaming services in the last 3 years indicates that India has a huge appetite for high quality stories. Online video no longer is about user generated content or short form clips. Consumers will gravitate towards services that offer great content and new experiences shaped by technology.
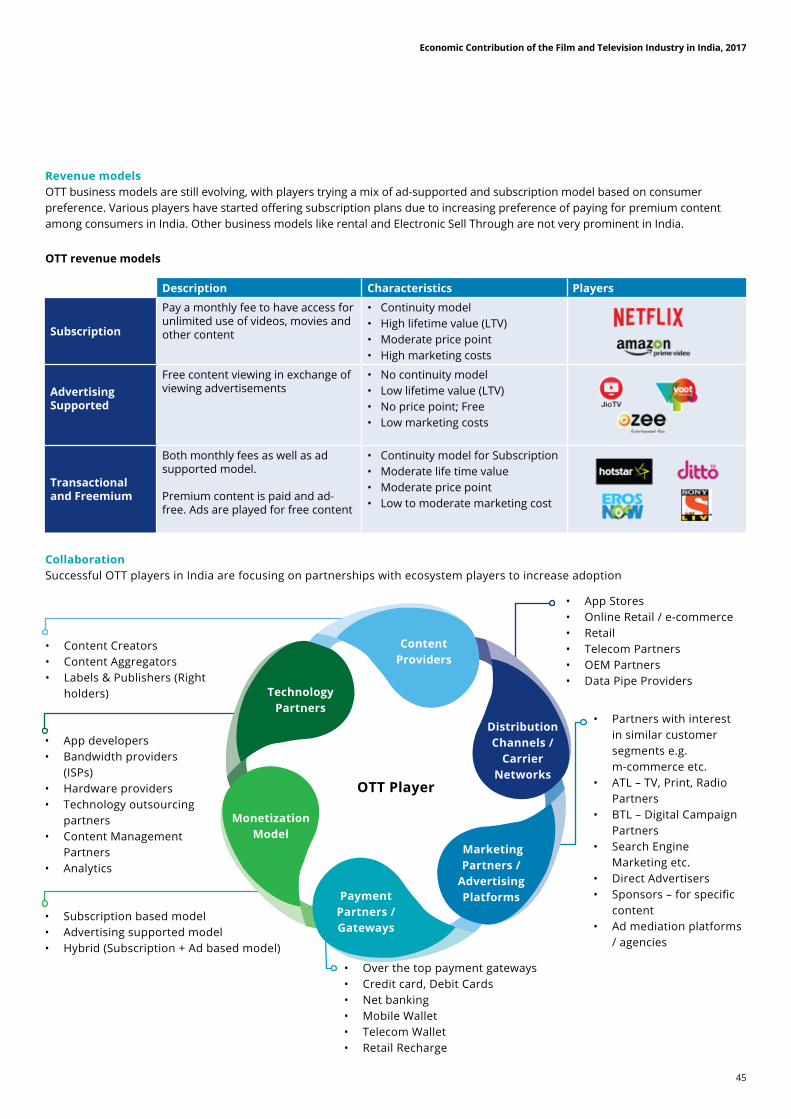
45
Economic Contribution of the Film and Television Industry in India, 2017
Revenue modelsOTT business models are still evolving, with players trying a mix of ad-supported and subscription model based on consumer preference. Various players have started offering subscription plans due to increasing preference of paying for premium content among consumers in India. Other business models like rental and Electronic Sell Through are not very prominent in India.
OTT revenue models
CollaborationSuccessful OTT players in India are focusing on partnerships with ecosystem players to increase adoption
• Content Creators• Content Aggregators• Labels & Publishers (Right
holders)
• App Stores• Online Retail / e-commerce• Retail• Telecom Partners• OEM Partners• Data Pipe Providers
• Over the top payment gateways• Credit card, Debit Cards• Net banking• Mobile Wallet• Telecom Wallet• Retail Recharge
• Subscription based model• Advertising supported model• Hybrid (Subscription + Ad based model)
• App developers• Bandwidth providers
(ISPs)• Hardware providers• Technology outsourcing
partners• Content Management
Partners• Analytics
• Partners with interest in similar customer segments e.g. m-commerce etc.
• ATL – TV, Print, Radio Partners
• BTL – Digital Campaign Partners
• Search Engine Marketing etc.
• Direct Advertisers• Sponsors – for specific
content• Ad mediation platforms
/ agencies
OTT Player
Description Characteristics Players
Subscription
Pay a monthly fee to have access for unlimited use of videos, movies and other content
• Continuity model• High lifetime value (LTV)• Moderate price point• High marketing costs
Advertising Supported
Free content viewing in exchange of viewing advertisements
• No continuity model• Low lifetime value (LTV)• No price point; Free• Low marketing costs
Transactional and Freemium
Both monthly fees as well as ad supported model.
Premium content is paid and ad-free. Ads are played for free content
• Continuity model for Subscription• Moderate life time value• Moderate price point• Low to moderate marketing cost
Content Providers
Distribution Channels /
Carrier Networks
Marketing Partners /
Advertising PlatformsPayment
Partners / Gateways
Monetization Model
Technology Partners
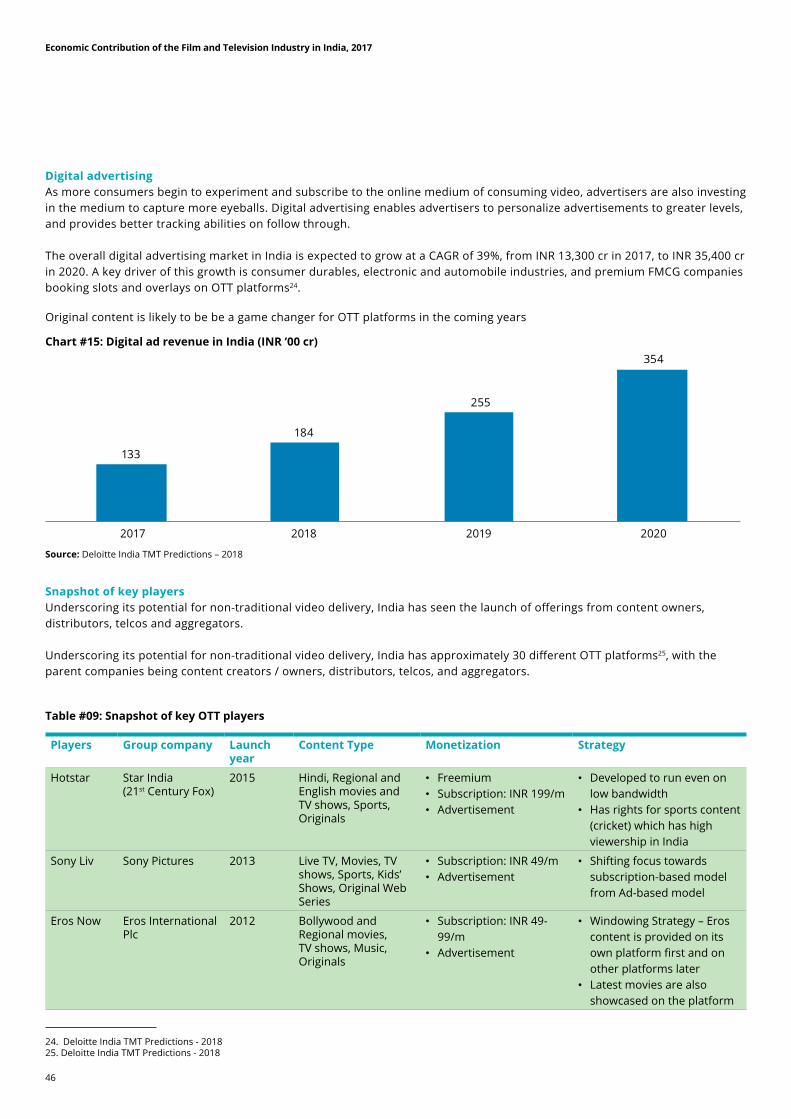
46
Economic Contribution of the Film and Television Industry in India, 2017
Digital advertisingAs more consumers begin to experiment and subscribe to the online medium of consuming video, advertisers are also investing in the medium to capture more eyeballs. Digital advertising enables advertisers to personalize advertisements to greater levels, and provides better tracking abilities on follow through.
The overall digital advertising market in India is expected to grow at a CAGR of 39%, from INR 13,300 cr in 2017, to INR 35,400 cr in 2020. A key driver of this growth is consumer durables, electronic and automobile industries, and premium FMCG companies booking slots and overlays on OTT platforms24.
Original content is likely to be be a game changer for OTT platforms in the coming years
Chart #15: Digital ad revenue in India (INR ’00 cr)
Source: Deloitte India TMT Predictions – 2018
2020
354
255
184
133
201920182017
Snapshot of key playersUnderscoring its potential for non-traditional video delivery, India has seen the launch of offerings from content owners, distributors, telcos and aggregators.
Underscoring its potential for non-traditional video delivery, India has approximately 30 different OTT platforms25, with the parent companies being content creators / owners, distributors, telcos, and aggregators.
24. Deloitte India TMT Predictions - 201825. Deloitte India TMT Predictions - 2018
Table #09: Snapshot of key OTT players
Players Group company Launch year
Content Type Monetization Strategy
Hotstar Star India (21st Century Fox)
2015 Hindi, Regional and English movies and TV shows, Sports, Originals
• Freemium• Subscription: INR 199/m• Advertisement
• Developed to run even on low bandwidth
• Has rights for sports content (cricket) which has high viewership in India
Sony Liv Sony Pictures 2013 Live TV, Movies, TV shows, Sports, Kids’ Shows, Original Web Series
• Subscription: INR 49/m• Advertisement
• Shifting focus towards subscription-based model from Ad-based model
Eros Now Eros International Plc
2012 Bollywood and Regional movies, TV shows, Music, Originals
• Subscription: INR 49-99/m
• Advertisement
• Windowing Strategy – Eros content is provided on its own platform first and on other platforms later
• Latest movies are also showcased on the platform
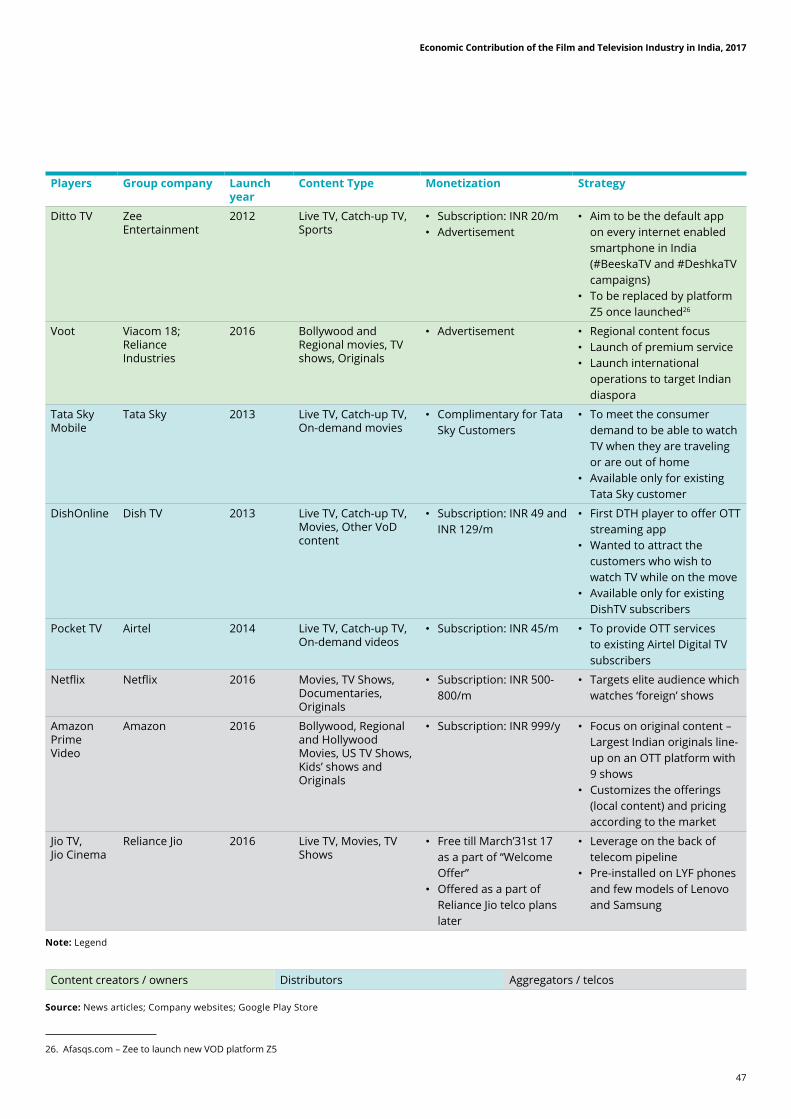
47
Economic Contribution of the Film and Television Industry in India, 2017
Players Group company Launch year
Content Type Monetization Strategy
Ditto TV Zee Entertainment
2012 Live TV, Catch-up TV, Sports
• Subscription: INR 20/m• Advertisement
• Aim to be the default app on every internet enabled smartphone in India (#BeeskaTV and #DeshkaTV campaigns)
• To be replaced by platform Z5 once launched26
Voot Viacom 18; Reliance Industries
2016 Bollywood and Regional movies, TV shows, Originals
• Advertisement • Regional content focus• Launch of premium service• Launch international
operations to target Indian diaspora
Tata Sky Mobile
Tata Sky 2013 Live TV, Catch-up TV, On-demand movies
• Complimentary for Tata Sky Customers
• To meet the consumer demand to be able to watch TV when they are traveling or are out of home
• Available only for existing Tata Sky customer
DishOnline Dish TV 2013 Live TV, Catch-up TV, Movies, Other VoD content
• Subscription: INR 49 and INR 129/m
• First DTH player to offer OTT streaming app
• Wanted to attract the customers who wish to watch TV while on the move
• Available only for existing DishTV subscribers
Pocket TV Airtel 2014 Live TV, Catch-up TV, On-demand videos
• Subscription: INR 45/m • To provide OTT services to existing Airtel Digital TV subscribers
Netflix Netflix 2016 Movies, TV Shows, Documentaries, Originals
• Subscription: INR 500-800/m
• Targets elite audience which watches ‘foreign’ shows
Amazon Prime Video
Amazon 2016 Bollywood, Regional and Hollywood Movies, US TV Shows, Kids’ shows and Originals
• Subscription: INR 999/y • Focus on original content – Largest Indian originals line-up on an OTT platform with 9 shows
• Customizes the offerings (local content) and pricing according to the market
Jio TV, Jio Cinema
Reliance Jio 2016 Live TV, Movies, TV Shows
• Free till March’31st 17 as a part of “Welcome Offer”
• Offered as a part of Reliance Jio telco plans later
• Leverage on the back of telecom pipeline
• Pre-installed on LYF phones and few models of Lenovo and Samsung
26. Afasqs.com – Zee to launch new VOD platform Z5
Note: Legend
Source: News articles; Company websites; Google Play Store
Content creators / owners Distributors Aggregators / telcos
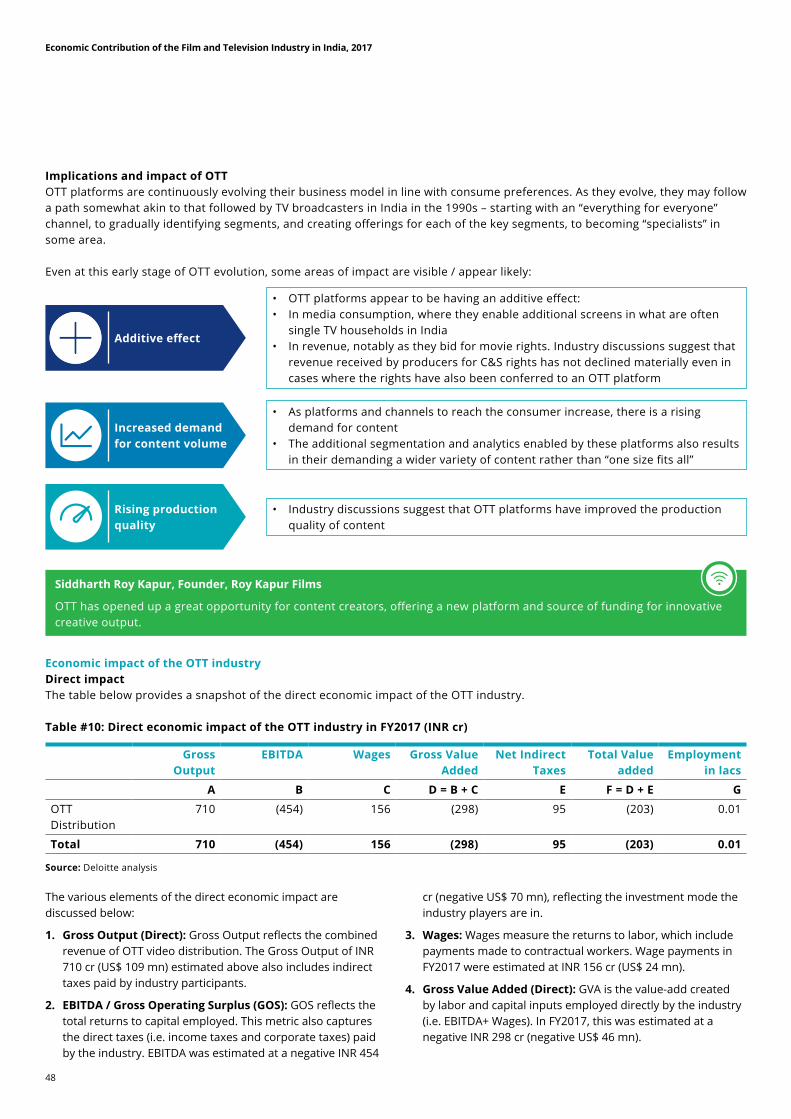
48
Economic Contribution of the Film and Television Industry in India, 2017
Implications and impact of OTTOTT platforms are continuously evolving their business model in line with consume preferences. As they evolve, they may follow a path somewhat akin to that followed by TV broadcasters in India in the 1990s – starting with an “everything for everyone” channel, to gradually identifying segments, and creating offerings for each of the key segments, to becoming “specialists” in some area.
Even at this early stage of OTT evolution, some areas of impact are visible / appear likely:
• As platforms and channels to reach the consumer increase, there is a rising demand for content
• The additional segmentation and analytics enabled by these platforms also results in their demanding a wider variety of content rather than “one size fits all”
Increased demand for content volume
• OTT platforms appear to be having an additive effect:• In media consumption, where they enable additional screens in what are often
single TV households in India• In revenue, notably as they bid for movie rights. Industry discussions suggest that
revenue received by producers for C&S rights has not declined materially even in cases where the rights have also been conferred to an OTT platform
Additive effect
• Industry discussions suggest that OTT platforms have improved the production quality of content
Rising production quality
Siddharth Roy Kapur, Founder, Roy Kapur Films
OTT has opened up a great opportunity for content creators, offering a new platform and source of funding for innovative creative output.
Economic impact of the OTT industryDirect impactThe table below provides a snapshot of the direct economic impact of the OTT industry.
Table #10: Direct economic impact of the OTT industry in FY2017 (INR cr)
Gross Output
EBITDA Wages Gross Value Added
Net Indirect Taxes
Total Value added
Employment in lacs
A B C D = B + C E F = D + E G
OTT Distribution
710 (454) 156 (298) 95 (203) 0.01
Total 710 (454) 156 (298) 95 (203) 0.01
Source: Deloitte analysis
The various elements of the direct economic impact are discussed below:
1. Gross Output (Direct): Gross Output reflects the combined revenue of OTT video distribution. The Gross Output of INR 710 cr (US$ 109 mn) estimated above also includes indirect taxes paid by industry participants.
2. EBITDA / Gross Operating Surplus (GOS): GOS reflects the total returns to capital employed. This metric also captures the direct taxes (i.e. income taxes and corporate taxes) paid by the industry. EBITDA was estimated at a negative INR 454
cr (negative US$ 70 mn), reflecting the investment mode the industry players are in.
3. Wages: Wages measure the returns to labor, which include payments made to contractual workers. Wage payments in FY2017 were estimated at INR 156 cr (US$ 24 mn).
4. Gross Value Added (Direct): GVA is the value-add created by labor and capital inputs employed directly by the industry (i.e. EBITDA+ Wages). In FY2017, this was estimated at a negative INR 298 cr (negative US$ 46 mn).
49
Economic Contribution of the Film and Television Industry in India, 2017
5. Net Indirect Taxes (NIT):27 NIT in the OTT industry includes indirect tax, among others. For the purpose of this study, we have considered service tax as the key taxes paid by the industry.
6. Total Value Added (Direct): This is the sum of the Gross Value Added and Net Indirect Taxes. It represents the total direct impact of the OTT industry in India to the economy, and is estimated at a negative INR 203 cr (negative US$ 31 mn) for FY2017.
7. Employees (Direct): Direct employment figures include on-roll as well as contractual employees of OTT distribution platforms. Employees in OTT include in-house production staff as well as non-production roles such as Sales, Finance, HR etc. OTT players are estimated to employ c. 1,000 persons in FY2017.
Indirect and total impactThe indirect and total impacts have been estimated based on the input-output multiplier approach discussed earlier in this report.
Table #11: Indirect and total economic impact of the OTT industry in FY2017
Gross Output Gross Value Added Net Indirect Taxes Total Value added Employment
A B C D = B + C E
INR cr. US$ mn INR cr. US$ mn INR cr. US$ mn INR cr. US$ mn Lacs
Direct 710 109 (298) (46) 95 15 (203) (31) 0.01
Indirect 902 139 415 64 9 1 524 81 0.18
Total 1,612 248 117 18 104 16 321 49 0.19
Source: Deloitte analysis
Challenges faced by the OTT industry in IndiaWhile the OTT industry is set for rapid growth, the industry is facing some challenges. Some of these are expected to get addressed (notably internet penetration and broadband speed) as directionally the movement towards resolution is already in process.
1. Poor internet penetration and broadband speed: While there is significant pace in improvement of internet penetration and broadband speeds, the overall paying customer base required by OTT players requires a substantial boost in order to achieve economies of scale
2. Changing consumer preferences: With over 30 players in the Indian OTT space, customers are spoilt for choice as consumers move towards content loyalty than brand loyalty, stickiness of customers to a single platform proves a challenge.
3. Regulatory uncertainty: The framework or conditions under which OTT players are brought under regulations, if at all, are yet to be identified and this may change the way business is conducted. India will benefit from a comprehensive Digital Information, Communication and Entertainment (Digital ICE) policy which could be administered under the auspices of a Government agency that understands the digital sphere, such as the Ministry of Electronics and Information Technology (MEITY) in active consultation with the industry. It would be beneficial to develop a new framework, specifically for OTT platforms. This would avoid the seepage of legacy economic and content regulations into the emerging sphere of digital applications.
27. GST has been implemented in FY18. However, for FY17, multiple taxation was still applicable

50
Economic Contribution of the Film and Television Industry in India, 2017

51
Economic Contribution of the Film and Television Industry in India, 2017
Related Sectors

52
Economic Contribution of the Film and Television Industry in India, 2017
This section of the report examines additional sectors which are closely related to the activities of the film and TV industry, but have not been considered in the preceding economic impact analysis:• VFX, animation, and post production• Gaming• Music• Licensing and merchandizing
Foreign films shooting in India has been covered in an earlier section of this report.
VFX, animation, and post productionIndia accounts for c. 10% of the global animation and VFX outsourcing pie, and there is room for growth with increasing amount of work coming from Hollywood studios. VFX Revenue from international projects is a major contributor, accounting for around 73% of the industry revenue.
Recent international movies on which Indian talent was involved in include28:
Hollywood films involving Indian VFX players and their total gross collection worldwide• The Jungle Book – US$ $950 mn• Suicide Squad – US$ 750 mn• The Legend of Tarzan –US$ 350 mn
In India, around 40 domestic VFX companies operate to cater to clients from all over the world.
Taking cue from success of international films that have significant VFX shots factored in, domestic films are increasing the budget allocation for Indian films to VFX from 15% to 35% in the upcoming years. The production budget of Baahubali: The beginning allocated 25% of its US$ 18 MN budget for VFX29. There is an increasing perception that movies which are “grand” and VFX heavy are more likely to succeed in a theatrical setting. Since theatrical revenues still constitute a majority of film industry revenue, this provides incentive for producers to increase VFX spend.
Siddharth Roy Kapur, Founder, Roy Kapur Films
Movies that work in theatres today are either those that offer a wholesome big screen experience like Baahubali or Padmaavat, or those that are instant conversation starters like Hindi Medium or Shubh Mangal Savdhaan. Movies in the middle, however well made, face a challenge as they can easily be consumed on another screen.
Miscellaneous categories such as gaming, augmented reality, virtual reality, and simulation are expected to see a collective CAGR of 35% during 2016 to 2021. Film and digital advertising segments gained share in the animation services pie due to foreign collaborations in film production.
Realizing the potential of the VFX industry several industry players are coming together to enhance the level of collaboration within the industry. Select developments include: • Telangana on 2nd December 2017, launched its own VFX,
Animation, and gaming association (TVAGA) with the objective to create a community to enhance and uplift the industry.
• The Visual Effects Society (VES) announced its formation in India on the 16th of December 2017.
The Government has a vision to set up a National Centre of Excellence in Animation, Gaming and Visual effects (NCOE) to develop training capacity for the animation industry.
GamingThe advent of affordable mobile internet rates and affordable smartphones is expected to improve the number of mobile application downloads. Gaming studios in India are gearing up to enter the mainstream market, bolstered by the planned IPO of Nazara Technologies which publishes mobile games of Chhota Bheem series and Virat Kohli30. This would be the first public offering of an Indian gaming company.
Film and television content is one theme around which games are built; examples include games on Sultan, Dhoom 3, and Chhota Bheem. The year 2017, saw an inclination towards celebrity oriented games such as Alia Bhat: Star Life and Being Salman31 which have between 1 and 5 mn downloads each on the Google Play Store32.
MusicThe music industry in India derives most of its content from the film industry, which accounts for 70-80% of music content. The industry is expected to grow at a CAGR of 16%, from INR 1,200 cr in FY2017, to INR 2,410 cr in FY2022.
Chart #16: Music industry in India (INR ’00 cr)
28. Thenational.ae – Special effects: An Indian focus29. Animation express – June 2016 Magazine30. Timesofindia – IPO-Bound mobile gaming company Nazara eyes Rs 3,000 Crore valuation31. Animation express – 2017 – Year enders32. Google play store
24.1
FY19 FY20 FY21 FY22
21.018.3
15.913.8
12.0
FY18FY17
CAGR – 16%
Source: Industry reports

53
Economic Contribution of the Film and Television Industry in India, 2017
Still from Secret Superstar. Image credit: Amir Khan Productions

54
Economic Contribution of the Film and Television Industry in India, 2017
33. Entrepreneur.com - Brands that Make Products Come Alive34. Deloitte analysis35. News18.com – Amazon.in offers official Baahubali 2 merchandise
Along with digital rights to audio streaming platforms, events, restaurants etc., royalty from music played over the radio is a key driver for the growth of the music industry in India.
Digital distribution is expected to grow rapidly, with several audio OTT players present in India, including Gaana, Saavn, Airtel Wynk, JioMusic, Hungama, Google music, and Apple Music. These players provide services such as:• Download for offline listening.• Unlimited streaming across different genres.• Multi-device sharing.• Social networking options such as playlist sharing,
following other users etc.
As the music industry gets a boost from the digital wave that India is riding, music from films is expected to continue to maintain its level of contribution.
Licensing and merchandizingThe Licensing and Merchandising industry in India is still at a nascent stage, but has the potential for rapid growth. In metros as well as Tier I and II cities, there has been a significant growth in customer spending due to the rising income levels. With advent of organized retail stores as well as online retailing, it has become easier for the L&M companies to distribute their products across the length and breadth of the nation. Film and television industries are key sources of concepts for products. The size of the domestic licensing industry is about INR 4,000 cr of which 80 per cent is estimated to be by characters and the entertainment segment33.
Chart #17: Segments contributing to the licensing and merchandizing industry in India
SportsCorporateFashionArtsKids & Entertainment
80%
5%5%
3%
7%
Source: Entrepreneur.com - Brands that Make Products Come Alive
Below are some examples of film and television content that have translated into L&M opportunities:• Chhota Bheem is estimated to contribute between
INR 15 cr to INR 20 cr34 in L&M revenue.• Animated kids entertainment TV series Motu patlu and
Fatak Patak, have inspired the launch of merchandise in the price range of INR 249 to INR 999.
• Baahubali 2 has helped grow the L&M industry in India after its release in 2016. Amazon premiered an exclusive animated series called Baahubali: The Lost Legends exclusively for its prime members. Along with this, Amazon listed exclusive Baahubali merchandize on its website with options for customization35.
Lastly, amusement parks and destinations such as Ramoji studio leverage content from the film and television industries to attract footfalls.

55
Economic Contribution of the Film and Television Industry in India, 2017
Enabling the industry

56
Economic Contribution of the Film and Television Industry in India, 2017
The industry could travel a rapid growth trajectory (16-18% CAGR vis-à-vis the expected 12%) if key stakeholders step up and address some of the main challenges and bottlenecks. This is likely to translate into a 20% higher industry size five years down the line, and also bring with it the associated indirect effects. To put this in perspective, this optimistic growth trajectory would translate into 8-12 lac additional jobs five years down the line (over and above the base-case growth trajectory).
Factors that could shift the growth trajectory of the industry
• Implementation of the objectives enshrined in the National IPR Policy 2016
• Strengthening the access infrastructure for carriage of creative products
• More liberal censorship regime, allowing creation of content per consumers’ preferences; preferably move towards a ratings system
• Ease in clearances / permissions, especially in broadcasting. Wider implementation of single-window clearance for shoots and screen building
• Address GST related challenges – Highest slab (28%) for movie tickets
priced over INR 100 dampens demand
– The state of Tamil Nadu has levied Local Body Entertainment Tax (LBET) on top of GST; non-Tamil language tickets bear indirect tax of 48%
– Different rates of GST across the value chain make set-off a challenge
• Incentives for movie production, to encourage shooting within India
• Anti-piracy laws with more teeth; the broader industry ecosystem like ISPs and telcos also need to work together to curb piracy
• Thrust to close out last leg of cable digitization
• Decrease in data costs by telecom operators; penetration and growth of smartphones
Policy and Regulatory/External
• Skilling, for increased content volume as well as tasks in the new media environment
• Improving screen density, in particular creating a presence in screen-dark areas – Policy makers could create incentives
for exhibitors to build infrastructure, such as bringing back the five year tax holiday for multiplexes which was granted in the 2000’s
• Moving forward in a time-bound manner to action the copyright rules to their logical conclusion (copyright societies putting out tariffs is yet to happen)
• Arriving at a fair and sustainable solution to share subscription revenue across the television value chain
External + Internal
• Raising the quality of content• Leveraging analytics (including
recommendation engines) for relevant creation and curation of content
• Creating content for a global audience• Focusing on profitable growth• Adequately monetizing creative content
across platforms
Industry / Internal

57
Economic Contribution of the Film and Television Industry in India, 2017
Appendix
58
Economic Contribution of the Film and Television Industry in India, 2017
Approach to estimating direct impactThe impact of the selected verticals is performed by first breaking down the value chain of the vertical and identifying key participants. Then, the value chain revenue and cost metrics are determined using a combination of secondary research and industry discussions for each part of the chain. The direct impact of an industry is quantified in the following categories:
1. Gross Output
2. Gross Value Added (Summation of EBITDA and Net Indirect Taxes)
3. Total Value Added
4. Employment
The significance of these indicators have already been discussed in the respective industry vertical segments of this report.
The value chain of the industries have been classified as below:
1. Film industry At a high level, there are 3 elements of the film industry
value chain, viz. production, distribution, and exhibition. To estimate the direct economic impact, the approach taken with respect to each element is as mentioned below:
Production Distribution Exhibition
Production and Distribution: The film production and distribution elements of the value chain have been analyzed together, since most large film producers also have distribution facilities.
Films have been analyzed by two types of cuts: a cut by budget (large, medium, small), and a cut by performance (hit, average, flop). There is also an over-arching cut by language. We have used the budget to estimate employment, wages, production cost etc., and the performance along with the budget to estimate the profitability.
Foreign films are typically released in India through local
distribution offices of the parent company. For the purpose of this report, it has been assumed that the profits earned by the local distribution offices are repatriated abroad after paying local staff, and hence such profits have been excluded from the value added to the Indian economy. We have however, included the wage related expenses.
Exhibition: Exhibition revenues take into account ticket sales as well as concessions, advertising and others
streams. To estimate the EBITDA and Wage contribution of the theatrical exhibition sector, we have considered single screens and multiplexes separately. Foreign films’ contribution to the Indian exhibition sector has also been accounted for.
Other elements: • Online / Digital aggregators: A film earns a significant
share of revenue from non-theatrical avenues such as licensing (and/or sales) of C&S rights, internet rights, home video rights etc. Aggregators (e.g. Rajshri, Shemaroo etc.) are conduits between filmmakers / distributors and platforms (e.g. iTunes, You Tube, Amazon Prime, Netflix etc.) where people go to watch or buy films. We have included revenues earned by the aggregators but not by the third party platforms. OTT platforms have been separately analyzed in this report.
• Digital distribution: Digital distribution refers to distribution of films to theatres via satellite. We have estimated this segment based on industry discussions and publicly available information of key players such as UFO and Qube Cinema.
2. Television Industry We have looked at three key elements in the television
industry value chain, viz. production, broadcasting, and distribution. To estimate the direct economic impact, the approach taken with respect to each element is as mentioned below:
Production Broadcasting Distribution
Production: The content considered includes international and regional films, and television series. The methodology to estimate key numbers for this section is indicated below:
• Content revenues for producers have been estimated on the basis of content costs as % of ad revenues.
• Television content revenues have been segmented across Hindi and other regional languages.
• Wages in television production include salaries of crew as well as cast (these include permanent as well as contractual employees).
• Employment generated by producers has been estimated based on industry estimates of number of employees required per hour of original content produced.
Broadcasting: Broadcasting pertains to the aggregation, bundling of television channels, and liaising with distribution partners to ensure that the channels reach the right

59
Economic Contribution of the Film and Television Industry in India, 2017
audience. The methodology to estimate key numbers for this section is indicated below:
• Broadcasting revenues are a summation of subscription revenues flowing in from DTH and cable operators, as well as ad revenues for television channels.
• Export earnings have been established by extrapolating earnings of the largest player i.e. Zee.
• Wages in television broadcasting include salaries of permanent employees only.
• Employment generated by broadcasters has been estimated based on average revenue per employee ratio for key industry players.
Distribution: Distribution pertains to the last mile distribution of television channels to customers via mediums such as cable (including fiber), DTH, HITS etc. The methodology to estimate key numbers for this section is indicated below:
• Distribution revenues are segmented by technology i.e. DTH, cable (cable has further been split into MSOs and LCOs).
• Wages in TV distribution include salaries of permanent (on-roll) employees of DTH players and MSOs, as well as that of all people employed by LCOs.
• Employment generated by DTH operators has been estimated based on average employees per million subscribers for key DTH players.
• Employment generated by MSOs has been estimated based on average employees per million subscribers for key MSOs.
• Employment generated by LCOs has been estimated based on an average number of employees per LCO.
3. OTT Platforms We have not split the OTT value chain, and considered total
revenue at the customers’ end.
A note on indirect impact using the input-output approachInput-output tables provide a detailed dissection of intermediate transactions in an economy, and are thus a means of describing the supply and use of the products of an entire economic system. They are a tool to quantify the relationships between various sectors in the economy.
The tables attempt to answer the question: If an industry has to grow its output by INR 1, how much should the output of all the industries in the economy grow by?
India’s input-output tables identify 130 different sectors. The tables take the shape of a 130x130 matrix, where the 130 rows represent the producers and the 130 columns represent the consumers.
It may be noted that these 130 Industries / sectors may contain more than one sector within their classification. For Instance,
Sector 129 – “Other Services”, under which the creative industry is classified under, includes:
• Sanitary services
• Recreation & entertainment
• Radio & TV
• Broadcasting services
• International and other territorial bodies and services not elsewhere classified
The input-output tables are usually published by government economic agencies. In the case of India, until 2008, it was the Ministry of Statistics and Programme Implementation (MOSPI). Between 2008 and 2013-14, no usable input-output table was published. In December 2016, the National Council of Applied Economic Research (NCAER) published a usable equivalent of input-output tables for 2013-14.
In order to utilize the input-output table to derive indirect effects, the following approach was adopted:
1. Derivation of Indirect GVA and Net Indirect Taxes The Input-Output tables have the values for GVA, NIT
and Output against every sector i.e. for each column. By dividing the total GVA and total NIT of each column by the total Output of the column, we arrive at the ratio of GVA to Output and NIT to Output, for that sector. This ratio can then be applied on the derived Output, to determine indirect GVA and NIT. Since the indirect impact pertains to impact across industries, the all-India ratios across industries have been applied to the indirect Gross Output estimated below.
2. Derivation of Indirect Gross Output Using the input-output table as the base, one can derive
multipliers for the purpose of estimating Indirect Gross Output and Employment. To do this, one must first derive a matrix known as the Leontief Inverse Matrix by using the base Input-output tables.
In simple terms, the Leontief Inverse Matrix is an economic value used to derive the ripple effect of one industry to other industries. In order to calculate the Leontief Inverse Matrix, the following steps were followed
• Division of value in each ‘row X column’ value by the total output value to arrive at a co-efficient matrix.
• This co-efficient matrix is subtracted from a standard Inverse matrix.
• The resulting matrix is referred to as a Leontief matrix.
• The inverse of the matrix resulting from the above step provides the Leontief Inverse Matrix.
Multipliers The summation of the column of Sector 129 is considered as
the multiplier effect for Gross Output.

60
Economic Contribution of the Film and Television Industry in India, 2017
The NCAER has published the Leontief Inverse matrix multipliers for Output and Employment in the report of December 2016. The employment multiple for sector 129 has been considered for the purpose of employment estimation.
LimitationsThe estimation of indirect impact based on the above approach is only a broad approximation, as industry specific multipliers are not available. Multipliers from other countries have not been considered, as the structure and functioning of the Indian film and television industry is quite unique, as compared to other developed nations and hence not comparable. The effect of piracy has not been considered in the scope of this study.
There may be an additional impact of indirect taxes other than service and entertainment tax. However, due to the absence of relevant industry-wise information, this has not been considered in the analysis for this segment.
The impact of revenue generated from the film music industry has been considered as a part of the ancillary revenues earned by the film producer. The remaining part of the value chain of the Indian music industry has not been covered in this analysis. In a fundamental sense, economic contribution studies are simply historical accounting exercises. No ‘what-if’, or counterfactual inferences – such as ‘what would happen to living standards if the firm disappeared?’ – should be drawn from them.
Industry size and growthGrowth is measured by CAGR; estimates for CAGR are based on a combination of sources, including analyst and industry reports, annual reports and company reports / filings, media articles, discussions with industry participants, and our analysis / sense checks. CAGR measures the geometric progression ratio that provides a constant rate of return over the time period

61
Economic Contribution of the Film and Television Industry in India, 2017
Abbreviation Expansion Abbreviation Expansion
ARPU Average Revenue Per User HD High Definition
ASSOCHAM The Associated Chambers of Commerce and Industry of India
INR or Rs. Indian Rupees
BN or bn Billion IO Input Output
CAGR Compound Annual Growth Rate LMO / LCO Last Mile Owner / Local Cable Operator
CII Confederation of Indian Industry M&E Media & Entertainment
cr Crore (1 crore = 10 million) MN or mn Million
CY Calendar Year (ended December 31st) MOSPI Ministry of Statistics and Programme Implementation
C&S Cable & Satellite MSO Multi System Operator
DTH Direct To Home NCAER National Council of Applied Economic Research
EBITDA Earnings Before Interest, Tax, Depreciation and Amortization
OTT Over The Top
(E) Estimated (P) Projected
FICCI Federation of Indian Chambers of Commerce and Industry
STB Set Top Box
FTE Full Time Equivalent TRAI Telecom Regulatory Authority of India
FY Fiscal Year (ended March 31st) TV Television
GDP Gross Domestic Product USD / US$ United States Dollar
GEC General Entertainment Channel HITS Head In The Sky
MIB Ministry of Information and Broadcasting
GST Goods and Services Tax
SD Standard Definition VFX Visual Effects
GO Gross Output GVA Gross Value Added
NIT Net Indirect Taxes Lacs 1 Lac = (100,000 or 0.1 Million)
c. Circa or Approximate ATP Average Ticket Price
PPP Purchasing Power Parity T&T Travel and Tourism
SUT Supply Use Tables WiFi Wireless Fidelity
E Exabyte GB Gigabyte
GlossaryListed below are the expansions of the most commonly used words in this report

62
Economic Contribution of the Film and Television Industry in India, 2017
Acknowledgements
Deloitte and the Motion Picture Association appreciate the perspectives, observations and background information contributed by a number of individuals repesenting the film, television, and OTT sectors.
Organizations
Producers Guild of India South Indian film Chambers of commerce Eros Entertainment
PVR Cinemas UFO Moviez Walt Disney
Hathway IndusInd Media & Communications (IMCL) Tata Sky
IndiaCast Hotstar Spuul
Viacom 18 Roy Kapur Films Aamir Khan Productions
Cinepolis Yash Raj Films Carnival Cinemas
Cinema Owners and Exhibitors Association of India
Inox Movies Sony Pictures Networks
Star India
Apart from active participation, we would like to acknowledge the participation of industry participants through the form of:
• Annual reports and filings
• Analyst reports
• Media reports
• News articles
We would like to thank the following for sharing image for this report (stills, posters):
• Aamir Khan Productions
• Arka Media Works Pvt. Ltd.

63
Economic Contribution of the Film and Television Industry in India, 2017
Key contacts
Motion Picture Dist. Association (India) Pvt. Ltd.808 Aston, Sundervan ComplexShastrinagar, Andheri – WestMumbai – 400 053.Website : www.mpaa-india.orgPhone : +91 22 6139 7000 / 02 E-mail : [email protected]
Key contacts:Uday Singh Managing Director
Lohita SujithDirector – Corporate Communications
Deloitte Touche Tohmatsu India LLP3rd Floor, BNG House, 12, Dr. Annie Besant RoadOpposite Shiv Sagar Estate, Near Nehru Planetarium, WorliMumbai - 400 018.Website : www.deloitte.com/inPhone : +91 22 6122 8000
Key contacts:Abhishek VPartner, Strategy & OperationsPhone: +91 124 679 2000 E-mail: [email protected]
Vivek RamakrishnanDirector, Strategy & OperationsPhone: +91 22 6122 8022 E-mail: [email protected]
64
Economic Contribution of the Film and Television Industry in India, 2017
AboutAbout MPDA and MPAMPDA: The Motion Picture Dist. Association (India) Pvt. Ltd. (MPDA) is a wholly owned local office of the Motion Picture Association, and represents the interests of the American motion picture industry in India. MPDA works closely with local industry, government, law enforcement authorities and educational institutions to promote and protect the Indian film and television industry. For more information, please visit: www.mpaa-india.org
MPA: PROMOTING & PROTECTING SCREEN COMMUNITIES IN ASIA PACIFIC The Motion Picture Association (MPA) and the Motion Picture Association International (MPA-I) represent the interests of the six international producers and distributors of filmed entertainment. To do so, they promote and protect the intellectual property rights of these companies and conduct public awareness programs to highlight to movie fans around the world the importance of content protection. These activities have helped to transform entry markets benefiting film,television and OTT industries in each country including foreign and local filmmakers alike. The organizations act on behalf of the members of the Motion Picture Association of America, Inc. (MPAA) which include; Paramount Pictures Corporation; Sony Pictures Entertainment Inc.; Twentieth Century Fox Film Corporation; Universal City Studios LLC; Walt Disney Studios Motion Pictures; and Warner Bros. Entertainment Inc. The MPA and the MPA-I have worldwide operations, which are directed from their head offices in Los Angeles and Washington, D.C. and overseen in the Asia Pacific by a team based in Singapore
About Deloitte“Deloitte” is the brand under which tens of thousands of dedicated professionals in independent firms throughout the world collaborate to provide audit, consulting, financial advisory, risk management, tax and related services to select clients.
These firms are members of Deloitte Touche Tohmatsu Limited, a UK private company limited by guarantee (“DTTL”). Each DTTL member firm provides services in particular geographic areas and is subject to the laws and professional regulations of the particular country or countries in which it operates. Each DTTL member firm is structured in accordance with national laws, regulations, customary practice, and other factors, and may secure the provision of professional services in its territory through subsidiaries, affiliates, and other related entities. Not every DTTL member firm provides all services, and certain services may not be available to attest clients under the rules and regulations of public accounting. DTTL and each DTTL member firm are legally separate and independent entities, which cannot obligate each other. DTTL and each DTTL member firm are liable only for their own acts and omissions, and not those of each other. DTTL (also referred to as “Deloitte Global”) does not provide services to clients.

65
Economic Contribution of the Film and Television Industry in India, 2017

Deloitte refers to one or more of Deloitte Touche Tohmatsu Limited, a UK private company limited by guarantee (“DTTL”), its network of member firms, and their related entities. DTTL and each of its member firms are legally separate and independent entities. DTTL (also referred to as “Deloitte Global”) does not provide services to clients. Please see www.deloitte.com/about for a more detailed description of DTTL and its member firms.
This material is prepared by Deloitte Touche Tohmatsu India LLP (DTTILLP). This material (including any information contained in it) is intended to provide general information on a particular subject(s) and is not an exhaustive treatment of such subject(s) or a substitute to obtaining professional services or advice. This material may contain information sourced from publicly available information or other third party sources. DTTILLP does not independently verify any such sources and is not responsible for any loss whatsoever caused due to reliance placed on information sourced from such sources. None of DTTILLP, Deloitte Touche Tohmatsu Limited, its member firms, or their related entities (collectively, the “Deloitte Network”) is, by means of this material, rendering any kind of investment, legal or other professional advice or services. You should seek specific advice of the relevant professional(s) for these kind of services. This material or information is not intended to be relied upon as the sole basis for any decision which may affect you or your business. Before making any decision or taking any action that might affect your personal finances or business, you should consult a qualified professional adviser.
No entity in the Deloitte Network shall be responsible for any loss whatsoever sustained by any person or entity by reason of access to, use of or reliance on, this material. By using this material or any information contained in it, the user accepts this entire notice and terms of use.
©2018 Deloitte Touche Tohmatsu India LLP. Member of Deloitte Touche Tohmatsu Limited