Economic Contribution of the Agbioscience Industry: Central
39
EXTENSION CENTER FOR COMMUNITY VITALITY Economic Contribution of the Agbioscience Industry: Central Minnesota A REPORT OF THE ECONOMIC IMPACT ANALYSIS PROGRAM Authored by Brigid Tuck and Neil Linscheid PROGRAM SPONSORS: AGRICULTURAL UTILIZATION RESEARCH INSTITUTE (AURI), NORTHWEST MINNESOTA FOUNDATION, WEST CENTRAL INITIATIVE, INITIATIVE FOUNDATION, SOUTHWEST INITIATIVE FOUNDATION, AND SOUTHERN MINNESOTA INITIATIVE FOUNDATION
Transcript of Economic Contribution of the Agbioscience Industry: Central

EXTENSION CENTER FOR COMMUNITY VITALITY
Economic Contribution of the Agbioscience Industry: Central Minnesota A REPORT OF THE ECONOMIC IMPACT ANALYSIS PROGRAM Authored by Brigid Tuck and Neil Linscheid
PROGRAM SPONSORS: AGRICULTURAL UTILIZATION RESEARCH INSTITUTE (AURI), NORTHWEST MINNESOTA FOUNDATION, WEST CENTRAL INITIATIVE, INITIATIVE FOUNDATION, SOUTHWEST INITIATIVE FOUNDATION, AND SOUTHERN MINNESOTA INITIATIVE FOUNDATION

ECONOMIC CONTRIBUTION OF AGBIOSCIENCE: CENTRAL MINNESOTA i
Partners/Sponsors: Agricultural Utilization Research Institute (AURI) Initiative Foundation Northwest Minnesota Foundation Southern Minnesota Initiative Foundation Southwest Initiative Foundation West Central Initiative Cover Photos Credit: Rolf Hagberg, Rolf Hagberg Photography
Economic Contribution of the Agbioscience Industry: Central Minnesota A REPORT OF THE ECONOMIC IMPACT ANALYSIS PROGRAM April 2015 Authored by Brigid Tuck and Neil Linscheid Editors: Elyse Paxton, Senior Editor, University of Minnesota Extension Center for Community Vitality

ECONOMIC CONTRIBUTION OF AGBIOSCIENCE: CENTRAL MINNESOTA ii
Table of Contents 1. ECONOMIC CONTRIBUTION OF THE AGBIOSCIENCE INDUSTRY: CENTRAL MINNESOTA 1 2. INTRODUCTION 2 3. DEFINING THE CENTRAL REGION 3 4. ECONOMIC OVERVIEW AND THE AGBIOSCIENCE INDUSTRY IN CENTRAL MINNESOTA 4 Output 4 Agbioscience Output 5 Production Agriculture Output 5 Employment 6 Agbioscience Employment 7 Trends in Agbioscience Employment 7 5. ECONOMIC CONTRIBUTION, TRENDS, AND FUTURE GROWTH AND DEVELOPMENT OF AGBIOSCIENCE IN CENTRAL MINNESOTA 9 Direct Effect 9 Indirect and Induced Effects 11 Total Effect 11 Top Industries Affected 12 Contribution of Agbioscience by Region of Greater Minnesota 14 Future Growth and Development of Agbioscience 16 6. ECONOMIC CONTRIBUTION, TRENDS, AND FUTURE GROWTH AND DEVELOPMENT OF AGBIOSCIENCE IN CENTRAL MINNESOTA BY PLATFORM 17 Microbial Agbioscience 18 Resilient, Efficient, and Productive Agricultural Systems 19 Biobased Industrial Products 20 Value-Added Food and Health Products 21 Contribution of Agbioscience Platforms by Region of Greater Minnesota 22 7. SUMMARY 23 8. APPENDIX 1: METHODOLOGY 25 Input-Output Models 25 Quarterly Census of Employment and Wages (QCEW) 26 Shift-Share Analysis 26 9. APPENDIX 2: DEFINITION OF AGBIOSCIENCE WITH NAICS CODES 27 10. APPENDIX 3: COMPOSITION OF AGBIOSCIENCE OUTPUT BY REGION 31 11. APPENDIX 4: REFERENCES 34 12. APPENDIX 5: AGBIOSCIENCE JOBS AND CHANGE BY SECTOR, 2003-2013 34

ECONOMIC CONTRIBUTION OF AGBIOSCIENCE: CENTRAL MINNESOTA 1
ECONOMIC CONTRIBUTION OF THE AGBIOSCIENCE INDUSTRY: CENTRAL MINNESOTA
University of Minnesota Extension recently completed a study of the economic contribution of the agbioscience
industry in Central Minnesota. Central Minnesota includes the 14 counties served by the Initiative Foundation. The
study builds on the work of Battelle Technology Partnership Practice, which defines agbioscience and identifies four
platforms for additional investment and development.
Composition of Agbioscience in Central Minnesota: In 2013, agbioscience companies in Central Minnesota
directly created an estimated $2.0 billion of economic activity, which represents 4 percent of all regional
output. Agbioscience in the region is based primarily on food production and wood and paper product
manufacturing. Growth sectors (measured by employment) include fruit and vegetable canning, distilleries,
and paper mills. Sectors with job losses include engineered wood member manufacturing, hardwood veneer
and plywood manufacturing, and cheese manufacturing. Central Minnesota is responsible for 12 percent of
Greater Minnesota’s total agbioscience output.
Agbioscience Platforms: Of the four agbioscience platforms identified by Battelle, the value-added food and
health platform is the largest in the Central region. Businesses in the platform directly produced an
estimated $1.1 billion in output. In comparison, the biobased industrial products platform produced $779.0
million, the resilient, efficient, and productive agricultural systems platform $197.4 million, and the
microbial agbioscience platform $118.2 million. However, it was the microbial agbioscience platform that
grew the fastest between 2003 and 2013, adding nearly 100 jobs, which is a 35 percent increase.
Components of the agbioscience industry can be included in more than one platform.
Production Agriculture: Production agriculture is not included in this study’s definition of agbioscience;
however, it is important to the success of the industry. In Central Minnesota, production agriculture created
an estimated $3.0 billion, or 6 percent, of output in the region. Together, production agriculture and
agbioscience companies create 10 percent of output in the region.
Direct Effect of Agbioscience: In 2013, agbioscience companies in Central Minnesota directly generated an
estimated $2.0 billion of output (sales). The companies employed 3,180 workers and paid an estimated
$246.6 million in salaries, wages, and benefits. The average annual compensation per agbioscience
employee is approximately $78,000.
Total Contribution of Agbioscience: In 2013, the agbioscience industry in Central Minnesota supported an
estimated $2.8 billion of output across all industries in the region, including output from supplier
industries and those that benefit from spending by agbioscience workers. Based on this broad measure, the
industry supported an estimated 8,940 jobs and $474.0 million of labor income.
Top Industries Impacted: The contribution of the agbioscience industry in Central Minnesota is strongest in
the industries of wholesale trade, grain farming, dairy cattle and milk production, and electric power.
Future Growth and Development: During the past 10 years, employment in the agbioscience industry in
Central Minnesota has grown by 13 percent. If the trend continues with a growth rate of 10 percent through
2016, the economic contribution of the agbioscience industry in the region will increase to an estimated
$3.1 billion in output, 9,840 jobs, and $521.5 million in labor income. During the same time period, the
total number of jobs across all industries in the Central region increased by 7 percent. Evidence indicates
the region has nearly recovered from the Great Recession of 2008-2009.
ECONOMIC CONTRIBUTION OF AGBIOSCIENCE: CENTRAL MINNESOTA 2
INTRODUCTION
Agbioscience is “a broad continuum of activity in the development, production, and value-added use
of plant and animal organisms for food, health, fuel, and industrial applications” (Battelle
Technology Partnership Practice and BioDimensions, February 2013, p. 10). Minnesota has a long
history of being a leader in the field of agriculture and science, leaving the state with a strong
agbioscience industry. In fact, many of Minnesota’s most iconic firms are associated in some way
with this industry, and all regions of Minnesota have firms and institutions participating in
agbioscience.
The Agricultural Utilization Research Institute (AURI), along with the Minnesota Corn Research and
Promotion Council and the Minnesota Soybean Research and Promotion Council, recognizes the
importance of this industry and recently contracted with Battelle Technology Partnership Practice to
capture the current status of the industry in Minnesota, as well as its potential for growth and
opportunities for advancement. The findings were published in in the 2013 Battelle report
“Agbioscience as a Development Driver: Minnesota’s Agbioscience Strategy.” In the report, Battelle,
in consultation with industry leaders in Minnesota, identified four platforms worthy of additional
investment and development within the state. These platforms include the following: microbial
agbioscience; resilient, efficient, and productive agricultural systems; biobased industrial products;
and value-added food and health products.
The Battelle report is a useful tool for decision-making at the state level. However, translating its
findings into meaningful knowledge at regional and local levels can be a challenge, especially when it
pertains to how the agbioscience industry can be leveraged for economic development. Particularly,
certain regions of the state may be poised to become leaders in particular platforms, based on the
strengths of the individual region within the agbioscience industry.
Economic development is an interaction between communities and firms, so it’s important
community and regional leaders understand the key regional effects of the agbioscience industry.
This report is intended to begin bridging the gap between the statewide results of the Battelle report
and the regional specifics that local and regional decision makers need about agbioscience. Aware of
the economic contribution agbioscience brings to a region, decision makers are more equipped to
take actions on the latent advantages of the region in agbioscience.
This report focuses on the economic contribution of the agbioscience industry in Central Minnesota.
It explores the current economic contribution of the industry, past industry trends in employment,
and the potential for future growth and development of agbioscience in the region. Additionally, the
economic contribution of agbioscience by region and by platform is included in this analysis. In
supplement to this
publication, other
reports will be
published examining
the agbioscience
industry individually
in each of the six
Initiative Foundation
regions in Minnesota. A report examining the agbioscience in Greater Minnesota will also be
available.
Agbioscience in this report includes components of the manufacturing, wholesale trade, and
professional and business services industries. The definition of agbioscience includes specific, well-
Minnesota’s Four Agbioscience Platforms:
Microbial Agbioscience
Resilient, Efficient, and Productive Agricultural Systems
Biobased Industrial Products
Value-Added Food and Health Products

ECONOMIC CONTRIBUTION OF AGBIOSCIENCE: CENTRAL MINNESOTA 3
defined sectors within each of these industries. For example, manufacturing is an industry, and
soybean processing is a sector within the manufacturing industry. More broadly, however, the
definition of agbioscience includes components of food manufacturing, wood and paper product
manufacturing, chemical manufacturing, farm supplies wholesalers, environmental consulting, and
research and development in biotechnology. The only component of production agriculture included
in this analysis is the sector of soil preparation, planting, and cultivation. By and large, this analysis
does not focus on production agriculture. The definition of agbioscience used in this report is
consistent with the definition of agbioscience used in the Battelle report.
This study was conducted as part of University of Minnesota Extension’s Economic Impact Analysis
program. The study has two deliverables: a written report and a presentation with facilitated
discussion of the results. The Agricultural Utilization Research Institute (AURI) provided guidance in
the research. The project was funded by the Initiative Foundation, the Northwest Minnesota
Foundation, West Central Initiative, Southwest Initiative Foundation, and the Southern Minnesota
Initiative Foundation.
DEFINING THE CENTRAL REGION
The region in this analysis is Central Minnesota, as defined by the boundaries of the Initiative
Foundation. Counties included in this analysis are Benton, Cass, Chisago, Crow Wing, Isanti, Kanabec,
Mille Lacs, Morrison, Pine, Sherburne, Stearns, Todd, Wadena, and Wright.
Map 1: Central Region

ECONOMIC CONTRIBUTION OF AGBIOSCIENCE: CENTRAL MINNESOTA 4
ECONOMIC OVERVIEW AND THE AGBIOSCIENCE INDUSTRY IN CENTRAL MINNESOTA
Understanding the role of agbioscience in the Central region requires an understanding the broader
economy. Several metrics exist for measuring economic activity. This analysis focuses on output and
employment. Output is a measure of the total transactions in an economy. Most transactions occur
as sales between businesses and between businesses and consumers.
Output
In 2013, businesses and enterprises in the Central Minnesota economy produced $52.0 billion of
output. The professional and business services industry was the single largest contributor of output
in the region, producing $12.6 billion of sales in 2013 (chart 1). Real estate and rental businesses
created 46 percent of all output in the industry. Real estate and rental businesses include those
renting or leasing real estate. It also includes businesses that manage and appraise real estate assets.
Rental of agricultural land would be included in this sector. Other sectors in this industry include
finance and insurance; professional, scientific, and technical services; and information.
The manufacturing sector in the region produced $11.9 billion of sales in 2013. Large manufacturing
sectors in Central Minnesota include food production (23 percent of manufacturing output),
transportation equipment manufacturing (13 percent), and fabricated metal production (12 percent).
Significant food product manufacturing sectors include meat processed from carcasses, poultry
processing, and cheese manufacturing. Of these three sectors, only cheese manufacturing is
included in the definition of agbioscience in this report.
Trade is the third largest industry in the Central Minnesota region. Businesses in the trade industry
(including both retail and wholesale trade) produced $5.6 billion of output in 2013. Retail trade
businesses produced $3.3 billion of output while wholesale trade businesses produced $2.3 billion
of output. Farm supplies merchant wholesalers, which are included in the definition of agbioscience,
are included in the wholesale trade sector.
Agriculture, Forestry, Fish &
Hunt 6% Utilities
5% Construction 8%
Manufacturing 23%
Trade 10%
Transport & Warehousing
3%
Professional & Business Services
23%
Health & Social Services
8%
Leisure & Hospitality
4%
Other Services 2%
Government 8%
Chart 1: Output by Industry, Central Minnesota
Source: IMPLAN
ECONOMIC CONTRIBUTION OF AGBIOSCIENCE: CENTRAL MINNESOTA 5
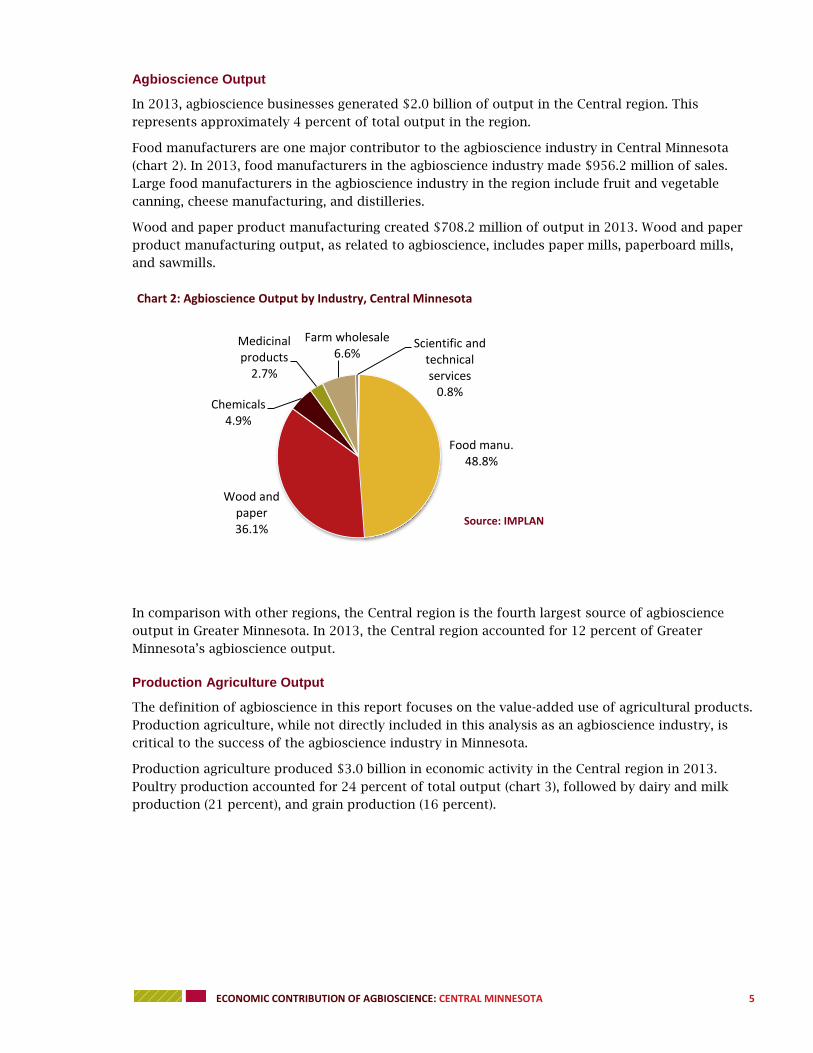
Agbioscience Output
In 2013, agbioscience businesses generated $2.0 billion of output in the Central region. This
represents approximately 4 percent of total output in the region.
Food manufacturers are one major contributor to the agbioscience industry in Central Minnesota
(chart 2). In 2013, food manufacturers in the agbioscience industry made $956.2 million of sales.
Large food manufacturers in the agbioscience industry in the region include fruit and vegetable
canning, cheese manufacturing, and distilleries.
Wood and paper product manufacturing created $708.2 million of output in 2013. Wood and paper
product manufacturing output, as related to agbioscience, includes paper mills, paperboard mills,
and sawmills.
In comparison with other regions, the Central region is the fourth largest source of agbioscience
output in Greater Minnesota. In 2013, the Central region accounted for 12 percent of Greater
Minnesota’s agbioscience output.
Production Agriculture Output
The definition of agbioscience in this report focuses on the value-added use of agricultural products.
Production agriculture, while not directly included in this analysis as an agbioscience industry, is
critical to the success of the agbioscience industry in Minnesota.
Production agriculture produced $3.0 billion in economic activity in the Central region in 2013.
Poultry production accounted for 24 percent of total output (chart 3), followed by dairy and milk
production (21 percent), and grain production (16 percent).
Food manu. 48.8%
Wood and paper 36.1%
Chemicals 4.9%
Medicinal products
2.7%
Farm wholesale 6.6%
Scientific and technical services
0.8%
Chart 2: Agbioscience Output by Industry, Central Minnesota
Source: IMPLAN

ECONOMIC CONTRIBUTION OF AGBIOSCIENCE: CENTRAL MINNESOTA 6
Employment
Output is one measure of economic activity; another is employment. According to IMPLAN, there are
374,390 jobs in the Central region. Employment is relatively diverse in the Central region. The
professional and business services industry employs 20 percent of all workers in the region. The
trade industry, including both retail and wholesale trade, employs 15 percent of workers. Health and
social services and government each account for 13 percent.
Oilseeds 6.8%
Grains 16.1%
Vegetables, fruits, tree nuts
2.7%
Sugar beets 0.2%
Cattle 12.7%
Dairy 21.0%
Poultry 24.4%
Hog 3.8%
Support activities 1.7%
Other crop 10.5%
Chart 3: Production Agriculture Output by Sector, Central Minnesota
Agriculture, Forestry, Fish &
Hunt 4%
Utilities 1%
Construction 6%
Manufacturing 10%
Trade 15%
Transport & Warehousing
3% Professional &
Business Services 20%
Health & Social Services
13%
Leisure & Hospitality
9%
Other Services 6%
Government 13%
Chart 4: Employment by Industry: Central Minnesota
Source: IMPLAN
Source: IMPLAN

ECONOMIC CONTRIBUTION OF AGBIOSCIENCE: CENTRAL MINNESOTA 7
Agbioscience Employment
Agbioscience businesses in the Central region employ 3,180 workers or about 1 percent of the total
workforce. Thirty-five percent of those employees are in food manufacturing (chart 5). Wood and
paper product manufacturers employ 30 percent of all agbioscience employees in the region.
Share of employment versus share of output can vary because productivity per worker varies. For
example, manufacturing employees can typically produce considerably more sales per worker than
service industry employees.
Trends in Agbioscience Employment
Beyond understanding the current status of the industry, studying how the industry is changing also
provides insights. Between 2003 and 2013, the number of jobs in the agbioscience industry in
Central Minnesota grew by 13 percent. In comparison, the number of jobs in the agbioscience
industry in Greater Minnesota declined by 3 percent. The Central region was one of three regions to
post positive jobs gains in the period. The total number of jobs in the Central region (across all
industries) grew by 7 percent in the period.
Shift-share analysis examines the drivers of growth and decline for a specific industry within a
specific region by comparing to industry and national trends. The analysis provides an interesting
interpretation of the changes in each industry (table 1). In this analysis, the primary focus is on the
competitive effect. A strong positive competitive effect indicates particular characteristics of the
local economy are driving growth in the region. A strong negative competitive effect can be
interpreted as a warning that the local region may not be supporting the industry as well as it could.
Support for ag/forestry
4%
Food manu. 35%
Wood and paper 30%
Chemicals 2%
Medicinal products
3%
Farm wholesale 22%
Scientific and technical services
4%
Chart 5: Agbioscience Employment by Industry, Central Minnesota
Source: IMPLAN

ECONOMIC CONTRIBUTION OF AGBIOSCIENCE: CENTRAL MINNESOTA 8
Table 1: Shift-Share Analysis (Measured by Number of Jobs) for Growth and Decline Agbioscience Industries1
Industry Change
2003-2013 Industry Mix Effect
National
Growth Effect Competitive Effect
Top 3 Job Adding Industries
Fruit and vegetable canning 134 -25 9 150
Distilleries 128 14 4 110
Paper mills (except newsprint) 105 -28 4 130
Top 3 Job Loss Industries
Engineered wood member
(except truss) manufacturing -188 -78 9 -120
Hardwood veneer and plywood
manufacturing -60 -48 5 -18
Cheese manufacturing -56 29 17 -101
Source: EMSI
Fruit and vegetable canning manufacturing added far more jobs than anticipated, given industry and
national trends. The overall economy expanded during this time period, so jobs would have been
added (national growth effect). However, the fruit and vegetable canning sector at the national level
shed jobs; therefore, job losses would have been expected in the region (industry mix effect). The
industry in Central Minnesota added jobs, however, thus making Central Minnesota competitive in
this sector.
As highlighted in the table, distilleries and paper mills in the region also outperformed national and
industry trends. Distilleries added 110 more jobs than expected, given trends. Paper mills added 130
more jobs than expected, based on national and industry trends.
The engineered wood member (except truss) manufacturing sector lost the highest number of jobs
within the agbioscience industry in the Central region. While the industry did not fare well at the
national level (industry mix effect), it appears the Central region lost more jobs than would have
been anticipated given these trends. In other words, the sector was not as competitive as it could
have been.
As highlighted in the table, hardwood veneer and plywood and cheese manufacturing experienced
the second and third highest number of job losses in the region during the period. Both industries
were less competitive than they could have been, given national industry trends and posted negative
competitive effects.
1 For an explanation of shift-share analysis, please see the methodology section. Note: figures in the table may not sum due to rounding.
ECONOMIC CONTRIBUTION OF AGBIOSCIENCE: CENTRAL MINNESOTA 9
ECONOMIC CONTRIBUTION, TRENDS, AND FUTURE GROWTH AND DEVELOPMENT OF AGBIOSCIENCE IN CENTRAL MINNESOTA
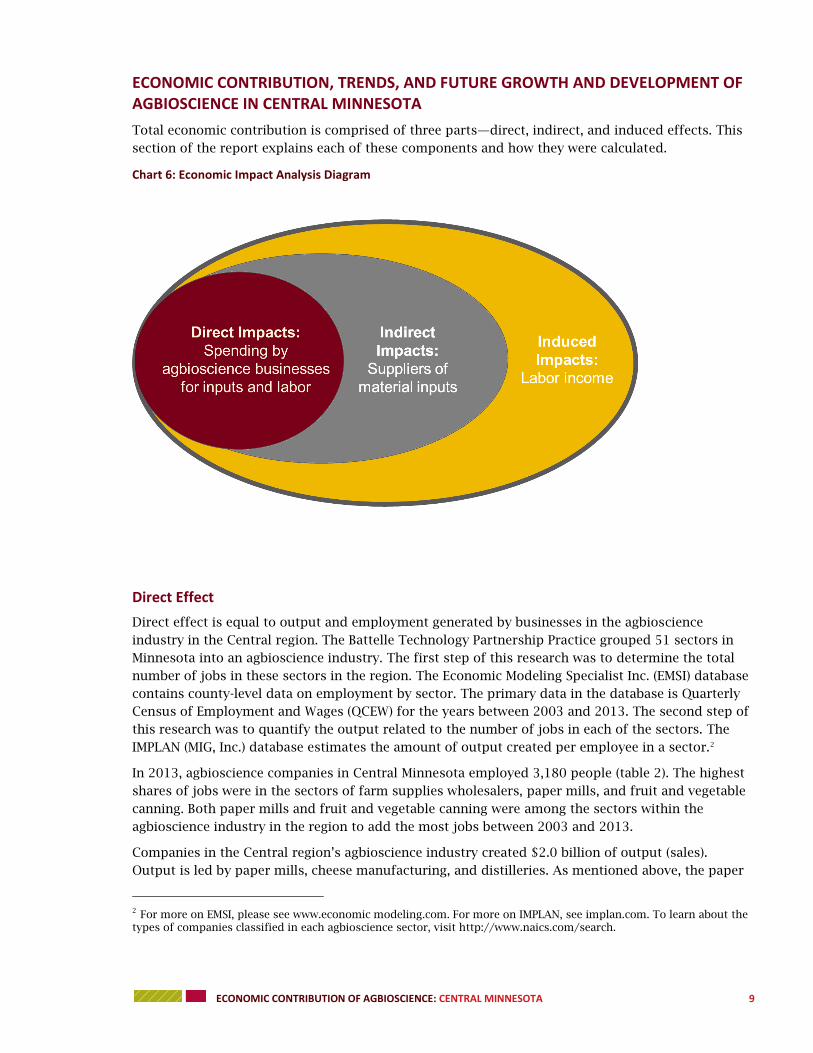
Total economic contribution is comprised of three parts—direct, indirect, and induced effects. This
section of the report explains each of these components and how they were calculated.
Chart 6: Economic Impact Analysis Diagram
Direct Effect
Direct effect is equal to output and employment generated by businesses in the agbioscience
industry in the Central region. The Battelle Technology Partnership Practice grouped 51 sectors in
Minnesota into an agbioscience industry. The first step of this research was to determine the total
number of jobs in these sectors in the region. The Economic Modeling Specialist Inc. (EMSI) database
contains county-level data on employment by sector. The primary data in the database is Quarterly
Census of Employment and Wages (QCEW) for the years between 2003 and 2013. The second step of
this research was to quantify the output related to the number of jobs in each of the sectors. The
IMPLAN (MIG, Inc.) database estimates the amount of output created per employee in a sector.2
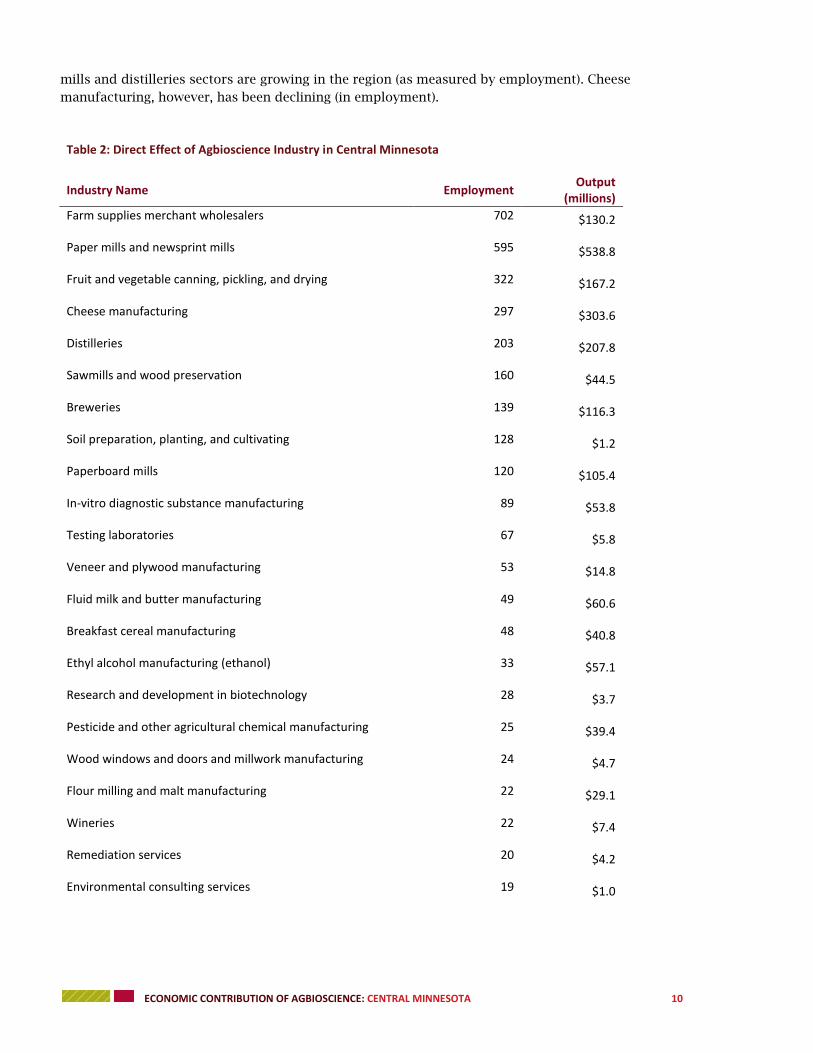
In 2013, agbioscience companies in Central Minnesota employed 3,180 people (table 2). The highest
shares of jobs were in the sectors of farm supplies wholesalers, paper mills, and fruit and vegetable
canning. Both paper mills and fruit and vegetable canning were among the sectors within the
agbioscience industry in the region to add the most jobs between 2003 and 2013.
Companies in the Central region’s agbioscience industry created $2.0 billion of output (sales).
Output is led by paper mills, cheese manufacturing, and distilleries. As mentioned above, the paper
2 For more on EMSI, please see www.economic modeling.com. For more on IMPLAN, see implan.com. To learn about the types of companies classified in each agbioscience sector, visit http://www.naics.com/search.
ECONOMIC CONTRIBUTION OF AGBIOSCIENCE: CENTRAL MINNESOTA 10
mills and distilleries sectors are growing in the region (as measured by employment). Cheese
manufacturing, however, has been declining (in employment).
Table 2: Direct Effect of Agbioscience Industry in Central Minnesota
Industry Name Employment Output
(millions)
Farm supplies merchant wholesalers 702 $130.2
Paper mills and newsprint mills 595 $538.8
Fruit and vegetable canning, pickling, and drying 322 $167.2
Cheese manufacturing 297 $303.6
Distilleries 203 $207.8
Sawmills and wood preservation 160 $44.5
Breweries 139 $116.3
Soil preparation, planting, and cultivating 128 $1.2
Paperboard mills 120 $105.4
In-vitro diagnostic substance manufacturing 89 $53.8
Testing laboratories 67 $5.8
Veneer and plywood manufacturing 53 $14.8
Fluid milk and butter manufacturing 49 $60.6
Breakfast cereal manufacturing 48 $40.8
Ethyl alcohol manufacturing (ethanol) 33 $57.1
Research and development in biotechnology 28 $3.7
Pesticide and other agricultural chemical manufacturing 25 $39.4
Wood windows and doors and millwork manufacturing 24 $4.7
Flour milling and malt manufacturing 22 $29.1
Wineries 22 $7.4
Remediation services 20 $4.2
Environmental consulting services 19 $1.0

ECONOMIC CONTRIBUTION OF AGBIOSCIENCE: CENTRAL MINNESOTA 11
Wet corn milling 5 $11.7
Soybean and other oilseed processing 5 $10.0
Frozen food manufacturing 5 $1.7
Total 3,180 $1,960.8
Sources: EMSI and IMPLAN
Indirect and Induced Effects
Using estimated direct effects, the data was entered into an input-output model. Input-output
models trace the flow of dollars throughout a local economy and capture the indirect and induced,
or ripple, effects of an economic activity. The IMPLAN input-output model was used in this analysis.
The indirect and induced effects measured are the result of spending in the Central region. In other
words, purchases made outside of the Central region will not trigger ripple effects.
Indirect effects are those associated with a change in economic activity due to spending for goods
and services directly tied to the industry. In this case, these are the changes in the local economy
occurring because agbioscience companies purchase goods (soybeans and grains, for example) and
related services (accounting and insurance, for example). As the agbioscience industry makes
purchases, this creates an increase in purchases across the supply chain, as those suppliers make
needed purchases of their own to produce output for the agbioscience industry. Indirect effects are
the summary of these changes across an economy.
Induced effects are those associated with a change in economic activity due to spending by the
employees of businesses (labor) and by households. Primarily, in this study, these are economic
changes related to spending by employees of agbioscience companies. It also includes household
spending related to indirect effects. As employees of the agbioscience industry make purchases
locally, this triggers increases in economic activity.3
The indirect and induced effects of the agbioscience industry are shown in table 3, along with a
discussion of the total contribution.
Total Effect
In 2013, the agbioscience industry contributed an estimated $2.8 billion dollars in economic activity
to the Central region of Minnesota from all effects—direct, indirect, and induced (table 3). The
industry’s presence in the Central region supported an estimated 8,940 jobs. These employees
received an estimated $474.0 million in wages, salaries, and benefits.
The agbioscience industry directly created $2.0 billion in economic activity in the region, as detailed
above. Agbioscience companies directly employed 3,180 residents of the region and spent $246.6
million in compensation to those workers. The average annual compensation per agbioscience
employee is approximately $78,000.
When agbioscience companies make purchases from businesses in the region, this generates
additional economic activity (indirect effects). From these indirect effects, agbioscience companies
3 For further definitions of direct, indirect, and induced effects, please see appendix 1.
ECONOMIC CONTRIBUTION OF AGBIOSCIENCE: CENTRAL MINNESOTA 12
generated an estimated $623.4 million in activity at regional businesses and supported jobs for
3,760 individuals.
When employees of agbioscience companies spend their wages and salaries in the Central region,
this creates economic activity at businesses in the region (induced effects). Employee spending
generated an estimated $229.1 million in economic activity in 2013 and supported employment for
2,000 workers.
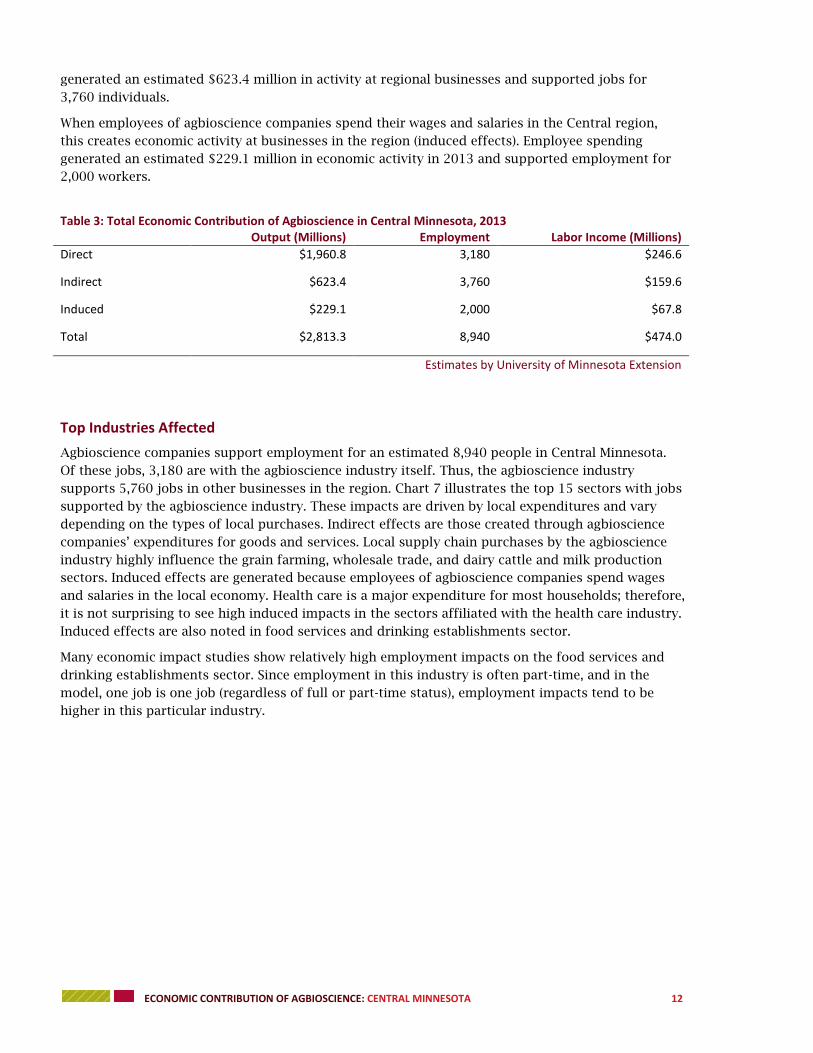
Table 3: Total Economic Contribution of Agbioscience in Central Minnesota, 2013 Output (Millions) Employment Labor Income (Millions)
Direct $1,960.8 3,180 $246.6
Indirect $623.4 3,760 $159.6
Induced $229.1 2,000 $67.8
Total $2,813.3 8,940 $474.0
Estimates by University of Minnesota Extension
Top Industries Affected
Agbioscience companies support employment for an estimated 8,940 people in Central Minnesota.
Of these jobs, 3,180 are with the agbioscience industry itself. Thus, the agbioscience industry
supports 5,760 jobs in other businesses in the region. Chart 7 illustrates the top 15 sectors with jobs
supported by the agbioscience industry. These impacts are driven by local expenditures and vary
depending on the types of local purchases. Indirect effects are those created through agbioscience
companies’ expenditures for goods and services. Local supply chain purchases by the agbioscience
industry highly influence the grain farming, wholesale trade, and dairy cattle and milk production
sectors. Induced effects are generated because employees of agbioscience companies spend wages
and salaries in the local economy. Health care is a major expenditure for most households; therefore,
it is not surprising to see high induced impacts in the sectors affiliated with the health care industry.
Induced effects are also noted in food services and drinking establishments sector.
Many economic impact studies show relatively high employment impacts on the food services and
drinking establishments sector. Since employment in this industry is often part-time, and in the
model, one job is one job (regardless of full or part-time status), employment impacts tend to be
higher in this particular industry.

ECONOMIC CONTRIBUTION OF AGBIOSCIENCE: CENTRAL MINNESOTA 13
Examining the sectors most affected in terms of employment is one lens through which to examine
economic contribution. As mentioned, one job is one job in the model, therefore employment effects
are often weighted towards industries that employ more part-time workers and have lower levels of
output per worker. Therefore, it is also instructive to view the sectors with the highest output
impacts. Reviewing results both by employment and output gives a fuller picture of how the
agbioscience industry affects the economy.
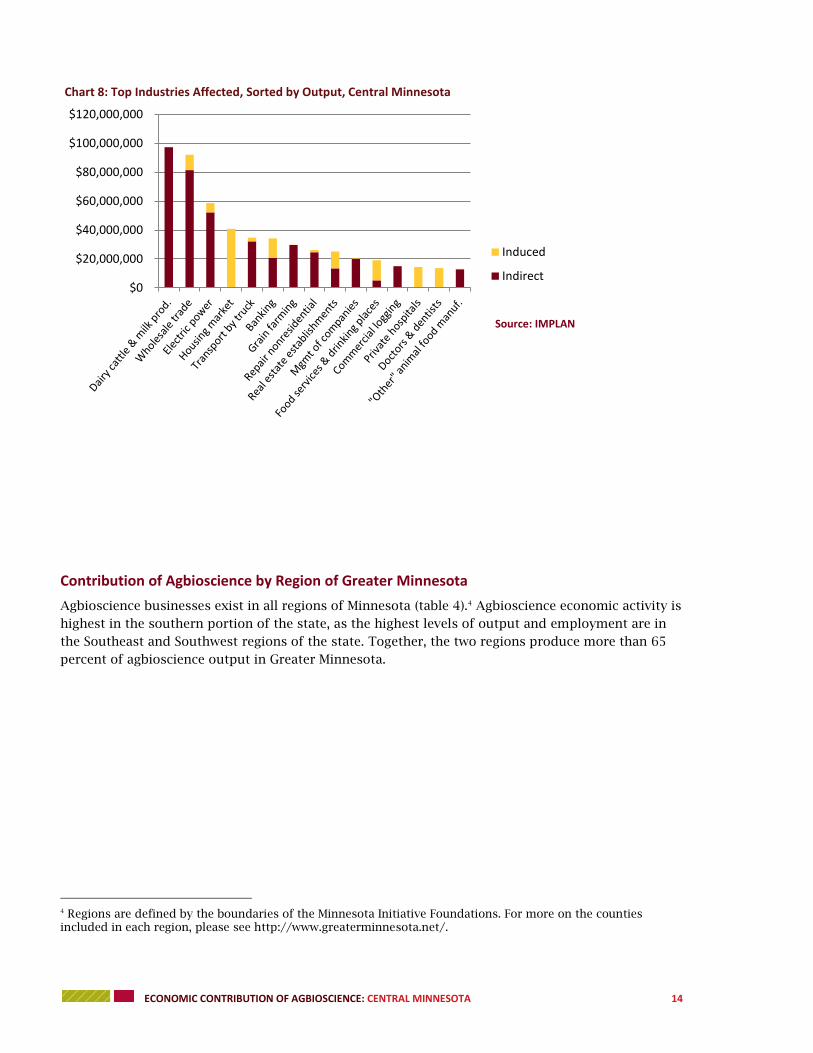
Chart 8 shows the top sectors affected, but sorted by output. Agbioscience companies contribute an
estimated $2.8 billion in economic activity to the Central region. Agbioscience companies directly
spend $2.0 billion in the region. The remainder, approximately $0.8 billion, is activity at other
businesses in the region. Activities by agbioscience companies in the region contribute most
strongly to the dairy cattle and milk production, wholesale trade, and electric power sectors.
0
100
200
300
400
500
600
Chart 7: Top Industries Affected, Sorted by Employment, Central Minnesota
Induced
Indirect
Source: IMPLAN
ECONOMIC CONTRIBUTION OF AGBIOSCIENCE: CENTRAL MINNESOTA 14
Contribution of Agbioscience by Region of Greater Minnesota
Agbioscience businesses exist in all regions of Minnesota (table 4).4 Agbioscience economic activity is
highest in the southern portion of the state, as the highest levels of output and employment are in
the Southeast and Southwest regions of the state. Together, the two regions produce more than 65
percent of agbioscience output in Greater Minnesota.
4 Regions are defined by the boundaries of the Minnesota Initiative Foundations. For more on the counties included in each region, please see http://www.greaterminnesota.net/.
$0
$20,000,000
$40,000,000
$60,000,000
$80,000,000
$100,000,000
$120,000,000
Chart 8: Top Industries Affected, Sorted by Output, Central Minnesota
Induced
Indirect
Source: IMPLAN

ECONOMIC CONTRIBUTION OF AGBIOSCIENCE: CENTRAL MINNESOTA 15
Table 4: Total Economic Contribution of Agbioscience by Region in Minnesota, 2013
Output
(millions)
Employment
(rounded)
Labor Income
(millions)
Total Regional
Output (billions)
Agbioscience Output
Percent of Total
Regional Output
Central $2,813.3 8,940 $474.0 $52.0 5.7%
Northeast $2,807.3 7,580 $478.5 $28.5 10.2%
Northwest $1,230.3 4,870 $234.8 $15.6 8.2%
Southeast $11,737.1 29,220 $1,719.6 $75.6 15.5%
Southwest $3,590.6 9,440 $554.5 $31.6 11.1%
West Central $1,199.2 3,700 $212.2 $18.9 6.4%
Total $23,377.8 63,750 $3,673.6 $222.2 10.4%
Estimates by University of Minnesota Extension
The Central region is responsible for 12 percent of Greater Minnesota’s total agbioscience output. In
comparison, the Central region is responsible for 23 percent of Greater Minnesota’s total output
from all industries.
The composition of the direct effect of the agbioscience industry also varies by region (chart 9).
Food manufacturing is a major component of the agbioscience industry in Minnesota. In Central
Minnesota, food manufacturing produces 49 percent of all agbioscience output in the region. Food
manufacturing composes a significant share of output in all regions, with the exception of the
Northeast region. The flavor of the food manufacturing industry, however, is different by region. In
the Northwest and West Central regions, beet sugar manufacturing is a significant sector, while in
the Southeast and Southwest, cheese manufacturing is a significant sector.

ECONOMIC CONTRIBUTION OF AGBIOSCIENCE: CENTRAL MINNESOTA 16
Chart 9: Top Agbioscience Sectors by Region and Percent of Regional Agbioscience Output
Chemical manufacturing is a significant sector in the Southwest, Southeast, and West Central regions
of the state. Chemical manufacturing includes ethanol production and fertilizer production.
Wood and paper product manufacturing, including wood preservation, paper mills, pulp mills, and
sawmills, is a significant sector in the Northeast, Central, and Northwest regions. In the Northeast
region, the wood and paper manufacturing sector produces the largest share of agbioscience output
in the region. In the Central region, wood and paper product manufacturing accounts for 36 percent
of agbioscience output.
For more on the composition of agbioscience by region, please see appendix 3.
Future Growth and Development of Agbioscience
The agbioscience industry in Central Minnesota is not a stagnant industry; it is expanding,
contracting, and changing. Between 2003 and 2013, the total number of jobs in agbioscience in the
region grew by 13 percent, despite the Great Recession in 2008-2009. The 2013 Battelle Technology
Partnership Practice report identified potential growth in the industry through to 2016. Growth rates
varied across the industry from a low of 5.9 percent projected growth in business related to
agricultural systems to 10.7 percent projected growth in business related to microbials. To estimate
the potential for the industry in Central Minnesota, Extension modeled a conservative 5 percent
growth rate across the industry and then a more optimistic growth rate of 10 percent across the
industry. These two growth rates are estimates based on historical growth rates in the industry and
estimates by Battelle. The growth rates are presented here for illustrative purposes.
If employment in the agbioscience industry in Central Minnesota was to grow at a rate of 5 percent
between 2014 and 2016, the total economic contribution of the industry would increase to support
an estimated $3.0 billion in output, an estimated 9,390 jobs, and an estimated $497.7 million in
labor income (table 5).
Source: IMPLAN
Food products (81%) Wood & paper (10%)
Food products (49%) Wood & paper (36%)
Food products (73%) Chemicals (17%)
Food products (64%) Chemicals (24%)
Food products (83%) Chemicals (10%)
Wood & paper (91%) Food products (4%)
ECONOMIC CONTRIBUTION OF AGBIOSCIENCE: CENTRAL MINNESOTA 17
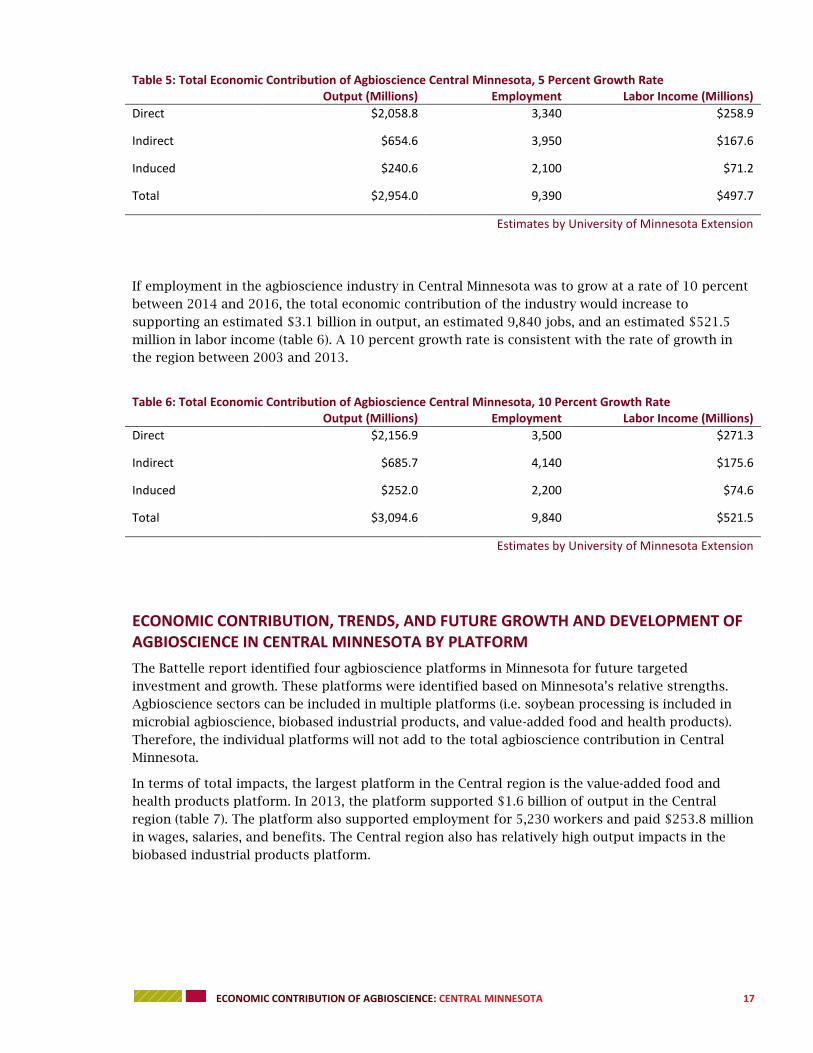
Table 5: Total Economic Contribution of Agbioscience Central Minnesota, 5 Percent Growth Rate Output (Millions) Employment Labor Income (Millions)
Direct $2,058.8 3,340 $258.9
Indirect $654.6 3,950 $167.6
Induced $240.6 2,100 $71.2
Total $2,954.0 9,390 $497.7
Estimates by University of Minnesota Extension
If employment in the agbioscience industry in Central Minnesota was to grow at a rate of 10 percent
between 2014 and 2016, the total economic contribution of the industry would increase to
supporting an estimated $3.1 billion in output, an estimated 9,840 jobs, and an estimated $521.5
million in labor income (table 6). A 10 percent growth rate is consistent with the rate of growth in
the region between 2003 and 2013.
Table 6: Total Economic Contribution of Agbioscience Central Minnesota, 10 Percent Growth Rate Output (Millions) Employment Labor Income (Millions)
Direct $2,156.9 3,500 $271.3
Indirect $685.7 4,140 $175.6
Induced $252.0 2,200 $74.6
Total $3,094.6 9,840 $521.5
Estimates by University of Minnesota Extension
ECONOMIC CONTRIBUTION, TRENDS, AND FUTURE GROWTH AND DEVELOPMENT OF AGBIOSCIENCE IN CENTRAL MINNESOTA BY PLATFORM
The Battelle report identified four agbioscience platforms in Minnesota for future targeted
investment and growth. These platforms were identified based on Minnesota’s relative strengths.
Agbioscience sectors can be included in multiple platforms (i.e. soybean processing is included in
microbial agbioscience, biobased industrial products, and value-added food and health products).
Therefore, the individual platforms will not add to the total agbioscience contribution in Central
Minnesota.
In terms of total impacts, the largest platform in the Central region is the value-added food and
health products platform. In 2013, the platform supported $1.6 billion of output in the Central
region (table 7). The platform also supported employment for 5,230 workers and paid $253.8 million
in wages, salaries, and benefits. The Central region also has relatively high output impacts in the
biobased industrial products platform.

ECONOMIC CONTRIBUTION OF AGBIOSCIENCE: CENTRAL MINNESOTA 18
Table 7: Total Economic Contribution of Agbioscience in Central Minnesota by Platform, 2013
(Note, as industries within the platforms overlap, platform totals will not equal agbioscience total) Output (Millions) Employment Labor Income (Millions)
Microbial agbioscience $169.9 765 $41.6
Resilient, efficient, & productive
agricultural systems
$277.9 1,590 $76.4
Biobased industrial products $1,088.1 3,180 $187.6
Value-added food and health products $1,613.3 5,230 $253.8
Estimates by University of Minnesota Extension
While the value-added food and health products platform is the largest platform in the region, the
microbial agbioscience platform was the fastest growing between 2003 and 2013 (table 8).
Businesses in the platform added nearly 100 jobs, increasing the number of jobs in the platform by
35 percent. The increase was driven by the growth in soil preparation, planting, and cultivating, in-
vitro diagnostic substance manufacturing, and pesticide manufacturing.
The number of jobs in three of the four platforms increased between 2003 and 2013. The resilient,
efficient, and productive agricultural systems platform increased employment by 11 percent and the
value-added food and health products platform increased by 25 percent. The number of jobs in the
biobased industrial products platform, however, declined by a modest 4 percent or 48 jobs.
Meanwhile, between 2003 and 2013, the number of jobs across all industries in Central Minnesota
grew by 7 percent.
Table 8: Change in Number of Jobs by Agbioscience Platform in Central Minnesota, 2003-2013
(Note: as industries within the platforms overlap, platform totals will not equal agbioscience total) 2003 Jobs 2013 Jobs Percent Growth Rate
Microbial agbioscience 266 360 35%
Resilient, efficient, & productive
agricultural systems
841 930 11%
Biobased industrial products 1,068 1,020 -4%
Value-added food and health products 1,485 1,850 25%
Source: EMSI
Microbial Agbioscience
The microbial agbioscience platform is based on Minnesota’s expertise in the areas related to
microbiology, genomics, ecological sciences, infectious disease, and biosecurity. It involves using
this expertise to ensure adequate food supply and food production. Battelle identified this platform
as a strength for Minnesota, due in part to Minnesota’s breadth and depth in the advancing field of
microbiology, coupled with its traditional strengths in the agricultural sciences. Included in the
definition of the microbial agbioscience platform are medicinal, botanical, and related
ECONOMIC CONTRIBUTION OF AGBIOSCIENCE: CENTRAL MINNESOTA 19
manufacturing, testing laboratories, research and development, pulp mills, and food processing
related to microbial agbioscience.5
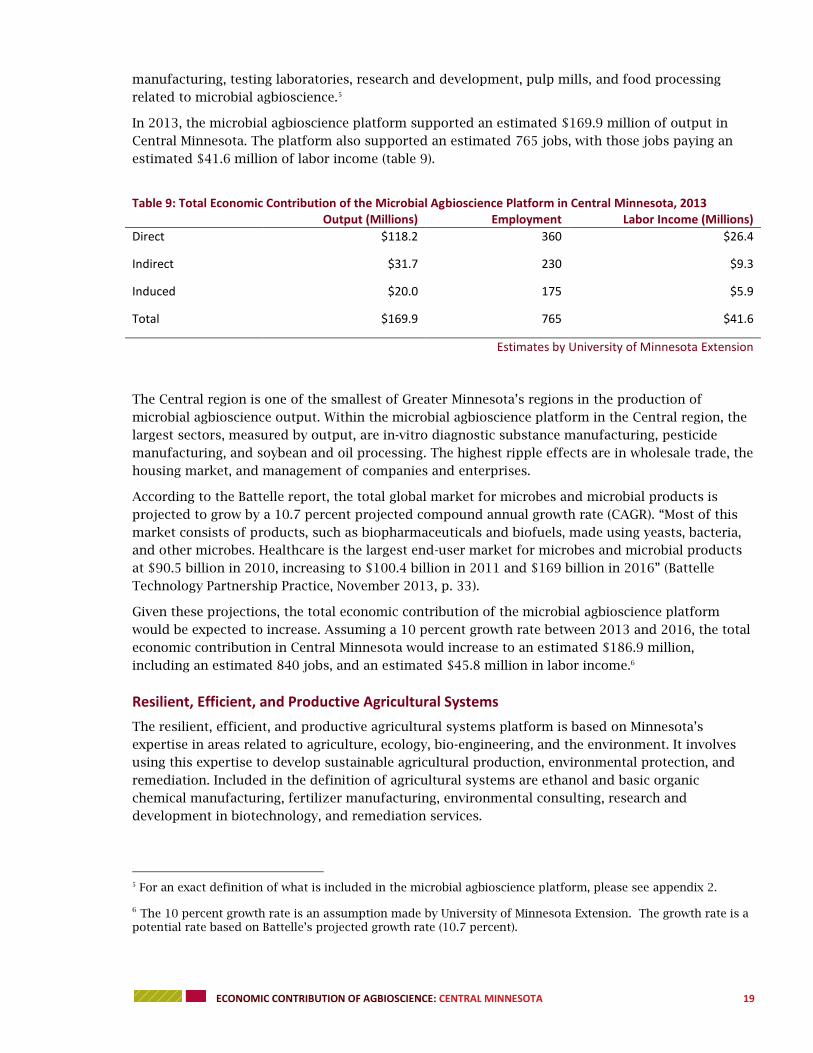
In 2013, the microbial agbioscience platform supported an estimated $169.9 million of output in
Central Minnesota. The platform also supported an estimated 765 jobs, with those jobs paying an
estimated $41.6 million of labor income (table 9).
Table 9: Total Economic Contribution of the Microbial Agbioscience Platform in Central Minnesota, 2013 Output (Millions) Employment Labor Income (Millions)
Direct $118.2 360 $26.4
Indirect $31.7 230 $9.3
Induced $20.0 175 $5.9
Total $169.9 765 $41.6
Estimates by University of Minnesota Extension
The Central region is one of the smallest of Greater Minnesota’s regions in the production of
microbial agbioscience output. Within the microbial agbioscience platform in the Central region, the
largest sectors, measured by output, are in-vitro diagnostic substance manufacturing, pesticide
manufacturing, and soybean and oil processing. The highest ripple effects are in wholesale trade, the
housing market, and management of companies and enterprises.
According to the Battelle report, the total global market for microbes and microbial products is
projected to grow by a 10.7 percent projected compound annual growth rate (CAGR). “Most of this
market consists of products, such as biopharmaceuticals and biofuels, made using yeasts, bacteria,
and other microbes. Healthcare is the largest end-user market for microbes and microbial products
at $90.5 billion in 2010, increasing to $100.4 billion in 2011 and $169 billion in 2016” (Battelle
Technology Partnership Practice, November 2013, p. 33).
Given these projections, the total economic contribution of the microbial agbioscience platform
would be expected to increase. Assuming a 10 percent growth rate between 2013 and 2016, the total
economic contribution in Central Minnesota would increase to an estimated $186.9 million,
including an estimated 840 jobs, and an estimated $45.8 million in labor income.6
Resilient, Efficient, and Productive Agricultural Systems
The resilient, efficient, and productive agricultural systems platform is based on Minnesota’s
expertise in areas related to agriculture, ecology, bio-engineering, and the environment. It involves
using this expertise to develop sustainable agricultural production, environmental protection, and
remediation. Included in the definition of agricultural systems are ethanol and basic organic
chemical manufacturing, fertilizer manufacturing, environmental consulting, research and
development in biotechnology, and remediation services.
5 For an exact definition of what is included in the microbial agbioscience platform, please see appendix 2.
6 The 10 percent growth rate is an assumption made by University of Minnesota Extension. The growth rate is a potential rate based on Battelle’s projected growth rate (10.7 percent).

ECONOMIC CONTRIBUTION OF AGBIOSCIENCE: CENTRAL MINNESOTA 20
In 2013, the resilient, efficient, and productive agricultural systems platform supported an
estimated $277.9 million of output in Central Minnesota. The platform also supported an estimated
1,590 jobs, with those jobs paying an estimated $76.4 million of labor income (table 10).
Table 10: Total Economic Contribution of the Resilient, Efficient, and Productive Agricultural Systems Platform in Central Minnesota, 2013 Output (Millions) Employment Labor Income (Millions)
Direct $197.4 930 $52.4
Indirect $43.7 340 $13.1
Induced $36.8 320 $10.9
Total $277.9 1,590 $76.4
Estimates by University of Minnesota Extension
Compared to other regions, the Central region has a modest percentage of total output in the
resilient, efficient, and productive agricultural systems platform. Within the Central region, the
largest sectors in the agricultural systems platform (measured by output) are farm suppliers
wholesalers and ethanol manufacturing. The largest ripple effects are in the housing market,
wholesale trade, and banking.
According to the Battelle report, the resilient, efficient, and productive agricultural systems platform
in North America, the “market is forecasted to grow at a compound annual growth rate of 7.7
percent” (Battelle Technology Partnership Practice, November 2013, p. 42). Markets in the rest of the
world are expected to grow by a compound growth rate of 10 percent.
If the forecasted 10 percent growth rate occurs, the economic contribution of the resilient, efficient,
and productive agricultural systems platform would increase to an estimated $305.7 million of
output, including 1,750 jobs and $84.0 million in labor income.7
Biobased Industrial Products
This platform is based on Minnesota’s history of engaging in research and development related to
bioproducts, particularly the expertise in examining the economics and market feasibility of
agricultural and forestry products. It involves using this expertise to expand the ability of Minnesota
companies to add value to agricultural and forestry products including biofuels, biobased materials
and chemicals, and forestry co-products. Included in the definition of biobased industrial products
are food processing (especially around fats and oils), wood product manufacturing (i.e. wood
products, paper mills), chemical manufacturing (especially around ethanol), and fertilizer
manufacturing.
In 2013, the biobased industrial products platform supported $1.1 billion of output in Central
Minnesota. The platform also supported 3,180 jobs, with those jobs paying $187.6 million in labor
income (table 11).
7 The 10 percent growth rate is an assumption made by University of Minnesota Extension. The growth rate is a potential rate based on Battelle’s projected growth rates (7.7 to 10 percent).

ECONOMIC CONTRIBUTION OF AGBIOSCIENCE: CENTRAL MINNESOTA 21
Table 11: Total Economic Contribution of the Biobased Industrial Products Platform in Central Minnesota, 2013 Output (Millions) Employment Labor Income (Millions)
Direct $779.0 1,020 $95.6
Indirect $218.2 1,370 $65.1
Induced $90.9 790 $26.9
Total $1,088.1 3,180 $187.6
Estimates by University of Minnesota Extension
The Central, Northeast, and Southwest regions all have significant levels of output in the platform
(more than $1 billion in each region), but the Southeast region is the largest source of output. In the
Central region, paper mills and paperboard mills are major sources within the biobased industrial
products platform. The largest ripple effects are in electric power and wholesale trade.
The Battelle report identifies two primary market components of the biobased industrial products
platform, biomaterials and biofuels. The biomaterials market has been growing in the United States,
and demand for biomaterial is expected to post a yearly growth of 6.9 percent, according to Battelle.
As noted, the biofuels market suffered during the Great Recession. The Battelle analysis indicates
overall demand will increase by approximately 3 percent, but the market value is expected to decline.
Given the forecasts provided by Battelle and the overall decline in the number of jobs in the
platform, a growth rate of 5 percent between 2013 and 2016 appears to be reasonable.
If the rate of growth of 5 percent occurs, the economic contribution of the biobased industrial
products platform would increase to $1.14 billion of output, including 3,340 jobs and $197.0 million
in labor income.8
Value-Added Food and Health Products
This platform is based on Minnesota’s strength in agricultural value-added, particularly around food.
Minnesota is a strong competitor in the food processing manufacturing industry. It involves
expanding the historic core competencies of food manufacturing in Minnesota to new markets
focused on health and nutrition, including nutritional supplements. Included in the definition of
value-added food and health products are major food manufacturing industries (flour, rice, corn
milling, soybeans and oilseeds, breakfast cereal, beets, vegetables and fruits, cheese and butter,
spices and extracts, and wineries and breweries), along with some medicinal and botanical
manufacturing, and research and development in biotechnology.
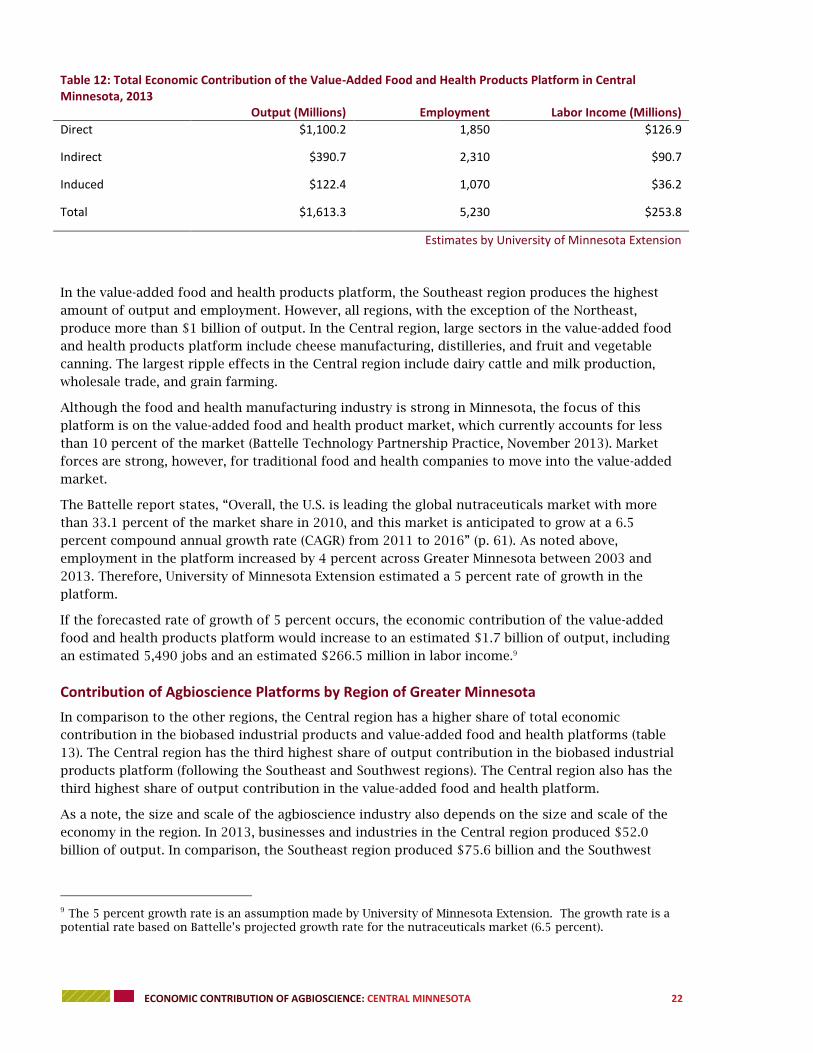
In 2013, the value-added food and health products platform supported an estimated $1.6 billion in
output in Central Minnesota, including an estimated $253.8 million in labor income and 5,230 jobs
(table 12).
8 The 5 percent growth rate is an assumption made by University of Minnesota Extension. The growth rate is a potential rate based on Battelle’s projected growth rate (3 to 6.9 percent).
ECONOMIC CONTRIBUTION OF AGBIOSCIENCE: CENTRAL MINNESOTA 22
Table 12: Total Economic Contribution of the Value-Added Food and Health Products Platform in Central Minnesota, 2013 Output (Millions) Employment Labor Income (Millions)
Direct $1,100.2 1,850 $126.9
Indirect $390.7 2,310 $90.7
Induced $122.4 1,070 $36.2
Total $1,613.3 5,230 $253.8
Estimates by University of Minnesota Extension
In the value-added food and health products platform, the Southeast region produces the highest
amount of output and employment. However, all regions, with the exception of the Northeast,
produce more than $1 billion of output. In the Central region, large sectors in the value-added food
and health products platform include cheese manufacturing, distilleries, and fruit and vegetable
canning. The largest ripple effects in the Central region include dairy cattle and milk production,
wholesale trade, and grain farming.
Although the food and health manufacturing industry is strong in Minnesota, the focus of this
platform is on the value-added food and health product market, which currently accounts for less
than 10 percent of the market (Battelle Technology Partnership Practice, November 2013). Market
forces are strong, however, for traditional food and health companies to move into the value-added
market.
The Battelle report states, “Overall, the U.S. is leading the global nutraceuticals market with more
than 33.1 percent of the market share in 2010, and this market is anticipated to grow at a 6.5
percent compound annual growth rate (CAGR) from 2011 to 2016” (p. 61). As noted above,
employment in the platform increased by 4 percent across Greater Minnesota between 2003 and
2013. Therefore, University of Minnesota Extension estimated a 5 percent rate of growth in the
platform.
If the forecasted rate of growth of 5 percent occurs, the economic contribution of the value-added
food and health products platform would increase to an estimated $1.7 billion of output, including
an estimated 5,490 jobs and an estimated $266.5 million in labor income.9
Contribution of Agbioscience Platforms by Region of Greater Minnesota
In comparison to the other regions, the Central region has a higher share of total economic
contribution in the biobased industrial products and value-added food and health platforms (table
13). The Central region has the third highest share of output contribution in the biobased industrial
products platform (following the Southeast and Southwest regions). The Central region also has the
third highest share of output contribution in the value-added food and health platform.
As a note, the size and scale of the agbioscience industry also depends on the size and scale of the
economy in the region. In 2013, businesses and industries in the Central region produced $52.0
billion of output. In comparison, the Southeast region produced $75.6 billion and the Southwest
9 The 5 percent growth rate is an assumption made by University of Minnesota Extension. The growth rate is a potential rate based on Battelle’s projected growth rate for the nutraceuticals market (6.5 percent).
ECONOMIC CONTRIBUTION OF AGBIOSCIENCE: CENTRAL MINNESOTA 23
region produced $31.6 billion.
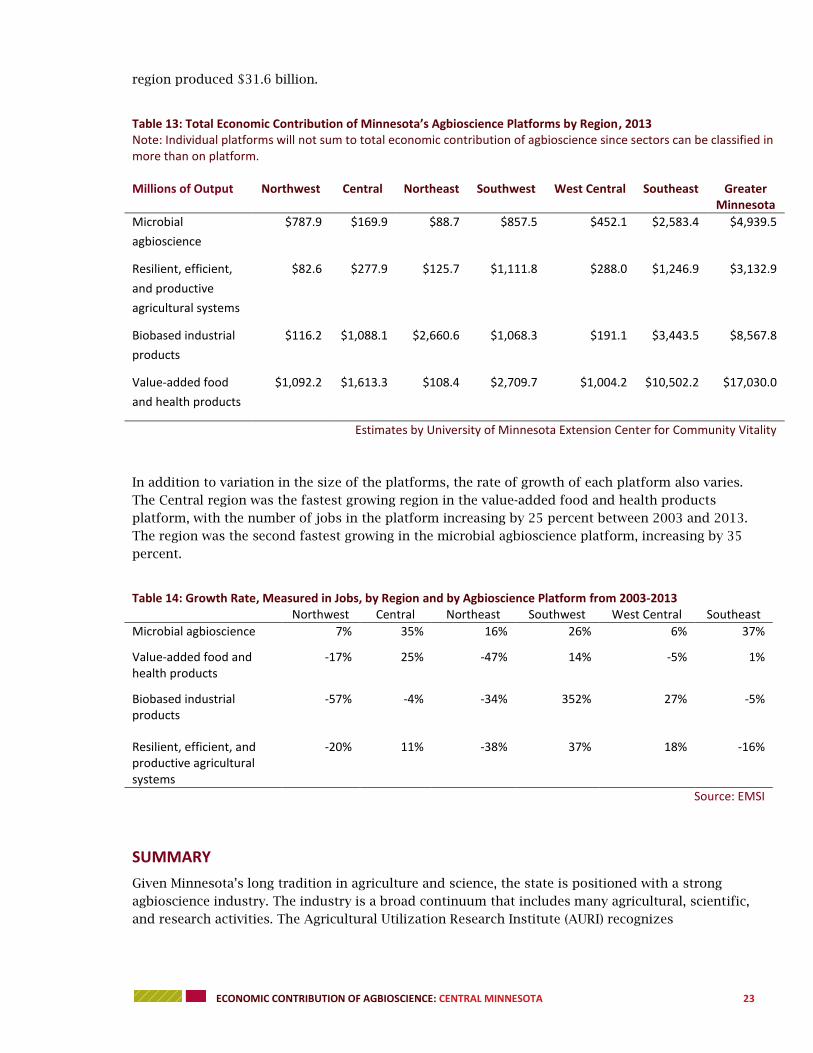
Table 13: Total Economic Contribution of Minnesota’s Agbioscience Platforms by Region, 2013 Note: Individual platforms will not sum to total economic contribution of agbioscience since sectors can be classified in more than on platform. Millions of Output Northwest Central Northeast Southwest West Central Southeast Greater
Minnesota
Microbial
agbioscience
$787.9 $169.9 $88.7 $857.5 $452.1 $2,583.4 $4,939.5
Resilient, efficient,
and productive
agricultural systems
$82.6 $277.9 $125.7 $1,111.8 $288.0 $1,246.9 $3,132.9
Biobased industrial
products
$116.2 $1,088.1 $2,660.6 $1,068.3 $191.1 $3,443.5 $8,567.8
Value-added food
and health products
$1,092.2 $1,613.3 $108.4 $2,709.7 $1,004.2 $10,502.2 $17,030.0
Estimates by University of Minnesota Extension Center for Community Vitality
In addition to variation in the size of the platforms, the rate of growth of each platform also varies.
The Central region was the fastest growing region in the value-added food and health products
platform, with the number of jobs in the platform increasing by 25 percent between 2003 and 2013.
The region was the second fastest growing in the microbial agbioscience platform, increasing by 35
percent.
Table 14: Growth Rate, Measured in Jobs, by Region and by Agbioscience Platform from 2003-2013 Northwest Central Northeast Southwest West Central Southeast
Microbial agbioscience 7% 35% 16% 26% 6% 37%
Value-added food and health products
-17% 25% -47% 14% -5% 1%
Biobased industrial products
-57% -4% -34% 352% 27% -5%
Resilient, efficient, and productive agricultural systems
-20% 11% -38% 37% 18% -16%
Source: EMSI
SUMMARY
Given Minnesota’s long tradition in agriculture and science, the state is positioned with a strong
agbioscience industry. The industry is a broad continuum that includes many agricultural, scientific,
and research activities. The Agricultural Utilization Research Institute (AURI) recognizes
ECONOMIC CONTRIBUTION OF AGBIOSCIENCE: CENTRAL MINNESOTA 24
agbioscience’s importance in the state’s economy. In 2013, AURI partnered, along with the
Minnesota Corn Research and Promotion Council and the Minnesota Soybean Research and
Promotion Council, with Battelle Technology Partnership Practice (Battelle) to explore the
agbioscience industry in Minnesota. Battelle identified four platforms of Minnesota’s agbioscience
industry for further development and investment. While the Battelle report defines agbioscience and
focuses on the four platforms, the analysis was on a statewide level. AURI then contracted with
University of Minnesota Extension to explore the economic contribution of the industry and the four
platforms in each of the six regions. The goal of this analysis is to help regional stakeholders and
decision makers understand their region’s role in the industry. The project was funded by the
Initiative Foundation, the Northwest Minnesota Foundation, West Central Initiative, Southwest
Initiative Foundation, and the Southern Minnesota Initiative Foundation. This report focuses on the
Central region of Minnesota, as defined by the boundaries of the Initiative Foundation region.
The agbioscience industry contributes significantly to the economy of Central Minnesota. In 2013,
the total economic contribution of the agbioscience industry was an estimated $2.8 billion in Central
Minnesota. Through its impacts across all industries, agbioscience supported an estimated 8,940
jobs that paid $474.0 million in income to workers in the region.
In Central Minnesota, the agbioscience industry is dominated by food processing and wood and
paper product manufacturing. Large sectors within the food processing industry include cheese
manufacturing, distilleries, and fruit and vegetable canning. Wood and paper product manufacturing,
primarily paper mills and paperboard mills, is also a significant portion of the agbioscience industry
in the region. Growing agbioscience sectors in the region include fruit and vegetable canning,
distilleries, and paper mills. These sectors have added jobs in the past 10 years and have done so at
rates faster than expected, given national and industry trends. Engineered wood member (except
truss) manufacturing, hardwood veneer and plywood manufacturing, and cheese manufacturing are
agbioscience sectors that shed jobs between 2003 and 2013.
Directly, agbioscience companies in the Central region employ 3,180 individuals. The companies
produce $2.0 billion in economic activity, including compensation to workers of $246.6 million. The
average annual compensation per agbioscience employee is approximately $78,000.
The $2.0 billion of output represents approximately 4 percent of all economic activity in the region.
In addition to the sales from agbioscience industries, production agriculture also generates output
in the region. Production agriculture, which falls outside the agbioscience category, recorded sales of
$3.0 billion or about 6 percent of all sales in the region. The Central region is responsible for 12
percent of Greater Minnesota’s agbioscience output.
Indirectly, industries with strong ties to agriculture and manufacturing are most affected by the
agbioscience industry in Central Minnesota. The related industries benefiting most from include
wholesale trade, grain farming, dairy cattle and milk production, and electric power.
During the past 10 years, the agbioscience industry in Central Minnesota has grown by 13 percent. If
that trend continues with a 10 percent increase between 2013 and 2016, the economic contribution
of the agbioscience industry in the region will increase to an estimated $3.1 billion in output, an
estimated 9,840 jobs, and an estimated $521.5 million in labor income.
Of the four platforms, the value-added food and health products platform is largest in the Central
region. In 2013, the platform supported an estimated $1.6 billion of economic activity, including an
estimated 5,230 jobs. This platform is based on Minnesota’s strength in agricultural value-added,
particularly around food. The platform involves expanding on historic core competencies of food

ECONOMIC CONTRIBUTION OF AGBIOSCIENCE: CENTRAL MINNESOTA 25
manufacturing in Minnesota to new markets focused on health and nutrition, including nutritional
supplements.
The fastest growing platform in the Central region was the microbial agbioscience platform, which
grew by 35 percent between 2003 and 2013. The microbial agbioscience platform supported an
estimated $169.9 million of output in Central Minnesota in 2013. The platform also supported an
estimated 765 jobs. The microbial agbioscience platform is based on Minnesota’s expertise in the
areas related to microbiology, genomics, ecological sciences, infectious disease, and biosecurity. It
involves using this expertise to ensure adequate food supply and food production.
In conclusion, the Central region is one component of the agbioscience industry in Greater
Minnesota. It is currently strongest in the value-added food and health platform and the biobased
industrial products platform. The region clearly will be important in the future growth and
development of the industry, particularly in the realm of microbial agbioscience. The region has a
strong base of wood and paper product manufacturing and food manufacturing on which to grow.
APPENDIX 1: METHODOLOGY
Input-Output Models
Special models, called input-output models, exist to conduct economic impact analysis. There are
several input-output models available. IMPLAN (IMpact Analysis for PLANning from the Minnesota
IMPLAN Group)10 is one such model. Many economists use IMPLAN for economic contribution
analysis because it can measure output and employment impacts, is available on a county-by-county
basis, and is flexible for the user. IMPLAN has some limitations and qualifications, but it is one of
the best tools available to economists for input-output modeling. Understanding the IMPLAN tool, its
capabilities, and its limitations will help ensure the best results from the model.
One of the most critical aspects of understanding economic impact analysis is the distinction
between the “local” and “non-local” economy. The local economy is identified as part of the model-
building process. Either the group requesting the study or the analyst defines the local area.
Typically, the study area (the local economy) is a county or a group of counties that share economic
linkages.
A few definitions are essential in order to properly read the results of an IMPLAN analysis. The
terms and their definitions are provided below.
Output: Output is measured in dollars and is equivalent to total sales. The output measure can include significant “double counting.” Think of corn, for example. The value of the corn is counted when it is sold to the mill, again when it is sold to the dairy farmer, again as part of the price of fluid milk, and yet again when it is sold as cheese. The value of corn is built into the price of each of these items, and then the sale of each of item is added to get total sales (or output).
Employment: Employment includes full and part-time workers and is measured in annual average jobs, not full-time equivalents (FTEs). IMPLAN includes total wage and salaried employees, as well as the self-employed in employment estimates. Because employment is measured in jobs and not in dollar values, it tends to be a very stable metric.
Labor Income: Labor income measures the value added to the product by the labor component. So in the corn example, when the corn is sold to the mill, a certain percentage of the sale goes to the farmer for his/her labor. Then when the mill sells the corn as feed to
10 IMPLAN Version 3.0 was used in this analysis. The trade flows model with SAM multipliers was implemented.

ECONOMIC CONTRIBUTION OF AGBIOSCIENCE: CENTRAL MINNESOTA 26
dairy farmers, it includes some markup for its labor costs in the price. When dairy farmers sell the milk to the cheese manufacturer, they include a value for their labor. These individual value increments for labor can be measured, which amounts to labor income. Labor income does not include double counting.
Direct Impact: Direct impact is equivalent to the initial activity in the economy. In this study, it is employment and output of agbioscience companies in the central region of Minnesota.
Indirect Impact: The indirect impact is the summation of changes in the local economy that occur due to spending for inputs (goods and services) by the industry or industries directly impacted. For instance, if employment in a manufacturing plant increases by 100 jobs, this implies a corresponding increase in output by the plant. As the plant increases output, it must also purchase more inputs, such as electricity, steel, and equipment. As the plant increases purchases of these items, its suppliers must also increase production, and so forth. As these ripples move through the economy, they can be captured and measured. Ripples related to the purchase of goods and services are indirect impacts. In this study, indirect impacts are those associated with spending by agbioscience companies for their supplies and inputs.
Induced Impact: The induced impact is the summation of changes in the local economy that occur due to spending by labor. For instance, if employment in a manufacturing plant increases by 100 jobs, the new employees will have more money to spend to purchase housing, buy groceries, and go out to dinner. As they spend their new income, more activity occurs in the local economy. Induced impacts also include spending by labor generated by indirect impacts. So, if the bio-based businesses purchase services from a local tax preparer, spending of the tax preparer’s wages would also create induced impacts. Primarily, in this study, the induced impacts are those economic changes related to spending by employees of agbioscience companies in the region.
Total Impact: The total impact is the summation of the direct, indirect, and induced impacts.
Quarterly Census of Employment and Wages (QCEW)
The Quarterly Census of Employment and Wages (QCEW) is a national dataset maintained by the
Bureau of Labor Statistics. In Minnesota, the data is collected by the Department of Employment and
Economic Development (DEED). Each quarter, businesses that are covered by the Unemployment
Insurance Program are required to report their total payroll and the number of employees to DEED.
The data is then aggregated by business classification code and geographic location. The QCEW
database is one of the most robust and current sets of data available, covering about 97 percent of
all workers in the state. The database, however, has drawbacks, including the fact that the self-
employed are not included in the numbers. Agriculture is one group often under-represented in the
data.
Shift-Share Analysis
The results of shift-share analysis are presented in this report. Shift-share analysis is a powerful tool
for understanding the drivers of economic change in an industry. Shift-share analysis parses
economic change (here employment changes) into three components: national growth, industrial mix,
and competitive share.
National Growth: National growth indicates how many jobs a local economy would have gained (or lost) as a result of the growth (or decline) of employment at the national level. For example, consider a local economy with 100,000 jobs at the beginning of the time period. If during the period under consideration, the number of jobs in the United States grew by a rate of 2 percent, then at the end of the time period under consideration, the local economy would be expected to have 102,000 jobs.

ECONOMIC CONTRIBUTION OF AGBIOSCIENCE: CENTRAL MINNESOTA 27
Industrial Mix: Industrial mix indicates how many jobs a particular industry within the local economy would have gained (or lost) if the local industry grew (or declined) at a rate similar to the industry as a whole in the United States. For example, if 1,000 people were employed in the finance industry in the local economy at the beginning of the period, and the finance industry as a whole in the U.S. grew at a rate of 10 percent, then at the end of the time period under consideration, the local finance industry would be expected to have 1,100 jobs.
Competitive Share: Competitive share is the remainder of change in employment for the region examined. From our example, region’s employment should have grown by 2,100 jobs, looking at overall national growth and then growth in the finance industry itself. If the local economy actually grew by 3,100 jobs in the finance industry, then 1,000 jobs were added because the local economy grew faster than expected, given national and industry trends. Conversely, if the local economy grew by only 1,000 jobs, then the economy was not as competitive as it should have been, given national and industry trends.
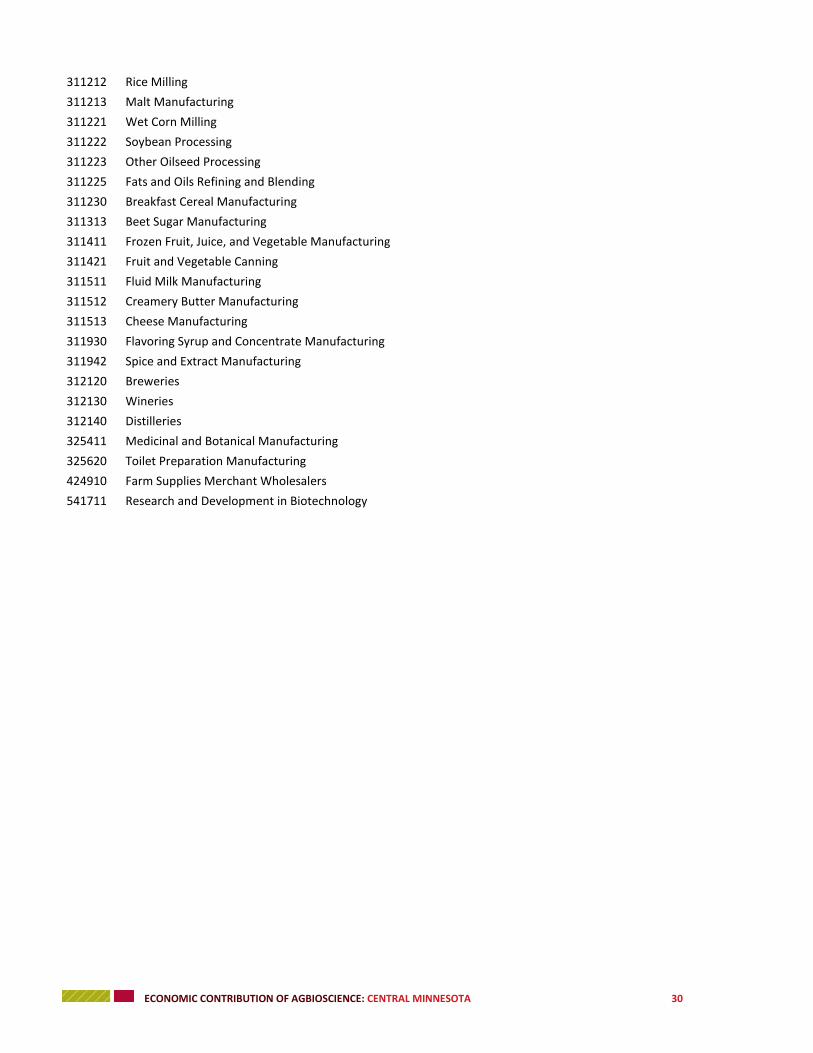
APPENDIX 2: DEFINITION OF AGBIOSCIENCE WITH NAICS CODES
This section lists the sectors defined as the agbioscience industry, along with the definition of each
of the platforms. The industries included in the definition are based on research by the Battelle
Technology Partnership Practice. The findings were published in in the 2013 document
“Agbioscience as a Development Driver: Minnesota’s Agbioscience Strategy.” Find the study here:
(http://www.auri.org/assets/2013/12/Minnesotas+Agbioscience+Strategy+-+Final+Report-1.pdf).
Table A1: All Agbioscience Sectors and NAICS Codes
115112 Soil Preparation, Planting, and Cultivating
311211 Flour Milling
311212 Rice Milling
311213 Malt Manufacturing
311221 Wet Corn Milling
311222 Soybean Processing
311223 Other Oilseed Processing
311225 Fats and Oils Refining and Blending
311230 Breakfast Cereal Manufacturing
311313 Beet Sugar Manufacturing
311411 Frozen Fruit, Juice, and Vegetable Manufacturing
311421 Fruit and Vegetable Canning
311511 Fluid Milk Manufacturing
311512 Creamery Butter Manufacturing
311513 Cheese Manufacturing
311930 Flavoring Syrup and Concentrate Manufacturing
311942 Spice and Extract Manufacturing
312120 Breweries
312130 Wineries
312140 Distilleries
321113 Sawmills
321114 Wood Preservation

ECONOMIC CONTRIBUTION OF AGBIOSCIENCE: CENTRAL MINNESOTA 28
321211 Hardwood Veneer and Plywood Manufacturing
321212 Softwood Veneer and Plywood Manufacturing
321213 Engineered Wood Member (except Truss) Manufacturing
321219 Reconstituted Wood Product Manufacturing
321912 Cut Stock, Resawing Lumber, and Planing
322110 Pulp Mills
322121 Paper (except Newsprint) Mills
322122 Newsprint Mills
322130 Paperboard Mills
325191 Gum and Wood Chemical Manufacturing
325193 Ethyl Alcohol Manufacturing
325199 All Other Basic Organic Chemical Manufacturing
325211 Plastics Material and Resin Manufacturing
325212 Synthetic Rubber Manufacturing
325221 Cellulosic Organic Fiber Manufacturing
325222 Noncellulosic Organic Fiber Manufacturing
325311 Nitrogenous Fertilizer Manufacturing
325312 Phosphatic Fertilizer Manufacturing
325314 Fertilizer (Mixing Only) Manufacturing
325320 Pesticide and Other Agricultural Chemical Manufacturing
325411 Medicinal and Botanical Manufacturing
325413 In-Vitro Diagnostic Substance Manufacturing
325414 Biological Product (except Diagnostic) Manufacturing
325620 Toilet Preparation Manufacturing
424910 Farm Supplies Merchant Wholesalers
541380 Testing Laboratories
541620 Environmental Consulting Services
541711 Research and Development in Biotechnology
562910 Remediation Services
Table A2: Microbial Agbioscience Platform Sectors and NAICS Codes
115112 Soil Preparation, Planting, and Cultivating
311222 Soybean Processing
311223 Other Oilseed Processing
311225 Fats and Oils Refining and Blending
311313 Beet Sugar Manufacturing
322110 Pulp Mills
325320 Pesticide and Other Agricultural Chemical Manufacturing
325411 Medicinal and Botanical Manufacturing
325413 In-Vitro Diagnostic Substance Manufacturing
325414 Biological Product (except Diagnostic) Manufacturing
541380 Testing Laboratories

ECONOMIC CONTRIBUTION OF AGBIOSCIENCE: CENTRAL MINNESOTA 29
541711 Research and Development in Biotechnology
562910 Remediation Services
Table A3: Resilient, Efficient, and Productive Agricultural Systems Platform Sectors and NAICS Codes
115112 Soil Preparation, Planting, and Cultivating
325193 Ethyl Alcohol Manufacturing
325199 All Other Basic Organic Chemical Manufacturing
325311 Nitrogenous Fertilizer Manufacturing
325312 Phosphatic Fertilizer Manufacturing
325314 Fertilizer (Mixing Only) Manufacturing
424910 Farm Supplies Merchant Wholesalers
541620 Environmental Consulting Services
541711 Research and Development in Biotechnology
562910 Remediation Services
Table A4: Biobased Industrial Products Platform Sectors and NAICS Codes
311222 Soybean Processing
311223 Other Oilseed Processing
311225 Fats and Oils Refining and Blending
321113 Sawmills
321114 Wood Preservation
321211 Hardwood Veneer and Plywood Manufacturing
321212 Softwood Veneer and Plywood Manufacturing
321213 Engineered Wood Member (except Truss) Manufacturing
321219 Reconstituted Wood Product Manufacturing
321912 Cut Stock, Resawing Lumber, and Planing
322110 Pulp Mills
322121 Paper (except Newsprint) Mills
322122 Newsprint Mills
322130 Paperboard Mills
325191 Gum and Wood Chemical Manufacturing
325193 Ethyl Alcohol Manufacturing
325199 All Other Basic Organic Chemical Manufacturing
325211 Plastics Material and Resin Manufacturing
325212 Synthetic Rubber Manufacturing
325221 Cellulosic Organic Fiber Manufacturing
325222 Noncellulosic Organic Fiber Manufacturing
325314 Fertilizer (Mixing Only) Manufacturing
541711 Research and Development in Biotechnology
Table A5: Value-Added Food and Health Platform Sectors and NAICS Codes
311211 Flour Milling
ECONOMIC CONTRIBUTION OF AGBIOSCIENCE: CENTRAL MINNESOTA 30
311212 Rice Milling
311213 Malt Manufacturing
311221 Wet Corn Milling
311222 Soybean Processing
311223 Other Oilseed Processing
311225 Fats and Oils Refining and Blending
311230 Breakfast Cereal Manufacturing
311313 Beet Sugar Manufacturing
311411 Frozen Fruit, Juice, and Vegetable Manufacturing
311421 Fruit and Vegetable Canning
311511 Fluid Milk Manufacturing
311512 Creamery Butter Manufacturing
311513 Cheese Manufacturing
311930 Flavoring Syrup and Concentrate Manufacturing
311942 Spice and Extract Manufacturing
312120 Breweries
312130 Wineries
312140 Distilleries
325411 Medicinal and Botanical Manufacturing
325620 Toilet Preparation Manufacturing
424910 Farm Supplies Merchant Wholesalers
541711 Research and Development in Biotechnology

ECONOMIC CONTRIBUTION OF AGBIOSCIENCE: CENTRAL MINNESOTA 31
APPENDIX 3: COMPOSITION OF AGBIOSCIENCE OUTPUT BY REGION
Food manu. 48.8%
Wood and paper 36.1%
Chemicals 4.9%
Medical products 2.7%
Farm wholesale 6.6%
Scientific and technical services
0.8%
Chart A1: Agbioscience Output by Industry, Central Minnesota
Food manu. 4.0%
Wood and paper 90.8%
Chemicals 3.9%
Scientific and technical services
1.3%
Chart A2: Agbioscience Output by Industry, Northeast Minnesota
Source: IMPLAN

ECONOMIC CONTRIBUTION OF AGBIOSCIENCE: CENTRAL MINNESOTA 32
Food manu. 80.7%
Wood and paper 9.9%
Chemicals 2.6%
Farm wholesale 6.5%
Chart A3: Agbioscience Output by Industry, Northwest Minnesota
Food manu. 83.2%
Wood & paper 0.4%
Chemicals 9.6%
Medical products 2.5%
Farm Wholesale 3.5% Scientific & tech
services 0.9%
Chart A4: Agbioscience Output by Industry, Southeast Minnesota
Source: IMPLAN
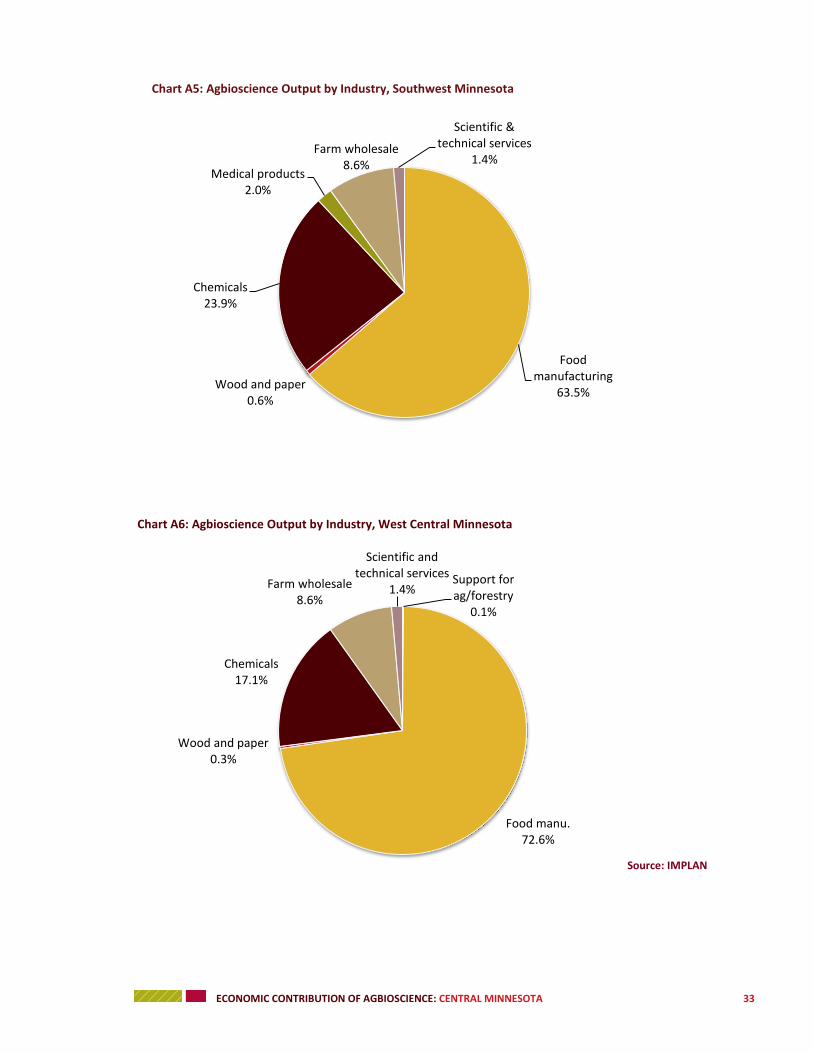
ECONOMIC CONTRIBUTION OF AGBIOSCIENCE: CENTRAL MINNESOTA 33
Food manufacturing
63.5% Wood and paper
0.6%
Chemicals 23.9%
Medical products 2.0%
Farm wholesale 8.6%
Scientific & technical services
1.4%
Chart A5: Agbioscience Output by Industry, Southwest Minnesota
Support for ag/forestry
0.1%
Food manu. 72.6%
Wood and paper 0.3%
Chemicals 17.1%
Farm wholesale 8.6%
Scientific and technical services
1.4%
Chart A6: Agbioscience Output by Industry, West Central Minnesota
Source: IMPLAN
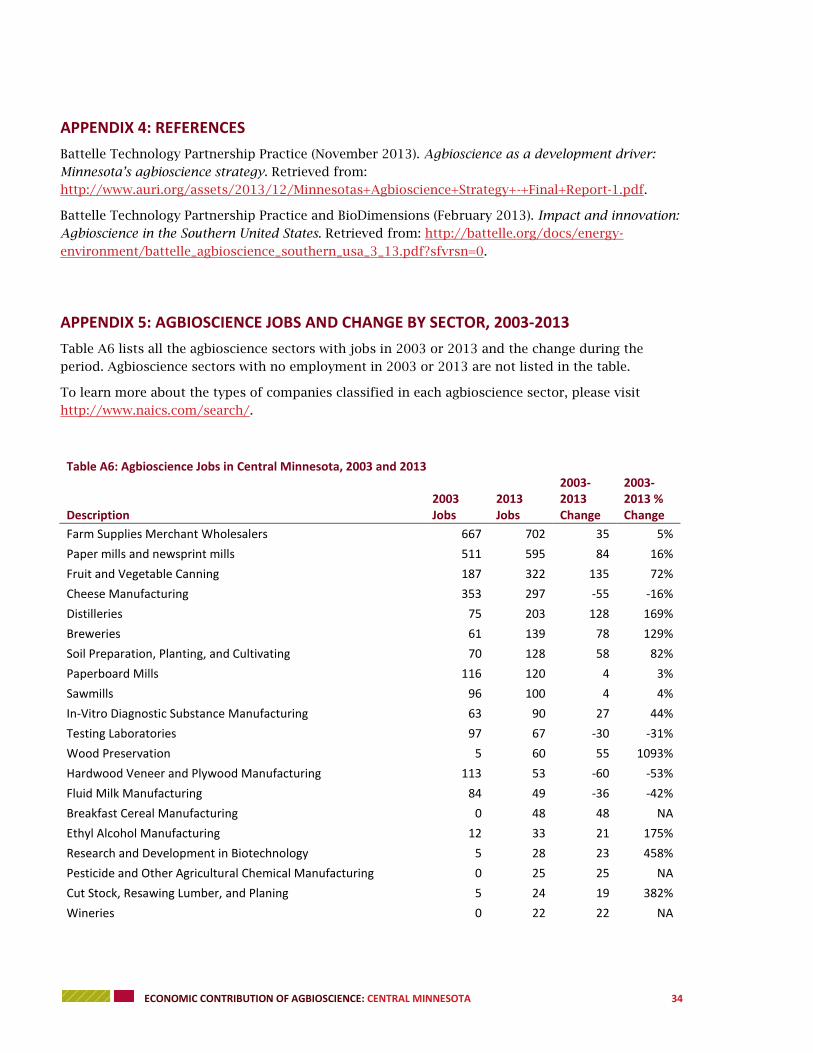
ECONOMIC CONTRIBUTION OF AGBIOSCIENCE: CENTRAL MINNESOTA 34
APPENDIX 4: REFERENCES
Battelle Technology Partnership Practice (November 2013). Agbioscience as a development driver:
Minnesota’s agbioscience strategy. Retrieved from:
http://www.auri.org/assets/2013/12/Minnesotas+Agbioscience+Strategy+-+Final+Report-1.pdf.
Battelle Technology Partnership Practice and BioDimensions (February 2013). Impact and innovation:
Agbioscience in the Southern United States. Retrieved from: http://battelle.org/docs/energy-
environment/battelle_agbioscience_southern_usa_3_13.pdf?sfvrsn=0.
APPENDIX 5: AGBIOSCIENCE JOBS AND CHANGE BY SECTOR, 2003-2013
Table A6 lists all the agbioscience sectors with jobs in 2003 or 2013 and the change during the
period. Agbioscience sectors with no employment in 2003 or 2013 are not listed in the table.
To learn more about the types of companies classified in each agbioscience sector, please visit
http://www.naics.com/search/.
Table A6: Agbioscience Jobs in Central Minnesota, 2003 and 2013
Description 2003 Jobs
2013 Jobs
2003-2013 Change
2003-2013 % Change
Farm Supplies Merchant Wholesalers 667 702 35 5%
Paper mills and newsprint mills 511 595 84 16%
Fruit and Vegetable Canning 187 322 135 72%
Cheese Manufacturing 353 297 -55 -16%
Distilleries 75 203 128 169%
Breweries 61 139 78 129%
Soil Preparation, Planting, and Cultivating 70 128 58 82%
Paperboard Mills 116 120 4 3%
Sawmills 96 100 4 4%
In-Vitro Diagnostic Substance Manufacturing 63 90 27 44%
Testing Laboratories 97 67 -30 -31%
Wood Preservation 5 60 55 1093%
Hardwood Veneer and Plywood Manufacturing 113 53 -60 -53%
Fluid Milk Manufacturing 84 49 -36 -42%
Breakfast Cereal Manufacturing 0 48 48 NA
Ethyl Alcohol Manufacturing 12 33 21 175%
Research and Development in Biotechnology 5 28 23 458%
Pesticide and Other Agricultural Chemical Manufacturing 0 25 25 NA
Cut Stock, Resawing Lumber, and Planing 5 24 19 382%
Wineries 0 22 22 NA

ECONOMIC CONTRIBUTION OF AGBIOSCIENCE: CENTRAL MINNESOTA 35
Remediation Services 34 20 -14 -41%
Environmental Consulting Services 33 19 -14 -43%
Flour Milling and Malt Manufacturing 0 22 22 NA
All Other Basic Organic Chemical Manufacturing 16 0 -16 -100%
Engineered Wood Member (except Truss) Manufacturing 188 0 -188 -100%
Soybean and Other Oilseed Processing 0 5 5 NA
Frozen Fruit, Juice, and Vegetable Manufacturing 0 5 5 NA
Wet Corn Milling 33 5 -28 -85%
Total 2,825 3,180 355 13%
Source: EMSI