Economic & Commercial Real Estate Outlooksites.cassidyturley.com/SORE/images/Kevin...
32
Kevin Thorpe, Chief Economist March 11 th 2013 Economic & Commercial Real Estate Outlook
Transcript of Economic & Commercial Real Estate Outlooksites.cassidyturley.com/SORE/images/Kevin...

Kevin Thorpe, Chief Economist
March 11th 2013
Economic & Commercial
Real Estate Outlook

2013 - 2014 Baseline Forecast
2012 2013 Annual
Q1 Q2 Q3 Q4 Q1 Q2 Q3 Q4 2012 2013 2014
US Economy
Real GDP Growth, % 2.0 1.3 3.1 0.1 2.0 2.3 3.1 2.7 2.2 2.5 3.6
Job Growth, ths. 771 451 409 537 471 512 451 484 2,168 1,919 2,230
Office-using Job Growth,
ths. 231 172 129 138 114 124 109 117 670 464 541
Unemployment Rate 8.3 8.2 8.0 7.8 7.8 7.7 7.6 7.6 8.1 7.7 7.2
Retail Services Growth, % 6.5 -0.6 5.3 6.1 3.8 5.6 4.7 8.0 4.3 5.5 6.0
Inflation, % 2.5 0.8 2.3 2.1 1.9 2.1 2.2 2.2 1.9 2.1 2.9
CCI 68 65 65 70 73 75 78 80 67 77 85
Fed Funds Rate 0.1 0.2 0.1 0.2 0.1 0.1 0.1 0.1 0.1 0.1 0.1
10-year Gov't Bond 2.0 1.8 1.6 1.7 1.9 2.1 2.2 2.4 1.8 2.1 3.1
ISM Manufacturing Index 53.0 52.3 50.9 50.6 53 54 55 55 51.7 54 57
West Texas Intermediate 103 93 92 88 89 92 95 97 94 93 95
Office Sector
Net Absorption, msf 7.20 13.81 7.18 20.01 8.2 13.1 11.8 16.8 48.2 50.0 60.3
Vacancy 16.0% 15.8% 15.7% 15.4% 15.3% 15.2% 15.0% 14.9% 15.7% 15.1% 14.3%
Asking Rents $21.65 $21.72 $21.72 $21.69 $21.83 $21.92 $22.02 $22.13 $21.70 $21.98 $22.42
Industrial Sector
Net Absorption, msf 19.12 20.36 24.62 40.89 18.4 21.3 24.8 34.7 105.0 99.2 108.1
Vacancy 9.3% 9.3% 9.1% 8.9% 8.8% 8.6% 8.4% 8.3% 9.1% 8.5% 7.9%
Asking Rents $5.05 $5.04 $5.04 $5.00 $5.03 $5.06 $5.09 $5.12 $5.03 $5.07 $5.12
Retail Sector
Net Absorption, msf 3.47 2.27 1.50 2.29 3.7 4.6 2.1 3.5 9.5 13.8 16.0
Vacancy 10.9% 10.8% 10.8% 10.7% 10.6% 10.4% 10.4% 10.3% 10.8% 10.4% 10.1%
Asking Rents $19.00 $19.03 $19.05 $19.08 $19.09 $19.11 $19.12 $19.14 $19.04 $19.12 $19.17
Apartment Sector
Net Absorption, ths. sf 36.02 32.03 25.10 46.99 25.0 31.0 43.3 42.7 140.1 142.0 159.8
Vacancy 5.0% 4.8% 4.7% 4.5% 4.5% 4.5% 4.4% 4.4% 4.8% 4.5% 4.5%
Asking Rents $1,070 $1,082 $1,091 $1,097 $1,104 $1,122 $1,127 $1,136 $1,085 $1,122 $1,160

Exposure To Sequestration
2011 Federal Spending as % of GDP
39.9%
34.9%
29.3%
26.5%
23.5%
22.4%
22.0%
21.7%
21.3%
20.0%
19.5%
18.8%
17.6%
17.3%
15.9%
15.2%
14.9%
14.6%
14.3%
0% 5% 10% 15% 20% 25% 30% 35% 40% 45%
Washington, DC
Sacramento, CA
Baltimore, MD
St. Louis, MO
Tampa, FL
Riverside, CA
Louisville, KY
San Diego, CA
Los Angeles, CA
Raleigh, NC
Columbus, OH
Nashville, TN
Phoenix, AZ
Cincinnati, OH
Indianapolis, IN
San Francisco, CA
Atlanta, GA
Milwaukee, WI
Denver, CO
Source: U.S. Bureau of Economic Analysis (BEA); Consolidated Federal Funds Report, 2010

Sequester: Why Slash This?
0
10
20
30
40
0
10
20
30
40
2000 2005 2010 2015 2020 2025 2030 2035 2040 2045 2050 2055 2060 2065 2070 2075 2080 2085
Discretionary Spending Revenue
Percent of GDP
Source: Congressional Budget Office (The 2012 Long-Term Budget Outlook)

Entitlements Will Bankrupt The U.S.
0
10
20
30
40
0
10
20
30
40
2000 2005 2010 2015 2020 2025 2030 2035 2040 2045 2050 2055 2060 2065 2070 2075 2080 2085
Discretionary & Other Spending Entitlement Programs Revenue
Percent of GDP
Source: Congressional Budget Office (The 2012 Long-Term Budget Outlook)
Clear Bright Spots
Equity markets & housing
160
163
166
169
172
175
178
181
184
187
10500
11000
11500
12000
12500
13000
13500
14000
14500
Share Price Index: World - Dow Jones Industrial Average, (Index, NSA) for United States
Median Sales Price of Existing Homes: Single-Family & Coo & Co-op, (Ths. $, SA) for United States

Confidence Rising, Despite Threats
$3.30
$3.40
$3.50
$3.60
$3.70
$3.80
$3.90
52
54
56
58
60
62
64
66
68
70
72
Jan 2013 Feb 2013
CCI Gas Prices
Consumer Confidence vs. Gas Prices
7
Payroll taxes go up
Euro-zone less stable
Sequester approaching
Gas prices jump 50 cents
Source: Conference Board, Cassidy Turley Research

0
20
40
60
80
100
120
Retail (msf) Office (msf) Industrial (msf) Apartment (000's)
2012 Absorption
Pre-recession Average
CRE Demand Metrics
8
Net Absorption in 2012 vs. Pre-recession Annual Averages

Shifts in Commercial Space Usage
9
• The Rise of Creative Office Space • Adaptable “hackable” space • Space no longer homogenous • Repurposed space (warehouse as
office space, rooftops as gardens) • Strong identity exteriors
• Edgy Architecture
• Wireless environments • Green space a plus

Capital Markets

Capital Markets
$0
$100
$200
$300
$400
$500
'01 '02 '03 '04 '05 '06 '07 '08 '09 '10 '11 '12
$210 $252
Sales Volume, $bil.
Sales Volume, All Product Types, $billions
11
Source: Real Capital Analytics

Bank Lending Trends
12
Loan Volume for CRE, y/y % chg.
Source: Federal Reserve

Bank Lending Trends
13
Loan Volume for CRE, y/y % chg.
Inflection Point
Source: Federal Reserve

Excess Reserves Still Huge
Aggregate Reserves of Depository Institutions
14
-$0.4
$0.0
$0.4
$0.8
$1.2
$1.6
Ja
n 2
00
0A
pr
200
0Ju
l 200
0O
ct
20
00
Ja
n 2
00
1A
pr
200
1Ju
l 200
1O
ct
20
01
Ja
n 2
00
2A
pr
200
2Ju
l 200
2O
ct
20
02
Ja
n 2
00
3A
pr
200
3Ju
l 200
3O
ct
20
03
Ja
n 2
00
4A
pr
200
4Ju
l 200
4O
ct
20
04
Ja
n 2
00
5A
pr
200
5Ju
l 200
5O
ct
20
05
Ja
n 2
00
6A
pr
200
6Ju
l 200
6O
ct
20
06
Ja
n 2
00
7A
pr
200
7Ju
l 200
7O
ct
20
07
Ja
n 2
00
8A
pr
200
8Ju
l 200
8O
ct
20
08
Ja
n 2
00
9A
pr
200
9Ju
l 200
9O
ct
20
09
Ja
n 2
01
0A
pr
201
0J
ul
20
10
Oct
20
10
Ja
n 2
01
1A
pr
201
1Ju
l 201
1O
ct
20
11
Ja
n 2
01
2A
pr
201
2Ju
l 201
2O
ct
20
12
Excess Reserves, $T
Source: Federal Reserve

CMBS Gaining Momentum
15
Source: Commercial Mortgage Alert

Fed Senior Loan Survey
-80
-60
-40
-20
0
20
40
60
80
100
Net % of Banks Tightening
Net % of banks reporting stronger demand
Percent of banks reporting stronger demand for CRE loans
16
Source: Federal Reserve

750
1,000
1,250
1,500
1,750
2,000
2,250
2,500
2,750
3,000
US Monetary Base (US $bn., LHS)
End of
QE1
End of
QE2
QE3
Source: U.S. Board of Governors of the Federal Reserve System
Monetary Policy

Characterization of Fed Officials & Votes
Source: Capital Economics
Ratings 2013 Vote
2014 Vote
Permanent Voters
Ben Bernanke Dove D D
William Dudley Unknown ? ?
Elizabeth Duke Moderate M M
Jerome Powell Moderate M M
Sara Bloom Raskin Unknown ? ?
Jeremy Stein Hawk H H
Daniel Tarullo Dove D D
Janet Yellen Dove D D
Rotating Regional Voters
James Bullard, St. Louis Moderate M
Charles Evans, Chicago Dover D
Esther George, Kansas City Hawk H
Eric Rosengren, Boston Dove D
Sandra Pianalto, Cleveland Hawk H
Charles Plosser, Philadelphia Hawk H
Richard Fisher, Dallas Hawk H
Narayana Kocherlakota, Min. Dover D
Dennis Lockhart, Atlanta Moderate
Jeffery Lacker, Richmond Hawk
John Williams, San Francisco Dove
Summary
Doves 7 5 4
Moderates 4 3 2
Hawks 6 2 4
Unknown 2 2 2
Total 19 12 12

Atlanta

29 35
-150
-100
-50
0
50
100
150
1991
1992
1993
1994
1995
1996
1997
1998
1999
2000
2001
2002
2003
2004
2005
2006
2007
2008
2009
2010
2011
2012
Atlanta Making Progress
Job Growth/Losses, 000’s
Source: BLS
Historical Average = 33,000

Atlanta – Employment
2,439
2,345
1500
1600
1700
1800
1900
2000
2100
2200
2300
2400
2500
Dec 1
990
Au
g 1
99
1
Ap
r 1
99
2
Dec 1
992
Au
g 1
99
3
Ap
r 1
99
4
Dec 1
994
Au
g 1
99
5
Ap
r 1
99
6
Dec 1
996
Au
g 1
99
7
Ap
r 1
99
8
Dec 1
998
Au
g 1
99
9
Ap
r 2
00
0
Dec 2
000
Au
g 2
00
1
Ap
r 2
00
2
Dec 2
002
Au
g 2
00
3
Ap
r 2
00
4
Dec 2
004
Au
g 2
00
5
Ap
r 2
00
6
Dec 2
006
Au
g 2
00
7
Ap
r 2
00
8
Dec 2
008
Au
g 2
00
9
Ap
r 2
01
0
Dec 2
010
Au
g 2
01
1
Ap
r 2
01
2
Dec 2
012
Total Nonfarm, 000's
Atlanta MSA
Source: BLS

Office-using Job Growth
Jan 2010/Dec 2012, 000’s
Source: BLS
-20
0
20
40
60
80
100
120
140
Ne
w Y
ork
, N
Y
Da
lla
s-F
ort
Wo
rth
, T
X
Lo
s A
ng
ele
s, C
A
Ch
ica
go
, IL
Atl
an
ta, G
A
Sa
n J
ose
, C
A
Ho
us
ton
, T
X
Sa
n F
ran
cis
co
, C
A
Ta
mp
a, F
L
Min
neap
olis, M
N
Sa
nta
Ba
rba
ra, C
A
Milw
au
ke
e, W
I
Po
rtla
nd
, O
R
Oa
kla
nd
, C
A
Ind
ian
ap
olis
, IN
Sa
n A
nto
nio
, T
X
Orl
an
do
, F
L
Sa
cra
me
nto
, C
A
Co
lora
do
Sp
rin
gs, C
O
La
s V
eg
as
, N
V
Top 10 Bottom 10

Atlanta Office Market
23
Overall Market: Net Absorption and Vacancy
0%
5%
10%
15%
20%
25%
-4
-2
0
2
4
6
8
MS
F
Net Absorption (MSF) Vacancy Rate
Source: Cassidy Turley Research

Atlanta Industrial Market
24
Overall Market: Net Absorption and Vacancy
0%
4%
8%
12%
16%
-8
-4
0
4
8
12
16
MS
F
Net Absorption (MSF) Vacancy (%)Source: Cassidy Turley Research

Top 20 Industrial Markets
25
Industrial Sector Net Absorption 2011 + 2012, msf
0.00 5.00 10.00 15.00 20.00 25.00
Dayton
Pittsburgh
Denver
Portland, OR
San Antonio
Baltimore
Miami
Los Angeles
Seattle
Charlotte
Detroit
Central NJ
Milwaukee
Houston
Nashville
Indianapolis
Atlanta
Phoenix
Chicago
Dallas 1
2
3
4
5
6
7
8
9
10
11
12
13
14
15
16
17
18
19
20
Source: Cassidy Turley Research

Atlanta: Home Prices Rebounding
-30
-25
-20
-15
-10
-5
0
5
10
15
20
2000
Q1
2001
Q1
2002
Q1
2003
Q1
2004
Q1
2005
Q1
2006
Q1
2007
Q1
2008
Q1
2009
Q1
2010
Q1
2011
Q1
2012
Q1
Home prices, y/y % change
Atlanta, existing sf home price, y/y % change
26
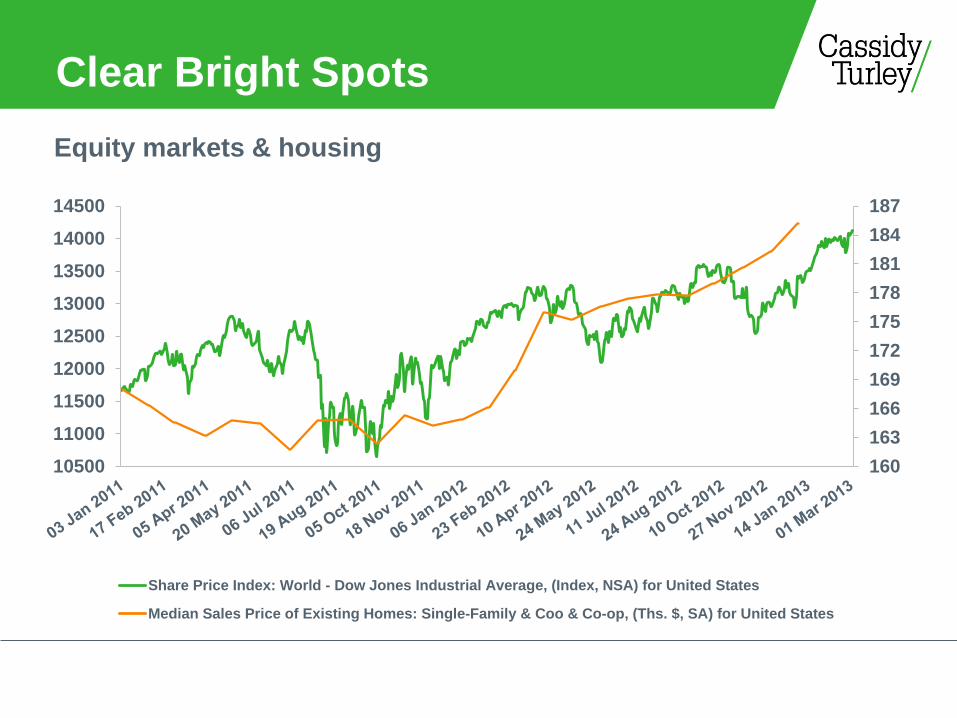
Atlanta’s Trump Card
Top 15 Net Migration Markets Since 2007, 000’s
Source: Moody’s Analytics
56k
0 10 20 30 40 50 60 70
Las Vegas
Tampa
Washington, DC
Seattle
Portland, OR
New Orleans
San Antonio
Denver
Raleigh
Charlotte
Austin
Dallas
Phoenix
Atlanta
Houston

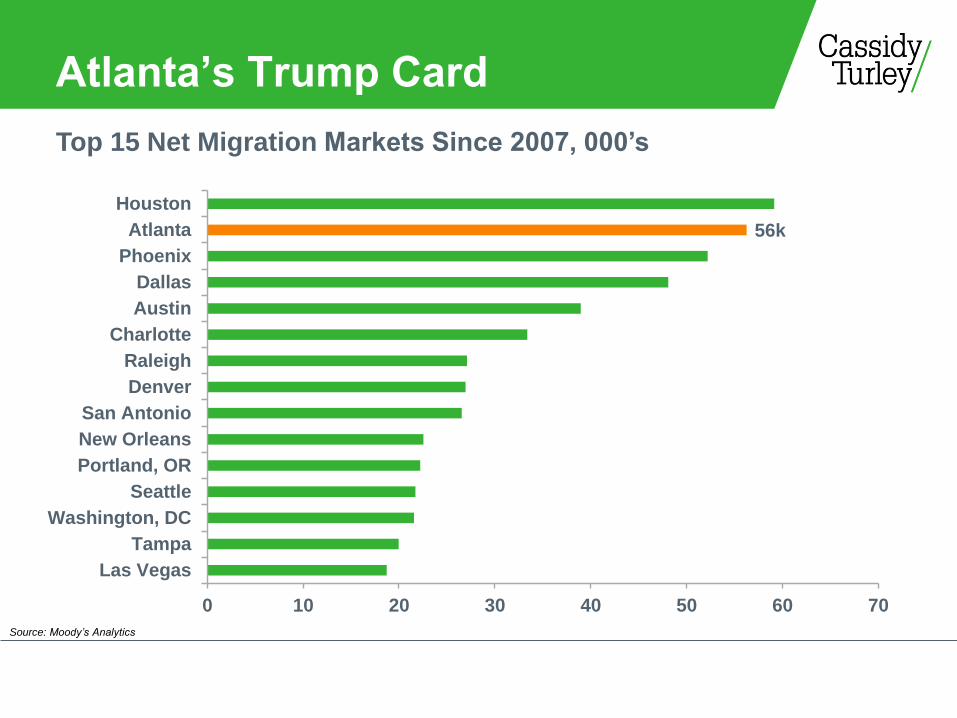
What To Watch
What To Watch: NOT Copper
0
50
100
150
200
250
300
350
400
450
11000
11500
12000
12500
13000
13500
14000
2000 2002 2004 2006 2008 2010 2012
U.S. GDP Copper Price Index
Copper prices vs. U.S. Real GDP
29
Relationship broke down in 2012
Source: Dow Jones Commodities, BEA

What To Watch: Confidence
20
40
60
80
100
120
140
160
80%
82%
84%
86%
88%
90%
92%
94%
200
0Q
1
200
0Q
3
200
1Q
1
200
1Q
3
200
2Q
1
200
2Q
3
200
3Q
1
200
3Q
3
200
4Q
1
200
4Q
3
200
5Q
1
200
5Q
3
200
6Q
1
200
6Q
3
200
7Q
1
200
7Q
3
200
8Q
1
200
8Q
3
200
9Q
1
200
9Q
3
201
0Q
1
201
0Q
3
201
1Q
1
201
1Q
3
201
2Q
1
201
2Q
3
201
3Q
1
Office Occupancy (LHS) CCI
Consumer Confidence vs. Office Occupancy
30
Source: Conference Board, Cassidy Turley

What to Watch: Airline Passengers
31
-20
-15
-10
-5
0
5
10
15
20
-40
-30
-20
-10
0
10
20
30
40
50
19931Q
19943Q
19961Q
19973Q
19991Q
20003Q
20021Q
20033Q
20051Q
20063Q
20081Q
20093Q
2011Q1
2012Q3
Net Absorption, MSF Passenger enplanements, Yr/Yr % Chg.
Source: U.S. Bureau of Transportation Statistics; Cassidy Turley Research

Kevin Thorpe, Chief Economist
March 11th 2013
Economic & Commercial
Real Estate Outlook