Economic Brief - Inflation in Tunisia: Perception and ... · 2 Inflation in Tunisia ... 8...
12
A f r i c a n D e v e l o p m e n t B a n k AfDB Chief Economist Complex April 2012 1 Introduction The initial months of 2012 were marked by frequent reports of inflationary pres- sures in Tunisia. These pressures occur- red in the aftermath of the economic slowdown resulting from the revolution and against a backdrop of social de- mands that translated into zero growth, increased unemployment and significant decline in foreign investments. This note attempts to determine the extent to which the inflationary pressures are real, the goods and services that are affected and to identify the causes. The analysis is based on previous research which indicates that the causes of inflation are diverse (mo- netary and structural), ranging from money supply to real output and import prices. This note also seeks to generate a debate on the return or otherwise of inflation in Tunisia at a time when the anti-inflationary policy and the existence of a compensation fund are often challenged in the current context of economic recovery. It aims to serve as refe- rence tool for a deeper and broader empiri- cal analysis. 2 Inflation in Tunisia is Managed by the Government Through Price Controls In Tunisia, as in other countries, infla- tion is calculated on the basis of the consumer price index (CPI). The CPI co- vers goods and services that make up urban and rural household consumption. The consumption basket used to deter- mine this index is based on the outcomes of five-year household consumer surveys. The list of products and the structure of the weights applied are based on the average household budget for each group of pro- ducts. Food products represent the bulk of expenditures and account for over 32% of the CPI. CONTENT 1 Introduction 1 2 Inflation in Tunisia is Managed by the Government Through Price Controls 1 3 Inflation in a Post-revolution Context 3 4 What Accounts for the Inflation of the Past 7 Months? 7 5 What Accounts for the Divergences between Official Inflation and the Actual Inflation Perceived by the Population? 8 6 Steps Have Been Taken to Combat These Inflationary Trends 8 7 Recommendations 9 8 Conclusion 9 Mthuli Ncube Chief Economist and Vice President ECON [email protected] +216 7110 2062 Janvier Liste Acting Vice President ORVP [email protected] +216 7110 2047 Jacob Kolster Director ORNA [email protected] +216 7110 2065 Steve Kayizzi-Mugerwa Director EDRE [email protected] +216 7110 2064 1 This report was produced by Kaouther Abderrahim (Consultant, ORNA) and Vincent Castel (Principal Program Officer, ORNA) with the support of Aymen Dhib (Statistical assistant, EDRE). Overall guidance was received from Jacob Kolster (Director, ORNA). The authors would like to thank Safouen Ben Aissa (Consultant, ESTA), Vinaye Dey Ancharaz (Principal Research Economist, EDRE) et Nooman Rebei (Economiste, IMF). The analysis and findings of this report reflects the opinions of the authors and not those of the African Development Bank Group, its Board of Directors or the countries they represent. Inflation in Tunisia: Perception and Reality in a Context of Transition Kaouther Abderrahim and Vincent Castel 1
Transcript of Economic Brief - Inflation in Tunisia: Perception and ... · 2 Inflation in Tunisia ... 8...

A f r i c a n D e v e l o p m e n t B a n k
AfDBChief Economist ComplexApril 2012
1 Introduction
The initial months of 2012 were marked
by frequent reports of inflationary pres-
sures in Tunisia. These pressures occur-
red in the aftermath of the economic
slowdown resulting from the revolution
and against a backdrop of social de-
mands that translated into zero growth,
increased unemployment and significant
decline in foreign investments.
This note attempts to determine the extent
to which the inflationary pressures are real,
the goods and services that are affected
and to identify the causes. The analysis is
based on previous research which indicates
that the causes of inflation are diverse (mo-
netary and structural), ranging from money
supply to real output and import prices. This
note also seeks to generate a debate on the
return or otherwise of inflation in Tunisia at a
time when the anti-inflationary policy and
the existence of a compensation fund are
often challenged in the current context of
economic recovery. It aims to serve as refe-
rence tool for a deeper and broader empiri-
cal analysis.
2 Inflation in Tunisia is Managed by the Government Through Price Controls
In Tunisia, as in other countries, infla-
tion is calculated on the basis of the
consumer price index (CPI). The CPI co-
vers goods and services that make up
urban and rural household consumption.
The consumption basket used to deter-
mine this index is based on the outcomes
of five-year household consumer surveys.
The list of products and the structure of the
weights applied are based on the average
household budget for each group of pro-
ducts. Food products represent the bulk of
expenditures and account for over 32% of
the CPI.
CONTENT
1 Introduction 1
2 Inflation in Tunisia is Managed by the Government Through Price Controls 1
3 Inflation in a Post-revolutionContext 3
4 What Accounts for the Inflation of the Past 7 Months? 7
5 What Accounts for the Divergences between Official Inflation and the Actual Inflation Perceived by the Population? 8
6 Steps Have Been Taken to Combat These Inflationary Trends 8
7 Recommendations 9
8 Conclusion 9
Mthuli NcubeChief Economist and Vice President [email protected]+216 7110 2062
Janvier ListeActing Vice [email protected]+216 7110 2047
Jacob KolsterDirector [email protected]+216 7110 2065
Steve Kayizzi-MugerwaDirector [email protected]+216 7110 2064
1 This report was produced by Kaouther Abderrahim (Consultant, ORNA) and Vincent Castel (PrincipalProgram Officer, ORNA) with the support of Aymen Dhib (Statistical assistant, EDRE). Overall guidancewas received from Jacob Kolster (Director, ORNA). The authors would like to thank Safouen Ben Aissa(Consultant, ESTA), Vinaye Dey Ancharaz (Principal Research Economist, EDRE) et Nooman Rebei(Economiste, IMF).
The analysis and findings of this report reflects the opinions of the authors and not those of the AfricanDevelopment Bank Group, its Board of Directors or the countries they represent.
Inflation in Tunisia: Perception and Reality in a Context of TransitionKaouther Abderrahim and Vincent Castel1

A f r i c a n D e v e l o p m e n t B a n k
2
The Tunisian CPI is fairly representa-
tive in terms of both geographic co-
verage and number of products
contained in the basket. These were
revised in 2010. Thus, the sample of
retail outlets was revised upward from
2631 to 3155 in 2010 and taken from
all the localities, governorate capitals
and major urban centres. Furthermore,
the National Institute of Statistics (INS)
also revised the list of items constitu-
ting the consumption basket. Since
2010, the latter comprises 1010 food
items classified into 12 groups. The INS
chose 2005 as the new base year for
household consumer prices to replace
the year 2000. The structure of weights
was also revised taking into account
the outcomes of the 2005 national hou-
sehold consumption survey (Table 1).
Several studies and analyses1 show
that inflation in Tunisia is driven by a
variety of factors. Monetary factors
such as money supply, interest rate and
effective exchange rate influence the
CPI trend, in addition to structural fac-
tors ranging from annual average wage
to import price index and real output.
Global energy and food price varia-
tion is a traditional inflation driver. In
addition to the impact of energy prices
on households through direct consump-
tion, energy prices also influence the pro-
duction costs (hence prices) of
manufactured goods and their trans por-
tation. Furthermore, the escalation of
energy prices also affects the cost of
agricultural production and the haulage
of food products, just as the escalation
of cereal prices indirectly affects meat
and milk prices, where cereals are in-
cluded in livestock feed. (In 2007,
three-quarters of cereal consumed in
the country was imported, over half of
which went into stock rearing2).
To safeguard the purchasing power
of the population against world mar-
ket contingencies and the effects of
input cost increases, the Tunisian
government can directly influence
prices. This is done through two me-
chanisms: by setting an official price for
specific food and consumer items and
by subsidizing some other basic food
products. The country’s food, energy
and transport expenditures represent
32%, 5% and 11% of the CPI, respec-
tively.
Hence the government has put in
place a special price system for
some basic commodities. Over 30%
of the products in the consumption
basket are covered by authorized
prices. Indeed, in view of the competi-
tiveness and sensitivity of the products
in relation to consumers, the country’s
regulations provide for a dual pricing
system: (i) officially authorized prices
(homologation) and (ii) negotiated
prices (auto-homologation). Thus, au-
thorized prices are fixed beforehand by
the Tunisian administration based on
the costs and accounting details provi-
ded by the relevant company. However,
it is important to note that not all the
products with officially authorized
prices are subsidized. For instance, red
meat and coffee are not subsidized and
their prices are fixed beforehand by the
government. In the negotiated price
system, the selling prices are set at the
distribution point by the company.
Such prices consist of the production
cost and a mark-up fixed by decision
of the Ministry of Trade. For example,
the per minute tariff of telephone calls is
determined by the telephone network
operators who take into account the
mark-up fixed by the Ministry of Infor-
mation and Communication Technolo-
gies.
At the same time, the system of
compensation helps to ensure a re-
gular supply of subsidized products
to the local market at relatively sta-
ble prices in line with the purchasing
power. The compensation policy en-
tails a variety of measures ranging from
safeguarding the purchasing power of
low-income Tunisians from the hazards
of the global market to guaranteeing a
minimum income to farmers through
cereal subsidies. Table 1 provides a list
of compensation costs in millions of di-
nars. It should be noted that the cereal
subsidy accounts for over 75% of the
total subsidies, excluding energy.
These policies were effective and
helped to mitigate the impact of glo-
bal price fluctuations on Tunisian
prices. Indeed, as Figure 1 shows, al-
though global energy and food prices
underwent significant variations,
changes in Tunisian prices were relati-
vely smooth. Similar conclusions may
be drawn from Figure 2 presenting a
comparison between disaggregated
Tunisian food and energy CPIs and the
global energy and food price in-
dices.
1 « La Portée de la Politique de Ciblage de l’Inflation : Approche Analytique et Empirique pour le Cas Tunisien »; Adnen Chockri et Ibticem Frihka, 2011.(Impact of Inflation Targeting Policy: An Analytical and Empirical Approach to the Tunisian Case).
2 FAOSTAT, 2012.

A f r i c a n D e v e l o p m e n t B a n k
3
Table 1 Compensation Fund Costs in TND Million (excluding energy)
2008 2009 2010 2011
Cereals 873 687 613 883
Bean oils 168 109 113 214
Milk 3 - - 23
School stationery 5 4 4 4
Other products - - - 25
Sugar 11
Tomato concentrate 10
Couscous and pasta 4
Total 1 048 800 730 1 150
% share of GDP 1.9 1.4 1.2 1.9
Source: Ministry of Trade and Craft Industry, 2012.
3 Inflation in a Post-revolution Context
The set of mechanisms described
previously helped to stabilize infla-
tion in Tunisia in 2011 (below 4%),
and even accounted for its decline
in relation to 2010 (Figure 3). The es-
calation of global prices beginning
2011 did not affect the inflation rates.
Figure 4 shows that an increase in
food prices was recorded between Ja-
nuary and February 2011 whereas,
over the same period, the CPI of food
products fell by -0.2%. Food CPI re-
mained relatively stable up to July
2011. Similarly, while a rise of over
9.5% of global energy price was ob-
served, its effect on the Tunisian CPI
was minimal.
Figure 1 Trends of Tunisian CPI, Global Energy and Food Price Indices
Global Energy Price Indice
Tunisian CPI
Global Food Price Indice
Source: INS and IMF, March 2012.

A f r i c a n D e v e l o p m e n t B a n k
4
However, the price control effort wor-
sened the already elevated fiscal
pressures (Table 2) due to the increa-
sed mobilization of the compensation
fund. In the aftermath of 14 January, the
transition government reviewed the
compensation fund upward, notably for
cereals, in order to appease the popula-
tion whose expectations continued to
rise after the ouster of the former presi-
dent. Taming price escalation became
possible in 2011 only after the doubling
of the national compensation fund3. The
subsidy expenditure in support of the
purchasing power of the population
amounted to 2.8 billion dinars (4.5% of
GDP). Energy products benefited the
most from the government’s intervention
to the tune of TND 1.5 billion, followed
by food subsidies (TND 1.1 billion).
These new subsidies weighed heavily on
the budgetary deficit which increased to
-3.9% in 2011. Furthermore, the range
of subsidized products was widened to
meet social demands by including steri-
lized semi-skimmed milk, sugar and to-
mato concentrate.
These measures peaked in July 2011
and although average inflation remai-
ned under control, the prices of sta-
ple goods and services rose sharply,
thereby affecting households signifi-
cantly. A 6.4 % rise in food prices was
recorded between July 2011 and Fe-
bruary 2012 (and 8.3 % in one year).
Other goods and services had similar
price increases that had a low impact on
average inflation but a relatively high one
on consumers: tobacco (+9.7 % over a
6-month period), education (+9.8 %
over a 6-month period), and housing (+
4 % in one year).
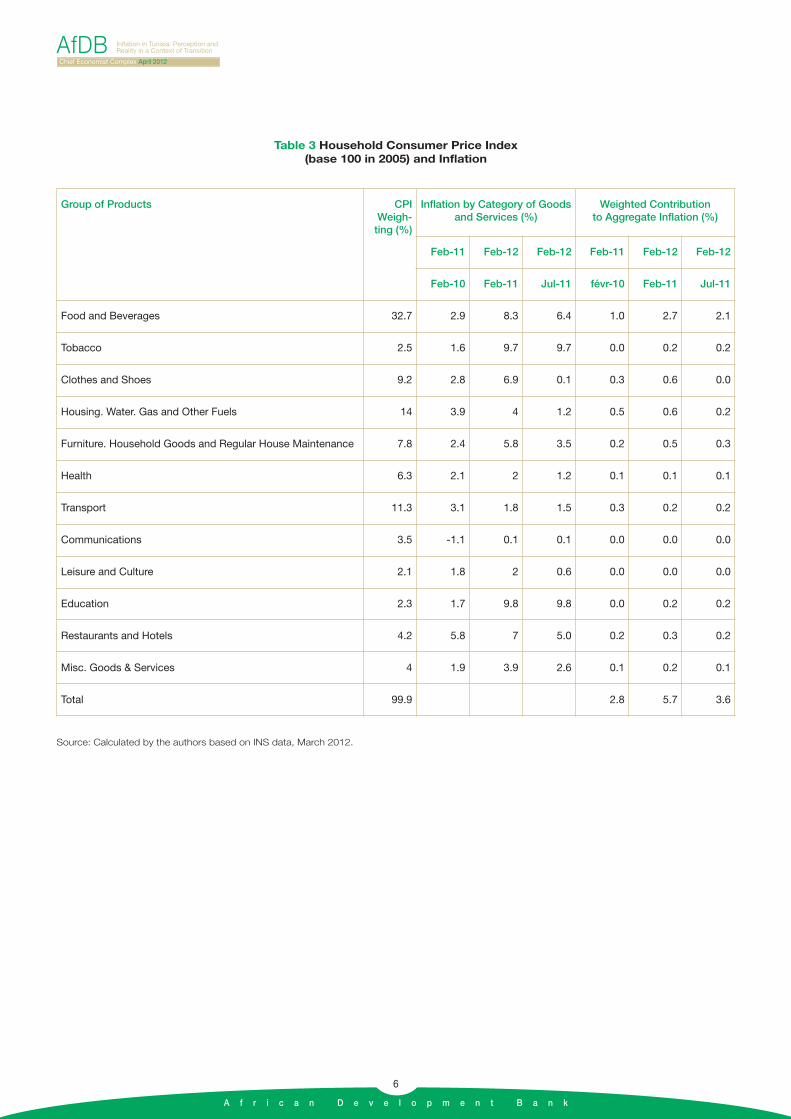
Since the beginning of 2012, average
inflation rose by 4.9% in January,
and over 5.7% in February compared
to a year-over-year rate of 3.5% in
2011. These inflationary tensions –
which are extremely hard on average
consumers - indicate a major escalation
of the prices of food that represents
over 32 % of average consumer expen-
ditures (Table 3).
Figure 2 CPI s and Global Energy and Food Price Indices, 2007-2011
Global Food Price Indice
Global Food Price CPI (2005=100)
Global Energy Price CPI (2005=100)
Global Energy Price Indice
Source: INS and IMF, March 2012.
3 Taming inflation by maintaining subsidies at a fixed rate results in a sharp increase in subsidies.
Table 2 Budgetary Deficit, 2000-2011
2000 2007 2008 2009 2010 2011 (e)
Budgetary deficit (% of GDP) -2.4 -2.6 -0.7 -2.7 -1.3 -3.9

A f r i c a n D e v e l o p m e n t B a n k
5
Figure 3 Trend of Inflation in Tunisia, 2000-2011
Inflation (Yearly in %) Inflation (Monthly in %)
Source: ADB and INS, March 2012.
Figure 4 Trend of CPIs and Global Energy and Food Price Indices, 2007-2011
Revolution Revolution
Tunisian Food Price CPI (2005=100) Tunisian Energy Price CPI (2005=100)Tunisian Transport Price CPI (2005=100)
Source: ADB and INS, March 2012.
A f r i c a n D e v e l o p m e n t B a n k
6
Table 3 Household Consumer Price Index (base 100 in 2005) and Inflation
Source: Calculated by the authors based on INS data, March 2012.
Group of Products CPIWeigh-ting (%)
Inflation by Category of Goodsand Services (%)
Weighted Contribution to Aggregate Inflation (%)
Feb-11 Feb-12 Feb-12 Feb-11 Feb-12 Feb-12
Feb-10 Feb-11 Jul-11 févr-10 Feb-11 Jul-11
Food and Beverages 32.7 2.9 8.3 6.4 1.0 2.7 2.1
Tobacco 2.5 1.6 9.7 9.7 0.0 0.2 0.2
Clothes and Shoes 9.2 2.8 6.9 0.1 0.3 0.6 0.0
Housing. Water. Gas and Other Fuels 14 3.9 4 1.2 0.5 0.6 0.2
Furniture. Household Goods and Regular House Maintenance 7.8 2.4 5.8 3.5 0.2 0.5 0.3
Health 6.3 2.1 2 1.2 0.1 0.1 0.1
Transport 11.3 3.1 1.8 1.5 0.3 0.2 0.2
Communications 3.5 -1.1 0.1 0.1 0.0 0.0 0.0
Leisure and Culture 2.1 1.8 2 0.6 0.0 0.0 0.0
Education 2.3 1.7 9.8 9.8 0.0 0.2 0.2
Restaurants and Hotels 4.2 5.8 7 5.0 0.2 0.3 0.2
Misc. Goods & Services 4 1.9 3.9 2.6 0.1 0.2 0.1
Total 99.9 2.8 5.7 3.6

A f r i c a n D e v e l o p m e n t B a n k
7
4 What Accounts for the Inflation of the Past 7 Months?
Structural Factor
This increase in inflation had been
anticipated by making provision for
increased production costs. Accor-
ding to the INS economic newsletter
published in September 2011, produc-
tion costs rose in July 2011 compared
with import prices. This stemmed from
the anticipation early July of the esca-
lation of some production costs that
were scheduled for re-evaluation in
early 2012 (energy expenditures,
wages etc.). Consequently, Tunisian
businesses incorporated the expected
increases in the selling price of many
products in advance.
Monetary Factor
The dinar whose exchange rate is
controlled by the Central Bank has
depreciated in relation to the dollar
and the Euro. The symbolic threshold
of two dinars to one Euro was reached
in March and the dinar to the dollar rate
is currently 1.5, historically the highest
ever. This depreciation has generated
inflationary pressures that could acce-
lerate if Tunisian foreign reserves conti-
nue to dwindle and the balance of trade
worsens. Foreign exchange reserves
fell from TND 13.1 billion on 13 Sep-
tember 2010 to TND 11.5 billion a year
later, and have gradually stabilized
since then at TND 10.2 billion - repre-
senting 113 days of imports as against
186 and 147 in 2009 and 2010, res-
Figure 5 Dinar Exchange Rate in Relation to the Euro and the Dollar, 2007-2011
Exchange rate (TND in Euro) Exchange rate (TND in USD)
Source: INS, March 2012.

A f r i c a n D e v e l o p m e n t B a n k
8
pectively. In addition to worsening the
balance of trade and reducing foreign
exchange reserves, the exchange rate
depreciation significantly affected the
energy and food bill, which could have
an adverse impact on the government
budget.
Furthermore, since 2011, the Central
Bank (BCT) has adopted an expan-
sionary monetary policy aimed at re-
ducing the interest rate and limiting
banks’ mandatory reserve levels. At
3.23 % in December 2011, the money
market rate (MMR) has been at its lo-
west historically, compared with an
average of 4.32 % and 4.43% in 2010
and 2011, respectively. The decline in
interest rates is not without conse-
quences on bank liquidity. To address
this, the BCT injected TND 3.87 billion
in February to stimulate demand-driven
inflation in a context of scarcity of
goods supply.
The Libyan Crisis
The Libyan crisis fuelled the black
market in exports to that country.
The high volumes of exports to Libya
and contraband activities at the border
resulted in the scarcity of several basic
food items. During the Libyan crisis,
some Tunisians sold goods to Libyans
at higher than market prices, thereby
driving prices upwards in Tunisia. At-
tention was consistently drawn to the
fact that the illegal exports were a po-
tential source of inflation beginning
2012. According to an official repre-
sentative of the Ministry of Industry and
Trade, “trafficking and illegal exports are
the main causes of the escalating
prices of basic consumer goods and
the deterioration of the purchasing
power of Tunisians”. Most of the smug-
gled goods are subsidized products.
With the return of peace in Libya, there
are plans to introduce stringent mea-
sures to discourage the traffickers, the-
reby restoring economic balance and
matching supply with domestic de-
mand. Thus, an action plan has been
formulated to combat the trafficking of
goods at the borders.
5 What Accounts for the Divergences between Official Inflation and the ActualInflation Perceived by the Population?
Challenging Price Control in a Context of Transition
The 2011 crisis jeopardized econo-
mic price control efforts, thereby
culminating in non-compliance with
the official government prices.
Considerable discrepancies (from 10
to 30% locally) between the official
prices and the selling prices of a num-
ber of products, particularly food pro-
ducts, have been noted. However,
these increases do not appear to be
reflected in official inflation indicators
recorded in January and February
2012. In addition to improved econo-
mic control, the sample of retail outlets
whose prices are used by the INS staff
to calculate the national CPI should be
revised upward, in addition to better
distribution in relation to the localities,
governorate capitals and major urban
centres.
As a General Indicator, the CPI Does not Reflect Household Basket Inflation
The method of calculating the CPI is
often challenged because of a
considerable discrepancy noted
between the calculated inflation and
inflation as perceived by the popula-
tion. Because Tunisians consumers
have sound knowledge of prices, they
are quick to notice an increase in the
cost of living. Their weekly or virtually
daily visits to markets enable them to
directly and immediately feel the impact
of the escalation of food prices. And al-
though food products represent 32%
of the CPI, the 8.3% increase of food
prices felt and recorded in one year (Fe-
bruary 2011 – Feb 2012) is reduced to
2.5 % in the total inflation. In contrast,
the average consumer is less sensitive
to variations in the prices of furniture or
household appliances which are pur-
chased on average every 2 or 5 years,
but which statisticians use to calculate
total inflation based on goods and ser-
vices consumed by an average house-
hold.
6 Steps Have Been Takento Combat These Inflationary Trends
Steps have currently been taken to
ensure more effective price control
and enhanced citizenry commit-
ment. To ensure greater efficiency of
the work of economic control officers,
the Ministry of Trade published the
price list of authorized products and
provided a hotline for reporting cases
of price malpractices. Permanent
units have been created in weekly,
municipal and bulk-breaking markets
with the support of the army as well
as security and control agencies to
institute spot fines and combat all
forms of fraud that undermine the
transparency of trading activities. Fur-
thermore, an appeal was made to the
Ministry of Justice to pay greater at-
tention to and accelerate the imposi-
tion of spot fines on traders who do

A f r i c a n D e v e l o p m e n t B a n k
9
not comply with the prices fixed by
the Ministry of Trade, which is manda-
ted by law to establish ceiling prices.
The government has tightened se-
curity at the Tunisia-Libya border to
combat the illicit export of consumer
products. The Minister of Interior sta-
ted on 22 February 2012, following a
visit to the fruit and vegetable bulk-
breaking market, that security arrange-
ments had been tightened at the
Libyan border to combat the illicit ex-
port of consumer goods. An agreement
was signed between the Ministry of In-
dustry and Trade and the Ministry of In-
terior to intensify road checks on farm
products that bypass legal and official
distribution channels.
7 Recommendations
To better ascertain the impact of in-
flation on the society, it is necessary
to refine its measurement. A com-
munication campaign must be organi-
zed on household basket inflation.
Furthermore, given the strong regional
and social disparities in Tunisia, the
PCI based on the average consumer
basket does not adequately reflect in-
flation as perceived by the population.
Hence instead of focusing on a single
index, several inflation indices that re-
flect regional and consumption dispa-
rities between the various social
groups should be considered.
Changes in consumption patterns
may be one of the factors accoun-
ting for the heightened impact of
price escalation on the population –
which calls for a more regular re-
view of the CPI. The major changes
in consumption patterns as well as the
emergence of new products and ser-
vices are not necessarily reflected in
the index, in view of the fact that the
CPI is based on the average consu-
mer basket that is reviewed only every
five years. Changes in consumer be-
haviour occur at a steady rate. The
current method of using an estimated
consumption basket to calculate the
CPI does not make it possible to as-
certain whether it is prices that in-
fluence consumer choices or
vice-versa.
To address these issues, the African
Development Bank awarded a tech-
nical assistance grant to the Natio-
nal Institute of Statistics (INS) to
undertake relevant studies, one of
which will deal with inflation mea-
surement. To support Tunisia in its
fight against price escalation, the
study will contribute to analyzing the
link between inflation and poverty. It
will thus examine the impact of infla-
tion on household purchasing power
and determine whether the type of
household has any influence on the in-
flation-poverty relationship. Indeed, it
is clear that a rise in energy prices
would have a lesser impact on poor
household consumption. Furthermore,
as our discussion on the significance
of household consumption subsidies
indicates, a review of the basic basket
of goods (most of which are subsidi-
zed) appears to be necessary to the
extent that household consumer pat-
terns depend on the type, size and lo-
cation of such households (e.g.
households in towns along the Libyan
border have suffered the more from
shortages than those in Tunis).
This study therefore seeks to measure:
(i) the impact of the type of household
on the relationship between inflation
and household consumption; and (ii)
the influence of the geographic loca-
tion of households on the inflation-po-
verty ratio. Thus, these impact
measurements will help to develop dif-
ferent4 consumer price indices: (a) a
national price index (b) a price index
for poor households, and (c) a price
index by region. These indices will be
used to simulate the discussions to be
held on the compensation fund.
8 Conclusion
In a sound macroeconomic context,
an inflation control policy is generally
based on the assumption that elimi-
nating the impact of global price
contingencies on national prices is en-
ough to stem all the indirect negative
effects of price escalation. However,
the risk of eliminating a particular dis-
tortion (here inflation) can aggravate
the impact of the remaining distortions
(budgetary deficit and decline in fo-
reign exchange reserves), thereby im-
pacting negatively on the economy in
general. Clearly, if one were to com-
pare the inflation recorded in Tunisia
with that of Egypt or even Libya, it
would be noticed that the transition
governments succeeded in containing
inflation at below the 5 % threshold.
However, it is worth noting that the
impact of an inflation control policy in
a post-revolution context is immense.
Limiting inflation by doubling the com-
pensation fund and increasing imports
to meet demand will lead to significant
fiscal pressures in a context of econo-
mic recovery.
4 This study will be mainly based on national surveys on the budget, consumption and household standard of living (2000, 2005 and 2010). The datafor 2005 has been available since end October 2011 and the more recent one (2010/2011) since end December 2011.

A f r i c a n D e v e l o p m e n t B a n k
10
Furthermore, the CPI inflation indicator
does not accurately reflect the actual
inflation felt by households daily. Where
inflationary tendencies relate to daily or
common consumer products and ser-
vices used daily or frequently by consu-
mers (food, tobacco and education),
the latter clearly feel the impact signifi-
cantly, although such tendencies may
be less significant in the aggregated in-
dicator.
Price performance in 2011 and early
2012 underscores the need for a more
refined approach to the monitoring of
inflationary trends in Tunisia. This could
be achieved through a more specific in-
flation indicator regularly communica-
ted to the people, which mirrors their
perception of price escalation more ac-
curately.

A f r i c a n D e v e l o p m e n t B a n k
11

A f r i c a n D e v e l o p m e n t B a n k © AfDB 2012 - Design, ERCU/YAL