
Economic Assessment of Deploying Advanced Coal … Assessment of Deploying Advanced Coal Power...
48
Economic Assessment of Deploying Advanced Coal Power Technologies in the Chinese Context Lifeng Zhao, Ph.D. Research Fellow Energy Technology Innovation Policy Belfer Center for Science and International Affairs Kennedy School of Government Harvard University Feb. 19, 2008
Transcript of Economic Assessment of Deploying Advanced Coal … Assessment of Deploying Advanced Coal Power...

Economic Assessment of Deploying Advanced Coal Power Technologies in the Chinese Context
Lifeng Zhao, Ph.D.Research FellowEnergy Technology Innovation Policy Belfer Center for Science and International AffairsKennedy School of GovernmentHarvard UniversityFeb. 19, 2008

2
1. Introduction2. General Assessment Basis3. Calculation Results4. Next Steps5. Final Remarks
Contents

3
1. Introduction

4
Power capacity mix, 2007
• National Bureau of Statistics of China
• China Electricity Council, 2007
1.1 Power in ChinaTotal capacity: 713 GW
Thermal capacity: 554 GWCoal capacity: 530 GW
Total electricity generation: 3256 TWh
Thermal electricity generation 2698 TWh, 83%
New added capacity:100 GWThermal: 82 GW
Hydro 20.4% Nuclear 1.2%Wind 0.6% Other 0.1%
Thermal 77.7%

5
1.2 Some good trends 1. Growth rate of total capacity dropped
Installed power capacity: 14.4% higherGrowth rate: 6.2% lower
2. Capacity from clean and renewable energy sources increased
Wind power capacity: 4 GW, 94.4%Nuclear power capacity: 9 GW, 29.2% Hydro power capacity: 145 GW, 11.5%Thermal power capacity: 554 GW, 14.6%, growth rate, 6% lower

6
1.2 Some good trends (cont.)
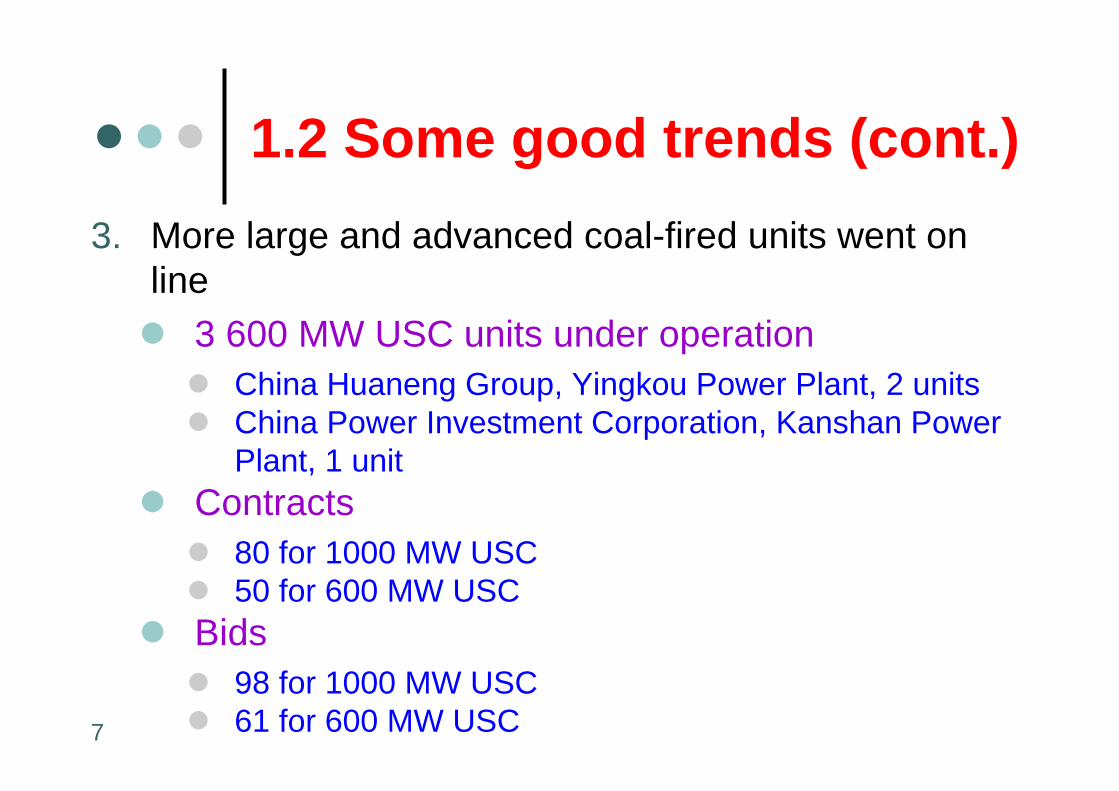
3. More large and advanced coal-fired units went on line
7 1000 MW Ultra-Supercritical (USC) units under operation
China Huaneng Group, Yuhuan Power Plant2006, 2 units2007, 2 units
China Huadian Corporation, Zhouxian Power Plant2006, 1 unit2007, 1 unit
China Guodian Corporation, Taizhou Power Plant2007, 1 unit
7
3. More large and advanced coal-fired units went on line
3 600 MW USC units under operation China Huaneng Group, Yingkou Power Plant, 2 units China Power Investment Corporation, Kanshan Power Plant, 1 unit
Contracts80 for 1000 MW USC50 for 600 MW USC
Bids98 for 1000 MW USC61 for 600 MW USC
1.2 Some good trends (cont.)

8
4. Demonstration of new generation technologies was launched
3 IGCC, 2 oil-electricity co-production demonstration plants, under construction
5. Penetration of flue gas desulfurization significantly increased
FGD capacity 270 GW, accounting for over 50%6. Net Efficiency greatly improved
14 GW, closed downCoal consumption rate of power supply: 357 g/kWh (34.4%), 10 g/kWh lower
1.2 Some good trends (cont.)

9
Net efficiency has greatly improved
Close down small size units
Build large size units
Use advanced technology
• National Bureau of Statistics of China• China Electricity Council, 2007
350
360
370
380
390
400
410
420
430
440
1990
1991
1992
1993
1994
1995
1996
1997
1998
1999
2000
2001
2002
2003
2004
2005
2006
2007
Year
Sta
ndar
d C
oal C
onsu
mpt
ion
Rat
e of
Pow
er S
uppl
y g/
kWh
28.0
29.0
30.0
31.0
32.0
33.0
34.0
35.0
Net
Effi
cien
cy %
Standard Coal Consumption Rate ofPower Supply g/kWhNet Efficiency (%)
1.2 Some good trends (cont.)

10
1.3 Challenges to China’s Power Future
Continued High Electricity Demand
Low Net Efficiency
Optimization of Power Mix (dependence
on coal)
Coal Supply
Environmental Impacts (coal)

11
Projection of Power Capacity in 2020
60
41
41
Nuclear Power (GW)
493
384
277
Addition of coal power
(2008-2020)(GW)
70
50
30
Wind Power (GW)
1023
914
807
Coal power (GW)
1546
1393
1241
Total installed capacity (GW)
Base
High speed
Low speed
1.3 Challenges to China’s Power Future (cont.)

12
1.4 Coal Power Technologies
Three Pulverized Coal (PC) technologies+ Pollution control technologies
SubcriticalSupercritical (SC)Ultra-Supercritical (USC)
Circulating Fluidized Bed (CFB)Integrated Gasification Combined Cycle (IGCC)

13 NHD
NHD
Furnace Desulfuriza
tion
FGD
FGD
-
FGD
FGD
-
FGD
FGD
-
Sulfur Control
Fuel Saturation
Fuel Saturation
-
LNB/SNCR
LNB
LNB
LNB/SNCR
LNB
LNB
LNB/SNCR
LNB
LNB
NOxControl
E-class
E-class
GT
Shell entrained flow
Multi-Nozzle entrained flow
CFB subcritical
USC
USC
USC
Supercritical
Supercritical
Supercritical
Subcritical
Subcritical
Subcritical
Gasifier/Boiler
Electrostaticprecipitation16.7/538/538 10
Electrostaticprecipitation25/600/600 9
Wet Scrubbe10/510/510 11
Candle filter 10/510/510 12
Electrostaticprecipitation25/600/600 8
Electrostaticprecipitation25/600/600 7
Electrostaticprecipitation24.2/566/566 6
Electrostaticprecipitation24.2/566/566 4
Electrostaticprecipitation16.7/538/538 2
Electrostaticprecipitation16.7/538/538 1
Particulate Matter Control
Steam ParameterMPa/℃/℃
CASE
Electrostaticprecipitation24.2/566/566 5
Electrostaticprecipitation16.7/538/538 3

14
1.5 Goals
To compare twelve different power plant configurationsTo evaluate the differences in capital cost and overall cost of electricity (COE) To evaluate the performance of all technologies examined
Net efficiencyEmissions (SO2, NOx, Particulate Matter, CO2)

15
2. General Assessment Basis

16
2.1 Calculation of Performance
AspenPlus
Coal Characteristics
Net power
SO2 emissions
……….
Particulate Matter emissions
CO2 emissions
Steam parameters
Gasifierparameters
Technical parameters of
gas turbine
……….
Net efficiency

17
2.2 Impact Factors for Performance Calculation
Site CharacteristicsCoal CharacteristicsEmission Standards

18
MunicipalWaterRail accessTransportation
55%Relative Humidity298KDesign Temperature1atmDesign Air Pressure
2.3 Site Characteristics

19
25.42%
21.01~24
34.95%
24.01~27
17.51%
>27
0.4%
<8.5
22.74 %12.69% 7.85% 1.18%
Average 17.01~21 12.51~17 8.5~12.5
Heating Values of China Coal (MJ/kg)
2.4 Coal Characteristics
13.69%
30.01~40
2.25%
40.01~50
1.49%
>50
0.4%
≤ 5
23.38% 33.56% 39.81% 8.8%
Average 20.01~3010.01~20 5.01~10
Ash Contents of China Coal (%)
4.57%
2.01~3
6.14%
>3
40.17%
≤0.5
1.06% 3.37% 14.27% 31.48%
Average 1.51~2 1.01~1.5 0.51~1
Sulfur Contents of China Coal (%)
28%
51%

2026110As-Received LHV(kJ/kg)
7.02ASH0.4Sulfur0.94Nitrogen6.28Ash
10.07Oxygen30.64Volatile Matter
4.58Hydrogen52.52Fixed Carbon76.99Carbon10.56Moisture
Ultimate Analysis(%,wt,dry basis)Proximate Analysis(%,wt)
Shendong Coal
2.5 Shendong Coal Characteristics

21
2.6 Emission Standards in China
NOx: Vdaf >20% 450 mg/Nm3
10%≤Vdaf ≤20% 650 mg/Nm3
Vdaf <10% 1100 mg/Nm3
SO2: 400mg/Nm3, 800mg/Nm3, 1200mg/Nm3
Particulate matter: 50mg/Nm3, 100mg/Nm3, 200mg/Nm3

22
2.7 Comparison of Emission Limits
301850Particulate Matter (mg/Nm3)
190135
USA
200200
EU
450400
China
NOx (mg/Nm3)
NationPollutants
SO2 (mg/Nm3)
23
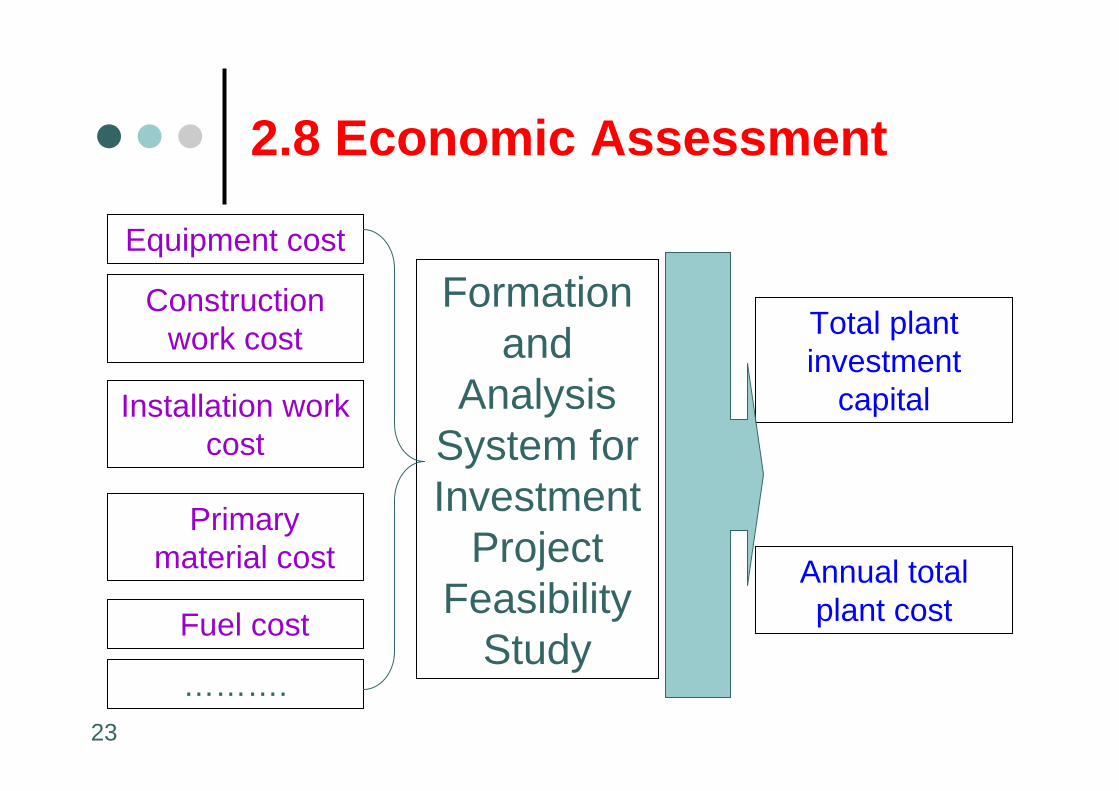
2.8 Economic Assessment
Formation and
Analysis System for Investment
Project Feasibility
Study
Equipment cost
Annual total plant cost
Total plant investment
capital
Construction work cost
Installation work cost
Fuel cost
Primary material cost
……….

24
2.9 The Composition of Total Plant Investment Capital (Yuan)
Preparation fee for productionLand use cost
Installation engineering cost
Original equipment costConstruction engineering cost
Interests during construction periodBasic contingency cost
Other costs Site preparation
Extra costs for imported technology and equipment
Technical service cost
Management cost for project construction
Other engineering cost
Overnight construction cost
Fixed assets5Fixed assets4Deferred assets3Intangible assets2
Fixed assets1
ItemsNo.

25
2.10 The Composition of Annual Total Plant Cost (Yuan/Year)
charges for emitting particulate matter
charges for emitting NOxcharges for emitting SO2
financial cost repair cost
wage and welfare cost bought-in fuel cost
bought-in primary material cost amortization cost depreciation cost
9
2
Operation and maintenance
cost
345
8
10
76
Capital cost1
ItemsNo.

26
2.11 Basic Parameters for Economic Assessment
IGCC repair rate
PC repair rate
Loan return period
Loan ratio
Amortization of deferred assets
Depreciation period
Annual operation hours
20 years
57%
8%
6.4%
5 years
5%
3 years
3.5%
2.5%
15 years
70%
5 years
15 years
6000 hours
Depreciation residual rate
Amortization of intangible assets
Loan rate Basic contingency
cost
Operation period
Welfare and labor protection coefficient
Construction period
27
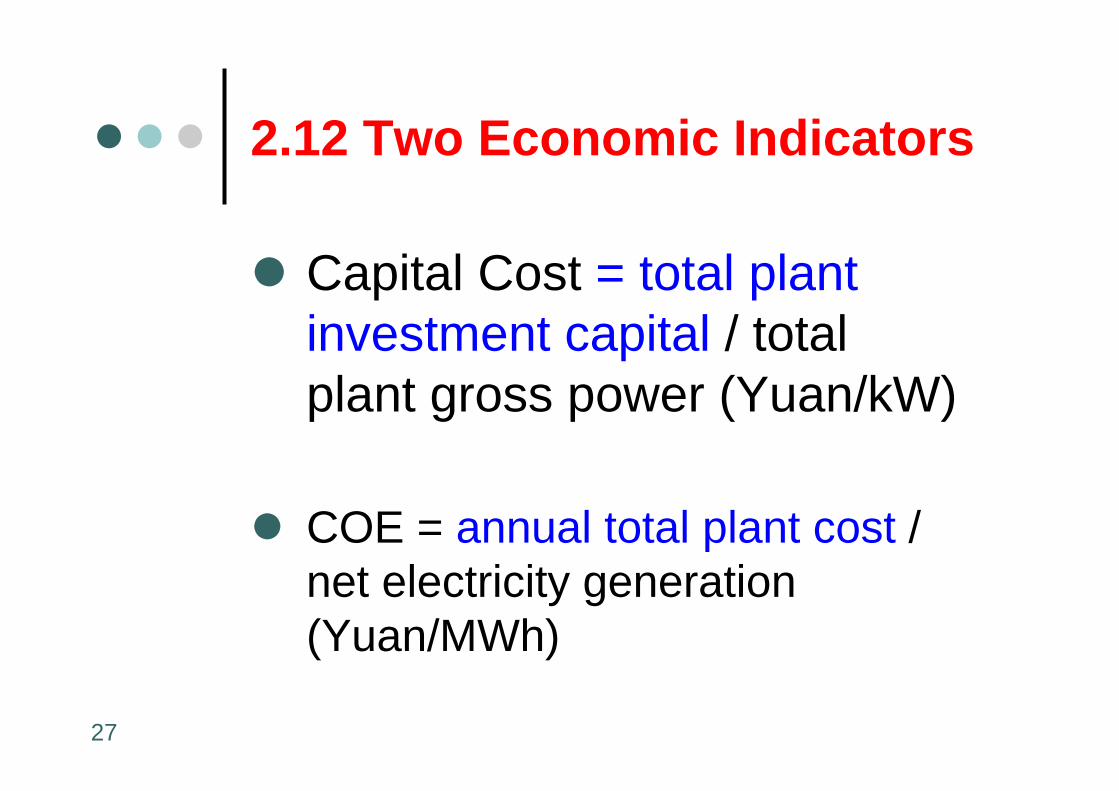
2.12 Two Economic Indicators
Capital Cost = total plant investment capital / total plant gross power (Yuan/kW)
COE = annual total plant cost / net electricity generation (Yuan/MWh)

28
2.13 Data Collection
Pathways to data collectionPlant visitsTechnology vendor and manufacturer contacts Attendance at conferencesInterviews with experts

29
Air Separation Unit (equipment, construction engineering, and installation engineering)China Huadian Corporation
Air Liquide (Hangzhou) LTD., CO.7
Air Separation Unit (equipment, construction engineering, and installation engineering)
Air Products and Chemicals (China)6
Entrained-bed gasifier, including GE, Shell, and new coal-water slurry with opposed multi-nozzles gasifier
East China University of Science and Technology4
Fluidized bed gasifier (equipment, construction engineering, and installation engineering)
Jilin Changshan Fertilizer (Group) Co., LTD.2
Fixed bed gasifier (equipment, construction engineering, and installation engineering)Shan Xi Fertilizer plant1
ContentsTitle No.
6B and 9E gas turbines, HRSG , steam turbine, auxiliary system, Control system, electric system, water treatment system, water supply system, fuel supply system, thermodynamic system
Nanjing Turbine & Electric Machinery (Group) Co., LTD.
8
Gaisifier manufacturerSichuan BluestarMachinery Co., Ltd5
Entrained-bed gasifier (new coal-water slurry with opposed multi-nozzles gasifier), sysgas cleanup unit (equipment, construction engineering, and installation engineering)
Yankuang Group3
30
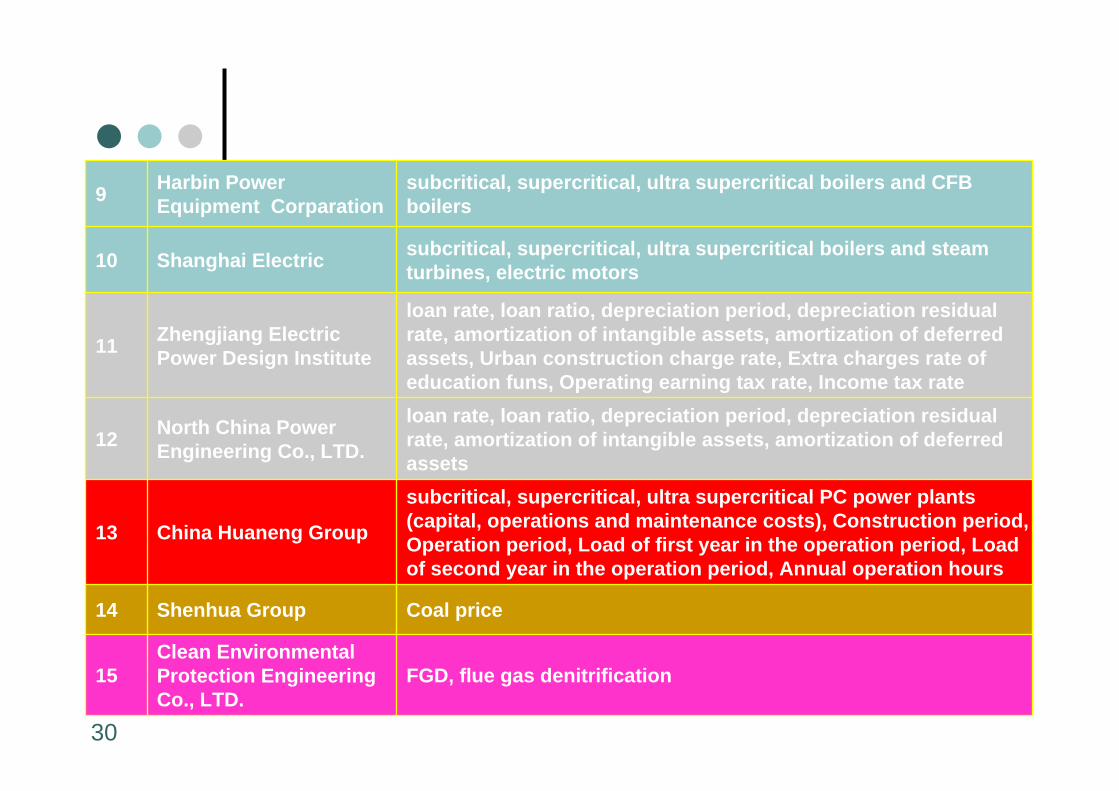
FGD, flue gas denitrificationClean Environmental Protection Engineering Co., LTD.
15
Coal priceShenhua Group14
loan rate, loan ratio, depreciation period, depreciation residual rate, amortization of intangible assets, amortization of deferred assets
North China Power Engineering Co., LTD.12
subcritical, supercritical, ultra supercritical boilers and steam turbines, electric motorsShanghai Electric10
subcritical, supercritical, ultra supercritical boilers and CFB boilers
Harbin Power Equipment Corparation9
subcritical, supercritical, ultra supercritical PC power plants (capital, operations and maintenance costs), Construction period, Operation period, Load of first year in the operation period, Load of second year in the operation period, Annual operation hours
China Huaneng Group13
loan rate, loan ratio, depreciation period, depreciation residual rate, amortization of intangible assets, amortization of deferred assets, Urban construction charge rate, Extra charges rate of education funs, Operating earning tax rate, Income tax rate
Zhengjiang Electric Power Design Institute11

31
3. Calculation Results

32
3.1 Technological Performance
228.1
251.2
600
1200
1200
1200
Gross Power (MWe)
37.6% 10(CFB)
41.5% 9(USC)
40.5%11(IGCC)
41.2 %12(IGCC)
40.6% 6(SC)
Net Design Efficiency
(LHV)CASE
39.5% 3
(subcritical)
Net Design Efficiency (%)
35
36
37
38
39
40
41
42
43
Sub-cr
itical
PC
Sub-cr
itical
PC+FGD
Sub-cr
itical
PC+FGD+SNCR
SC PCSC PC+FGD
SC PC+FGD+SNCR
USC PCUSC PC+FGD
USC PC+FGD+SNCR
CFB
IGCC (M
ulti-N
ozzle
gasif
ier)
IGCC (d
ry co
al pu
lveriz
ed)
Net
Des
ign
Effic
ienc
y (%
)

33
3.2 Environmental Performance
SO2 Emissions
0
100
200
300
400
500
600
700
800
Sub-cr
itical
PCSub
-critic
al PC+FGD
Sub-cr
itical
PC+FGD+SNCR
SC PC
SC PC+FGDSC PC+FGD+SNCR
USC PCUSC PC+FGD
USC PC+FGD+SNCR
CFB
IGCC (M
ulti-N
ozzle
gasif
ier)
IGCC (d
ry co
al pu
lveriz
ed)
SO2 Emissions(mg/Nm3)
400mg/Nm3
759mg/Nm3
38mg/Nm3 38mg/Nm3 38mg/Nm3
76mg/Nm3
2mg/Nm3

34
3.2 Environmental Performance (cont.)
NOx Emissions
0
50
100
150
200
250
300
350
400
450
500
Sub-cr
itical
PCSub
-critic
al PC+FGD
Sub-cr
itical
PC+FGD+SNCR
SC PCSC PC+FGD
SC PC+FGD+SNCR
USC PCUSC PC+FGD
USC PC+FGD+SNCR
CFB
IGCC (M
ulti-N
ozzle
gasif
ier)
IGCC (d
ry co
al pu
lveriz
ed)
NO
x Em
issi
ons (
mg/
Nm
3)450mg/Nm3
270mg/Nm3 250mg/Nm3240mg/Nm3

35
3.2 Environmental Performance (cont.)
Particulate Matter Emissions
0
10
20
30
40
50
60
Sub-cr
itical
PCSub
-critic
al PC+FGD
Sub-cr
itical
PC+FGD+SNCR
SC PCSC PC+FGD
SC PC+FGD+SNCR
USC PCUSC PC+FGD
USC PC+FGD+SNCR
CFB
IGCC (M
ulti-N
ozzle
gasif
ier)
IGCC (d
ry co
al pu
lveriz
ed)
Parti
cula
te M
atte
r Em
issi
ons (
mg/
Nm
3)
50mg/Nm3
10mg/Nm3
40mg/Nm3
53mg/Nm3

36
3.2 Environmental Performance (cont.)
CO2 Emissions
0100200300400500600700800900
1000
Sub-criti
cal PC
Sub-crit i
cal PC+FGD
Sub-crit i
cal PC+FGD+SNCR
SC PCSC PC+FGD
SC PC+FGD+SNCRUSC PC
USC PC+FGD
USC PC+FGD+SNCR
CFB
IGCC (M
ulti-Nozz
le gas
ifier)
IGCC (d
ry co
al pulv
erized
)
CO2
Emiss
ions
(g/k
Wh)
805g/kWh827g/kWh 786g/kWh 717g/kWh
715g/kWh

37
3.3 Economic Assessment
0100020003000400050006000700080009000
10000
Sub-criti
cal PC
Sub-criti
cal PC+FGD
Sub-criti
cal PC+FGD+SNCR
SC PCSC PC+FGD
SC PC+FGD+SNCRUSC PC
USC PC+FGD
USC PC+FGD+SNCR
CFB
IGCC (M
ulti-Nozz
le gas
ifier)
IGCC (d
ry co
al pulv
erized
)
capi
tal c
ost (
Yua
n/kW
)
Capital Cost (Yuan/kW)8823
7433
4566
4137
3942
3762
Capital Cost
(Yuan/kW)
10(CFB)
9(USC)
11(IGCC)
12(IGCC)
6(SC)
CASE
3(subcriti
cal)

38
3.3 Economic Assessment (cont.)
COE (Yuan/MWh)
200
250
300
350
400
450
Sub-cr
itical
PC
Sub-cr
itical
PC+FGD
Sub-cr
itical
PC+FGD+SNCR
SC PCSC PC+FGD
SC PC+FGD+SNCR
USC PCUSC PC+FGD
USC PC+FGD+SNCR
CFB
IGCC (M
ulti-N
ozzle
gasif
ier)
IGCC (d
ry co
al pu
lveriz
ed)
Yua
n/M
Wh
COE
COE (including charges for emitting pollutants)

39
3.3 Economic Assessment (cont.)
COE (Yuan/MWh)
4.85 276.935.25 276.22
6(SC+FGD+flue
gas denitrification)
9.02
Cost of Pollutant control unit ( not
including charges for emitting pollutants)
272.08
264.47
COE including charges for
emitting pollutants
7.61
Cost of Pollutant control unit
(including charges for emitting pollutants)
270.97
261.95
COE not including
charges for emitting
pollutants
5(SC+FGD)
CASE
4(SC)

40
3.3 Economic Assessment (cont.)
Impacts of Coal Price on COE (including charges for emitting pollutants, Yuan/MWh)
293.28
232.92
210.35
208.98
209.57
380
326.67
269.6
243.55
242.95
244.48
480
309.93 275.58 177.16 143.97 USC
PC+FGD+SNCR (case 9)
342.96 306.28 196.24 159.57 CFB (case 10)
259.89
175
174.66
280
360.06
276.93
279.39
580
393.45
310.9
314.3
680
226.5
141.02
139.75
180
IGCC (Multi-Nozzle Gasifier)
(case 11)
SC PC+FGD+SNCR
(case 6)
Price of Coal(Yuan/tonne )
SubcriticalPC+FGD+SNCR
(case 3)

41
3.4 Comparison of cost between the U.S. and China
ChinaU.S.
80.578
63.364
COE, $/MWh
48.0991 1813IGCC-GE1176
526 502
Capital Cost, $/kW
51.5
36.9 37.3
COE, $/MWh
1977
15751549
Capital Cost, $/kW
IGCC-Shell
Supercritical
Plant Type
Subcritical
Exchange rate: 7.5U.S. data source: Cost and Performance Baseline for Fossil Energy Plants, NETL, August 2007

42
4. Next Steps

43
Next Steps
Deployment policies (current & options)Electricity policies & pricingIGCC market demandPolicy recommendations for IGCCScenario analysis of coal power mix in 2020
44
5. Final Remarks

45
Final Remarks
Regarding emissions, PC plants coupled with pollution control technologies, CFB, and IGCC can meet the SO2, NOx and particulate matter emissions requirements of the Chinese government todayOnly levying charges for emitting pollutants is not enough to encourage power plants to install pollution control equipment
46
Final Remarks (cont.)
From the point of view of efficiency, SC and USC units are good choices for power industryThe cost of IGCC is much higher than that of other power generation technologiesIncentive policies are needed to deploy IGCC in China

47
Acknowledgement
William and Flora Hewlett FoundationBP Carbon Mitigation InitiativeBP Alternative Energythe Woods Hole Research CenterShell Exploration and ProductionPackard Foundation