Economic Appraisal of Wood Smoke Control Measures Report · AECOM Economic Appraisal of Wood Smoke...
95
Office of Environment and Heritage 29 June 2011 Economic Appraisal of Wood Smoke Control Measures Final Report
Transcript of Economic Appraisal of Wood Smoke Control Measures Report · AECOM Economic Appraisal of Wood Smoke...

Office of Environment and Heritage 29 June 2011
Economic Appraisal of Wood Smoke Control Measures Final Report
AECOM Economic Appraisal of Wood Smoke Control Measures - Final Report
29 June 2011
Economic Appraisal of Wood Smoke Control Measures Final Report
Prepared for
Office of Environment and Heritage
Prepared by AECOM Australia Pty Ltd ABN 20 093 846 925
60200511
© Copyright State of NSW and the Office of Environment and Heritage
This report was prepared by AECOM Australia Pty Ltd in good faith excercising all due care and attention, but no representation or warranty,
express or implied, is made as to the relevance, accuracy, completeness or fitness for purpose of this document in respect of any particular user's
circumstances. Users of this document should satisfy themselves concerning its application to, and where necessary seek expert advice in respect
of, their situation. The views expressed within are not necessarily the views of the Office of Environment and Heritage (OEH) and may not
represent OEH policy.
AECOM has prepared this document for the sole use of OEH and for a specific purpose, each as expressly stated in the document. No other
party should rely on this document without the prior written consent of AECOM. AECOM undertakes no duty, nor accepts any responsibility, to any third party who may rely upon or use this document. This document has been prepared based on OEH's description of its requirements and AECOM’s experience, having regard to assumptions that AECOM can reasonably be expected to make in accordance with sound professional principles. AECOM may also have relied upon information provided by OEH and other third parties to prepare this document, some of which may not have been verified. Subject to the above conditions, this document may be transmitted, reproduced or disseminated only in its entirety.

AECOM Economic Appraisal of Wood Smoke Control Measures - Final Report
29 June 2011
Table of Contents Executive Summary i 1.0 Introduction 1 2.0 Wood heaters in NSW 2 3.0 Current NSW policy 7
3.2 Qualitative assessment of current wood smoke policy 9 4.0 Potential Policy Measures for Wood Smoke Control 11
4.2 Potential measures 13 5.0 Preliminary Assessment of Options 15
5.1 Criteria 15 5.2 Business as usual 18 5.3 Ban on new wood heaters 18 5.4 Efficiency standard and emission limits 19 5.5 Phase out 20 5.6 Wood fuel moisture content regulations 22 5.7 Tax on new wood heaters 23 5.8 Licensing fees 24 5.9 Tax on fuels 24 5.10 Cash incentive phase out 25 5.11 Summary of screening assessment 27 5.12 Control options for further development/evaluation 28
6.0 Cost Benefit Analysis of Core Options 29 6.1 Projections 29 6.2 Administration and enforcement costs 40 6.3 Cost to industry 42 6.4 Impact on consumers 43 6.5 Transfer payment - government tax revenue 45 6.6 Benefits of avoided health costs 45 6.7 Greenhouse gas emissions assessment 47 6.8 Cost benefit analysis results 48 6.9 Sensitivity analysis 53
7.0 Social and Spatial Assessment 54 7.1 Spatial analysis 54 7.2 Social analysis 55
8.0 Cost Benefit Analysis of Combined Options 57 8.1 Selection of combined options 57 8.2 Case study area selection 58 8.3 Stock and emissions projections 59 8.4 Administration and enforcement costs 62 8.5 Cost to industry 63 8.6 Loss of consumer surplus 63 8.7 Government tax revenue 63 8.8 Health benefits 64 8.9 Summary results for combined options 65
9.0 Conclusion 67 References 68 Appendix A A
Checklist for Assessing Regulatory Quality A Appendix B B
Stock and emission projections (2010-2040) under BAU B Appendix C C
Case Study Area Assessment C

AECOM Economic Appraisal of Wood Smoke Control Measures - Final Report
29 June 2011
i
Executive Summary This report, commissioned by the NSW Office of Environment and Heritage, examines suitable approaches to reduce particle (PM2.5 and PM10) and volatile organic compound (VOC) emissions associated with the operation of domestic wood heaters, and provides an assessment of their costs and benefits. The report also develops several potential combined approaches to controlling wood smoke to a series of case study areas.
Wood smoke is a source of air pollution in urban and semi rural settings in NSW (DECCW, 2010). While a small percentage of homes use wood heating in Sydney, smoke from wood heaters account for 48 per cent of fine (PM10) and 60 per cent of very fine (PM2.5) winter particle pollution. In colder climates, such as in Armidale, wood heaters can contribute over 85 per cent of winter particulate pollution (DECCW, 2010).
There are a range of factors that influence the choice of heating system in NSW and promote the use of wood heaters. These factors include but are not limited to:
- heating costs
- climatic factors
- availability of gas reticulation networks.
A number of assessments have been undertaken on the potential health costs associated with a range of chemicals and particulate matter in wood smoke (DITRDLG, 2010; Beer, 2002; Coffey, 2003; BDA, 2006, US EPA 2010). The range of estimates for the health costs associated with VOC and, PM10 were reviewed from the literature and the most relevant health cost per tonne of each substance (expressed in 2010 dollars) were included in a cost benefit analysis of the wood smoke control options.
A preliminary assessment revealed a range of potential wood smoke control options. These options were:
- ban on heater sales
- efficiency standards and emissions limits
- phase out at time of sale of house
- fuel moisture content regulation
- tax on new wood heaters
- licensing fees
- tax on wood fuel
- cash incentive phase out.
A model was developed for preparing wood heater stock forecasts and emission projections. The model took into account the stock and mix of wood heaters (slow combustion heater, open fireplace and potbelly stove) and their emission rates.
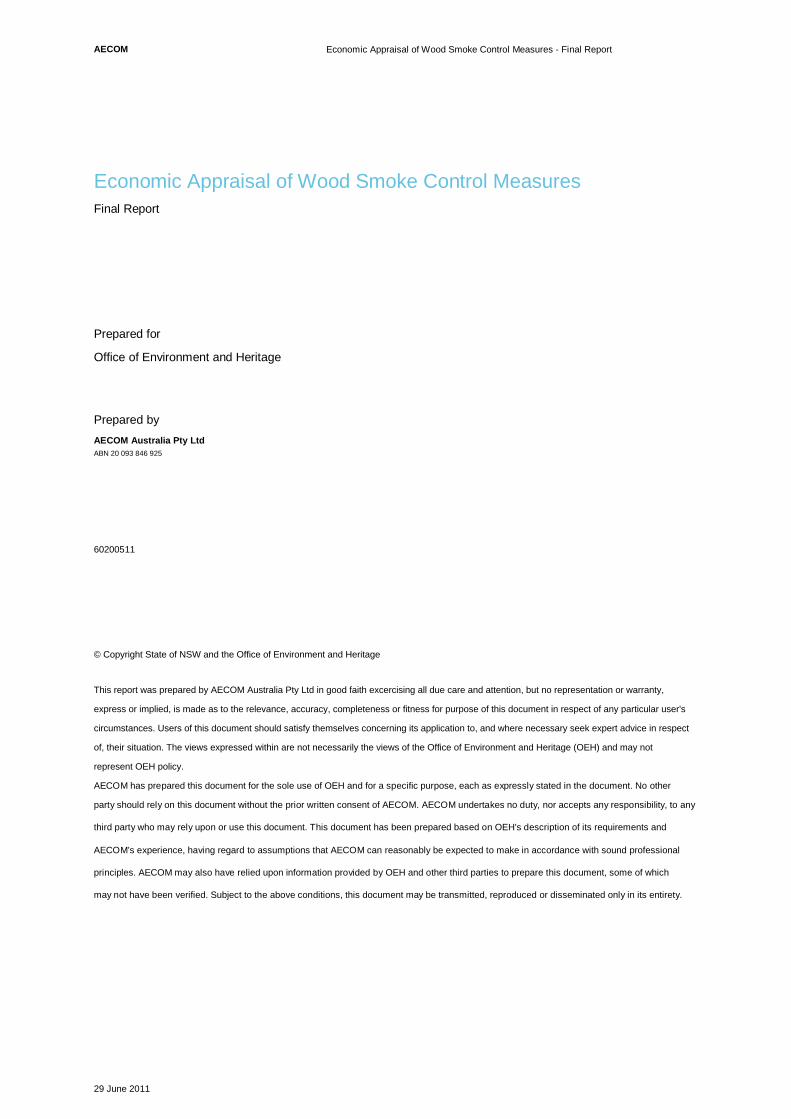
A visual comparison of these projections is shown in Figure 1. The wood heater stock under business as usual shows a small decline out to 2030. The projections of wood heater stocks for the efficiency standard/emissions limit and fuel moisture content options do not deviate from the BAU projection1.
The most significant reduction in stock is a result of the phase out option with similar reductions in stock by 2030 under the ban on new wood heater sales. The remaining options, tax on new wood heaters, licensing fees, wood fuel tax and cash incentive phase out, have lower impacts on the projected stock of wood heaters.
1 A comparison of the BAU and ABARE projections on domestic biomass fuel use was made. ABARE projections show a levelling off of fuel consumption to 2030 while BAU projections forecast a slight reduction in heater ownership and emission. Detail of ABARE forecasting method and assumptions were not available to allow more rigorous comparison.
AECOM Economic Appraisal of Wood Smoke Control Measures - Final Report
29 June 2011
ii
Figure 1 Stock projections for different options
Source: AECOM stock model
Reductions in the stock of wood heaters provide an indication of the effectiveness of each option to reduce wood smoke emissions however it is not a final measure since Options 3 (efficiency standard/emissions limit) and 5 (fuel moisture content regulation) also reduce the emission rate per heater. An assessment of the PM10 emissions associated with each option is provided in Figure 2.
0
50,000
100,000
150,000
200,000
250,000
300,000
350,000
400,000
2010 2011 2012 2013 2014 2015 2016 2017 2018 2019 2020 2021 2022 2023 2024 2025 2026 2027 2028 2029 2030
No.
of w
ood
heat
ers
BAU/Efficiency standard/Fuel moisture content Ban on heater sales
Phase out Tax on new wood heaters
Licensing fees Wood fuel tax
Cash incentive phase out

AECOM Economic Appraisal of Wood Smoke Control Measures - Final Report
29 June 2011
iii
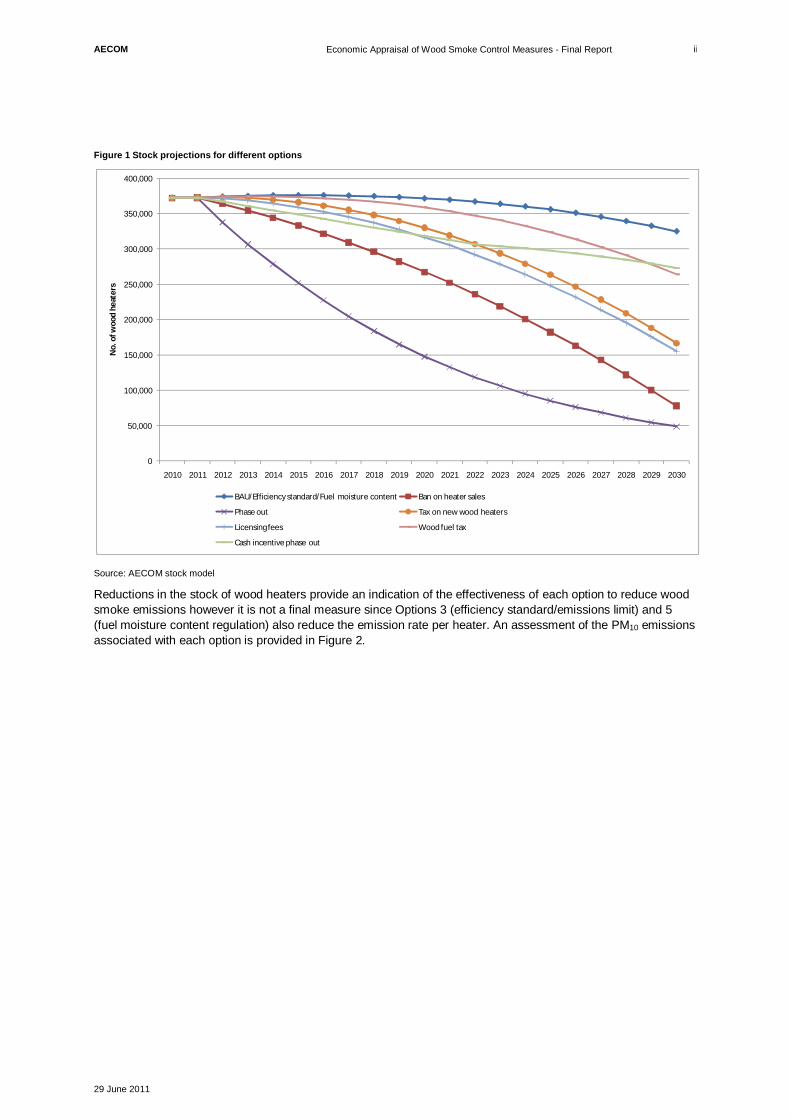
Figure 2 PM10 emissions projects for each option
Source: AECOM stock model
VOC emissions were not projected separately but assumed to change according to PM10 emissions. Option 2 (state-wide ban) and option 4 (phase out) provide the most rapid overall reductions in PM10 while option 6 (tax on new wood heaters) and option 7 (licensing fee) are the next most successful at reducing emissions. Option 6 (wood fuel tax), option 9 (cash incentive) and option 3 (efficiency measures) provide modest reductions in emissions to BAU. Option 5 (fuel moisture content regulation) provides relatively little emissions reduction compared to BAU.
To calculate the net benefit of each option the cost benefit analysis considered:
- administration costs
- costs to consumers
- costs to industry
- health benefits.
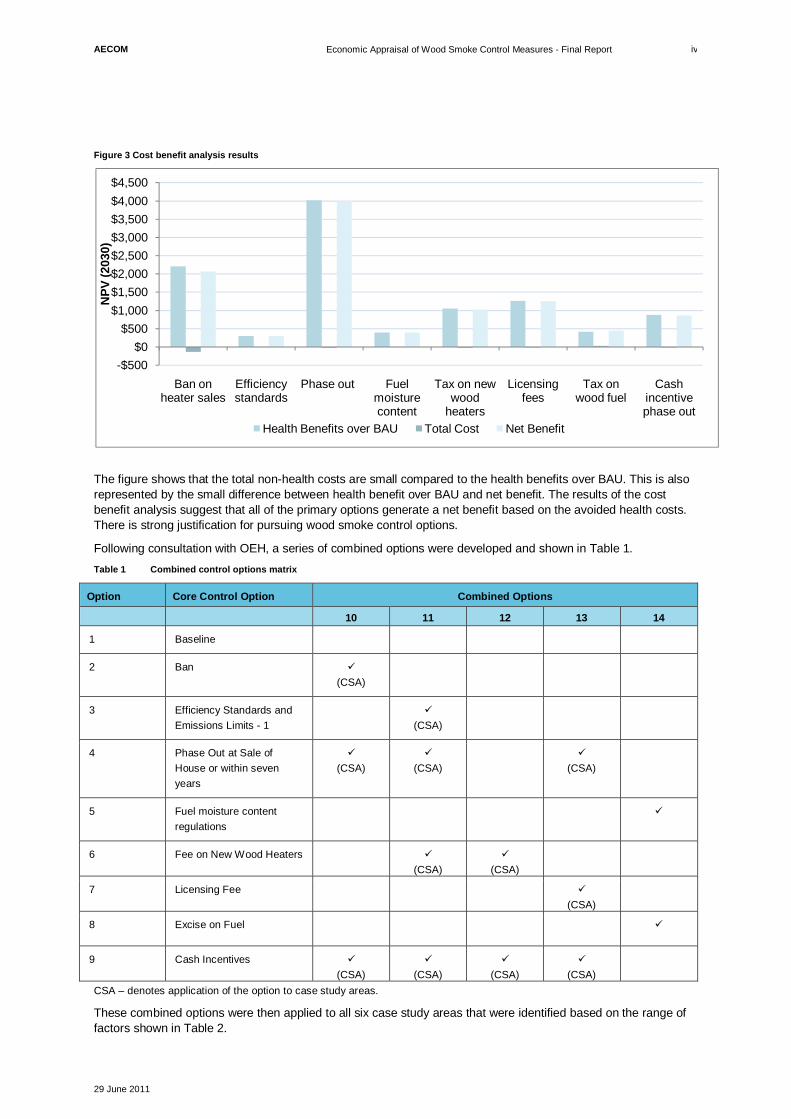
The option with the highest net benefit is the phase out of wood heaters with over $7.1 billion out to 2030. The ban on heater sales has the second highest net benefit however this option has the highest non-health costs which are particularly high for industry.
The market based mechanisms have similar net benefits while the lowest net benefit is from the fuel moisture content regulation. The results of the cost benefit analysis are presented in Figure 3.
0
2,000
4,000
6,000
8,000
10,000
12,000
14,000
2010 2015 2020 2025 2030
Tonn
es o
f PM
10
BAU Ban on heater sales Phase out
Tax on new wood heaters Licensing fees Wood fuel tax
Cash incentive phase out Efficiency standards Fuel moisture content
AECOM Economic Appraisal of Wood Smoke Control Measures - Final Report
29 June 2011
iv
Figure 3 Cost benefit analysis results
The figure shows that the total non-health costs are small compared to the health benefits over BAU. This is also represented by the small difference between health benefit over BAU and net benefit. The results of the cost benefit analysis suggest that all of the primary options generate a net benefit based on the avoided health costs. There is strong justification for pursuing wood smoke control options.
Following consultation with OEH, a series of combined options were developed and shown in Table 1. Table 1 Combined control options matrix
Option Core Control Option Combined Options
10 11 12 13 14
1 Baseline
2 Ban (CSA)
3 Efficiency Standards and Emissions Limits - 1
(CSA)
4 Phase Out at Sale of House or within seven years
(CSA)
(CSA)
(CSA)
5 Fuel moisture content regulations
6 Fee on New Wood Heaters (CSA)
(CSA)
7 Licensing Fee (CSA)
8 Excise on Fuel
9 Cash Incentives (CSA)
(CSA)
(CSA)
(CSA)
CSA – denotes application of the option to case study areas.
These combined options were then applied to all six case study areas that were identified based on the range of factors shown in Table 2.
-$500$0
$500$1,000$1,500$2,000$2,500$3,000$3,500$4,000$4,500
Ban on heater sales
Efficiency standards
Phase out Fuel moisture content
Tax on new wood
heaters
Licensing fees
Tax on wood fuel
Cash incentive phase out
NPV
(203
0)
Health Benefits over BAU Total Cost Net Benefit

AECOM Economic Appraisal of Wood Smoke Control Measures - Final Report
29 June 2011
v
Table 2 Case Study Areas
Case study area
Ownership ratio
Number of heaters
Number of dwellings
Population density (persons per sq/km)
New release area
Climate Gas availability
% of owners in low income groups
Balmain to Strathfield
4% 4,877 124,621 4,468 No Mild Yes Low
Liverpool 7% 5,408 80,438 854 Yes Mild Yes High
Blacktown to Penrith
7% 10,999 158,134 216 No Mild Yes Medium
Blue Mountains
28% 7,188 26,042 34 No Cool Yes High
South Eastern statistical region
9% 32,786 363,616 4 No Cold No High
Illawarra statistical region
14% 34,756 257,395 53 Yes Cool Yes High
The results of the case study area cost benefit analysis are presented in Figure 4. The stock and emissions projections for all of the case study areas are contained in Appendix C. Figure 4 Cost benefit analysis of combined options chart
The graph of the combined options shows the differences in net benefit between the combined options. The results of the cost benefit analysis provide a set of considerations:
- The inclusion of a mandated phase out at time of sale generates significant reductions and is common across the three most effective combined options (Combined option 10, 11 and 13).
- The introduction of a ban in the case study area is a significant source of emissions reduction.
- The introduction of fuel moisture content regulations and fuel taxes in case study areas generate relatively small emissions reductions.
- Combined options can be used to maximise health benefits while minimising the cost to consumers, industry and government.
-$400-$200
$0$200$400$600$800
$1,000$1,200$1,400$1,600$1,800
Combined option 10 Combined option 11 Combined option 12 Combined option 13 Combined option 14
NPV
(203
0)
Health Benefits over BAU Total Cost Net Benefit
AECOM Economic Appraisal of Wood Smoke Control Measures - Final Report
29 June 2011
vi
A spatial analysis of the impacts can guide the formulation of social assistance measures that would minimise any identified inequitable distributional impacts, specifically on lower income groups i.e. similar to what is being contemplated for the national implementation of a carbon tax.
It should noted that the case study analysis understates the potential health benefits of wood smoke reduction in regional and rural areas as it uses a whole-of-LGA population density. Actual health benefits may higher where the reductions occur in the higher density settlements of the LGA.
Apart from the cash incentive program, implementation of most of the control policies will require changes to the current regulatory framework. For example:
- Amendment of existing regulatory instruments is required to set tighter heater standards unless the corresponding national review results in national standards similar to Options 3 and 11 discussed in this report .
- Local councils have used their planning powers to impose a ban on heater installation in their respective areas. However, for control policies that apply such ban on a broader area comprising several regions, they would either need to be implemented through strategic policy co-ordination and cooperation of all relevant local governments; or put into effect by Government through a regulation under the Protection of Environment Operations (POEO) Act 1997 or planning laws.
- For wood smoke control options that require payment of a tax or levy, it is envisaged that a regulatory approach similar to that used for setting the waste and environment levy under the POEO Act, would be necessary, including requiring purchasers to pay a contribution; determining the levy; defining where the levy applies i.e. 'regulated area' of NSW.
An optimum timeframe should achieve the right balance between implementing wood smoke policies as early as possible to avoid further health costs to the community and allowing adequate time for affected parties to adjust. It appears that the most suitable approach would be to implement the selected policies in a staged process with early commencement but extend their full application or coverage over several years e.g. raising efficiency standards progressively.

AECOM Economic Appraisal of Wood Smoke Control Measures - Final Report
29 June 2011
1
1.0 Introduction The Office of Environment and Heritage (OEH) in the Department of Premier and Cabinet commissioned an assessment of measures to control wood smoke from domestic wood heaters in New South Wales (NSW). The objective of the study is to assess the costs and benefits of suitable approaches to reduce particle (PM10) and volatile organic compound (VOC) emissions associated with the operation of domestic wood heaters.
Figure 5 provides a conceptual overview of AECOM’s methodology for the project.
Figure 5 Study methodology
Source: AECOM
This project provides information and analysis to support policy development for the control of wood smoke in areas across NSW. In particular, this report:
- qualitatively assesses the current wood smoke control policy in NSW
- details the baseline model and a preliminary assessment of potential control measures to be included in the cost benefit analysis
- summarises the cost benefit analysis conducted on the measures identified in the preliminary assessment as well as identifying potential socio-economic impacts
- tabulates the assessment of the net public benefit of the potential options and other selected criteria.

AECOM Economic Appraisal of Wood Smoke Control Measures - Final Report
29 June 2011
2
2.0 Wood heaters in NSW 2.1.1 Wood heaters usage
Wood smoke is a source of air pollution in urban and semi rural settings in NSW (DECCW, 2010). While a small percentage of homes use wood heating in Sydney, smoke from wood heaters account for 48 per cent of fine (PM10) and 60 per cent of very fine (PM2.5) winter particle pollution. In colder climates, such as in Armidale, wood heaters can contribute over 85 per cent of winter particulate pollution (DECCW, 2010).
The Australian Bureau of Statistics (ABS) regularly collects data on heating sources within homes. The results of the latest survey are reported in Environmental Issues: Energy Use and Conservation 2008 (ABS, 2008). The percentage of NSW households using wood heaters as a source of heating is summarised in Table 3.
Table 3 Wood heater usage, NSW
Wood heater type % of NSW households Approx. no. of households
Combustion 12.10 323,000
Open fire 1.20 31,500
Pot-belly 0.40 10,500
Total 13.70 365,000 Source: ABS, 2008
As noted above, there are approximately 365,000 wood heaters in use in NSW. The Regulatory Impact Statement: Proposed Protection of the Environment Operations (Clean Air) Regulation 2010 identified the current sale of wood heaters in NSW as approximately 9,600 per year (DECCW, 2010).
2.1.2 Factors influencing heating choice
There are a range of factors that influence the choice of heating system in NSW and promote the use of wood heaters. These factors include but are not limited to:
- heating costs
- climatic factors
- availability of gas reticulation networks.
Heating costs
The cost of wood heating as a source of primary heating for a home is one of the factors in the use of wood heaters. Other factors include household income; age of residence, comfort, convenience and the aesthetic value.
A detailed assessment has been undertaken on the operating costs associated with different heating systems by the Victorian Government based on a Thermal Simulation program for a typical new home with R2.5 ceiling insulation and R1.0 wall insulation. The results of this assessment are presented in Figure 6 (Sustainability Vic, 2002). The running costs are presented as high and low due to the range of variables that affect operating costs, including the size of the heater, operating temperature, hours of operation, energy efficiency and home conditioning area. The date of the assessment, 2002, means the assessment is merely indicative of the price differences between heating types.

AECOM Economic Appraisal of Wood Smoke Control Measures - Final Report
29 June 2011
3
Figure 6 Indicative Operating Costs of Heating Systems
Source: Sustainability Vic, 2002
Slow combustion wood heaters are one of the most affordable forms of heating and their operating costs are comparable to efficient reverse-cycle air conditioners and natural gas space heaters. The relatively lower cost of wood heating is particularly significant in areas of NSW without gas reticulation which removes the choice of natural gas space heaters. This lack of heating alternatives may be further exacerbated by the fact that heat pump heating (through split-system and reverse-cycle air conditioning) are an inefficient heating source in very cold climates with temperatures less than 4.4°C (US DOE, 2011). The cost difference may also be affected by the fact that a significant proportion of wood heater users source free wood fuel through scavenging. A survey for the NSW EPA in 2003 shows that the over 50 per cent of the respondent sourced fuel from friends/relatives or through local scavenging (Todd, 2003).
This has potential implications for low income groups who use wood heaters as an affordable primary heating source. An assessment of potential control measures that affect the cost of heating or influence the transition to alternative heating systems should include consideration of the impact on low income groups.
Climatic factors
The varying climatic regions of NSW mean that household heating use varies across the state. The Bureau of Meteorology has developed a process to record the number of heating degree days2 in a year that households in an area would require home heating. The national map for heating degree days is presented in Figure 7.
2 The heating degree days are determined by the difference between the average daily temperature and the comfort level temperature. For example, if heating is being considered to a temperature comfort level of 18 degrees, and the average daily temperature for a particular location was 14 degrees, then heating equivalent to 4 degrees (4 heating degree days) would be required to maintain a temperature of 18 degrees for that day. However if the average daily temperature was 20 degrees then no heating would be required, so the number of heating degree days for that day would be zero.

AECOM Economic Appraisal of Wood Smoke Control Measures - Final Report
29 June 2011
4
Figure 7 National annual heating degree days
Source: Australian Bureau of Meteorology, 2011
The heating degree day map reveals that parts of NSW, such as the South East and Riverina regions as well as parts of North East have relatively high heating requirements in comparison to areas in the North West and coastal areas.
Gas reticulation network
The spatial distribution of wood heaters may also be influenced by the availability of a gas reticulation network. As noted in Figure 6, space heating using natural gas can have similar operating costs to wood heaters. The cost of alternative systems such as electrical heating is significantly higher than wood heaters.
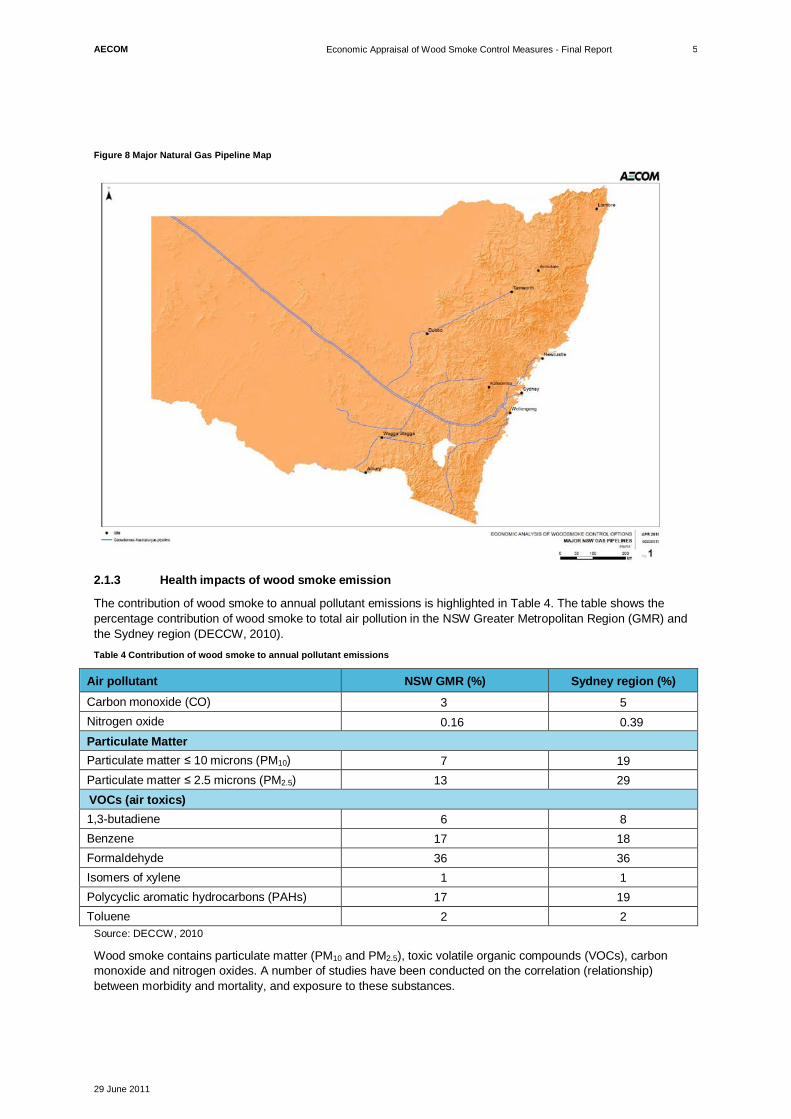
Geoscience Australia maintains a map of the reticulated gas network in NSW (Geoscience Australia, 2010) replicated in Figure 8. The map shows that the gas network is located in eastern NSW and concentrated around Sydney and Canberra. The northern and a large proportion of southern NSW have no gas network reticulation and rely on LPG deliveries.
The combination of high heating requirements and lack of access to low cost gas heating may create greater incentives for meeting heating requirements through wood heaters. These areas may also have higher wood heater use and subsequently higher levels of wood smoke than other areas.
AECOM Economic Appraisal of Wood Smoke Control Measures - Final Report
29 June 2011
5
Figure 8 Major Natural Gas Pipeline Map
2.1.3 Health impacts of wood smoke emission
The contribution of wood smoke to annual pollutant emissions is highlighted in Table 4. The table shows the percentage contribution of wood smoke to total air pollution in the NSW Greater Metropolitan Region (GMR) and the Sydney region (DECCW, 2010). Table 4 Contribution of wood smoke to annual pollutant emissions
Air pollutant NSW GMR (%) Sydney region (%) Carbon monoxide (CO) 3 5 Nitrogen oxide 0.16 0.39 Particulate Matter Particulate matter 10 microns (PM10) 7 19 Particulate matter 2.5 microns (PM2.5) 13 29 VOCs (air toxics) 1,3-butadiene 6 8 Benzene 17 18 Formaldehyde 36 36 Isomers of xylene 1 1 Polycyclic aromatic hydrocarbons (PAHs) 17 19 Toluene 2 2
Source: DECCW, 2010
Wood smoke contains particulate matter (PM10 and PM2.5), toxic volatile organic compounds (VOCs), carbon monoxide and nitrogen oxides. A number of studies have been conducted on the correlation (relationship) between morbidity and mortality, and exposure to these substances.

AECOM Economic Appraisal of Wood Smoke Control Measures - Final Report
29 June 2011
6
Particulates
Particulates are a broad class of chemically and physically diverse substances and are derived from natural sources (dusts from soil, pollens and fungi, sea salt, forest fires) as well as anthropogenic sources (combustion of fossil fuels from both stationary and mobile sources, biomass burning and industry) (Coffey, 2003). A summary of these studies is provided by the Australian Government which states that fine and ultrafine particles appear to affect health outcomes such as mortality and respiratory and cardiovascular morbidity and appear to do so independently of each other (DEH, 2004)
In particular, the health effects of PM10 and PM2.5 include:
- increased mortality, particularly respiratory and cardiovascular diseases
- inflammation of lungs
- increased respiratory illness (e.g., bronchitis, asthma) and symptoms (e.g., cough)
- adverse effects on cardiovascular system
- increased medication use and hospitalisation.
While the number of people susceptible to hospitalisation due to acute PM exposure is probably also small, the number of people susceptible to less serious health effects such as increased respiratory symptoms, decreased lung function, or other physiologic changes may be large (Pope, 2000).
Volatile Organic Compounds
Wood smoke also contains a range of VOCs that can be hazardous for human health. VOCs such as Benzene, Formaldehyde and Polycyclic Aromatic Hydrocarbons (PAHs) can be released into the air from the combustion of wood. Some of these VOCs such as Benzene have been classified by the US EPA as a known human carcinogen (cancer causing) and the PAHs as a probable human carcinogen (US EPA IRIS, 2011).
Carbon Monoxide
Carbon Monoxide (CO) is a clear, odourless gas that reduces the blood’s capacity to carry oxygen to tissues in the body. CO impairs perception and judgment at low levels, with effects increasing to include drowsiness or headaches and general discomfort as levels rise, leading ultimately to convulsions and coma at high concentrations (Coffey, 2003).
2.1.4 Health cost of wood smoke
A number of assessments have been undertaken on the potential health costs associated with a range of chemicals and particulate matter (DITRDLG, 2010; Beer, 2002; Coffey, 2003; BDA, 2006). The range of estimates for the health costs associated with VOCs, and PM10 have been reviewed with the aim of employing the most relevant health cost per tonne of each substance (expressed in 2011 dollars) in the cost benefit analysis.

AECOM Economic Appraisal of Wood Smoke Control Measures - Final Report
29 June 2011
7
3.0 Current NSW policy New South Wales and its local governments have implemented regulatory measures, local planning controls, financial incentive programs and education programs for wood heaters and wood smoke (DECCW, 2010).
These policies, programs and regulations include:
- preventing the sale of new wood heaters that are not certified under the Australian Standard, AS/NZS 4013:1999 – Domestic solid fuel burning appliances (AS/NZS 1999)
- the use of local government planning instruments such as development control plans (DCPs) or local policies to ban the installation of new wood heaters or mandate stricter emissions standards on new wood heaters
- promoting the correct use of wood heaters achieved through advertising and providing information to the community (including targeted education of households)
- periodic wood heater replacement programs
- the use of smoke abatement notices under the Protection of Environment Operations (POEO) Act 1997, which are issued by local councils that require households to undertake smoke mitigation measures
- the inclusion of wood heaters in the Building Sustainability Index (BASIX).
Each of these policies, programs and regulations are discussed below.
3.1.1 Emissions standards
The Protection of the Environment Operations (Clean Air) Regulation 2010 requires that a wood heater cannot be sold (wholesale or retail) in NSW unless the heater is certified under AS/NZS 4013. AS/NZS 4013 certifies that the wood heater does not exceed the maximum emissions allowed of 4.0 grams of particulate matter for each kilogram of wood burnt.
The Clean Air Regulation also states that a person may not alter the structure, exhaust system or inlet air system of any heater of a model that has been certified under AS/NZS 4013.
The Regulatory Impact Statement conducted on the wood heater provisions in the Clean Air Regulation state that the net quantifiable benefit of the provisions is estimated at between $3.55 million and $35.80 million per year, depending on the region where the new, more efficient wood heaters are installed (DECCW, 2010) . This benefit is accrued through the avoided health costs from reduced particulate matter.
This control measure does not impact existing wood heaters but continues to reduce the average emissions of wood heaters in NSW.
Further, an agreement between the states and territories is required to ensure emission standards on new wood heaters in NSW are not subverted by interstate products. This is due to NSW‘s status as a signatory of the Mutual Recognition Agreement (MRA) and associated Marginal Recognition Act 1992. The MRA creates a national market for goods and services, and establishes a regulatory environment to encourage enterprise across states and territories. The effect of the MRA is that goods which are legally saleable in one jurisdiction are able to be sold throughout the country.
3.1.2 Local government planning controls
Under Section 68(1) of the Local Government Act 1993, wood heaters cannot be installed without the approval of the local council however councils can declare installation of a wood heater compliant or exempt development. A small group of local governments in NSW are using DCPs to place controls on wood heaters including outright bans on installation of new wood heaters. Other local government policies have also been introduced such as stricter emissions standards for installed wood heaters.
The most stringent DCPs for wood heaters have been applied in rezoned precincts in the Growth Centres of the GMR. DCPs for Oran Park and Turner Road in the South-West Growth Centre (Camden Council), and North Kellyville in the North-West Growth Centre (The Hills Shire Council) prohibit all open fireplaces and slow combustion stoves. These developments are proposed to provide approximately 16,240 new dwellings (DP, 2011).
These precincts with wood heater bans comprise a relatively small proportion of new land releases in NSW and an even smaller proportion of NSW. The Growth Centres of the GMR plan to provide up to 110,000 new dwellings

AECOM Economic Appraisal of Wood Smoke Control Measures - Final Report
29 June 2011
8
(DP, 2011) over next 25 to 30 years. Based on the percentage of NSW households with wood heaters (13.7%) in Table 3, approximately 15,000 new dwellings are forecast to install a wood heater. The DCPs in place mean approximately 2,500 new dwellings will be potentially prevented from installing a new wood heater however the Growth Centres could still see the installation of approximately 12,500 new wood heaters.
In 2010, Armidale Dumaresq Council passed POL134 – Policy for Sustainable Domestic Energy Use and Local Air Quality to enable consistent and clear assessment of Applications to Council for the approval to install solid fuel (including wood fuel) heating appliances. From 1 March 2011, all applications for solid fuel heaters proposed to be installed in the Armidale Dumaresq Council area will be required to emit less than 3.0 grams of particulate matter for each kilogram of wood burnt with a stricter emissions standard of 2.5 grams per kilogram in particular areas.
DCPs and local policies have an advantage as the measures can be used by local councils to target priority areas for wood heater regulation however the actual application of the DCP is at the discretion of the council as currently there is no state-wide framework to apply such controls consistently.
The application of DCPs for controlling wood smoke differs across the state. As there is no framework to guide council’s application of planning controls, wood smoke emissions may be ineffectively addressed in many affected areas.
3.1.3 Periodic replacement programs
The NSW Government has periodically provided cash incentives to replace older solid-fuel heaters with cleaner heating alternatives. From 2002-2004, the NSW Wood Smoke Reduction Program included a cash rebate of $500 to residents ($700 for eligible pensioners or health-care card holders) to replace wood heaters with cleaner alternative heating sources.
An assessment of the contribution of the Launceston Woodheater Replacement Program, from 2001 to 2005, indicated that the program improved regional air quality by accelerating the existing downward trend in the number of wood heaters in Launceston (CSIRO, 2005) as well as providing incentives for the installation of more efficient wood heaters.
Economic theory suggests that wood heater owners who are already preparing to replace or remove their wood heaters would be the first group to take up a financial incentive as the value of the wood heater would be less than the value of the cash rebate. The effect of this uptake would be that the cash incentive may not lead to the majority of owners accessing the cash rebate and replacing/removing their wood heaters. The cash rebate may only assist existing wood heater owners who were already considering replacing or removing their wood heaters.
A cost benefit analysis conducted on the expansion of a wood heater replacement program to cover the Perth metropolitan area concluded that the program was labour intensive and the costs of the program would outweigh the forecast health benefits (Todd, 2006). The cost benefit analysis assumed that the program would encourage 1,500 wood heaters but the author expressed concern that the incentives were simply passing to the 9,000 households already moving to alternative forms of heating.
3.1.4 Education and information
The NSW Government has implemented a range of programs to educate local councils and the broader community about the health impacts of wood smoke and the need for proper wood heater installation and maintenance.
The NSW Wood Smoke Reduction Program has been the primary program for delivering information to the community and empowering local councils to undertake community awareness programs, chimney surveys and Smoke Abatement Notice training.
The 'Don't Light Tonight – Unless Your Heater's Right' campaign alerts the public via mass media on nights when poor wood smoke dispersion is expected due to cold, still weather and encourages the use of alternative heating.
Education and information is considered a low cost program for influencing consumers’ heating choice and assisting councils in identifying and addressing particularly smoky wood heaters.
Education and information are supporting measures that work well with regulatory and enforcement measures. Community education as a stand-alone project may not deliver significant wood smoke emission reductions. It is often difficult to assess the effectiveness of education and training in reducing wood smoke and influencing consumers’ heating choices.
AECOM Economic Appraisal of Wood Smoke Control Measures - Final Report
29 June 2011
9
Lack of information on the characteristics of wood heater owners and detailed inventory of wood heaters in operation reduces the ability to target information and education to key groups such as regular wood heater users.
3.1.5 Smoke abatement notices
The NSW POEO Act provides regulatory powers for local councils to issue Smoke Abatement Notice (SANs). A SAN is issued where a household has been given information on correct wood heater operation but undertakes little or no effort to prevent excessive emissions of wood smoke. SAN provisions were created primarily as a deterrent to poor wood heater operation. The penalty notice imposes a fine of $200 for individuals and $400 for corporations with the maximum penalty that may be imposed on individuals or corporations at $3,300 by a court.
To date, only a small number of SANs have been issued and there is not sufficient data to assess the overall effectiveness of this measure.
3.1.6 BASIX
The Building Sustainability Index (BASIX) was introduced by the NSW Government to ensure that new and renovated homes are designed to use less potable water and be responsible for fewer greenhouse gas emissions by setting energy and water reduction targets. BASIX assesses the characteristics and key appliances of a house to assess the water and energy efficiency and thermal comfort against the minimum sustainability benchmarks for a local climate zone.
As BASIX focuses on energy and water efficiency, wood heaters are included as a heating/cooling option and are given an energy efficiency rating similar to a 4 star gas heater due to its low energy requirements (BASIX, 2011)3. Since the determination of this rating fails to account for the air pollution of wood smoke and associated public health costs, it provides a perverse incentive for installation of wood heaters. Consideration should be to given to correct the current anomaly and potentially use BASIX as a mechanism to discourage the choice of wood heaters for space heating in new dwellings.
3.1.7 Impact of price on carbon and electricity price
The Australian Government’s proposed carbon price is not a measure for controlling wood smoke; however, it may impact the use of wood heaters in NSW.
A carbon price, if legislated by the Australian Government, would increase the cost of fossil fuel based energy including electricity and gas, and possibly petrol. Despite their greenhouse gas emissions, wood and biomass fuels are unlikely to be taxed, and due to the rise in other energy sources, may have a greater cost advantage. This would create a perverse incentive for households to choose (or retain) wood heaters as the preferred heating type.
Similarly, electricity prices are projected to rise in NSW (around 40% by 2013/14). This would increase the cost advantage of wood fuels and favour the selection (or at least, retention) of wood as the preferred heating choice by some consumers. Discretionary control measures may need to be considered to manage the undesirable outcomes, for example, a tax on wood fuel.
3.2 Qualitative assessment of current wood smoke policy The review of the current policies and supporting programs for reducing wood smoke in NSW indicates that:
- The Clean Air Regulation prohibits the sale of wood heaters emitting more than 4 grams per kilogram of fuel. This is the primary regulatory mechanism for controlling wood smoke in NSW. A national review, to which NSW is represented, has been examining the introduction of heater emission and energy efficiency standards for all states and territories. There is presently no target date for completion of this initiative.
- Wood smoke control programs implemented by State and Local Governments to date have been effective in some areas (such as banning wood heaters in new precincts and replacing older wood heaters in targeted areas). However, wood smoke remains a major source of winter particle pollution and more measures are required.
- The inclusion of wood heaters as relatively energy efficient heating appliances in BASIX creates a perverse incentive for home owners and developers to install wood heaters rather than alternative heating systems with lower air pollution contributions.
3 BASIX requires wood heaters be installed in accordance with state and council regulations.

AECOM Economic Appraisal of Wood Smoke Control Measures - Final Report
29 June 2011
10
- Information and education remain a key component of wood smoke reduction efforts in NSW. This measure is complementary to a range of other wood smoke reduction measures and any additional control measures would be supported by information and education material.

AECOM Economic Appraisal of Wood Smoke Control Measures - Final Report
29 June 2011
11
4.0 Potential Policy Measures for Wood Smoke Control In conjunction with the identification of the measures currently implemented in NSW to reduce wood smoke from residential wood heaters, a review of Australian and international literature was undertaken to identify potential strategies, policies and programs that may be developed for controlling wood smoke. This includes the measures considered in the report ‘Strategies for Reducing Residential Wood Smoke’ by the U.S. Environmental Protection Agency (US EPA, 2009).
Generally, potential wood smoke control measures can be classified into four categories: regulatory measures, market mechanisms, incentive programs, and information and education.
4.1.1 Regulatory measures
Regulatory policy measures often involve a regulatory approach that mandates a particular action or set of actions that are supported by enforcement using auditing and penalties. Regulatory measures for wood smoke control include imposing a ban on installation of new wood heaters, efficiency standards and emissions limits for wood heaters permitted for sale, mandated phase out provisions or the introduction of mandated fuel moisture content levels.
These measures have been implemented in a number of locations including:
- NSW: total ban in Waverly Council, ban in new land releases in Camden Council and The Hills Shire Council, and lower emissions wood heaters mandated in Armidale Dumaresq Council
- ACT: ban on wood heaters as primary heat source in one council area
- Tasmania: emission standards
- Lincoln County, MT and Sacramento, CA; USA: ban on wood heaters
- Christchurch, New Zealand: emission standards
- Mammoth, CA, Washoe County, NV; and Oregon, USA: phase out at sale of house
- Western Australia: maximum wood fuel moisture content regulation of 20%.
Regulatory measures require greater government intervention and administrative resources to introduce and operate as the onus is on the government to enforce the measures.
4.1.2 Market mechanisms
Market mechanisms can be introduced to ensure polluters (wood heater users) contribute to the costs of negative externalities (health costs borne by the community) and, reduce the extent of pollution through appropriate pricing signals.
A preliminary assessment of international and domestic regulations reveal there are currently no market mechanisms currently in place. For example, a tax/excise could be placed on the sale price of wood heaters to discourage their purchase/ownership. In economic theory, a Pigouvian tax is optimally set at the cost of the externality to transfer it to the polluter. Revenue collected from the tax can be used to fund the health costs incurred by the community. A Pigouvian tax on wood heaters is described in the text box below.

AECOM Economic Appraisal of Wood Smoke Control Measures - Final Report
29 June 2011
12
Aside from efficiency, Pigouvian taxes may increase the fairness of how costs of negative externalities are borne. For example, even if a tax on wood heaters is not at the perfect level to achieve optimal efficiency, it transfers the cost associated with wood smoke from the public to the wood heater user.
Other market mechanisms that seek to push the externality to the polluter include a tax on fuel, pricing emissions and licensing fees for wood heater owners.
A drawback of the market mechanism approach is that, to justify government intervention in the markets, it assumes full knowledge of the externalities. In reality, it may be difficult to precisely estimate the costs that wood smoke imposes on the community. Further, to gain support of the measure from the community, they need to be assured that the tax revenue collected would be applied to appropriate purposes.
4.1.3 Incentive programs
Incentive programs provide a financial or economic incentive for a particular action. In this case, a cash incentive may be provided to current wood heater owners who purchase a new, more efficient wood heater or an alternative heating system. Voluntary incentives are relatively easy to implement and operate however the high costs of these programs tend to limit the possible extent of government actions.
Figure 9 Workings of Pigouvian tax
Source: AECOM
- The marginal revenue curve is the demand curve which is assumed to be perfectly elastic. The marginal private cost is the supply curve which shows the quantity of output from producers at different price levels. The marginal social costs curve is the supply curve when all costs including those of externalities, in this case the health cost of wood smoke, are taken into account.
- A tax shifts the marginal private cost curve up by the amount of the tax i.e. the new supply curve now is the marginal private cost plus tax. As a consequence of this cost increase, producers (have the incentive to) reduce their output to a lower level, from A to B.
- New output at level B represents the socially optimum level for reducing the health costs of wood smoke externality i.e. depicted by reduction of area size from ODC to OEF, and equating the new marginal externality cost to the marginal tax levied i.e. reduced from CD to EF.
- The total tax revenue, which may or may not be used to mitigate the effect of the negative externality, is equal to the size of the tax times the new output (area OGEF).
Marginal social cost
Marginal private cost
Price = marginal revenue
O A Original output
B New output
C
D
E
F
Marginal private costplus tax
Quantity
Pric
eTa
xes
G

AECOM Economic Appraisal of Wood Smoke Control Measures - Final Report
29 June 2011
13
A major shortcoming of programs providing cash incentives for heater replacement is that a large proportion of subsidy applicants are those who would replace their heaters anyway, with or without the cash incentive. It can also be difficult to calculate a correct amount of incentive that is required to achieve the intended outcome. For instance, lower income groups may require larger cash incentives to change heating systems than other groups.
These measures have been implemented in a number of locations including a cash incentive phase out in NSW (Wood Smoke Reduction Program); WA and ACT (Wood heater Replacement Programs).
4.1.4 Education and information
Education and information are considered a complementary measure to support the successful introduction and operation of other control measures. It is anticipated that any extension of wood smoke control in NSW would involve a supporting education and information program. It is worth noting that measuring the effectiveness of broad education and information programs is difficult.
4.2 Potential measures Based on the assessment of the current NSW policies and the literature review of potential measures, a number of wood smoke control
measures (“measures”) have been identified for assessment for NSW. Table 5 lists the identified measures. Table 5 Control Measures
Control measure Description Business as usual (Base case) Protection of the Environment Operations (Clean Air) Regulation
2010 requires that a wood heater cannot be sold (wholesale or retail) in NSW unless the heater is certified under the AS/NZS 4013.
Regulatory Ban A ban on the sale of new wood heaters.
Efficiency and emissions standards A state-wide regulation that specifies the efficiency of new wood heaters (e.g. all new wood heaters sold in NSW will have a heating efficiency of at least 65% and an emissions limit of 3.0g/kg).
Phase out Owners of wood heaters are required to remove their wood heater or render it inoperable at the time of sale or within a specified period of time.
Fuel moisture content regulations A regulation on a maximum moisture content for wood fuel sold in NSW.
Market Mechanisms Sales tax on new wood heaters A sales tax (or excise) on new wood heaters recognising the social
(health) costs of wood smoke.
Licensing fees An annual licensing fee (and possible license test) for wood heater owners.
Levying an excise/tax on biomass fuels A sales tax/excise on wood heater fuel recognising the social (health) costs of wood smoke.
Voluntary incentive programs Cash incentive phase out A buy-back program to phase out wood heaters or incentives to
purchase more efficient wood heaters.
Source: AECOM
The above measures were selected for their potential capacity to produce significant reductions in wood smoke emission, as identified in the literature. Measures can be combined to form packages of measures (“options”) to be effective, cost efficient and gain stakeholder support.
The options for improving control of wood smoke have been selected through a screening assessment of the above measures. A full evaluation of the potential options has been be undertaken as a part of the cost benefit analysis component of the project (Section 6).

AECOM Economic Appraisal of Wood Smoke Control Measures - Final Report
29 June 2011
14
Support measures such as education, information briefings and the use of SANs are not evaluated as separate options in this assessment since they can be provided alongside (or in absence of) any of the identified measures. Due to the lack of data, the evaluation will only include a qualitative assessment of the costs and benefits of these support measures.

AECOM Economic Appraisal of Wood Smoke Control Measures - Final Report
29 June 2011
15
5.0 Preliminary Assessment of Options The objective of the preliminary assessment is to identify potential options that meet the stated policy objectives and can be included in the final evaluation. The assessment is largely qualitative, though it is assisted by the use of agreed screening criteria and a metric designed to give an approximate measure of the likely effects of the options.
5.1 Criteria The selection of the criteria for the preliminary assessment of the different options was guided by the assessment of the effectiveness of the current policy arrangement and the ‘Checklist for Assessing Regulatory Quality’ shown in Appendix A.
The selected criteria identify the broad policy effectiveness of potential measures. The selected set of criteria is outlined below.
1) Extent of wood smoke control
a) heating efficiency improvements
b) number of heaters impacted
c) emissions reductions (health benefits)
d) timing of reductions
2) Economic impacts and costs
a) impact on industry
b) impact on consumer
c) administrative costs
3) Distribution effects and spatial impacts
4) State-wide uniformity and consistency
5) Consistency with national approach
6) Practicality.
5.1.1 Benefit to Public Metric
The first two criteria, extent of wood smoke control, and economic impacts and costs, of each measure are qualitatively assessed by its benefit to the public.
The benefit to the public is a result of the extent to which the measure can control wood smoke and the economic costs incurred as a result of the measure. Each criteria has been evaluated using different metrics, for example, heating efficiency 70%, 60%, 30% and 10%. The measure’s contribution to the net public benefit is also assessed using the common metric of Benefit to Public (High, Med/High, Med and Low) with the associated colour for the metric at top of the figure.

AECOM Economic Appraisal of Wood Smoke Control Measures - Final Report
29 June 2011
16
Figure 10 Public benefit contribution criteria
Source: AECOM and various sources
5.1.2 Extent of wood smoke control
The key element of policy effectiveness is the extent to which an option has the potential to control wood smoke. While a detailed assessment is presented in Chapter 6.0, a brief assessment has been undertaken on the extent of wood smoke control for each measure. The extent to which a measure can control wood smoke in NSW is assessed using the following indicators:
Heating efficiency and emissions limits
Heating efficiency is one of the key factors in the amount of wood smoke emissions that a wood heater produces. The efficiency is the percentage of fuel that is converted to heat.
Well-designed slow combustion stoves are approximately 70% efficient while open fireplaces are approximately 10% efficient (DEH, 2003). The average efficiency of wood heaters has been calculated using results of a survey undertaken on the wood heater industry (DEWHA, 2009). The survey recorded the heating efficiency of the range of wood heaters currently being sold across Australia. Based on this survey, the average heating efficiency of the wood heaters sold in Australia is 59.89%.
An assessment of the relationship between heating efficiency and emissions concludes that it is uncertain that burns with high combustion (heating) efficiency tend to have low mass emissions and burns with low combustion
Heating Efficiency(efficiency level)
Emissions Reduction (t/p.a.)
Timing
Industry Impact (p.a.)
ConsumerImpact (p.a.) *
No. of HeatersImpacted
70% 59.89% 30% 10%
365,000Existing stock
9,600Annual sales
2,200In new dwellings
0
10,300 2008 NSW emissions
268Emissions from new sales
150Reductions from AS/NZS 4013
0
1-5yrs 5-7yrs 7-10yrs +10yrs
Minor Cost High Cost
Administrative Costs (p.a)
Minor Cost High Cost
Minor Cost High Cost
Medium Cost
Low Cost
Avg.
Medium Cost
Economic impacts and costs
Extent of wood smoke control
Low Cost
Medium Cost
Common Metric for Assessment:Benefit to Public
High LowMed/High Med
Low Cost
AECOM Economic Appraisal of Wood Smoke Control Measures - Final Report
29 June 2011
17
efficiency have high mass emissions (EA, 2002). To ensure that emissions from wood heaters are reduced, a heating efficiency measure should be paired with a limit on emissions.
Number of heaters impacted
There are approximately 365,000 wood heaters in operation in NSW with approximately 9,600 heaters sold as replacement or new installations each year (DECCW, 2010). As shown in Section 3.1.2, approximately 2,500 new wood heaters may be installed in the 110,000 new dwellings to be built in the GMR growth centres (DP, 2011) . The number of wood heaters that the measure will impact is a factor in the extent to which it can contribute to a reduction in wood smoke in NSW.
Emission reductions (health benefits)
The emissions reduction criterion is an approximation of both the emission reductions, and associated health benefits, from the measure. In 2008, approximately 10,300 tonnes of PM10 was emitted from wood heaters in NSW. The Clean Air Regulation estimated that wood smoke emissions in NSW would decrease by between 67 and 153 tonnes per year (DECCW, 2010).
Emission reductions are be the basis for the quantitative assessment of the health benefits from each measure in the detailed cost benefit analysis. It is also important to recognise the fact that health costs differ across NSW depending on population density. The preliminary assessment is unable to attribute the impact of the measures to particular areas and so emissions reductions are used as a proxy.
A detailed assessment of the health benefits associated with each measure is included in the cost benefit analysis.
Timing
An important consideration for the effectiveness of each measure is the timeframe of the emission reductions. Measures that reduce emissions and provide health benefits at later stages have a lower value, due to the time value of money, than measures that reduce the same amount of emissions in a shorter timeframe. For example, national legislation on wood heaters standards may take longer to achieve as it requires mutual agreement of all Australian jurisdictions.
5.1.3 Economic impacts and costs
The attractiveness of a measure can be reduced if its introduction and operation causes major negative economic impacts and costs. The possible impacts of wood smoke control policies on various sectors are listed below.
Industry impact
A ban on the sale of new wood heaters in NSW would have a high impact on industry while a change in standards may have a low or minor impact on industry. The potential impact of each option on the wood heating industry will be evaluated.
The assessment of the impact at this stage focuses solely on the reduction of heater sales. In the final cost benefit analysis, more robust indicators that include loss of sales values, employment, cost of industry and profitability may be used. Use of the former indicators is usually not justified given that resources reallocate themselves to the productive sectors within the economy. The latter indicator of profitability is commonly used in economic impact assessment. The impact on producer surplus is a potential indicator for the industry impact however it does not enable an effective assessment given sales into other jurisdictions and an unknown price elasticity of supply.
Consumer impact
An element of the public benefit assessment is the impact of the control measures on the consumer surplus. Consumer surplus is the difference between a customer's willingness-to-pay for a good or service and the price they actually pay. In the case of wood heaters, banning of new sales or other measures that affect the quantity and price of wood heaters would reduce consumer surplus.
A preliminary assessment is conducted at the preliminary evaluation stage to assess the potential impact as low, medium or high. Detailed assessment of the impact on consumer surplus is provided in the cost benefit analysis.
Administrative costs
The cost of administrating the measure is included in the assessment of effectiveness of a potential measure. Administrative costs are assessed as being high, medium, low or none.

AECOM Economic Appraisal of Wood Smoke Control Measures - Final Report
29 June 2011
18
5.1.3.1 Distribution effects and spatial impacts
Measures are assessed on their ability to account for the use of wood heater among low income groups in NSW and the relatively higher operating costs of alternative heating systems. There is also a need to understand the ability to provide compensation, where appropriate, to low income groups. The consideration of other potentially vulnerable groups, including elderly, has not been included in this assessment.
The spatial impact criterion examines the potential coverage issues of the measure. For instance, the introduction of a measure may have different impacts depending on, for example, regional climates or access to reticulated gas networks.
5.1.4 State-wide uniformity and consistency
As discussed in the assessment of NSW’s current wood smoke control regime, there are a range of policies, programs and measures implemented across the state that vary in some council areas. Potential control measures should seek to generate a consistent framework across the state for ease of implementation and monitoring. The preliminary evaluation also assesses whether the measure builds upon current NSW regulatory instruments, incentive programs and education.
5.1.5 Consistent with national approach
Wood smoke is currently being considered at a national level, principally in the context of uniform emission standards for wood heaters across Australia. It is anticipated that this will result in measures that ensure a minimum standard for wood heater emissions across all states and territories. It is important that any NSW specific measures are consistent with the national approach.
5.1.6 Practicality
The final criterion is the practical nature of the measure. It provides an assessment of the potential practical issues associated with the introduction of a measure. An example of a practical issue that may reduce the effectiveness of a measure is the prevalence of scavenging instead of purchasing wood.
5.2 Business as usual Business as usual is the current wood smoke control measures in NSW. Business as usual should be used as the base case for comparing the effect of new wood smoke control measures. The measures in the business as usual include:
- requiring the sale of new wood heaters that are certified under AS/NZS 199
- use of local government planning instruments such as development control plans (DCPs) or local policies to ban the installation of new wood heaters or require stricter emissions standards on new wood heaters
- promoting the correct use of wood heaters achieved through advertising and providing information to the community, including targeted education of households
- periodic wood heater replacement programs
- use of smoke abatement notices under the Protection of Environment Operations (POEO) Act 1997, which are issued by local councils that require households to undertake smoke mitigation measures.
The business as usual measure will form the base case in the detailed cost benefit analysis.
5.3 Ban on new wood heaters A ban on new wood heaters could be applied through the regulation of the sale or installation of wood heaters across NSW. There are also potential priority areas across NSW that may benefit from a localised ban enforced by the NSW Government to support the local government assessment programs.
5.3.1 Extent of Wood Smoke Control
A ban on the sale or installation of new wood heaters in NSW will avoid the emissions from all wood heaters to be sold in NSW as replacements for old heaters and for new installations. The emission reduction potential per year, based on the average emissions information provided by DECCW, is approximately 268 tonnes of PM10 from the 9,600 wood heaters sold each year in NSW (DECCW, 2010). The ban could be implemented in a relatively short period and begin reducing wood smoke emissions in NSW.

AECOM Economic Appraisal of Wood Smoke Control Measures - Final Report
29 June 2011
19
5.3.2 Socio-economic impacts
A ban on the sale of new wood heaters in NSW will impact on the wood heater industry and future consumers of wood heaters. A state-wide ban would halt the sale of approximately 9,600 wood heaters per year (DECCW, 2010). The consumer impact would be significant as there would be no wood heaters for sale in NSW.
Table 6 Ban on new wood heaters assessment
Extent of wood smoke control Economic impacts and costs
Efficiency Heaters Impacted
Emissions Reduction Timing Industry Consumers Administrative
Costs Contribution to Public Benefit Med/High Med/High Med/High High High
cost High cost Medium cost
(1) Colour assessment of benefit to public using common metric for assessment in Figure 10.
5.3.3 Distribution effects and spatial impacts
A state-wide ban on the sale or installation of wood heaters would address wood smoke across NSW however there is the ability to target priority areas. Low income groups who depend on wood heaters as a cheap source of heating will be significantly affected, particularly in areas where there is no natural gas reticulation network.
5.3.4 State-wide uniformity and consistency
A state-wide ban will generate consistency across the state for the treatment of wood heaters compared to the current use of DCPs to ban the installation of wood heaters in particular areas.
5.3.5 Consistency with national approach
A ban on all new wood heaters in NSW would significantly exceed the intended action of the current and proposed national approach.
5.3.6 Summary
There is scope for bans of new installations in priority areas in the next stage of the project. A priority areas ban could be combined, where possible, with cash incentives or other support measures to assist low income owners to easily transition to an alternative heating system.
5.4 Efficiency standard and emission limits An efficiency standard is the rating of the wood heaters ability to convert fuel to heat. An efficiency standard should also be paired with a lower emission standard to ensure reduced emissions. The current emission limit in NSW, effective under the Clean Air Regulation, is 4.0 grams per kilogram of fuel consumed (DECCW, 2010). A possible control measure is the introduction of a new regulation requiring that all new wood heaters should have an efficiency of at least 65% and an emission rating of 3.0 grams per kilogram of fuel.
It is important for modelling purposes to note that there is an in-service adjustment figure to calculate actual emissions of an efficiency and emission standard. Tests conducted for the Australian Department of Environment and Heritage concluded that the increase in the emission factor when in-service was approximately 2.5 times the certified level of grams per kilogram of fuel (EA, 2002). This figure accounts for the operation of wood heaters outside testing parameters and the fact that wood heater owners do not generally operate the wood heater in an optimal manner.
5.4.1 Extent of Wood Smoke Control
A mandatory efficiency standard and lower emission limit for all new wood heaters would only affect new sales of 9,600 per year. The efficiency and emission standards would reduce the emissions from all new wood heaters assuming all other factors are equal. The efficiency standard would not affect existing wood heaters. There is also a lag in the appearance of appreciable emission reductions due the time to implement the measure.
5.4.2 Socio-economic impacts
The industry impact would be less than a total ban on new sales with a small impact due to increased compliance costs. These compliance costs, if passed onto the consumer, will increase the price of wood heaters resulting in a

AECOM Economic Appraisal of Wood Smoke Control Measures - Final Report
29 June 2011
20
loss of consumer surplus. The implementation and auditing of a new efficiency standard may have relatively low administrative costs. Table 7 Efficiency standard public benefit assessment
Extent of wood smoke control Economic impacts and costs
Efficiency Heaters Impacted
Potential Emissions Reduction
Timing Industry Consumers Administrative Costs
Contribution to Public Benefit
High Med/High Medium Med/High Low cost Low cost Low cost
(1) Colour assessment of benefit to public using common metric for assessment in Figure 10.
5.4.3 Distribution effects and spatial impacts
There is a need to assess the potential for an efficiency standard and emission limits to disproportionately affect low income groups as the standard may increase price of wood heaters. This impact is further explored in the detailed cost-benefit analysis. An efficiency standard and emission limit could be introduced in priority areas or in areas where significant number of wood heaters potentially may be installed such as new land releases.
5.4.4 State-wide uniformity and consistency
A state-wide heating efficiency standard and emission limit would create consistency across the state compared to the current situation where local governments (such as Armidale Dumaresq Council) implement efficiency standards for particular areas in their jurisdiction.
5.4.5 Consistency with national approach
This measure may pre-empt a national heating efficiency standard and emission limit however there is also the possibility of advocating a particular standard if it appears to be effective in NSW. There is already a national emission limit of 4.0g/kg.
5.4.6 Practicality
Under the MRA, wood heaters that can be sold in other jurisdictions would be able to be sold in NSW. NSW will have to apply for an exemption under the MRA to enforce a state efficiency standard or lower emission limit at the point of sale or introduce a new regulatory requirement that controls the installation of wood heaters. As noted in Chapter 2, several councils, including Armidale City Council, have implemented DCPs that mandate a minimum efficiency level of installed wood heaters so the measures can be adopted in priority areas.
5.4.7 Summary
An efficiency standard with an improved emission standard will be assessed in the detailed cost-benefit analysis.
5.5 Phase out The phase out of wood heaters at sale of house has been introduced in a number of US counties to accelerate the turn-over of wood heaters to more efficient models or alternative heating system (US EPA, 2009). Wood heaters generally last 17 years while the average house in Australia is sold every 7 years (Bell, 1996). Under a phase out measure, a regulatory instrument would be introduced to require that any wood heaters on the premises should be removed or rendered inoperable when a house is sold.
This means that wood heaters would only be in service for an average of 7 years and then removed or rendered inoperable due to the sale conditions. New owners of the house would then have the choice to install a new, more efficient wood heater or an alternative heating system.
A related phase out measure may be the introduction of a sunset date for wood heaters in NSW or priority areas. This measure would mandate that all wood heaters would have to be removed by a certain date (i.e. ten years from now). The impact of the sunset clause is dependent on the time period. A short time period will affect new wood heater sales as consumers would have a limited period of use while a long period would have little effect on sales.

AECOM Economic Appraisal of Wood Smoke Control Measures - Final Report
29 June 2011
21
5.5.1 Extent of Wood Smoke Control
The inclusion of a provision that all wood heaters should be rendered inoperable or removed would target the existing wood heaters and reduce their numbers faster than natural turn-over. Once implemented, the regulation can begin reducing the number of existing wood heaters immediately with the associated emission reductions.
The emission reduction potential may be greater than the annual emissions from new sales assuming that the number of houses with wood heaters sold each year, and therefore removed or rendered inoperable, is larger than annual sales. The emission reduction potential could also be greater even if the number of houses with wood heaters sold each year is less than annual sales. This is because the existing wood heaters may be more polluting than new heaters.
5.5.2 Socio-economic impacts
The industry impact is potentially minor as there will be no restrictions on sales. There will be an increase in administrative costs due to increased auditing and monitoring of house sales to ensure that the provision is adhered to. A detailed examination of industry impacts will be undertaken in the cost benefit analysis.
Consumers may also be impacted as potential wood heaters owners who plan to sell their house will not purchase a wood heater as it will have to be removed in the near future.
Table 8 Phase at time of sale assessment
Extent of wood smoke control Economic impacts and costs
Efficiency Heaters Impacted
Emissions Reduction Timing Industry Consumers Administrative
Costs Contribution to Public Benefit
Med/High High Med/High Med/High Minor cost Low cost Medium cost
(1) Colour assessment of benefit to public using common metric for assessment in Figure 10.
5.5.3 Distribution effects and spatial impacts
There is limited information to determine whether low income groups move at the average period of seven years (Bell, 1996) and whether these groups may be unduly affected by the phase out. There may be also differences in average years of household across different regions in NSW. For instance, rural properties may be sold at a lower rate than urban properties.
5.5.4 State-wide uniformity and consistency
A state-wide policy for wood heaters to be removed or rendered inoperable at the time of house sale would provide a consistent policy across NSW for control of wood smoke emissions. There is also the potential to implement the policy in priority areas.
5.5.5 Consistency with national approach
This measure would be complementary to the proposed national approach of an efficiency standard and auditing.
5.5.6 Practicality
There is the potential to introduce the phase out with other polices (such as bans or efficiency standards) that will increase the emission reductions but may impact industry and consumers. This measure may also have significant impact on wood heaters, such as open fireplaces, that are installed for aesthetic reasons which are used less and have lower associated health costs.
5.5.7 Summary
This measure will be assessed in the detailed cost benefit analysis. The ability for this measure to reduce emissions would be improved if combined with other measures including bans or efficiency standards.

AECOM Economic Appraisal of Wood Smoke Control Measures - Final Report
29 June 2011
22
5.6 Wood fuel moisture content regulations Wood fuel moisture content regulations require particular fuel moisture content. In Western Australia, wood fuel moisture content for domestic heating must be less than 20 per cent. There may be a price rise in the cost of wood fuel due to the higher compliance regime. Wood fuel generally needs to be dried for up to 12 months to attain the required moisture content of less than 20% (BDA, 2006).
5.6.1 Extent of Wood Smoke Control
The extent to which a wood fuel moisture regulation on purchased wood fuel can control wood smoke is dependent on the impact that fuel moisture has on emissions and the amount of wood heaters that use purchased wood fuel.
There have been a number of tests conducted on the impact of fuel moisture on emissions from wood heaters. An assessment undertaken in 2002 by Environment Australia stated that there was data to suggest that emissions increase with increasing fuel moisture, although the increased emissions at moisture contents less than 15 per cent clearly have other contributing factors (EA, 2002). This assessment reveals that there is a general relationship however other factors also affect wood smoke at low fuel moisture content levels.
A survey for the NSW EPA in 2003 shows that over 50 per cent of the respondents sourced fuel from friends/relative or local scavenging (Todd, 2003). The large percentage of scavenged wood further reduces the potential effectiveness of wood fuel moisture content regulations given that the regulation would only apply to sales.
These factors reduce the potential emissions reduction and improvement in efficiency associated with the measure.
5.6.2 Socio-economic impacts
Given the evidence suggests that most available fuel is close to the potential mandated limit of 20 per cent and the prevalence of scavenging fuel, there appears to be limited impact on the consumers and industry. The administration of a new standard for fuel may be costly.
Table 9 Fuel moisture content assessment
Extent of wood smoke control Economic impacts and costs
Efficiency Heaters Impacted
Emissions Reduction Timing Industry Consumers Administrative
Costs Contribution to Public Benefit
Med/High Med/High Low High Low cost Low cost Medium cost
(1) Colour assessment of benefit to public using common metric for assessment in Figure 10.
5.6.3 Distribution effects and spatial impacts
The fuel moisture content measure would cover all of the NSW.
5.6.4 State-wide uniformity and consistency
A fuel moisture content regulation would be uniform across the state and provide consistency in regulation.
5.6.5 Consistency with national approach
This measure would not conflict with the proposed national approach as the Western Australian Government currently operates a fuel moisture content standard.
5.6.6 Practicality
This measure may be impractical given the prevalence of wood scavenging.
5.6.7 Summary
Accepting that the evidence that suggests that most wood fuel is around 20% moisture content, it is still proposed that this measure be assessed in the detailed cost benefit analysis.

AECOM Economic Appraisal of Wood Smoke Control Measures - Final Report
29 June 2011
23
5.7 Tax on new wood heaters A tax on new wood heaters would be applied at the sale of wood heaters to increase the price in recognition of the social (health) costs associated with wood smoke. The tax would be modelled on a Pigouvian tax outlined in Section 4.1.2.
The tax increases the price of wood heaters and reduces the number of wood heaters purchased. The size of the tax is based on two considerations – the health costs associated with an individual wood heater and the cost of alternative heating systems. The tax would be lower value of the calculated health costs per wood heater or the difference between a wood heater and an alternative heating system that does not emit wood smoke plus an increment to support purchase choice.
It is also possible to apply a tax on inefficient wood heaters where these wood heaters are lower priced than efficient models.
5.7.1 Extent of Wood Smoke Control
The introduction of a sales tax on new wood heaters would increase the price of wood heaters. The increased price would reduce the number of wood heaters sold each year of approximately 9,600 (DECCW, 2010). The emissions reductions would be less than the ban of all new wood heaters but potentially more than the reductions currently being achieved by the regulations in the Clean Air Regulation (67-153 tonnes per annum).
5.7.2 Socio-economic impacts
The sales tax could be introduced and begin to reduce emissions in a relatively short period. The industry impact will be less than the ban on all new sales but the increased price will reduce wood heater sales. The consumer impact will also be less than the ban but will occur due to the increased price. Market mechanisms are generally less costly to administer than regulation as administration can be funded by the tax.
Table 10 Sales tax on new wood heaters assessment
Extent of wood smoke control Economic impacts and costs
Efficiency Heaters Impacted
Emissions Reduction Timing Industry Consumers Administrative
Costs Contribution to Public Benefit
Medium Med/High Medium Med/High Low cost Low cost Low cost
(1) Colour assessment of benefit to public using common metric for assessment in Figure 10.
5.7.3 Distribution effects and spatial impacts
Revenue from the tax may be used to support low income groups who may be disproportionately affected by the tax.
5.7.4 State-wide uniformity and consistency
A state-wide tax would create consistency across NSW. The impacts of the tax would be greater in areas that had greater wood heater sales which may coincide with priority areas for wood smoke reduction.
5.7.5 Consistency with national approach
This option may conflict with the proposed national approach of efficiency standards and auditing as it would mean that industry had higher compliance costs but reduced sales as a result of the tax.
5.7.6 Practicality
The introduction of a sales tax on wood heaters to recognise the social (health) costs of wood smoke may be politically difficult and adversely affect low income groups who depend on the low cost of wood heaters for primary heating. There is also the potential for consumers to purchase wood heaters interstate and install them in NSW.
5.7.7 Summary
This measure is assessed in the detailed cost benefit analysis.
AECOM Economic Appraisal of Wood Smoke Control Measures - Final Report
29 June 2011
24
5.8 Licensing fees Wood heater owners would pay a license fee to operate a wood heater for a specific period. The fee could also include training and education on appropriate wood heater operation. The licensing scheme would develop a list of licensed wood heater owners.
5.8.1 Extent of Wood Smoke Control
The introduction of a licensing fee for wood heater owners would target the existing wood heater owners (approx. 365,000 in 2008). The fee would increase the overall cost of wood heating to all wood heater owners which may provide incentives for some wood heater owners to purchase alternative heating systems. The licensing fee could be introduced in the short term however emission reductions will be less than a ban on all wood heaters.
5.8.2 Socio-economic impacts
The introduction of a licensing fee will increase the overall cost of wood heating and may reduce the amount of wood heaters in operation. The administration costs may be higher than a sales tax due to the larger group of 365,000 wood heater owners. The revenue from the fees may be used to offset this cost.
Table 11 Licensing fee assessment
Extent of wood smoke control Economic impacts and costs
Efficiency Heaters Impacted
Emissions Reduction Timing Industry Consumers Administrative
Costs Contribution to Public Benefit
Med/High High Med/High Med/High Minor cost Low cost Medium Cost
(1) Colour assessment of benefit to public using common metric for assessment in Figure 10.
5.8.3 Distribution effects and spatial impacts
A licensing fee would increase the cost of operating wood heaters which will mean that low income groups have to pay more to heat their house. The revenue from the licensing fee could be used to support low income groups who will be proportionally more affected.
A licensing scheme could also be introduced in priority areas to provide incentives for existing wood heater owners to purchase new heating systems.
5.8.4 State-wide uniformity and consistency
A state-wide licensing fee would create consistency across the state. The licensing fee program would generate a list of licensed users which may assist local governments to target education and information while also enable effective monitoring and use of SANs.
5.8.5 Consistency with national approach
A licensing regime would complement the proposed national approach as licensing fees would enable more effective auditing and enforcement.
5.8.6 Practicality
It may be difficult to introduce a licensing fee on existing wood heater owners as these owners already own and operate a wood heater. There needs to be a clear linkage between the licensing fee and the emission reductions to justify the cost on existing wood heater owners.
This measure will be assessed in the detailed cost benefit analysis.
5.9 Tax on fuels A tax on fuels would be levied on fuel retailers to increase the price of fuel. This price increase would be reflective of the health costs associated with wood smoke. As noted in the wood fuel moisture assessment, about 50per cent of fuel used in NSW is not purchased. The tax would not affect the wood heater owners who do not purchase their fuel.

AECOM Economic Appraisal of Wood Smoke Control Measures - Final Report
29 June 2011
25
5.9.1 Extent of Wood Smoke Control
A tax on wood fuel would increase the cost of fuel and potentially reduce how often a household uses their wood heater. The measure would impact on wood heater owners who purchase their firewood however the potential emission reduction will be reduced significantly due to the amount of fuel that is scavenged in NSW. A survey for the NSW EPA in 2003 shows that the over 50 per cent of the respondent sourced fuel from friends/relatives or through local scavenging (Todd, 2003)
5.9.2 Socio-economic impacts
The fuel excise could be implemented quickly with relatively lower administration costs as market mechanisms are generally less costly to administer than regulations. Revenue from the excise could also be used to cover the administration costs. There will be some impact to wood heater sales due to the higher operating costs and some loss of consumer surplus.
Table 12 Tax on fuel assessment
Extent of wood smoke control Economic impacts and costs
Efficiency Heaters Impacted
Emissions Reduction Timing Industry Consumers Administrative
Costs Contribution to Public Benefit
Med/High Medium Medium High Low cost Low cost Low cost
(1) Assessment of Benefit to Public using Common Metric for Assessment in Figure 10.
5.9.3 Distribution effects and spatial impacts
A fuel tax would increase the cost of operating wood heaters which will mean that low income groups would have to pay more to heat their house. The revenue from the tax could also be used to support low income groups who will be proportionally more affected.
5.9.4 State-wide uniformity and consistency
A state-wide tax on fuel would be consistent across the state. The impacts of the tax would be greater in areas that had greater fuel sales which may coincide with priority areas for wood smoke reduction.
5.9.5 Consistency with national approach
A tax on wood fuel would not conflict with the proposed national approach.
5.9.6 Practicality
A tax on fuel may create an incentive for more wood heaters owners to scavenge fuel instead of paying higher prices to purchase fuel.
This measure is assessed in the detailed cost benefit analysis.
5.10 Cash incentive phase out A cash incentive is a rebate or other financial instrument to provide incentive for current wood heater owners to change over their existing wood heater to a more efficient model or alternative heating system. As noted in Chapter 3, wood heater rebates have been between $500 and $700 per system in NSW.
5.10.1 Extent of Wood Smoke Control
A cash incentive would be provided when a wood heater owner replaced an inefficient wood heater or removed the wood heater entirely. The phase out would result in emission reductions above the current regulatory regime but less than the total emissions of wood heaters as some owners may not take up the incentive.
5.10.2 Socio-economic impacts
A cash incentive program can be easily implemented and has minimal impact on industry and consumers. The administrative costs are comparably high due to the cash incentive costs being incurred by the Government.

AECOM Economic Appraisal of Wood Smoke Control Measures - Final Report
29 June 2011
26
Table 13 Cash incentive assessment
Extent of wood smoke control Economic impacts and costs
Efficiency Heaters Impacted
Emissions Reduction Timing Industry Consumers Administrative
Costs Contribution to Public Benefit
Med/High High Med/High High Minor cost Minor cost High cost
(1) Assessment of Benefit to Public using Common Metric for Assessment in Figure 10.
5.10.3 Distribution effects and spatial impacts
The cash incentive program could also target low income groups to assist these groups in replacing their existing heaters with cleaner heating systems. The incentive could also be targeted in priority areas with a subsequent ability to provide large rebates for a smaller group of wood heater owners. This may increase the proportion of wood heater owners who access the incentive.
5.10.4 State-wide uniformity and consistency
A state-wide cash incentive would be a consistent policy but the costs of providing sufficient cash incentives may be prohibitive.
5.10.5 Consistency with national approach
A cash incentive measure would complement the proposed national approach as the incentive would persuade a greater number of wood heater owners to purchase wood heaters certified under the new efficiency standard.
5.10.6 Practicality
The potential cost of state-wide cash incentives for wood heaters to replace or remove their wood heaters would be significant. For instance, a $10M budget would only provide $500 cash incentives to 20,000 households in NSW. There may be a benefit in providing cash incentives for priority areas affected by wood smoke and support this measure with a ban of new wood heaters in the priority areas. A priority area cash incentive may generate greater wood smoke reductions in areas where wood smoke is a significant issue.
This measure is assessed in the detailed cost benefit analysis.
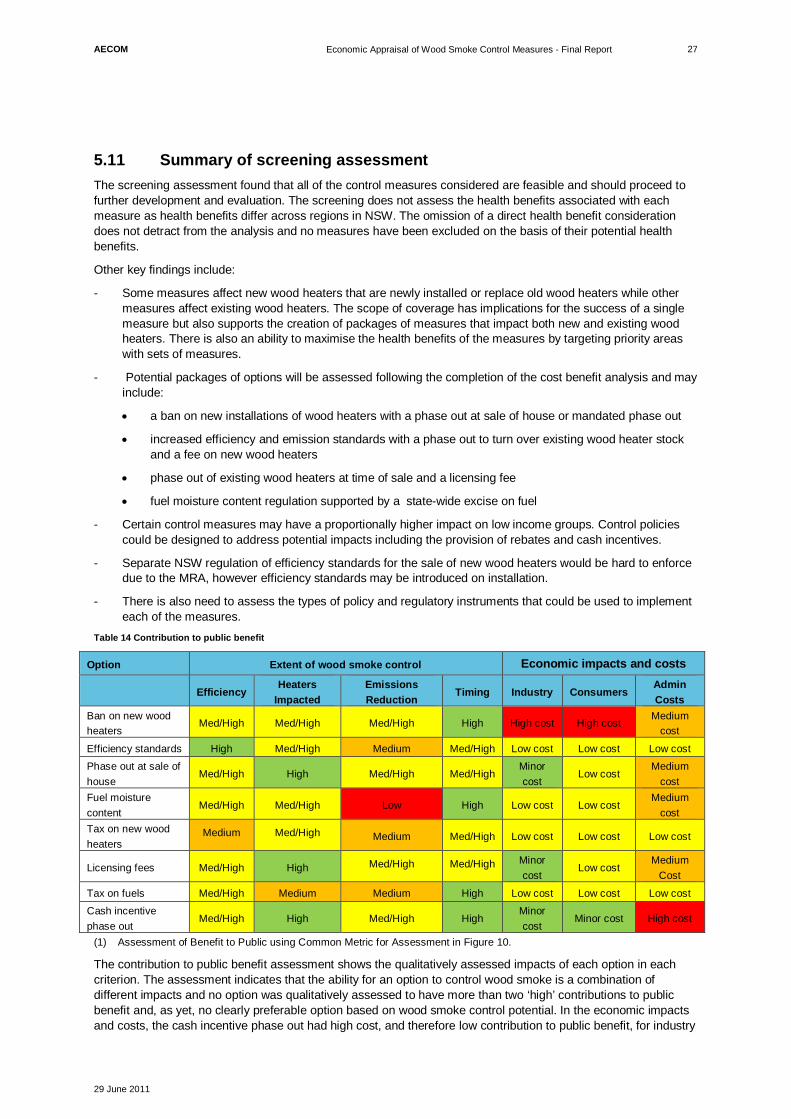
AECOM Economic Appraisal of Wood Smoke Control Measures - Final Report
29 June 2011
27
5.11 Summary of screening assessment The screening assessment found that all of the control measures considered are feasible and should proceed to further development and evaluation. The screening does not assess the health benefits associated with each measure as health benefits differ across regions in NSW. The omission of a direct health benefit consideration does not detract from the analysis and no measures have been excluded on the basis of their potential health benefits.
Other key findings include:
- Some measures affect new wood heaters that are newly installed or replace old wood heaters while other measures affect existing wood heaters. The scope of coverage has implications for the success of a single measure but also supports the creation of packages of measures that impact both new and existing wood heaters. There is also an ability to maximise the health benefits of the measures by targeting priority areas with sets of measures.
- Potential packages of options will be assessed following the completion of the cost benefit analysis and may include:
a ban on new installations of wood heaters with a phase out at sale of house or mandated phase out
increased efficiency and emission standards with a phase out to turn over existing wood heater stock and a fee on new wood heaters
phase out of existing wood heaters at time of sale and a licensing fee
fuel moisture content regulation supported by a state-wide excise on fuel
- Certain control measures may have a proportionally higher impact on low income groups. Control policies could be designed to address potential impacts including the provision of rebates and cash incentives.
- Separate NSW regulation of efficiency standards for the sale of new wood heaters would be hard to enforce due to the MRA, however efficiency standards may be introduced on installation.
- There is also need to assess the types of policy and regulatory instruments that could be used to implement each of the measures.
Table 14 Contribution to public benefit
Option Extent of wood smoke control Economic impacts and costs
Efficiency Heaters
Impacted Emissions Reduction
Timing Industry Consumers Admin Costs
Ban on new wood heaters
Med/High Med/High Med/High High High cost High cost Medium
cost
Efficiency standards High Med/High Medium Med/High Low cost Low cost Low cost
Phase out at sale of house
Med/High High Med/High Med/High Minor cost
Low cost Medium
cost Fuel moisture content
Med/High Med/High Low High Low cost Low cost Medium
cost Tax on new wood heaters
Medium Med/High Medium Med/High Low cost Low cost Low cost
Licensing fees Med/High High Med/High Med/High Minor cost
Low cost Medium
Cost
Tax on fuels Med/High Medium Medium High Low cost Low cost Low cost
Cash incentive phase out
Med/High High Med/High High Minor cost
Minor cost High cost
(1) Assessment of Benefit to Public using Common Metric for Assessment in Figure 10.
The contribution to public benefit assessment shows the qualitatively assessed impacts of each option in each criterion. The assessment indicates that the ability for an option to control wood smoke is a combination of different impacts and no option was qualitatively assessed to have more than two ‘high’ contributions to public benefit and, as yet, no clearly preferable option based on wood smoke control potential. In the economic impacts and costs, the cash incentive phase out had high cost, and therefore low contribution to public benefit, for industry

AECOM Economic Appraisal of Wood Smoke Control Measures - Final Report
29 June 2011
28
and consumers but this may be balanced by the high costs of administering and funding the incentives. The ban on new wood heaters had cumulatively the highest apparent costs to industry, consumers and the government.
5.12 Control options for further development/evaluation The feasible measures will now be included in a detailed cost benefit analysis. The assessment also revealed that there are a number of sub-options within each measure. The feasible measures for controlling wood smoke in NSW identified by the screening process include:
- ban on new wood heaters;
- new efficiency and emissions standards requiring 3g/kg and 60% efficiency or 1.5g/kg and 65% efficiency;
- phase out at sale of house or a sunset date for wood heaters;
- fuel moisture content;
- a tax on new wood heaters;
- licensing fees set a range of fee rates;
- a tax on wood fuel; and
- phase outs prompted by cash incentives.
These wood smoke control options could also be applied in case study areas or implemented as a package of control measures.

AECOM Economic Appraisal of Wood Smoke Control Measures - Final Report
29 June 2011
29
6.0 Cost Benefit Analysis of Core Options The initial CBA assesses eight main control options as well as the BAU case. Additional options have been developed following the initial assessment so as to enhance their effectiveness and value for money. They have been evaluated generally as a variant or a combination of the main control options.
Option 1. Business as usual
Option 2. State-wide ban on sales
Option 3. Efficiency standards/emissions limit
Option 4. Phase out at sale of house or within a mandated time frame
Option 5. Fuel moisture content
Option 6. Sales tax on all new wood heaters
Option 7. Licensing fees
Option 8. Tax on fuels
Option 9. Cash incentive phase out
6.1 Projections 6.1.1 Stock and emission projection model
A model was developed for preparing wood heater stock forecasts and emission projections. The model took into account the stock and mix of wood heaters (slow combustion heater, open fireplace and potbelly stove) and their emission rates (estimates for 2008 are shown in Table 15). The proportions of open fireplace and potbelly stove heaters have steadily declined and are expected to continue to decline. Table 15: Wood heater stock mix and emission rates in 2008
Heater type (years)
Average age (years)
Number of heaters
Average wood consumption (tonne/heater/year)
Emission factor PM10
(kg/tonne)
Emission factor VOC (kg/tonne)
Slow combustion heater with compliance plate
12 323,739 2.9 9.8 6
Slow combustion heater without compliance plate
17 98,454 2.9 15.3 26.5
An open fireplace 22 29,966 2 11.8 9.45
Potbelly stove 14 10,702 2.3 15.3 26.5
Total 364,407
Average 17 2.8 10.1 17.1
Source: US EPA, 2006
Data used to calculate the average emission were collected from a single fireplace and are not representative of the general source population.
Due to limited availability of data, wood heater stock and sales projections were derived based on the heater ownership estimates and assumed retirement patterns as follows:
- The number of wood heaters as a ratio of total dwellings was estimated at 13.7 percent in 2008 (ABS 2008) and was projected to reduce to 10.7 percent by 2036 in the BAU case based on recent trends of declining ownership.
- The existing heater stock would retire gradually and totally in a 20 years period; while newly purchased heaters would be operational in the first 10 years following purchase (i.e. minimum life of 10 years);

AECOM Economic Appraisal of Wood Smoke Control Measures - Final Report
29 June 2011
30
thereafter, would retire gradually and totally in the succeeding 20 years period. Detailed projections for the BAU are shown in Appendix B.
- Heater sales comprise both new demand (from both new and existing dwellings) and replacement of (a percentage of) retiring heaters. An average growth rate of 3 percent per annum was derived for heater sales so that wood heater ownership (comprising mainly those installed post-2011) falls to 10.7 percent by 2036 in the BAU scenario. This fall in ownership is based on falling total ownership of wood heaters as retired wood heaters are not replaced and the forecast installation of new wood heaters does not fully compensate for this reduction.
The control options were examined to determine whether they had one or more of the following options. The model then used this information to prepare projections for the control options. Table 16 Impact and possible wood smoke control measures
Impact Possible wood smoke control measure
Replacement of wood heaters with other forms of space heating
- Cash incentives - Phase out - Licensing fees - Tax on fuels - Tax on new wood heaters
Reduction of heater sales - State-wide ban on heater sales - Tax on new wood heaters
Reduction of existing stock - Cash incentive - Licensing fee - Tax on fuels - Phase out
Impact on heating efficiency - Efficiency standards/emission limits - Fuel moisture content regulation
Impact on emissions standards - Efficiency standards/emissions limit
Price impact on fuel use - Tax on fuels
The following assumptions were also used in the modelling analysis.
- Average price per wood heater of $1,0004.
- A discount of 7.0% was applied as advised by the NSW Treasury (2007) with sensitivity analysis conducted using 4% and 10%.
- Without adequate data for statistical analysis, the elasticity of wood heater demand with respect to price was assumed to be 0.5. This is slightly higher than the average price elasticity of 0.37 for household appliances (Dale et al, 2008) assuming that purchasers of wood heaters also consider other heating options.
Estimated percentage reductions in fuel use and emission for different emission and heating efficiency standards were provided by BDA (BDA, 2006).
- Table 18 shows the projected impacts on emissions from the introduction of emission limits and heating efficiency standards.
- Price elasticity of 0.2 for wood consumption given that wood heating has significant fuel cost advantage over other heating types, and a proportion of 50 percent for wood fuel being purchased (with the remainder obtained from free sources).
Sensitivity analysis has not been conducted on these assumptions as the assumptions are used consistently across the options for comparison purposes.
4 A discussion with the Australian Home Heating Association reveals that there is a range of wood heaters at a wide range of prices.

AECOM Economic Appraisal of Wood Smoke Control Measures - Final Report
29 June 2011
31
6.1.2 BAU projections
The stock model of wood heaters in NSW tracks the volume of existing and new wood heater stock including the removal of old wood heaters and the installation of new wood heaters.
Table 17 shows projections for BAU scenario where current policies, programs and education are not supplemented with new wood smoke control measures. The projection shows a decrease in wood heater stock by 13% and a reduction of 20% in PM10 emission (due to increasing share of combustion heaters which have lower emission rate per heater) during the period 2010- 2030. Table 17: Projections of wood heater stock and PM10 emissions under BAU
2010 2015 2020 2025 2030
Stock
Stock Installed Pre-2010 372,203 323,349 257,747 173,535 70,712
Stock Installed Post-2010 0 52,590 113,735 182,249 254,191
Total Stock 372,203 375,940 371,482 355,784 324,903
Change from 2010 1% 0% -4% -13%
Emission PM10 (tonnes/year))
Emission from Stock Pre-2010 11,530 9,137 7,282 4,899 1,986
Emission from Stock Post-2010 0 1,489 3,221 5,164 7,207
Total Stock 11,530 10,626 10,503 10,063 9,193
Change from 2010 -8% -9% -13% -20%
6.1.3 Assessment of impacts under control options
The assessment of the impacts under the control options is based on the methodology shown in Figure 11
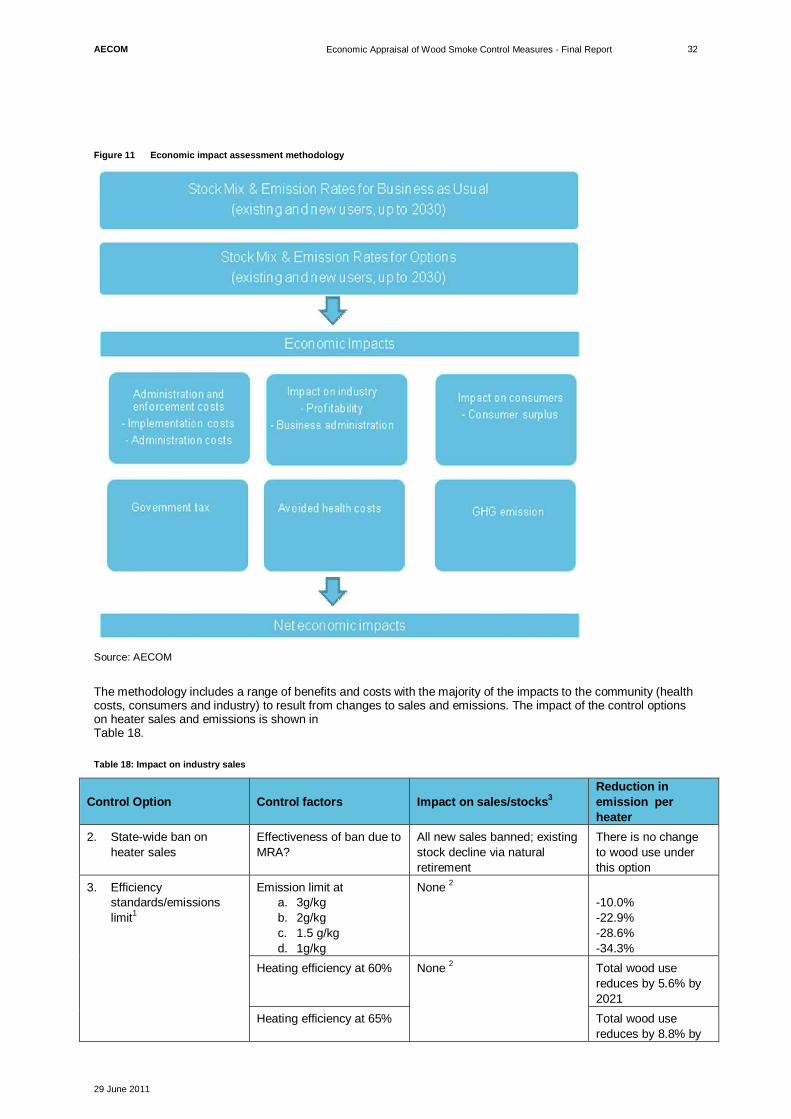
AECOM Economic Appraisal of Wood Smoke Control Measures - Final Report
29 June 2011
32
Figure 11 Economic impact assessment methodology
Source: AECOM
The methodology includes a range of benefits and costs with the majority of the impacts to the community (health costs, consumers and industry) to result from changes to sales and emissions. The impact of the control options on heater sales and emissions is shown in Table 18.
Table 18: Impact on industry sales
Control Option Control factors Impact on sales/stocks3 Reduction in emission per heater
2. State-wide ban on heater sales
Effectiveness of ban due to MRA?
All new sales banned; existing stock decline via natural retirement
There is no change to wood use under this option
3. Efficiency standards/emissions limit1
Emission limit at a. 3g/kg b. 2g/kg c. 1.5 g/kg d. 1g/kg
None 2 -10.0% -22.9% -28.6% -34.3%
Heating efficiency at 60% None 2 Total wood use reduces by 5.6% by 2021
Heating efficiency at 65% Total wood use reduces by 8.8% by

AECOM Economic Appraisal of Wood Smoke Control Measures - Final Report
29 June 2011
33
Control Option Control factors Impact on sales/stocks3 Reduction in emission per heater 2021
4. Phase out at sale of house
Decline at rate of house ownership turnover. Effect is geometric with declining ownership ratio.
Assumed to be 10% of housing stock per year as well as 10% of sales 4
There is no change to wood use under this option
5. Fuel moisture content No impact on sales of wood heaters
(See description below)
6. Tax on new wood heaters
Excise of $200 per heater -10.0%5 There is no change to wood use under this option
7. Licensing fees Annual licensing fee of $20 -10%5 There is no change to wood use under this option
8. Tax on fuels Excise of $20 per tonne of wood fuel
-2.6%5 Total wood use reduces by 1.5% based on elasticity of demand6
9. Cash incentive phase out
Program budget of $10 million to fund phasing out of 7,000 heaters in 10 years
Only 1/3 of number of rebates is actual “induced” phasing out of stock (around 230 heaters per annum or 2%). New sales also reduce by 2% in 10 years period.
There is no change to wood use under this option
(1) Based on BDA Report, Section 7.1.4
(2) Adoption of tighter limits may cause a price increase which is not known.
(3) The impacts on sales were calculated based on:
a. policy specifications, price elasticity and the stock model
b. declining stock (i.e. reduced replacement) due to changing community attitudes to wood heater ownership.
(4) The phase out of sale of house will be approximately 10% of existing stock each year. At the same time, 10% of potential new wood heater owners will be selling their house and therefore choose not to install a wood heaters as they will have to be removed and not be used by the new owner.
(5) The impact on sales is based on the cost of the wood heater (or wood fuel) and the assumed price elasticity of demand, which was assumed to be -0.5 e.g. A licence fee of $20 per year is equivalent to around $200 additional cost upfront. This would be similar to a 20 percent increase on wood heater price, so sales would reduce by 10 percent.
(6) The change in wood use as a result of the price increase on wood fuels is a function of the price elasticity of demand and the cost of wood fuel. This reduction also accounts for the level of scavenging for wood fuel in NSW.

AECOM Economic Appraisal of Wood Smoke Control Measures - Final Report
29 June 2011
34
For Option 5 (fuel moisture content regulation), the effect on emission reduction was derived by:.
- This study determined the relationship between fuel moisture content and energy content from EECABusiness (2011) as shown in Figure 12.
Figure 12 Moisture content and energy content relationship
Source: EECABusiness, 2011
- Figure 12 depicts the relationship between moisture content and energy content. Wood fuel with moisture content of 55% has approximately half the energy content as wood fuel with a moisture content of 20%. The lower energy content means a greater amount of fuel is required for the same total energy.
- The control would only impact on wood fuels put on sale (38% of total) and not those obtained from free sources. Report by J Todd (2003) (section 2.2.4) indicated that moisture content is already less than 20 percent for the bulk of firewood on sale, so the control would impact only on a small percentage of sale, assumed to be 20 percent or equivalent to 7.6 percent of total wood use.
- As this high moisture fuel needs be deferred for a period to achieve compliance (say by 6 months), its price may increase. At an annual discount rate of 10%, the cost of wood fuel would increase by 5% as result of the delay. The weighted average fuel cost would increase by only 0.4 percent as the bulk of wood fuel for sale is already below the wood fuel moisture content regulation and the price of only a small proportion of wood fuel would rise. Since the price effect was found to be insignificant, it was not included in the calculation.
6.1.4 Projections for control options considered
The stock model developed for existing and future wood heater ownership in NSW was used to generate projections of wood heater ownership under each option.
A visual comparison of these projections is shown in Figure 13. The figure shows that the forecast BAU stock shows a small decline out to 2030. The projection of wood heater stocks for the efficiency standard/emissions limit and fuel moisture content options do not deviate from the BAU projection5.
5 A comparison of the BAU and ABARE projections on domestic biomass fuel use was made. ABARE projections show a levelling off of fuel consumption to 2030 while BAU projections forecast a slight reduction in heater ownership and emission. Detail of ABARE forecasting method and assumptions were not available to allow more rigorous comparison.
0
2
4
6
8
10
12
14
16
18
20
0% 10% 20% 30% 40% 50% 60% 70% 80% 90% 100%
Ener
gy c
onte
nt (G
J / t
onne
)
Moisture content (%)

AECOM Economic Appraisal of Wood Smoke Control Measures - Final Report
29 June 2011
35
The most significant reduction in stock is a result of the phase out option with similar reductions in stock by 2030 under the ban on new wood heater sales. The remaining options, tax on new wood heaters, licensing fees, wood fuel tax and cash incentive phase out, have lower impacts on the projected stock of wood heaters. Figure 13 Stock projections for different options
Source: AECOM stock model
Reductions in the stock of wood heaters provide an indication of the effectiveness of each option to reduce wood smoke emissions. However, it is not a final measure since options 3 (efficiency standard/emissions limit) and 5 (fuel moisture content regulation) also reduce the emission rate per heater. An assessment of the PM10 emissions associated with each option is provided in Figure 14.
0
50,000
100,000
150,000
200,000
250,000
300,000
350,000
400,000
2010 2011 2012 2013 2014 2015 2016 2017 2018 2019 2020 2021 2022 2023 2024 2025 2026 2027 2028 2029 2030
No.
of w
ood
heat
ers
BAU/Efficiency standard/Fuel moisture content Ban on heater sales
Phase out Tax on new wood heaters
Licensing fees Wood fuel tax
Cash incentive phase out

AECOM Economic Appraisal of Wood Smoke Control Measures - Final Report
29 June 2011
36
Figure 14 PM10 emissions projections for each option
Source: AECOM stock model
PM2.5 and VOC emissions were not projected separately but assumed to change according to PM10 emissions. Option 2 (state-wide ban) and option 4 (phase out) provide the most rapid reductions in PM10 while option 6 (tax on new wood heaters) and option 7 (licensing fee) are the next most successful at reducing emissions. Option 6 (wood fuel tax), option 9 (cash incentive) and option 3 (efficiency measures) provide modest emission reductions compared to BAU. Option 5 (fuel moisture content regulation) provides a relatively small emission reductions when compared to the BAU.
The following tables depict the stock and emissions associated with each option at certain time points. The commencement date of the core options is 2012.
6.1.5 Ban on heater sales
The ban on all heater sales in NSW has significant impact on the total stock and total emissions to 2030. There a limited number of wood heaters sold between 2010 and the introduction of the ban in 2012.
2010 2015 2020 2025 2030
Stock
Stock Installed Pre-2010 372,203 323,349 257,747 173,535 70,712
Stock Installed Post-2010 0 9,894 9,894 8,885 7,240
Total Stock 372,203 333,243 267,641 182,419 77,952
Change from 2010 -10% -28% -51% -79%
Emission PM10 (tonnes/year)
Emission from Stock Pre-2010 11,530 9,137 7,282 4,899 1,986
0
2,000
4,000
6,000
8,000
10,000
12,000
14,000
2010 2015 2020 2025 2030
Tonn
es o
f PM
10
BAU Ban on heater sales Phase out
Tax on new wood heaters Licensing fees Wood fuel tax
Cash incentive phase out Efficiency standards Fuel moisture content

AECOM Economic Appraisal of Wood Smoke Control Measures - Final Report
29 June 2011
37
2010 2015 2020 2025 2030
Emission from Stock Post-2010 0 280 280 252 205
Total Stock 11,530 9,417 7,563 5,151 2,191
Change from 2010 -18% -34% -55% -81%
1) The ban would not being until 2012 which means that a small number of wood heaters will have been purchased between 2010 and 2012.
6.1.6 Efficiency standards and emissions limits
The modelled efficiency standard and emissions limit is 60% and 3.0g/kg respectively. Further modelling can be undertaken on different efficiency standards and emissions limits during detailed policy development.
2010 2015 2020 2025 2030
Stock
Stock Installed Pre-2010 372,203 323,349 257,747 173,535 70,712
Stock Installed Post-2010 0 52,590 113,735 182,249 254,191
Total Stock 372,203 375,940 371,482 355,784 324,903
Change from 2010 1% 0% -4% -13%
Emission PM10 (tonnes/year)
Emission from Stock Pre-2010 11,530 9,137 7,282 4,899 1,986
Emission from Stock Post-2010 0 1,348 2,820 4,463 6,185
Total Stock 11,530 10,485 10,102 9,362 8,171
Change from 2010 -9% -12% -19% -29%
6.1.7 Phase out
The phase out of wood heaters affects the pre-2010 installed stock which are removed when the house is sold and the general attractiveness of purchasing/replacing a wood heater.
2010 2015 2020 2025 2030
Stock
Stock Installed Pre-2010 372,203 212,150 99,857 39,699 9,552
Stock Installed Post-2010 0 40,027 47,893 45,749 39,149
Total Stock 372,203 252,176 147,749 85,448 48,701
Change from 2010 -32% -60% -77% -87%
Emission PM10 (tonnes/year)
Emission from Stock Pre-2010 11,530 5,995 2,821 1,121 268
Emission from Stock Post-2010 0 1,133 1,356 1,296 1,110

AECOM Economic Appraisal of Wood Smoke Control Measures - Final Report
29 June 2011
38
2010 2015 2020 2025 2030
Total Stock 11,530 7,128 4,178 2,417 1,378
Change from 2010 -38% -64% -79% -88%
6.1.8 Fuel moisture content
The fuel moisture content regulation does not reduce sales or reduce number of pre-2010 wood heaters however the reduced moisture content of the wood fuel does reduce overall emissions compared to BAU.
2010 2015 2020 2025 2030
Stock
Stock Installed Pre-2010 372,203 323,349 257,747 173,535 70,712
Stock Installed Post-2010 0 52,590 113,735 182,249 254,191
Total Stock 372,203 375,940 371,482 355,784 324,903
Change from 2010 1% 0% -4% -13%
Emission PM10 (tonnes/year))
Emission from Stock Pre-2010 11,530 8,613 6,864 4,618 1,872
Emission from Stock Post-2010 0 1,436 3,069 4,898 6,818
Total Stock 11,530 10,048 9,933 9,515 8,690
Change from 2010 -13% -14% -17% -25%
6.1.9 Tax on new wood heaters
The tax on new wood heaters reduces new sales of wood heaters with an associated reduction on emissions.
2010 2015 2020 2025 2030
Stock
Stock Installed Pre-2010 372,203 323,349 257,747 173,535 70,712
Stock Installed Post-2010 0 42,801 72,185 90,034 95,928
Total Stock 372,203 366,150 329,932 263,569 166,641
Change from 2010 -2% -11% -29% -55%
Emission PM10 (tonnes/year)
Emission from Stock Pre-2010 11,530 9,137 7,282 4,899 1,986
Emission from Stock Post-2010 0 1,211 2,044 2,551 2,720
Total Stock 11,530 10,349 9,327 7,450 4,706
Change from 2010 -10% -19% -35% -59%

AECOM Economic Appraisal of Wood Smoke Control Measures - Final Report
29 June 2011
39
6.1.10 Licensing fees
The licensing fees reduces the usage of existing wood heaters as well as reducing the number of wood heaters sold due to higher overall costs.
2010 2015 2020 2025 2030
Stock Stock Installed Pre-2010 372,203 316,931 246,378 161,774 64,289 Stock Installed Post-2010 0 42,281 70,364 86,706 91,271 Total Stock 372,203 359,212 316,742 248,480 155,560 Change from 2010 -3% -15% -33% -58%
Emission PM10 (tonnes/year) Emission from Stock Pre-2010 11,530 8,956 6,961 4,567 1,806 Emission from Stock Post-2010 0 1,197 1,993 2,457 2,588 Total Stock 11,530 10,152 8,954 7,024 4,393 Change from 2010 -12% -22% -39% -62%
6.1.11 Tax on wood fuel
The tax on wood fuel reduces the overall wood heater usage with a corresponding reduction in emissions.
2010 2015 2020 2025 2030
Stock
Stock Installed Pre-2010 372,203 323,349 257,747 173,535 70,712
Stock Installed Post-2010 0 49,886 100,830 150,344 193,565
Total Stock 372,203 373,236 358,577 323,879 264,278
Change from 2010 0% -4% -13% -29%
Emission PM10 (tonnes/year)
Emission from Stock Pre-2010 11,530 9,046 7,210 4,850 1,966
Emission from Stock Post-2010 0 1,412 2,856 4,260 5,488
Total Stock 11,530 10,458 10,065 9,110 7,454
Change from 2010 -9% -13% -21% -35%
6.1.12 Cash incentive phase out
The cash incentive phase out reduces the number of existing wood heaters with a corresponding reduction in emissions.
2010 2015 2020 2025 2030
Stock
Stock Installed Pre-2010 372,203 298,247 214,896 138,955 56,622
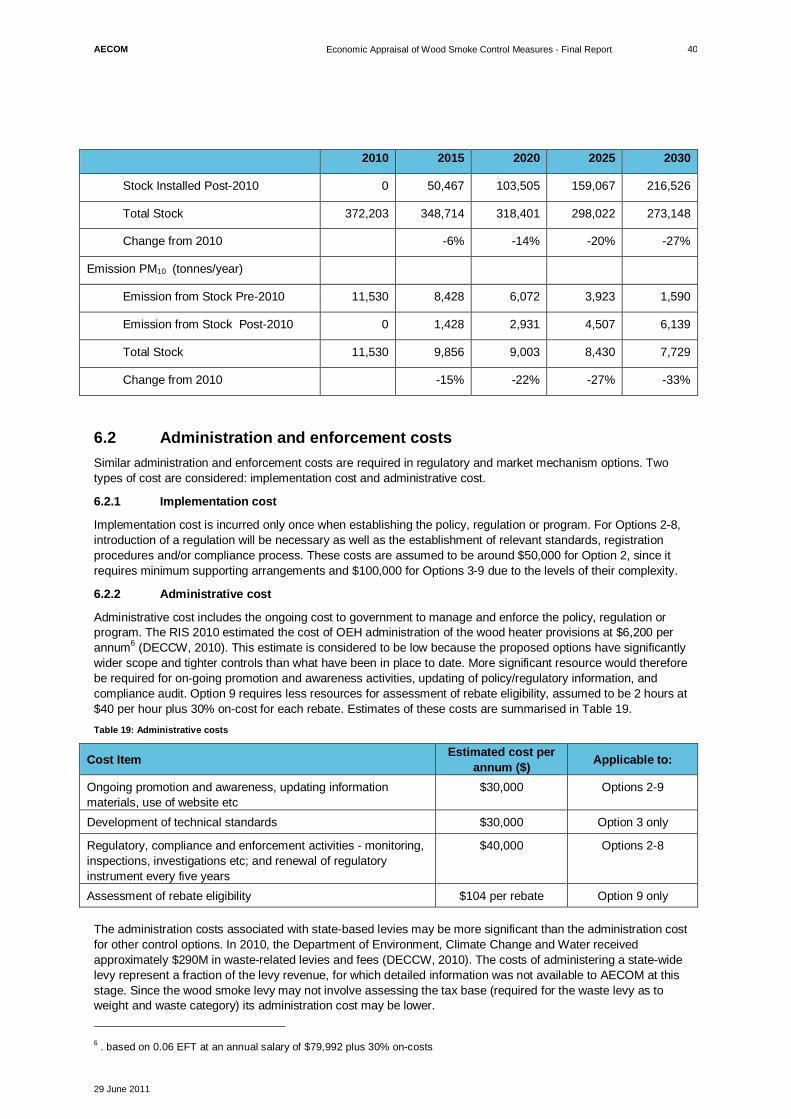
AECOM Economic Appraisal of Wood Smoke Control Measures - Final Report
29 June 2011
40
2010 2015 2020 2025 2030
Stock Installed Post-2010 0 50,467 103,505 159,067 216,526
Total Stock 372,203 348,714 318,401 298,022 273,148
Change from 2010 -6% -14% -20% -27%
Emission PM10 (tonnes/year)
Emission from Stock Pre-2010 11,530 8,428 6,072 3,923 1,590
Emission from Stock Post-2010 0 1,428 2,931 4,507 6,139
Total Stock 11,530 9,856 9,003 8,430 7,729
Change from 2010 -15% -22% -27% -33%
6.2 Administration and enforcement costs Similar administration and enforcement costs are required in regulatory and market mechanism options. Two types of cost are considered: implementation cost and administrative cost.
6.2.1 Implementation cost
Implementation cost is incurred only once when establishing the policy, regulation or program. For Options 2-8, introduction of a regulation will be necessary as well as the establishment of relevant standards, registration procedures and/or compliance process. These costs are assumed to be around $50,000 for Option 2, since it requires minimum supporting arrangements and $100,000 for Options 3-9 due to the levels of their complexity.
6.2.2 Administrative cost
Administrative cost includes the ongoing cost to government to manage and enforce the policy, regulation or program. The RIS 2010 estimated the cost of OEH administration of the wood heater provisions at $6,200 per annum6 (DECCW, 2010). This estimate is considered to be low because the proposed options have significantly wider scope and tighter controls than what have been in place to date. More significant resource would therefore be required for on-going promotion and awareness activities, updating of policy/regulatory information, and compliance audit. Option 9 requires less resources for assessment of rebate eligibility, assumed to be 2 hours at $40 per hour plus 30% on-cost for each rebate. Estimates of these costs are summarised in Table 19. Table 19: Administrative costs
Cost Item Estimated cost per annum ($) Applicable to:
Ongoing promotion and awareness, updating information materials, use of website etc
$30,000 Options 2-9
Development of technical standards $30,000 Option 3 only
Regulatory, compliance and enforcement activities - monitoring, inspections, investigations etc; and renewal of regulatory instrument every five years
$40,000 Options 2-8
Assessment of rebate eligibility $104 per rebate Option 9 only The administration costs associated with state-based levies may be more significant than the administration cost for other control options. In 2010, the Department of Environment, Climate Change and Water received approximately $290M in waste-related levies and fees (DECCW, 2010). The costs of administering a state-wide levy represent a fraction of the levy revenue, for which detailed information was not available to AECOM at this stage. Since the wood smoke levy may not involve assessing the tax base (required for the waste levy as to weight and waste category) its administration cost may be lower. 6 . based on 0.06 EFT at an annual salary of $79,992 plus 30% on-costs

AECOM Economic Appraisal of Wood Smoke Control Measures - Final Report
29 June 2011
41
6.2.3 Public and consumer education
For control options designed to curtail significantly the purchase of new or replacement wood heaters or ownership levels, a substantial on-going public and consumer education program is likely to be required.
Each of the options includes an education program to inform the public. The size and cost of the program would have to be assessed in detail for each option however, in this analysis, a standard education program comprises of:
- developing education program scope at a cost of $20,000;
- developing an online calculator at a cost of $20,000; and
- disseminating and/or advertising control policy or regulation at a cost $30,000.
The state-wide standard education program costs $70,000 in total per year and needs to be updated every five years.

AECOM Economic Appraisal of Wood Smoke Control Measures - Final Report
29 June 2011
42
6.3 Cost to industry The wood smoke control options will have the following impacts on the wood heater industry. The impact on producer surplus is a potential indicator for the industry impact however it does not enable an effective assessment given sales into other jurisdictions and an unknown price elasticity of supply.
6.3.1 Impact on profitability
Impact on sales by various control options can range from minimal to severe. Options 3 (efficiency standards) and 5 (fuel moisture content) have minimal impact. Option 2 (state-wide ban on sales) would significantly affect the wood heater industry in NSW. Options 4 (phase out) and 6-9 (licensing fees, tax on fuels and cash incentive) are likely to have significant impact on sale levels.
Industry impacts can be assessed in terms of number of employees affected or loss of profitability for the industry. Use of the former indicators would tend to exaggerate the impacts because the industry and its employees are expected to shift their resources to other productive sectors. This evaluation used loss of profit as the measurement of impact, assuming that current utilisation of capital and labour resources achieves higher margin and productivity respectively in the industry than they would if required to move to other sectors. Table 20 shows the impact to industry of each option. Table 20: Impact on industry sales
Control Option Loss of profitability NPV ($M)4
2) State-wide ban on heater sales -30.5
3) Efficiency standards/ emissions limit 0.05
4) Phase out -3.1
5) Fuel moisture content regulations 0.0
6) Sales tax/excise on new wood heaters - $200 per heater1 -3.1
7) Licensing fees - Annual fee of $20 -3.2
8) Levying an excise/tax on biomass fuels -0.8
9) Cash incentive phase out 3 -0.6
(1) A variant is an excise only on low efficiency heaters i.e. > 1.5g emission / 65% heating
(2) Based on input-output multiplier of 2.2 employees per $1 million output (ABS, 2001)
(3) Program budget of $4.1 million to fund “induced” phasing out of 7,000 heaters in 10 years
(4) Profitability based on 30% of gross turnover7
(5) Adoption of efficiency standards and emissions limits may cause a price increase for wood heaters which is not known.
6.3.2 Business administration cost
Manufacturers or suppliers of wood heaters and wood fuel will have responsibility for compliance with wood heater control regulations. The following business compliance costs will be incurred with most control options, but not with options 2 (ban), 4 (phase out) and 9 (cash incentive).
The costs of compliance were identified as follows:
- staff education – involves maintaining awareness of legislation and regulations, and the costs of keeping abreast of changes to regulatory details
7 ‘Margins by Sector’ using Value Line database, of 5928 firms by A Damodaran (January 2011)

AECOM Economic Appraisal of Wood Smoke Control Measures - Final Report
29 June 2011
43
- permission (Option 3 only) – involves applying for and maintaining permission for registration to conduct an activity, usually prior to commencing that activity
- record keeping – involves keeping statutory documents up-to-date.
Table 21 shows the inputs used and the estimated cost per model and total industry cost based on 275 wood heater models available in the market in Australia (BDA, 2006). Table 21 Business Compliance Cost
Category Task Cost Inputs Cost per model per annum
Industry cost per annum
Education Train staff Keep up-to-date 2 hours per year per model with
regulations or control programs
$104 $28,600
Permission (Option 3 only)
Complete registration of
efficiency standards
4 hours per year per model supplied
$208 $57,200
Record Keeping Maintain documents as
required
2 hours per year per model $104 $28,600
Total $114,400 Notes : labour cost charged at $40 per hour plus 30% on-cost
6.3.3 Testing costs under Option 2 (Efficiency Standards)
The BDA report (BDA, 2006) estimated that about 275 wood heater models on the market were certified as compliant with AS4013. With compliance testing required to be renewed every five years, on average, 55 wood heater models would require compliance testing and certification each year. Manufacture and design costs to meet AS4013 were not expected to be significant and have not been estimated.
The average cost of AS4013 compliance testing and certification is $10,700 per wood heater model (BDA 2006). For the estimated 55 wood heater models compliance tested in Australia, the annual cost to industry would be $588,500. Based on the State’s proportion of 39 percent of wood heater ownership, the industry cost for compliance testing under Option 3 (emissions standards and efficiency limits) in NSW was estimated at around $230,000 per year in 2006.
For the purpose of the cost benefit analysis, it is assumed that industry will pass the business compliance and/or testing costs on to customers8 although this cost is not considered to be significant.
6.4 Impact on consumers The consumer surplus for a customer in a market is the difference in the amount that a customer would be willing to pay for a good or service (i.e. new wood heater) and the price that they actually pay (ACMA, 2009). This is graphically represented as the dark blue area in the chart on the left of Figure 15.
The amount that a customer is willing to pay is that customer’s ‘walk-away’ valuation of the good or service, that is, the price beyond which they will no longer be willing even to negotiate. Another term for ‘willingness to pay’ is reservation price. This value or ‘price’ is information privately held by the customer and not revealed to a seller. The price actually paid by a customer is equal or lower than a customer’s reservation price and the larger the gap between the two, the greater the feeling the customer has of having received a ‘bargain’. The size of the gap (the consumer surplus) is consequently a measure of a customer’s relative ‘happiness’ or ‘benefit’ arising out of the transaction. The consumer surplus for a whole market is derived by adding the consumer surpluses of all customers.
8 These costs only need to be accounted for once in the CBA.

AECOM Economic Appraisal of Wood Smoke Control Measures - Final Report
29 June 2011
44
The assessment of the net public benefit flowing from the control measures will include their impact on the consumer surplus. Figure 15 shows the loss of consumer surplus as a result of levying an excise on new wood heaters.
Figure 15 Consumer Impact of Excise on Wood heaters
Source: AECOM
A hypothetical increase in the price of wood heaters through the introduction of an excise will increase the price of wood heaters. This price increase from the excise reduces the quantity of wood heaters demanded and therefore reduces the consumer surplus; the area below the demand curve and above the price (P1). The amount of consumer surplus loss is dependent on the size of the excise and the responsiveness of people to price changes (elasticity of demand). There are impacts on the producer surplus and taxes collected from the excise as well as the creation of deadweight loss however the consumer does not differentiate between these costs. Consumers only experience the change in consumer surplus. The impact on industry and the resulting tax revenues are examined in other sections.
The reduction in consumer surplus generally appears as reduction in the value that people gain from the consumption of goods and services. In this case, less people would be able to purchase wood heaters and experience the private benefits of relatively cheap heating and aesthetics.
Consumer surplus will be altered with a change in price or with a change in a non-price characteristic (such as quality or delivery time) of a good or service. The differences between a change in price and a change in a non-price characteristic have implications for the process for measuring the impact on consumer surplus.
The total consumer surplus net the tax revenue loss is shown in Table 22. Table 22 Consumer surplus impact from each option (net transfer payments)
Options Impact on Consumer Surplus NPV ($M)
2) State-wide ban on heater sales -$101.7
3) Efficiency standards/emissions limit $0.0
4) Phase out -$19.3
5) Fuel moisture content regulations $0.0
6) Sales tax/excise on new wood heaters -$14.9
7) Licensing fees -$3.9
8) Levying an excise/tax on biomass fuels $34.4
9) Cash incentive phase out $0.0
Source: AECOM
The largest consumer impact is the state-wide ban on wood heaters. This impact was flagged in the preliminary assessment given the total restriction on wood heater sales. The impact of the phase out on consumer surplus is

AECOM Economic Appraisal of Wood Smoke Control Measures - Final Report
29 June 2011
45
a result of the change to wood heater sales from the removal and eventual phase out of wood heaters. Future wood heater consumers will factor in the phase out and make purchase decisions on this basis.
The impact of market mechanisms (taxes and licensing fees) is relatively lower than the regulatory measures except for the efficiency standards/emissions limit. The difference in the market mechanisms is that the licensing fee applies to all wood heaters while the sales tax applies only to new wood heaters and the fuel tax applies only to purchased fuel.
6.5 Transfer payment - government tax revenue Tax revenues to government are considered as transfer payments and are not a cost or benefit. This is because government taxes are used to fund other services in the community. Only Options 6, 7 and 8 generate tax revenues, which are shown in Table 23. The government revenue is not included in the subsequent CBA and is subtracted from the consumer surplus. Table 23 Government tax revenue
Option Description NPV ($M)
6 Tax on new wood heaters 4.4
7 Licensing fees 16.5
8 Wood fuel tax 39.6
Note: Calculated by multiplying forecast wood heater sales (or stock) by tax.
6.6 Benefits of avoided health costs Air pollution released by the burning of wood in wood heaters has been shown to impact on human health. These health impacts can be converted into health costs through a willingness-to-pay (WTP) assessment or human capital assessment. These two assessments determine an economic cost for `a particular health impact which can be used to determine the cost of the health impact or benefit of avoided health cost.
A meta-analysis of cohort-based long-term United States studies by Kunzli et al in 2000 derived a series of exposure-response functions for a range of air pollutants and health outcome. An exposure-response function provides an estimate of the increase in risk of a health outcome with an incremental increase in exposure to a particular air pollutant. For example, the exposure-response function for mortality associated with PM10 was calculated to be a 4.3% increase in mortality for each 10 g/m3 increase in exposure to PM10.
These exposure-response functions were used by the Bureau of Transport and Regional Economics (BTRE) to calculate the health cost and environmental effects of ambient concentrations of air pollution. The analysis, conducted using 2000 data, estimated the impacts attributable to air pollutants (BTRE, 2005). This study estimated, that in 2000, motor vehicle particulate pollution accounted for between 900 and 4500 morbidity cases—cardio-vascular disease, respiratory disease, and bronchitis—and for between 900 and 2000 early deaths. The range of estimates is a result of the range of exposure-response functions developed by Kunzli et al. BTRE also used a WTP economic assessment to calculate the value of human health.
A cost benefit analysis on transport fuel quality and vehicle standards conducted for the MVEC Review of Vehicle Emissions and Fuels Standards Post 2006 used exposure-response functions based on a review of Australian and international epidemiological studies to measure the health improvements associated with four vehicle emissions and fuel quality standards in Australia (Coffey, 2003). The exposure-response functions used in the cost benefit analysis by Coffey included the functions developed by Kunzli et al (2000). The cost benefit analysis adopted a range of cost estimates for health impacts, primarily relying on WTP studies from Australia and abroad.
Beer (2002) also undertook an assessment of pollutants based on published assessments of Australian health impacts from air pollutants. A separate assessment by the BDA Group (2006) used health costs per tonne based on data supplied by the Australian Department of the Environment and Heritage. The data provided health costs per tonne of PM10 by capital city.
The Australian Department of Infrastructure, Transport Regional Development and Local Government (DITRDLG) undertook an assessment of the health costs conducted to date including Beer (2002), BTRE (2005) and Coffey (2003). The results of the assessment were presented as health costs adjusted for 2010 in the Draft Regulatory Impact Statement for the Review of Euro 5/6 Light Vehicle Emissions Standards (DITRDLG, 2009). DITRDLG

AECOM Economic Appraisal of Wood Smoke Control Measures - Final Report
29 June 2011
46
accounted for the fact that the scale of the impact depends on the area where the air pollutant is present with greater health impacts seen in more populated centres such as capital cities.
The US EPA recently released an approximate health cost for PM2.5 (US EPA, 2010) which has been included in this assessment. There is limited or no health costs studies relating to the cost of PM2.5 in Australia.
The results of the range of health cost assessments are summarised in Table 24. Table 24 Health costs by air pollutant type
Air Pollution Studies VOCs PM10 $/tonne $/tonne
DITRDLG, 2010 Rural 105 55,825
Capital City 8,830 235,260
Beer, 2002
Lower 11,700 108,300
Best 19,331 147,429
Upper 72,500 221,100
Coffey, 2003 Capital City 2,200 232,000
BDA, 2006 Sydney N/A 133,543
Source: DITRDLG, 2010; Beer, 2002; BDA Group, 2006 and Coffey, 2003, US EPA 2010
The DITRDLG costs were chosen for PM10 and VOCs as the most relevant costs estimation for the pollution components. These health costs were then weighted by the following process. The weighting recognises that there is a significant difference between the health costs in capital cities and rural regions. It is recognised that the health costs differed on the basis of population density so population density was used to weight the health costs in regions across NSW. The calculation of weighted health costs was undertaken by the following steps
1) health costs for all urban areas were assigned the capital city health cost per tonne (i.e. Sydney) of $235,260 for PM10 and $8,830 for VOC
2) health costs for all other areas (regional centres and rural areas) were calculated using population density as an adjustment factor i.e. health cost i = health cost Sydney * (density for area i) / (Sydney density). These estimates are only indicative as a better evidence based scientific method for estimation is not available at this stage.
The weighting undertaken for this assessment provides health costs for the number of regions in NSW that are not rural or a capital city.
The weighted air pollution costs for the core options health cost assessment are presented in Table 25, recognising that the significant difference between population densities in regional/rural to capital cities. Table 25 Weighted health costs
Air Pollution $/tonne
PM10 $72,114
VOC $2,624
Source: DITRDLG, 2010, US EPA 2010 – weighted by AECOM
The calculation of the benefit of avoided health cost is centred on the valuation of the reduced emissions from each control option in relation to the BAU. The results of the health cost and avoided health cost analysis is presented in Table 26. Table 26 Total health costs and avoided health costs from BAU (NPV $ million)
NPV ($M) Absolute health costs Avoided health costs
Option PM10 VOC Total Health Cost PM10 VOC
Avoided Health Costs
1) BAU -$7,897 -$175 -$8,072

AECOM Economic Appraisal of Wood Smoke Control Measures - Final Report
29 June 2011
47
NPV ($M) Absolute health costs Avoided health costs
Option PM10 VOC Total Health Cost PM10 VOC
Avoided Health Costs
2) Ban on heater sales -$5,740 -$127 -$5,867 $2,158 $48 $2,206
3) Efficiency standards (60%, 3g/kg) -$7,603 -$168 -$7,772 $294 $7 $301
4) Phase out at sale of house -$3,970 -$88 -$4,058 $3,928 $87 $4,015
5) Fuel moisture content regulations -$7,507 -$166 -$7,673 $391 $9 $399
6) Sales tax on new wood heaters -$6,871 -$152 -$7,023 $1,026 $23 $1,049
7) Licensing fees -$6,658 -$147 -$6,805 $1,240 $27 $1,267
8) Levying an excise/tax on biomass fuels -$7,488 -$166 -$7,654 $410 $9 $419
9) Cash incentive phase out -$7,038 -$156 -$7,194 $860 $19 $879
Source: AECOM
Note: The absolute health costs refer to the amount of health costs incurred across NSW as a result of the composition of the wood smoke. The total health costs are the NPV of the health costs for BAU and each option. The avoided health costs are the benefits of the each option and are the difference between the total health costs in each option and the health costs under BAU.
( ) ( )
The most significant avoided health are associated with option 2 (state-wide ban) and option 4 (phase out). This is in line with them having the greatest emission reductions potential of the options. Option 9 (cash incentive), option 6 (tax on new wood heaters) and option 3 (efficiency standards/emission limits) are relatively similar in avoided health costs. The two options aimed at fuel use have the lowest impact (option 5 and 8)
The avoided health cost assessment also provides an indication of the potential size of avoided health costs from a package of options. The combination of an efficiency standard/emission limit and cash incentive phase out may generate avoided health costs that are comparable to a state-wide ban. The present values are calculated based on a 7% discount rate and the time period is 2010 to 2030.
6.7 Greenhouse gas emissions assessment An assessment of the direct greenhouse gas emission (GHG) reductions attributable to each control options is shown in Figure 16. The assessment of GHG emissions was taken from the US EPA (2006) and includes carbon dioxide (CO2), methane and nitrous oxide (NO2) expressed as tonnes of carbon dioxide equivalent (CO2-e). These factors account for the emissions associated with the combustion of the wood fuel unlike the National Greenhouse Account factors that assume the combustion of wood is a neutral greenhouse gas emission activity. Table 27 Greenhouse gas
Carbon Dioxide (kg/t)
Methane (kg/t)
Methane- CO2
Equivalent Factor
NO2
(kg/t)
NO2- CO2
Equivalent Factor
GHG Emissions per year (t CO2-e per heater)
Slow combustion heater with compliance plate 1387.7 14.20 21.00 0.15 310.00 5.03 Slow combustion heater without compliance plate 1146.1 32.00 21.00 0.15 310.00 5.40
An open fireplace 1357.8 7.20 21.00 0.15 310.00 3.13
Potbelly stove 1146.1 32.00 21.00 0.15 310.00 4.32

AECOM Economic Appraisal of Wood Smoke Control Measures - Final Report
29 June 2011
48
Source: US EPA. 2006
Figure 16 Greenhouse gas assessment of options
Source: AECOM, 2011 and DCCEE, 2011and US EPA. 2006
The GHG reduction attributable to each control option is based on the reduced wood fuel use. The GHG emissions associated with alternative heating systems has not been included as there is limited information on heating choices.
6.8 Cost benefit analysis results The results of the cost benefit analysis are presented in Table 28. The total non-health cost is the cumulative cost accruing to the government, industry and consumers while the health benefit over the BAU is the difference in health cost for each option in comparison to the BAU health cost. The net benefit is the sum of the total non-health cost and the health benefit over BAU using a 7% discount rate as advised by the NSW Treasury cost benefit analysis guidelines (NSW Treasury, 2007). Transfer payments as a result of taxes/levies have not been included in the cost-benefit analysis.
0
200,000
400,000
600,000
800,000
1,000,000
1,200,000
1,400,000
1,600,000
1,800,000
2,000,000
2010 2015 2020 2025 2030
Gre
enho
use
gas
emis
sion
s (to
nnes
)
Option 1
Option 2
Option 3
Option 4
Option 5
Option 6
Option 7
Option 8
Option 9

AECOM Economic Appraisal of Wood Smoke Control Measures - Final Report
29 June 2011
49
Table 28 Cost benefit analysis results
Control Options Total Costs1 Health Benefit over BAU2 Net Benefit3
BAU $0 $0
Ban on heater sales -$134 $2,206 $2,071
Efficiency standards -$3 $301 $298
Phase out -$36 $4,015 $3,978
Fuel moisture content -$33 $399 $366
Tax on new wood heaters -$1 $1,049 $1,048
Licensing fees $11 $1,267 $1,278
Tax on wood fuel $36 $419 $455
Cash incentive phase out -$12 $879 $867
1. Total costs are the costs associated with each option excluding the health costs identified in the health assessment
2. The benefits are the reductions in health costs that result from each control option.
3. Net benefit of each option (excluding BAU) is the health benefits over BAU minus the total costs.
The option with the highest net benefit is the phase out of wood heaters with over $3.98 billion of net benefit out to 2030. The ban on heater sales has the second highest net benefit however this option has the highest non-health costs with particularly high costs to industry.
The market based mechanisms have similar net benefits and the lowest net benefit is a result of the fuel moisture content regulation due to the relatively little health benefit over BAU. A visual representation of the results of the cost benefit analysis is presented in Figure 17.
Figure 17 Cost benefit analysis results
The figure shows that the total non-health costs are small compared to the health benefits over BAU. This is also represented by the small difference between health benefit over BAU and net benefit. The results of the cost benefit analysis suggest that all of the primary options generate a net benefit based on the avoided health costs. There is strong justification for pursuing wood smoke control options.
In particular, the introduction of a state-wide ban or phase-out of wood heaters would generate large and immediate benefits however they cause significant impacts on consumers and the industry. Consideration of
-$500
$0
$500
$1,000
$1,500
$2,000
$2,500
$3,000
$3,500
$4,000
$4,500
Ban on heater sales
Efficiency standards
Phase out Fuel moisture content
Tax on new wood heaters
Licensing fees
Tax on wood fuel
Cash incentive phase out
NPV
(203
0)
Health Benefits over BAU Total Cost Net Benefit

AECOM Economic Appraisal of Wood Smoke Control Measures - Final Report
29 June 2011
50
trade-offs and use of an agreed method for balancing them should be included in the development and assessment for policy option packages. Given the relatively low levels of costs associated with implementation and the huge benefit cost ratios for all options, the BCRs, if calculated explicitly, would not assist in the selection between options.
Table 29 summarises the cost benefit analysis and includes commentary on other issues including:
- acceptability of control option
- consistency with national approach
- ability to focus policy and manage socio-economic impacts.

AECOM Economic Appraisal of Wood Smoke Control Measures - Final Report
29 June 2011
51
Table 29 Summary of options assessment using selected criteria
Name Description Net Benefit Industry Impact Impact on Consumers
Acceptability, Effectiveness & Ease of Implementation Uniformity & Consistency Ability to Focus Policy & Manage Socio-Econ Impacts
Public Acceptability Ease of Implementation Timeframe
Consistency of regulatory framework
Consistent with National Approach
Ban A ban on the sale of new wood heaters.
- $2,071M - -$30.5M - -$101.7M - Difficult to envisage broad public acceptability for ban
- Requires legislation/regulation for state-wide ban
- Development control plans (DCPs) used by councils or legislative framework/regulation to target priority areas
- Potential to develop new regulatory instrument for ban
- Immediate
- Total ban will have state-wide uniformity and consistency
- Bans for priority areas will not be consistent based on current DCP model – may need new instrument
- May exceed the intended actions of the future national approach
- May be undertaken with cash incentive to reduce socio-economic impacts
Efficiency Standards and Emissions Limits - 1
A state-wide regulation that mandates the efficiency and emissions of new wood heaters (all new wood heaters sold in NSW will have a heating efficiency of at least 60% and 3g).
- $298M - $0.0 - $0.0M - Should be publicly acceptable as it will reduce fire wood consumption and reduce emissions
- Availability issues
- Local policies currently used by councils to implement increased emissions standards (Armidale)
- Potential to develop new regulatory instrument
- Medium term
- State-wide regulation for new standard will be consistent
- Potential to develop a new regulatory framework to implement in priority areas
- National approach may improve emissions standards
- May provide support for national approach for lower emissions standards
- Given little or no price rise, there appears to be little impact on lower socio-economic groups
- Can be implemented in priority areas
Phase Out at Sale of House
Owners of wood heaters are mandated to remove their wood heater or render it inoperable at the time of sale and it is verified at time of sale or within a mandated period of time.
- $3,978M - -$3.1M - -$30.5M - Potentially problems in communication
- Regulation required to ensure removal/render inoperable at time of sale or within the mandated period
- Need to monitor and enforce
- Immediate
- Consistent if applied at state-level
- Local councils generally do not have regulatory role in sale of house
- New regulatory instrument required
- Would complement national approach
- May be undertaken with cash incentive to assist lower socio-economic groups
Fuel moisture content regulations
A regulation on a maximum moisture content of 20% for wood fuel sold in NSW.
- $366M - $0.0 - -$30.5M - Publically acceptable as it would reduce cost of heating
- Has been previously implemented in other jurisdictions (ACT, WA)
- Medium term
- Consistent if applied at state-level
- Would complement national approach
- Reduced ability to focus policy due to scavenging

AECOM Economic Appraisal of Wood Smoke Control Measures - Final Report
29 June 2011
52
Name Description Net Benefit Industry Impact Impact on Consumers
Acceptability, Effectiveness & Ease of Implementation Uniformity & Consistency Ability to Focus Policy & Manage Socio-Econ Impacts
Public Acceptability Ease of Implementation Timeframe
Consistency of regulatory framework
Consistent with National Approach
Fee on New Wood Heaters
An annual licensing fee (and possible license test) for wood heater owners.
- $1,048M - -$3.1M - $4.4M - May be perceived as an extra tax
- Requires a good knowledge of difference between private and social costs (health costs)
- Fee introduced using regulation at state-level
- Fee levied at point of sale of new wood heater
- Potential difficulties collecting fees at state level as opposed to GST
- Immediate
- Will be consistent across state
- Would complement national approach Potential for arbitrage between states based on price differences
- Fee revenue used to support low socio-economic groups to purchase other heating system
Licensing Fee
A licensing fee on all wood heater owners
- $1,278M - -$3.2M - $16.5M - Potentially difficult given existing ownership
- May be objected as an extra tax
- Potentially difficult given retrospective licensing – need to justify licensing requirements
- Potentially costly to implement and enforce as currently no data on ownership
- Immediate – medium term
- Consistent if applied at state-level
- Would complement national approach
- Fee may be means tested however need for wide coverage to gain emissions reductions
- Development of a licensing fee also helps identify areas of strong use
Excise on Fuel
A sales tax/excise on wood heater fuel recognising the social (health) costs of wood smoke.
- $455M - -$0.8M - $39.6M - May encourage scavenging of fire wood and perceived as an extra tax
- Fee introduced using regulation at state-level
- Fee levied at point of sale of wood fuel
- Immediate
- Will be consistent across state
- Would complement national approach
- Potential for arbitrage between states based on price differences
- May increase scavenging
Cash Incentive Phase out
A buy-back program to phase out wood heaters or incentivise purchase of more efficient wood heaters.
- $867M - -$0.6M - $0.0M - Easy to understand
- Need to choose appropriate rebate level to balance benefits to society against payment to replace/remove wood heater as well as utility of owner
- Easy to implement however funding issues as replacement programs are expensive.
- Immediate - State-wide program will be consistent
- Can target priority areas
- Would complement national approach
- Able to be means tested to target lower socio-economic groups

AECOM Economic Appraisal of Wood Smoke Control Measures - Final Report
29 June 2011
53
6.9 Sensitivity analysis Sensitivity analysis has been conducted on the net benefit of the core options (excluding the BAU), using 4%, 7% and 10% as advised by the NSW Treasury cost benefit analysis guidelines (NSW Treasury, 2007). The results are shown in Figure 18
Figure 18 Discount rate sensitivity analysis – net benefit (NPV $ million)
The size of the health benefit means that all of the options still present a net benefit using a 10% discount rate although the net benefits are significantly reduced. Higher discount rates place greater value on the initial costs of establishment and reduce the value of the health benefits in later years which decrease the NPV of the net benefits for each option. Health benefits are the main contributor to the net benefit of the control policies. If the estimated values of health costs of the wood smoke emissions are reduced by half, all of the above control options still deliver substantial (though reduced) net social benefit. The above evaluation is therefore not sensitive to the estimate values of the health costs of emissions. However, given the possible variability of these estimates across areas i.e. capital cities, major urban centres, regional urban and rural, the evaluation may not be sufficiently precise for assessing outcomes for a particular area.
$0
$1,000
$2,000
$3,000
$4,000
$5,000
$6,000
Ban on heater sales
Efficiency standards
Phase out Fuel moisture content
Tax on new wood
heaters
Licensing fees
Tax on wood fuel
Cash incentive phase out
NPV
(203
0)
Net Benefit (4%) Net Benefit (7%) Net Benefit (10%)
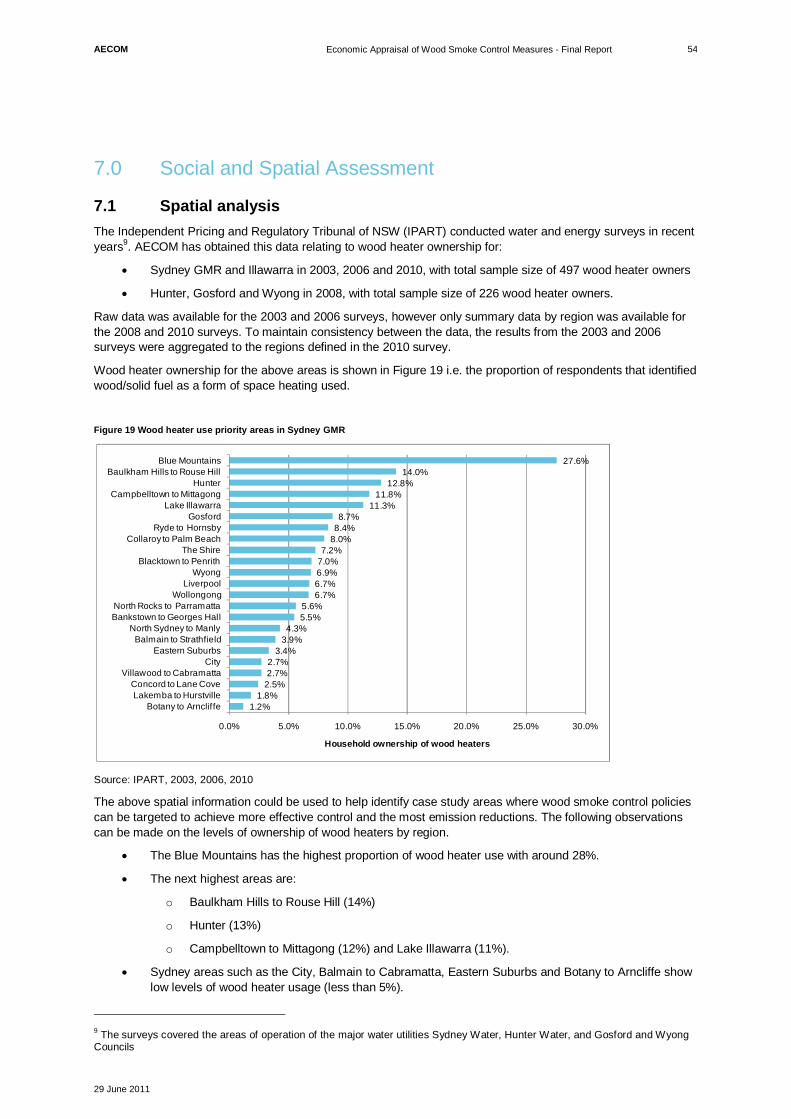
AECOM Economic Appraisal of Wood Smoke Control Measures - Final Report
29 June 2011
54
7.0 Social and Spatial Assessment
7.1 Spatial analysis The Independent Pricing and Regulatory Tribunal of NSW (IPART) conducted water and energy surveys in recent years9. AECOM has obtained this data relating to wood heater ownership for:
Sydney GMR and Illawarra in 2003, 2006 and 2010, with total sample size of 497 wood heater owners
Hunter, Gosford and Wyong in 2008, with total sample size of 226 wood heater owners.
Raw data was available for the 2003 and 2006 surveys, however only summary data by region was available for the 2008 and 2010 surveys. To maintain consistency between the data, the results from the 2003 and 2006 surveys were aggregated to the regions defined in the 2010 survey.
Wood heater ownership for the above areas is shown in Figure 19 i.e. the proportion of respondents that identified wood/solid fuel as a form of space heating used.
Figure 19 Wood heater use priority areas in Sydney GMR
Source: IPART, 2003, 2006, 2010
The above spatial information could be used to help identify case study areas where wood smoke control policies can be targeted to achieve more effective control and the most emission reductions. The following observations can be made on the levels of ownership of wood heaters by region.
The Blue Mountains has the highest proportion of wood heater use with around 28%.
The next highest areas are:
o Baulkham Hills to Rouse Hill (14%)
o Hunter (13%)
o Campbelltown to Mittagong (12%) and Lake Illawarra (11%).
Sydney areas such as the City, Balmain to Cabramatta, Eastern Suburbs and Botany to Arncliffe show low levels of wood heater usage (less than 5%).
9 The surveys covered the areas of operation of the major water utilities Sydney Water, Hunter Water, and Gosford and Wyong Councils
1.2%1.8%
2.5%2.7%2.7%
3.4%3.9%4.3%
5.5%5.6%
6.7%6.7%6.9%7.0%7.2%
8.0%8.4%8.7%
11.3%11.8%
12.8%14.0%
27.6%
0.0% 5.0% 10.0% 15.0% 20.0% 25.0% 30.0%
Botany to ArncliffeLakemba to Hurstville
Concord to Lane CoveVillawood to Cabramatta
CityEastern Suburbs
Balmain to StrathfieldNorth Sydney to Manly
Bankstown to Georges HallNorth Rocks to Parramatta
WollongongLiverpool
WyongBlacktown to Penrith
The ShireCollaroy to Palm Beach
Ryde to HornsbyGosford
Lake IllawarraCampbelltown to Mittagong
HunterBaulkham Hills to Rouse Hill
Blue Mountains
Household ownership of wood heaters
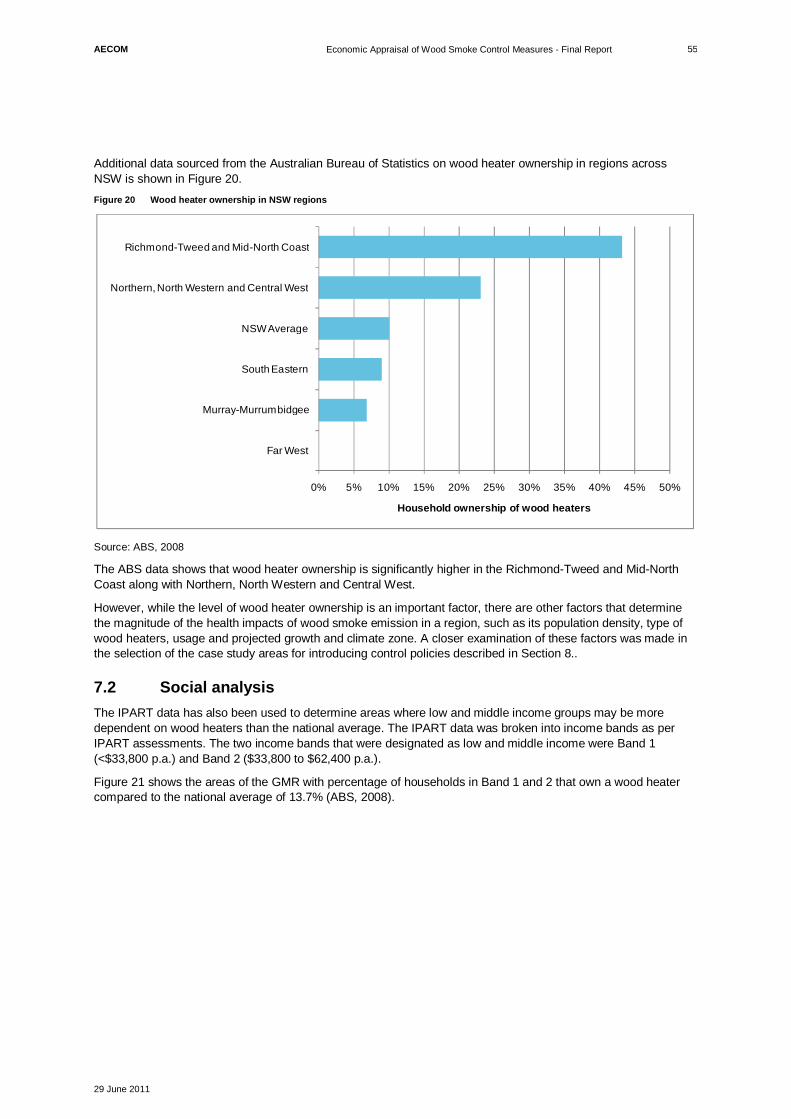
AECOM Economic Appraisal of Wood Smoke Control Measures - Final Report
29 June 2011
55
Additional data sourced from the Australian Bureau of Statistics on wood heater ownership in regions across NSW is shown in Figure 20. Figure 20 Wood heater ownership in NSW regions
Source: ABS, 2008
The ABS data shows that wood heater ownership is significantly higher in the Richmond-Tweed and Mid-North Coast along with Northern, North Western and Central West.
However, while the level of wood heater ownership is an important factor, there are other factors that determine the magnitude of the health impacts of wood smoke emission in a region, such as its population density, type of wood heaters, usage and projected growth and climate zone. A closer examination of these factors was made in the selection of the case study areas for introducing control policies described in Section 8..
7.2 Social analysis The IPART data has also been used to determine areas where low and middle income groups may be more dependent on wood heaters than the national average. The IPART data was broken into income bands as per IPART assessments. The two income bands that were designated as low and middle income were Band 1 (<$33,800 p.a.) and Band 2 ($33,800 to $62,400 p.a.).
Figure 21 shows the areas of the GMR with percentage of households in Band 1 and 2 that own a wood heater compared to the national average of 13.7% (ABS, 2008).
0% 5% 10% 15% 20% 25% 30% 35% 40% 45% 50%
Far West
Murray-Murrumbidgee
South Eastern
NSW Average
Northern, North Western and Central West
Richmond-Tweed and Mid-North Coast
Household ownership of wood heaters
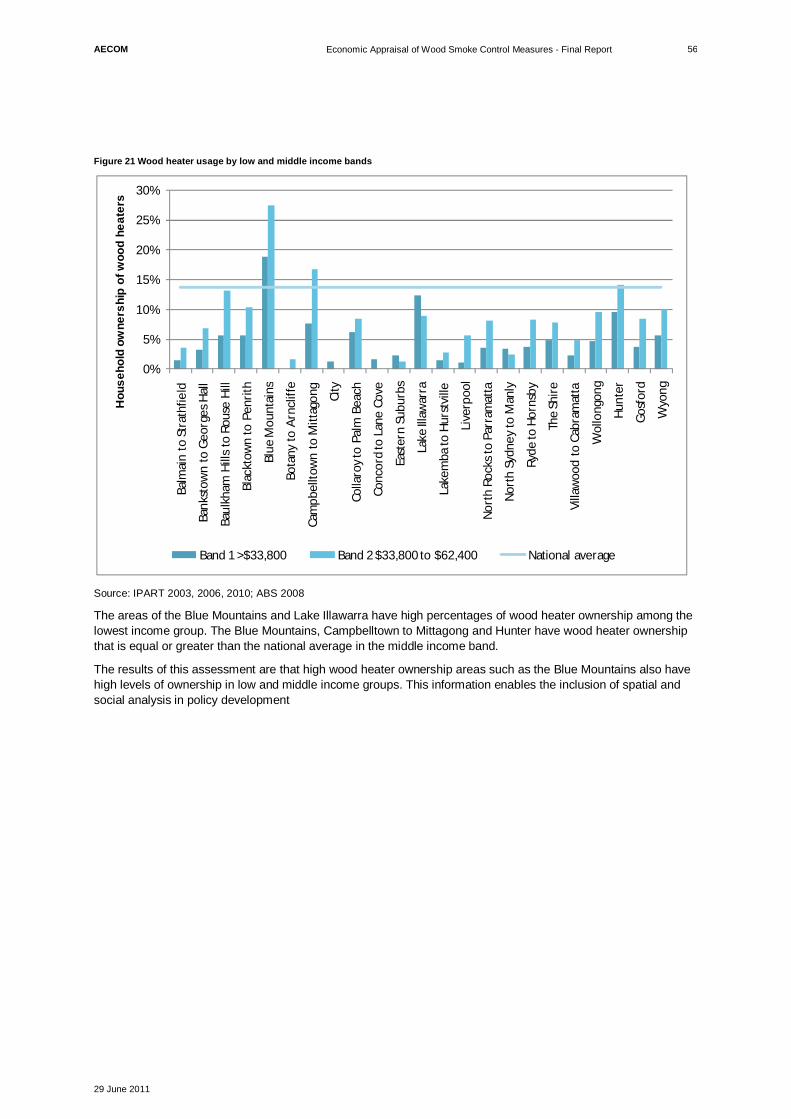
AECOM Economic Appraisal of Wood Smoke Control Measures - Final Report
29 June 2011
56
Figure 21 Wood heater usage by low and middle income bands
Source: IPART 2003, 2006, 2010; ABS 2008
The areas of the Blue Mountains and Lake Illawarra have high percentages of wood heater ownership among the lowest income group. The Blue Mountains, Campbelltown to Mittagong and Hunter have wood heater ownership that is equal or greater than the national average in the middle income band.
The results of this assessment are that high wood heater ownership areas such as the Blue Mountains also have high levels of ownership in low and middle income groups. This information enables the inclusion of spatial and social analysis in policy development
0%
5%
10%
15%
20%
25%
30%Ba
lmai
n to
Str
athf
ield
Ban
ksto
wn
to G
eorg
es H
all
Baul
kham
Hill
s to
Rou
se H
ill
Blac
ktow
n to
Pen
rith
Blue
Mou
ntai
ns
Bota
ny t
o A
rncl
iffe
Cam
pbel
ltow
n to
Mitt
agon
g
City
Colla
roy
to P
alm
Bea
ch
Conc
ord
to L
ane
Cove
East
ern
Subu
rbs
Lake
Illa
war
ra
Lake
mba
to H
urst
ville
Live
rpoo
l
Nor
th R
ocks
to P
arra
mat
ta
Nor
th S
ydne
y to
Man
ly
Ryde
to H
orns
by
The
Shir
e
Villa
woo
d to
Cab
ram
atta
Wol
long
ong
Hun
ter
Gos
ford
Wyo
ng
Hou
seho
ld o
wne
rshi
p of
woo
d he
ater
s
Band 1 >$33,800 Band 2 $33,800 to $62,400 National average

AECOM Economic Appraisal of Wood Smoke Control Measures - Final Report
29 June 2011
57
8.0 Cost Benefit Analysis of Combined Options
8.1 Selection of combined options Based on the assessment of the core control options above and consultation with OEH, a number of additional options were formulated as a combination of the core control options that are only applied to selected case study areas where possible (Combined Options). There are five combined options (Combined Options 10, 11, 12, 13 and 14), the composition of which is shown in Table 30.
Table 30 Combined control options matrix
Option Core Control Option Combined Options 10 11 12 13 14
1 Baseline
2 Ban (CSA)
3 Efficiency Standards and Emissions Limits - 1
(CSA)
4 Phase Out at Sale of House or within seven years
(CSA)
(CSA)
(CSA)
5 Fuel moisture content regulations
6 Fee on New Wood Heaters
(CSA)
(CSA)
7 Licensing Fee (CSA)
8 Excise on Fuel
9 Cash Incentives (CSA)
(CSA)
(CSA)
(CSA)
CSA – denotes application of the option to case study areas.
(1) A modified tax regime may involve applying an increasing tax rate, starting from heater efficiency of 1.5g (emission) and 65% (heating) scaling up to other levels. A strong rate hike would cause emission to reduce significantly more than the number of heaters. The average tax amount was the same as that used in the core control option i.e. $200 per heater.
The combined options include both state-wide and case study area options. This assessment simulates the application of these combined options by local governments in each case study area. A description of each control option is contained below.
8.1.1 Combined option 10
Option 10 combines the core options 2 (ban), 4 (phase out) and 9 (cash incentive). The ban on new sales and the phase out of wood heaters on house sales are applied to case study areas with a case study area specific cash incentive. The combined ban and phase out respectively target new sales and existing heaters to gradually reduce the stock of wood heaters in case study areas. In parallel, a cash incentive is provided to encourage the phase out of wood heaters or purchase of more efficient wood heaters as well as support low socio-economic users.

AECOM Economic Appraisal of Wood Smoke Control Measures - Final Report
29 June 2011
58
8.1.2 Combined option 11
Option 11 combines options 3 (efficiency standards), 4 (phase out) and 6 (fee on new wood heaters) with a case study area specific cash incentive. In contrast to Option 10, this option does not apply an outright ban on new sales, but instead utilises efficiency standards and limits for new wood heaters to target sales in case study areas. A fee on new wood heaters is also applied which acts as a source of revenue through which the cash incentive phase out can be funded.
8.1.3 Combined option 12
Option 12 targets new wood heater sales in case study areas through a sales tax with a targeted cash incentive program to reduce existing stock. Revenue raised through the sales tax can be used as a source of funding for the cash incentive program.
8.1.4 Combined option 13
Option 13 does not explicitly target new wood heater sales, but rather applies an annual licensing fee combined with a phase out of existing heaters in case study areas and cash incentives. The annual licensing fee provides an ongoing source of funds for the cash incentive program to encourage home owners to install more efficient heaters or potentially switch to alternative heating sources.
8.1.5 Combined option 14
In contrast to the other options, option 14 targets fuel use rather than wood heaters. A state-wide excise on fuel sales is combined with a state-wide fuel moisture content regulation. The fuel sales excise is designed to encourage people to reduce fuel use while the moisture content regulation encourages the consumption of fuel with relatively higher energy content.
8.2 Case study area selection The selection of case study areas aims to achieve the maximum policy outcome (reduction of emission) while reducing the scope of required regulatory or planning intervention and enhancing the ability of government to manage the impact of the policies on the affected stakeholders.
Case study areas were selected based on a combination of factors:
- Wood heater ownership – areas with relatively higher ownership rates are considered to be a higher priority than other areas due to the ability for the targeted policy to have a significant impact on ownership and emissions.
- Population density – the overall health cost of emissions from wood heaters is dependent on the population density of the area. High density areas such as in capital cities will have relatively larger health costs per tonne of emissions due to higher population exposure.
- Population and dwelling growth – future health costs are related to population growth through increased exposure to emissions, and dwelling growth through increased number of emission sources.
- New release areas – policy measures to reduce the sale or installation of new heaters can be targeted towards new housing developments in new release areas which is relatively simpler to implement than in already populated areas.
- Availability of gas – discouraging the use or purchase of wood heaters is of particular importance for areas without gas reticulation as usage tends to be high since the ability for wood heater owners to use gas as an alternative heating source is not possible.
- Climate – colder areas beyond the metropolitan area tend to have higher wood heater ownership. Combined with the reduced availability of gas reticulation further away from metropolitan areas, these colder areas may be of high priority.
- Socio-economic status – as wood heating is a relatively affordable form of space heating, areas with a higher prevalence of low-income households may be unable to afford more expensive forms of heating. For these areas, the decision to implement a cash incentive program will be of particular importance.
Based on consideration of the above factors, the following areas were selected:

AECOM Economic Appraisal of Wood Smoke Control Measures - Final Report
29 June 2011
59
a) Balmain to Strathfield
b) Liverpool
c) Blacktown to Penrith
d) Blue Mountains
e) South Eastern statistical region
f) Illawarra statistical region.
The above six areas represent approximately 34.6 percent and 41.3 percent of NSW in terms of number of wood heater ownership and estimated wood smoke health impacts respectively.
Table 31 Case study area selection
Case study area
Ownership ratio
Number of heaters
Number of dwellings
Population density (persons per sq/km)
New release area
Climate Gas availability
% of owners in low income groups
Balmain to Strathfield 4% 4,877 124,621 4,468 No Mild Yes Low
Liverpool 7% 5,408 80,438 854 Yes Mild Yes High
Blacktown to Penrith 7% 10,999 158,134 216 No Mild Yes Medium
Blue Mountains 28% 7,188 26,042 34 No Cool Yes High
South Eastern statistical region
9% 32,786 363,616 4 No Cold No High
Illawarra statistical region
14% 34,756 257,395 53 Yes Cool Yes High
Climate defined as (mild, cool, cold)
The right most column of the above table shows that a high proportion of wood heater owners are in low income groups in four of the six selected case study areas. This suggests that if these areas are targeted for implementation of control policies, there would be a strong need to have accompanying social policies to mitigate their impacts on the socially and economically disadvantaged groups.
8.3 Stock and emissions projections The stock model developed to forecast the wood heater stock and emissions for the core control options was used to model the impact of each combined option. The combined options target the case study areas identified in Section 8.2.
The stock and emissions projections for all of the case study areas are contained in Appendix C. The projections for each case study are pro-rata based on the proportion of wood heaters in NSW that are located in each case study area. This process for attributing wood heater stock and emissions to each case study based on ownership can then be applied to each of the costs and benefits.

AECOM Economic Appraisal of Wood Smoke Control Measures - Final Report
29 June 2011
60
Figure 22 Combined options stock projections
The emissions projections for the combined options are shown in Figure 23.
Figure 23 Combined options emissions projections
0
50,000
100,000
150,000
200,000
250,000
300,000
350,000
400,000
2010 2011 2012 2013 2014 2015 2016 2017 2018 2019 2020 2021 2022 2023 2024 2025 2026 2027 2028 2029 2030
BAU Combined option 10 Combined option 11 Combined option 12 Combined option 13 Combined option 14
0
2,000
4,000
6,000
8,000
10,000
12,000
14,000
2010 2015 2020 2025 2030
BAU Combined option 10 Combined option 11 Combined option 12 Combined option 13 Combined option 14

AECOM Economic Appraisal of Wood Smoke Control Measures - Final Report
29 June 2011
61
8.3.1 Combined option 10
Option 10 2010 2015 2020 2025 2030
Stock Stock Installed Pre-2010 128,749 89,861 55,443 32,052 12,268
Stock Installed Post-2010 0 8,255 9,182 8,702 7,373 Total Stock 128,749 98,116 64,624 40,754 19,641 Change from 2010 -24% -50% -68% -85%
Emission PM10 (tonnes/year) Emission from Stock Pre-2010 3,988 2,539 1,566 905 345 Emission from Stock Post-
2010 0 234 260 247 209
Total Stock 3,988 2,773 1,827 1,151 554 Change from 2010 -30% -54% -71% -86%
8.3.2 Combined option 11
Option 11 2010 2015 2020 2025 2030
Stock Stock Installed Pre-2010 128,749 89,861 55,443 32,052 12,268 Stock Installed Post-2010 0 14,784 21,796 22,913 20,674 Total Stock 128,749 104,645 77,239 54,965 32,942 Change from 2010 -19% -40% -57% -74%
Emission PM10 (tonnes/year) Emission from Stock Pre-2010 3,988 2,451 1,512 874 333 Emission from Stock Post-
2010 0 406 594 624 562 Total Stock 3,988 2,858 2,107 1,497 895 Change from 2010 -28% -47% -62% -78%
8.3.3 Combined option 12
Option 12 2010 2015 2020 2025 2030
Stock Stock Installed Pre-2010 128,749 103,167 74,335 48,066 19,586 Stock Installed Post-2010 0 16,256 30,530 42,750 52,344 Total Stock 128,749 119,422 104,865 90,816 71,930 Change from 2010 -7% -19% -29% -44%
Emission PM10 (tonnes/year) Emission from Stock Pre-2010 3,988 2,915 2,100 1,357 550 Emission from Stock Post-
2010 0 460 865 1,211 1,484 Total Stock 3,988 3,375 2,965 2,568 2,034 Change from 2010 -15% -26% -36% -49%

AECOM Economic Appraisal of Wood Smoke Control Measures - Final Report
29 June 2011
62
8.3.4 Combined option 13
Option 13 2010 2015 2020 2025 2030
Stock Stock Installed Pre-2010 128,749 87,641 51,510 27,984 10,046
Stock Installed Post-2010 0 14,142 18,807 18,792 16,466 Total Stock 128,749 101,783 70,317 46,776 26,512 Change from 2010 -21% -45% -64% -79%
Emission PM10 (tonnes/year) Emission from Stock Pre-2010 3,988 2,477 1,455 790 282 Emission from Stock Post-
2010 0 400 533 532 467
Total Stock 3,988 2,877 1,988 1,322 749 Change from 2010 -28% -50% -67% -81%
8.3.5 Combined option 14
Option 14 2010 2015 2020 2025 2030
Stock Stock Installed Pre-2010 128,749 111,850 89,157 60,027 24,460 Stock Installed Post-2010 0 17,676 35,909 53,647 69,145 Total Stock 128,749 129,526 125,066 113,674 93,605 Change from 2010 1% -3% -12% -27%
Emission PM10 (tonnes/year) Emission from Stock Pre-2010 3,988 2,969 2,366 1,592 645 Emission from Stock Post-
2010 0 483 970 1,443 1,856 Total Stock 3,988 3,452 3,336 3,035 2,502 Change from 2010 -13% -16% -24% -37%
8.4 Administration and enforcement costs As discussed above, administration and enforcement costs include implementation cost, administrative cost and public and consumer education cost. Costs for the combined options are shown in Table 32. Table 32: Administration and enforcement costs for combined options
Control Option Cost NPV ($M)
Combined Option 10 -3.1
Combined Option 11 -4.3
Combined Option 12 -2.4
Combined Option 13 -3.3
Combined Option 14 -3.4

AECOM Economic Appraisal of Wood Smoke Control Measures - Final Report
29 June 2011
63
8.5 Cost to industry Cost to industry includes loss of profitability and business administration cost. The latter cost was not significant. Estimates of lost sales and profitability were shown for the combined control options in Table 33. Table 33: Impact on industry profitability per annum
Control Option Loss of profitability NPV ($M)
Combined Option 10 -$12.2
Combined Option 11 -$2.7
Combined Option 12 -$1.7
Combined Option 13 -$2.8
Combined Option 14 -$0.3
8.6 Loss of consumer surplus An estimation of the loss of consumer surplus attributable to each combined option was undertaken using the same process as the core option assessment. The results of this assessment are presented in Table 34. Table 34 Loss of consumer surplus for combined options
Options Impact on Consumer Surplus NPV ($M)
Combined Option 10 -$45.9
Combined Option 11 -$16.3
Combined Option 12 -$8.6
Combined Option 13 -$14.2
Combined Option 14 $12.1
8.7 Government tax revenue Tax revenues to government are considered as transfer payments as government taxes are used to fund other services in the community. Estimates for government revenue under each combined option are shown in Table 35 however the transfer payments are not included as a benefit or cost. Table 35 Government revenue from combined options
Option NPV ($M)
Combined Option 10 $0
Combined Option 11 $1
Combined Option 12 $2
Combined Option 13 $4
Combined Option 14 $14

AECOM Economic Appraisal of Wood Smoke Control Measures - Final Report
29 June 2011
64
8.8 Health benefits The health benefits associated with each combined option have been assessed using the estimates for the health benefits of the core options. The weighted average health costs per tonne of emission for the case study areas are higher than the weighted costs of PM10, PM2.5 and VOC across NSW (population density, climate zone etc) as the case study areas have greater ownership and usage of wood heaters than other areas with the same population density.
The following formula was used calculating the weighted average health cost for a group of case study areas.
g) health costs for all urban areas were assigned the capital city health cost per tonne (i.e. Sydney) of $235,260 for PM10
h) health costs for all other areas (regional centres and rural areas) were calculated using population density as an adjustment factor i.e. health cost i = health cost Sydney * (density for area i) / (Sydney density). These estimates are only indicative as a better evidence based scientific method for estimation is not available at this stage.
i) health cost for case study areas were calculated as: [ (number of heaters in case study area i) * (health cost for case study area i) ] / number of heaters in all case study areas.
The weighting of the health costs associated with VOC was undertaken using the same process. The weighted costs are shown in Table 36. Table 36 Weighed health costs for case study areas
Air Pollution $/tonne 1
PM10 $74,497
VOC $2,796
Source: DITRDLG, 2010, US EPA 2010 – weighted by AECOM
1) Estimates are only indicative given the method used for deriving health costs by area discussed above.
These health costs were applied to the case study areas and the total health costs and avoided health costs (as benefits are shown in Table 37. Table 37 Health benefits of combined options (NPV $M)
Absolute health costs (NPV $M) Avoided (NPV $M)
Option PM10 VOC Total Health Cost PM10 VOC Avoided
Health Costs BAU -$3,264 -$72 -$3,336
Combined Option 10 -$1,641 -$36 -$1,677 $1,623 $36 $1,659
Combined Option 11 -$1,798 -$40 -$1,838 $1,465 $32 $1,498
Combined Option 12 -$2,373 -$53 -$2,425 $891 $20 $911
Combined Option 13 -$1,743 -$39 -$1,781 $1,521 $34 $1,555
Combined Option 14 -$2,576 -$57 -$2,634 $687 $15 $703
Note: The absolute health costs refer to the amount of health costs incurred in the case study areas as a result of the composition of the wood smoke. The total health costs are the NPV of the health costs for BAU and each option. The avoided health costs are the benefits of the each option and are the difference between the total health costs of each option and the health costs under BAU. The formula for the calculation of avoided health costs is shown below.
( ) ( )
Combined options 10, 11 and 13 generate significant avoided health costs while the remaining options have less avoided health costs.

AECOM Economic Appraisal of Wood Smoke Control Measures - Final Report
29 June 2011
65
8.9 Summary results for combined options The summary of the non-health costs, total benefits and net benefit of each combined option is contained in Table 38. Table 38 Summary of combined options cost benefit analysis (NPV $M)
Control Options Total Costs1 Health Benefit over BAU2 Net Benefit3 Combined option 10 -$61 $1,659 $1,598
Combined option 11 -$23 $1,498 $1,475
Combined option 12 -$13 $911 $898
Combined option 13 -$20 $1,555 $1,535
Combined option 14 $8 $703 $711
1. Total costs are the costs associated with each option excluding the health costs identified in the health assessment
2. The benefits are the reductions in health costs that result from each control option.
3. Net benefit of each option (excluding BAU) is the health benefits over BAU minus the total costs.
The CBA results for the combined options are shown in Figure 24. Figure 24 Cost benefit analysis of combined options chart
The graph of the combined options shows the differences in net benefit between the combined options. The results of the cost benefit analysis provide a set of considerations:
- The inclusion of a mandated phase out at time of sale generates significant reductions and is common across the three most effective combined options (Combined option 10, 11 and 13).
- The introduction of a ban in the case study area is a significant source of emissions reduction.
- The introduction of fuel moisture content regulations and fuel taxes in case study areas generate relatively less emissions reductions.
- Combined options can be used to maximise health benefits will minimising the cost to consumers, industry and government.
The estimated impacts on the wood heater industry and wood heater consumers presented above provide an indication on the need to give consideration to industry adjustment. Similarly, the spatial analysis of the impacts
-$200
$0
$200
$400
$600
$800
$1,000
$1,200
$1,400
$1,600
$1,800
Combined option 10 Combined option 11 Combined option 12 Combined option 13 Combined option 14
NPV
(203
0)
Health Benefits over BAU Total Cost Net Benefit

AECOM Economic Appraisal of Wood Smoke Control Measures - Final Report
29 June 2011
66
can guide the formulation of social assistance measures that would minimise any identified inequitable distributional impacts, specifically on lower income groups i.e. similar to what is being contemplated for the national implementation of a carbon tax.
A key consideration is that the benefits of reducing wood smoke in particular areas are heavily dependent on the population density of that area. The analysis conducted above uses whole-of-LGA population density which is suitable for urban centres where the density is fairly uniform. The whole-of-LGA population densities for regional/rural areas may be significantly lower than the actual densities in the settlements of the LGA. Therefore, health benefits associated with control options will be understated for these LGAs as the benefits and reductions will occur in the higher than average density areas of the regional and rural LGAs.
AECOM Economic Appraisal of Wood Smoke Control Measures - Final Report
29 June 2011
67
9.0 Conclusion The foregoing economic analysis has confirmed that wood smoke control policies are worth pursuing on the basis of their net benefit. This is because most of the options considered can:
- produce substantial health benefit over the years, valued at billions of dollars;
- require relatively modest costs for implementation; and
- impacts on a small number of stakeholders that may be managed through natural economic adjustment process and/or specific targeted assistance policies.
With respect to the last item, the main affected groups are the home heating industry and wood heater consumers. For the former group of which Australian manufacturers make up approximately 70 percent, they would require time (such as staging of policy implementation) and perhaps assistance to adjust to the shrinkage of the industry, say, by shifting resources to other comparable businesses. For consumer groups, they would need to switch to alternative forms of space heating, which result in higher heating costs, particularly for those in areas without access to gas reticulation. Control policies may need to be supplemented with the provision of financial assistance to low income groups to protect low socio-economic groups.
The preceding sections of the report have provided both a quantitative and qualitative assessment for a range of options to assist with the selection of a preferred policy approach:
- The use of a combination of control policies demonstrated that some policies are naturally complementary with one another. For example, a combination of a tax measure and a cash incentive program applied in case study areas provide both push and pull effects on heater sales and ownership as well as the financial source for funding cash incentives and social assistance.
- The selection of case study areas helps to target areas where the problems of wood smoke are most serious but policies can be implemented with manageable impacts and higher levels of public acceptance (e.g new release areas).
In summary, while the report has not made recommendations for specific control options, it has provided an analytical tool for policy makers to develop and evaluate suitable wood smoke control options. The final selection of the preferred policies would need to reflect the policy objectives and air pollution reduction targets. AECOM believes that the study has established clear evidence on the (substantial) net benefit of wood smoke control. This information forms a strong basis for seeking in-principle approval from decision makers. Similarly, it will support more effective consultation with industry and the community so that a balanced set of policies can be developed to significantly reduce the long term effects of wood smoke on public health.
It should noted that the case study analysis understates the potential health benefits of wood smoke reduction in regional and rural areas as it uses a whole-of-LGA population density. Actual health benefits may higher where the reductions occur in the higher density settlements of the LGA.
Apart from the cash incentive program, implementation of most of the above control policies will require changes to the current regulatory framework. For example:
- Amendment of existing regulations is required to set tighter heater standards unless the corresponding national review results in national standards similar to those discussed above (Options 3 and 11).
- Local councils have used planning powers to impose a ban on heater installation in their respective areas. However, for control policies that apply such ban on a broader area comprising several regions, they would either need to be implemented through strategic policy co-ordination and cooperation of all relevant local governments; or put into effect by Government through a regulation under the POEO Act or planning laws.
- For wood smoke control options that require payment of a tax or levy, it is envisaged that a regulatory approach similar to that used for setting the waste and environment levy under the POEO Act, would be necessary, including requiring purchasers to pay a contribution; determining the levy; defining where the levy applies i.e. 'regulated area' of NSW.
An optimum timeframe must achieve the right balance between implementing wood smoke policies as early as possible to avoid further health costs to the community and allowing adequate time for affected parties to adjust. It appears that the most suitable approach would be to implement the selected policies in a staged process with early commencement (say 2012) but extend their full application or coverage over several years e.g. increase number of case study areas from 1 to 6; raising efficiency standards progressively.

AECOM Economic Appraisal of Wood Smoke Control Measures - Final Report
29 June 2011
68
References ABS, 2001, Australian National Accounts: Input-Output Tables - Electronic Publication, 2001-02, Australian Bureau of Statistics, Canberra
ABS, 2010, Environmental Issues: Energy Use and Conservation 2008, Australian Bureau of Statistics
ABS, 2007, 2006 Census Tables: NSW Major Cities of Australia (Remoteness Area), Australian Bureau of Statistics
ACMA, 2009, Consumer benefits resulting from Australia’s telecommunications sector: Methodology, Australian Communications and Media Authority
Argy, S. and Johnson, M. 2003, Mechanisms for improving the quality of regulations: Australia in an international context, Staff Working Paper, Productivity Commission, Canberra.
BDA and MMA, 2006, Research on impacts of a range of policy options for controlling emissions from solid fuel heaters in new release areas of NW and SW Sydney, prepared for the Department of Environment and Conservation (NSW), June 2006
BDA, 2006, Wood Heater Particle Emissions and Operating Efficiency Standards: Cost Benefit Analysis, Prepared for the NSW Department of the Environment and Heritage, BDA Group
Beer T, 2002, Valuation of pollutants emitted by road transport into the Australian atmosphere, Proceedings of the 16th International Clean Air & Environment Conf, Christchurch, New Zealand.
Bell, M, 1996, How Often Do Australians Move?, Journal of Australian Population Association, (1996),13 (2): 1010-124
BTRE, 2005, Health impacts of transport emissions in Australia: Economic costs, BTRE Working Paper 63, Australian Government, Department of Transport and Regional Services
Coffey, 2003, Fuel Quality and Vehicle Emissions Standards Cost Benefit Analysis, Prepared for the MVEC Review of Vehicle Emissions and Fuel Standards Post 2006, Coffey Geosciences Pty Ltd,
CSIRO, 2005, Wood heaters in Launceston – Impacts on Air Quality, Prepared by the Australian Department of the Environment and Heritage by the Commonwealth Scientific and industrial Research Organisation, Atmospheric Research, September
Damodaran, A, 2011, Margins by Sectors using Value Line Database
Dale, L., Fujita, K., 2008, An Analysis of the Price Elasticity of Demand for Household Appliances, Lawrence Berkeley National Laboratory, University of California Berkley
DCCEE, 2010, National Greenhouse Accounts, Department of Climate Change, Energy Efficiency and Water, Australian Government
DECC, 2004, Air Emissions Inventory for the Greater Metropolitan Region in NSW Technical Report 5, Domestic-Commercial Emissions Module: Results, Department of Environment and Climate Change (NSW), http://www.environment.nsw.gov.au/resources/air/tr5aei079.pdf
DECCW, 2010, Department of Environment, Climate Change and Water – Annual Report 2009-2010, NSW Government
DECCW, 2010, ‘Regulatory Impact Statement: Proposed Protection of the Environment Operations (Clean Air) Regulation 2010’, Department of Environment, Climate Change and Water, NSW Government.
DEH, 2003, Life Cycle Emissions Assessment of Greenhouse Gas Emissions from Domestic Wood Heating: Greenhouse Gas Emissions from Firewood Production Systems, Bush for Greenhouse, Department of Environment and Heritage (Cth.), Australian Greenhouse Office
DEH, 2004, Health Impacts of Ultrafine Particles: Desktop Literature Review and Analysis, Department of Environment and Heritage, Australian Government http://www.environment.gov.au/atmosphere/airquality/publications/health-impacts/index.html
DEWHA, 2009, Industry Survey of Wood Heaters and Other Solid Fuel Heaters, Walter Turnbull on behalf of the Australian Department of Environment, Water, Heritage and the Arts

AECOM Economic Appraisal of Wood Smoke Control Measures - Final Report
29 June 2011
69
DITRDLG, 2009, Draft Regulation Impact Statement for Review of Euro 5/6 Light Vehicle Emissions Standards, Department of Infrastructure, Transport Regional Development and Local Government, http://www.infrastructure.gov.au/roads/environment/files/FINAL_Draft_RIS_E5_E6_Light_Vehicles_Emissions_Review_20100104.pdf
DP, 2011, Sydney’s Growth Centres, Department of Planning, New South Wales Government
EA, 2002, Review of literature on residential firewood use, wood smoke and air toxics, Environment Australia, Technical Report 4, June 2002, http://www.environment.gov.au/atmosphere/airquality/publications/report4/index.html
EA, 2002, 'Emissions from solid-fuel-burning appliances (wood-heaters, open fireplaces)', Canberra, Australia. Consultancy by CSIRO Atmospheric Research
EECABusiness, 2011, Biomass calorific value calculator, New Zealand Government, http://www.eecabusiness.govt.nz/wood-energy-resources/biomass-calorific
Geoscience Australia, 2010, Oil and Gas pipelines of Australia
Künzli N, Kaiser R, Medina S, Studnicka M, Chanel O, Filliger P, Herry M, Horak F Jr, Puybonnieux-Texier V, Quenel P, Schneider J, Seethaler R, Vergnaud JC, Sommer H 2000, ‘Public health impact of outdoor and traffic- related air pollution: a European assessment’, The Lancet, vol. 356, pp. 795–801.
NSW Treasury, 2007, Economic Appraisal: Principles and Procedures Simplified, Office of Financial Management Policy & Guidelines Paper, New South Wales Treasury
Pope CA., 2000, Epidemiology of fine particulate air pollution and human health: biologic mechanisms and who's at risk? Environ Health Perspective 108(4):713-723.
Sustainability Victoria, 2002, Choosing a Heating System, Sustainable Energy Authority Victoria, Victorian Government
Todd, 2003, Research relating to regulatory measures for improving the operation of solid fuel heaters, Report prepared for the NSW EPA, November
Todd, 2006, Cost benefit analysis of wood smoke reduction in Perth, prepared for the Department of Environment and Conservation (WA)
TR, 2009, Domestic Pollution Survey, Project Reference: 3388, Taverner Research (TR), Level 2, 88 Foveaux St, Surry Hills, NSW, 2010, Australia”
US DOE, 2011, Air-source heat pumps, United States Department of Energy, http://www.energysavers.gov/your_home/space_heating_cooling/index.cfm/mytopic=12620
US EPA, 1996, AP 42, Fifth Edition, Volume I Chapter 1: External Combustion Sources, 1.10 Residential Wood Stoves, Technology Transfer Network, Clearinghouse for Inventories & Emission Factors, United States Environment Protection Agency (USEPA), Research Triangle Park, NC, USA. http://www.epa.gov/ttn/chief/ap42/ch01/final/c01s10.pdf
US EPA, 2009, Strategies for Reducing Residential Wood Smoke, U.S. Environmental Protection Agency, North Carolina.
US EPA, 2010, Air Pollutants and New Source Performance Standards (NSPS) for the Portland Cement Manufacturing Industry, U.S. Environmental Protection Agency, Office of Air Quality Planning and Standards (OAQPS), http://www.epa.gov/ttnecas1/regdata/RIAs/portlandcementfinalria.pdf
US EPA, 2011, Integrated Risk Information System (IRIS), U.S Environment Protection Agency, http://www.epa.gov/IRIS
AECOM Economic Appraisal of Wood Smoke Control Measures - Final Report
29 June 2011
Appendix A
Checklist for Assessing Regulatory Quality
AECOM Economic Appraisal of Wood Smoke Control Measures - Final Report
29 June 2011
A-1
Appendix A Checklist for Assessing Regulatory Quality
Regulations that conform to best-practice design standards are characterised by the following seven principles and features:
Minimum necessary to achieve objectives
- Overall benefits to the community justify costs - Kept simple to avoid unnecessary restrictions - Targeted at the problem to achieve the objectives - Not imposing an unnecessary burden on those affected - Does not restrict competition, unless demonstrated net benefit Not unduly prescriptive
- Performance and outcomes focused - General rather than overly specific Accessible, transparent and accountable
- Readily available to the public - Easy to understand - Fairly and consistently enforced - Flexible enough to deal with special circumstances - Open to appeal and review Integrated and consistent with other laws
- Addresses a problem not addressed by other regulations - Recognises existing regulations and international obligations Communicated effectively
- Written in ‘plain language’ - Clear and concise Mindful of the compliance burden imposed
- Proportionate to the problem - Set at a level that avoids unnecessary costs Enforceable
- Provides the minimum incentives needed for reasonable compliance - Able to be monitored and policed effectively
Source: Argy and Johnson (2003).

AECOM Economic Appraisal of Wood Smoke Control Measures - Final Report
29 June 2011
Appendix B
Stock and emission projections (2010-2040) under BAU

AECOM Economic Appraisal of Wood Smoke Control Measures - Final Report
29 June 2011
B-1
Appendix B Stock and emission projections (2010-2040) under BAU Table 39 Projections of woodheater sales and stocks for 2010-2040 in the BAU
Table 40 Woodheater retirement pattern (survival rates by age shown)
Year 1 2 3 4 5 6 7 8 9 10 New Sales 100% 100% 100% 100% 100% 100% 100% 100% 100% 100% Stock pre-2010 97% 95% 93% 90% 87% 84% 80% 77% 73% 69%
Year 11 12 13 14 15 16 17 18 19 20 New Sales 97% 95% 93% 90% 87% 84% 80% 77% 73% 69% Stock pre-2010 65% 61% 56% 52% 47% 41% 36% 31% 25% 19%
Year 21 22 23 24 25 26 27 28 29 30 New Sales 65% 61% 56% 52% 47% 41% 36% 31% 25% 19% Stock pre-2010 13% 7% 0% 0% 0% 0% 0% 0% 0% 0%
Notes 2010 2011 2012 2013 2014 2015 2020 2025 2030 2035 2040
Heating eff Emission eff Emission Fuel use2010 9,600 100% 100% 100.0% 100.0% 372,203 362,432 353,778 344,380 334,237 323,349 257,747 173,535 70,712 0 02011 9,894 100% 100% 100.0% 100.0% 0 9,894 9,894 9,894 9,894 9,894 9,894 8,885 7,240 5,100 2,4662012 10,197 100% 100% 100.0% 100.0% 0 0 10,197 10,197 10,197 10,197 10,197 9,434 7,841 5,738 3,1252013 10,509 100.0% 100.0% 100.0% 100.0% 0 0 0 10,509 10,509 10,509 10,509 9,988 8,451 6,389 3,8012014 10,830 100.0% 100.0% 100.0% 100.0% 0 0 0 0 10,830 10,830 10,830 10,546 9,070 7,053 4,4942015 11,161 100.0% 100.0% 100.0% 100.0% 0 0 0 0 0 11,161 11,161 11,161 9,696 7,729 5,2042016 11,503 100.0% 100.0% 100.0% 100.0% 0 0 0 0 0 0 11,503 11,503 10,330 8,417 5,9302017 11,855 100.0% 100.0% 100.0% 100.0% 0 0 0 0 0 0 11,855 11,855 10,969 9,116 6,6712018 12,218 100.0% 100.0% 100.0% 100.0% 0 0 0 0 0 0 12,218 12,218 11,613 9,826 7,4282019 12,592 100.0% 100.0% 100.0% 100.0% 0 0 0 0 0 0 12,592 12,592 12,261 10,545 8,2002020 12,977 100.0% 100.0% 100.0% 100.0% 0 0 0 0 0 0 12,977 12,977 12,977 11,274 8,9862021 13,374 100.0% 100.0% 100.0% 100.0% 0 0 0 0 0 0 0 13,374 13,374 12,010 9,7862022 13,783 100.0% 100.0% 100.0% 100.0% 0 0 0 0 0 0 0 13,783 13,783 12,753 10,5992023 14,205 100.0% 100.0% 100.0% 100.0% 0 0 0 0 0 0 0 14,205 14,205 13,502 11,4242024 14,640 100.0% 100.0% 100.0% 100.0% 0 0 0 0 0 0 0 14,640 14,640 14,255 12,2612025 15,088 100.0% 100.0% 100.0% 100.0% 0 0 0 0 0 0 0 15,088 15,088 15,088 13,1072026 15,549 100.0% 100.0% 100.0% 100.0% 0 0 0 0 0 0 0 0 15,549 15,549 13,9632027 16,025 100.0% 100.0% 100.0% 100.0% 0 0 0 0 0 0 0 0 16,025 16,025 14,8272028 16,516 100.0% 100.0% 100.0% 100.0% 0 0 0 0 0 0 0 0 16,516 16,516 15,6982029 17,021 100.0% 100.0% 100.0% 100.0% 0 0 0 0 0 0 0 0 17,021 17,021 16,5742030 17,542 100.0% 100.0% 100.0% 100.0% 0 0 0 0 0 0 0 0 17,542 17,542 17,5422031 18,079 100.0% 100.0% 100.0% 100.0% 0 0 0 0 0 0 0 0 0 18,079 18,0792032 18,632 100.0% 100.0% 100.0% 100.0% 0 0 0 0 0 0 0 0 0 18,632 18,6322033 19,202 100.0% 100.0% 100.0% 100.0% 0 0 0 0 0 0 0 0 0 19,202 19,2022034 19,789 100.0% 100.0% 100.0% 100.0% 0 0 0 0 0 0 0 0 0 19,789 19,7892035 20,395 100.0% 100.0% 100.0% 100.0% 0 0 0 0 0 0 0 0 0 20,395 20,3952036 21,019 100.0% 100.0% 100.0% 100.0% 0 0 0 0 0 0 0 0 0 0 21,0192037 21,662 100.0% 100.0% 100.0% 100.0% 0 0 0 0 0 0 0 0 0 0 21,6622038 22,325 100.0% 100.0% 100.0% 100.0% 0 0 0 0 0 0 0 0 0 0 22,3252039 23,008 100.0% 100.0% 100.0% 100.0% 0 0 0 0 0 0 0 0 0 0 23,0082040 23,712 100.0% 100.0% 100.0% 100.0% 0 0 0 0 0 0 0 0 0 0 23,712
Option 1 2010 2011 2012 2013 2014 2015 2020 2025 2030 2035 2040Stock 372,203 372,326 373,868 374,978 375,666 375,940 371,482 355,784 324,903 327,546 399,913Legacy stock 372,203 362,432 353,778 344,380 334,237 323,349 257,747 173,535 70,712 0 0New Stock 0 9,894 20,090 30,599 41,429 52,590 113,735 182,249 254,191 327,546 399,913Emiss ion PM10 (tonnes/year)
* Emission from Existing Stock 11,530 10,241 9,996 9,731 9,445 9,137 7,282 4,899 1,986 0 0 * Emission from New Stock 0 280 568 866 1,173 1,489 3,221 5,164 7,207 9,292 11,351* Total 11,530 10,521 10,565 10,597 10,617 10,626 10,503 10,063 9,193 9,292 11,351
Heater Sales 9,600 9,894 10,197 10,509 10,830 11,161 12,977 15,088 17,542 20,395 23,712Fuel use (tonnes) 1,150,306 1,049,581 1,053,998 1,057,198 1,059,207 1,060,054 1,047,862 1,003,951 917,121 926,958 1,132,379
Year of Manufact Sales
StockSales
AECOM Economic Appraisal of Wood Smoke Control Measures - Final Report
29 June 2011
Appendix C
Case Study Area Assessment

AECOM Economic Appraisal of Wood Smoke Control Measures - Final Report
29 June 2011
C-1
Appendix C Case Study Area Assessment
Balmain to Strathfield Stock Projections
Emissions Projections
0
1,000
2,000
3,000
4,000
5,000
6,000
7,000
2010 2011 2012 2013 2014 2015 2016 2017 2018 2019 2020 2021 2022 2023 2024 2025 2026 2027 2028 2029 2030
BAU Combined Option 10 Combined Option 11
Combined Option 12 Combined Option 13 Combined Option 14
0
50
100
150
200
250
2010 2011 2012 2013 2014 2015 2016 2017 2018 2019 2020 2021 2022 2023 2024 2025 2026 2027 2028 2029 2030
BAU Combined Option 10 Combined Option 11
Combined Option 12 Combined Option 13 Combined OPtion14

AECOM Economic Appraisal of Wood Smoke Control Measures - Final Report
29 June 2011
C-2
Cost Benefit Analysis (NPV $M)
Control Options Total Costs1 Health Benefit over BAU2 Net Benefit3
Combined option 10 -$3.1 $266.1 $263.0
Combined option 11 -$1.2 $240.3 $239.1
Combined option 12 -$0.6 $146.1 $145.4
Combined option 13 -$1.0 $249.4 $248.4
Combined option 14 $0.4 $112.7 $113.1
1. Total costs are the costs associated with each option excluding the health costs identified in the health assessment
2. The benefits are the reductions in health costs that result from each control option.
3. Net benefit of each option (excluding BAU) is the health benefits over BAU minus the total costs.
Liverpool Stock Projections
0
1,000
2,000
3,000
4,000
5,000
6,000
7,000
8,000
2010 2011 2012 2013 2014 2015 2016 2017 2018 2019 2020 2021 2022 2023 2024 2025 2026 2027 2028 2029 2030
No.
of w
ood
heat
ers
BAU Combined Option 10 Combined Option 11
Combined Option 12 Combined Option 13 Combined Option 14

AECOM Economic Appraisal of Wood Smoke Control Measures - Final Report
29 June 2011
C-3
Emissions Projections
Cost Benefit Analysis (NPV $M)
Control Options Total Costs Health Benefit over BAU Net Benefit
Combined option 10 -$3.4 $295 $291.6
Combined option 11 -$1.3 $266 $265.1
Combined option 12 -$0.7 $162 $161.3
Combined option 13 -$1.2 $277 $275.4
Combined option 14 $0.5 $125 $125.4
0
50
100
150
200
250
2010 2011 2012 2013 2014 2015 2016 2017 2018 2019 2020 2021 2022 2023 2024 2025 2026 2027 2028 2029 2030
BAU Combined Option 10 Combined Option 11
Combined Option 12 Combined Option 13 Combined Option 14

AECOM Economic Appraisal of Wood Smoke Control Measures - Final Report
29 June 2011
C-4
Blacktown to Penrith Stock Projections
0
2,000
4,000
6,000
8,000
10,000
12,000
14,000
16,000
2010 2011 2012 2013 2014 2015 2016 2017 2018 2019 2020 2021 2022 2023 2024 2025 2026 2027 2028 2029 2030
BAU Combined Option 10 Combined Option 11
Combined Option 12 Combined Option 13 Combined Option 14
0
2,000
4,000
6,000
8,000
10,000
12,000
14,000
16,000
2010 2011 2012 2013 2014 2015 2016 2017 2018 2019 2020 2021 2022 2023 2024 2025 2026 2027 2028 2029 2030
BAU Combined Option 10 Combined Option 11
Combined Option 12 Combined Option 13 Combined Option 14
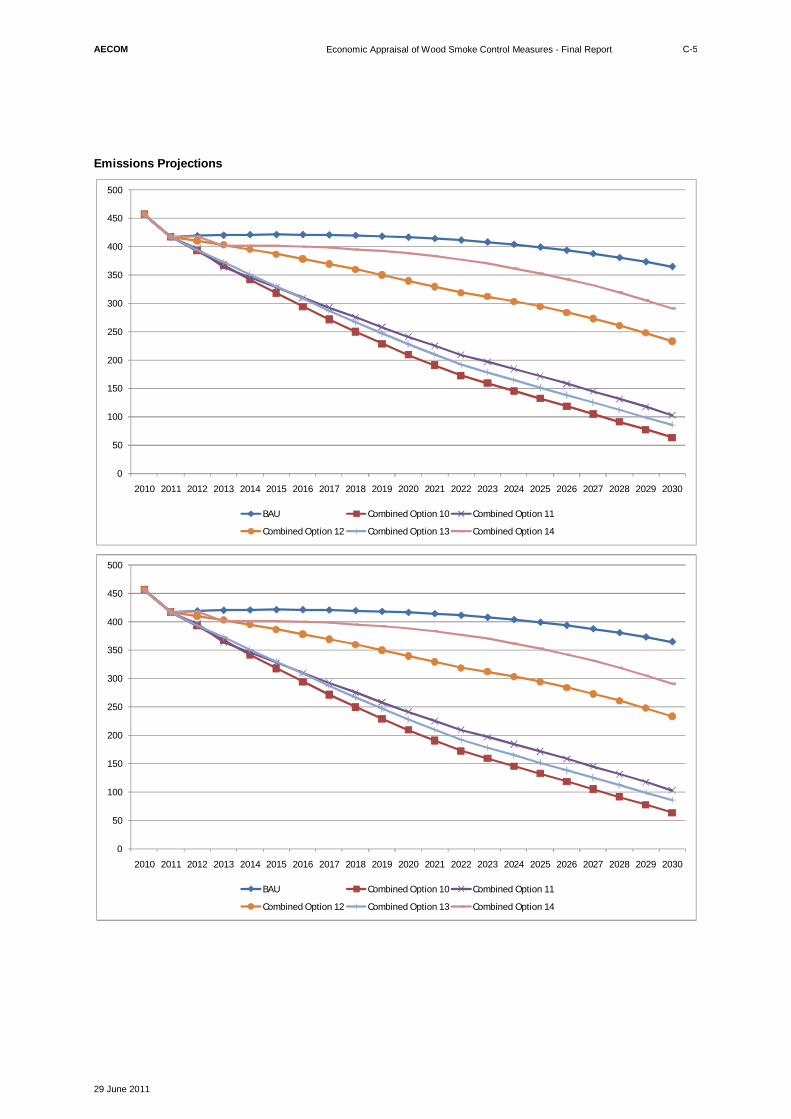
AECOM Economic Appraisal of Wood Smoke Control Measures - Final Report
29 June 2011
C-5
Emissions Projections
0
50
100
150
200
250
300
350
400
450
500
2010 2011 2012 2013 2014 2015 2016 2017 2018 2019 2020 2021 2022 2023 2024 2025 2026 2027 2028 2029 2030
BAU Combined Option 10 Combined Option 11
Combined Option 12 Combined Option 13 Combined Option 14
0
50
100
150
200
250
300
350
400
450
500
2010 2011 2012 2013 2014 2015 2016 2017 2018 2019 2020 2021 2022 2023 2024 2025 2026 2027 2028 2029 2030
BAU Combined Option 10 Combined Option 11
Combined Option 12 Combined Option 13 Combined Option 14

AECOM Economic Appraisal of Wood Smoke Control Measures - Final Report
29 June 2011
C-6
Cost Benefit Analysis (NPV $M)
Control Options Total Costs Health Benefit over BAU Net Benefit
Combined option 10 -$7.0 $600 $593.1
Combined option 11 -$2.7 $542 $539.3
Combined option 12 -$1.5 $329 $328.0
Combined option 13 -$2.3 $562 $560.1
Combined option 14 $1.0 $254 $255.2
Blue Mountains Stock Projections
0
2,000
4,000
6,000
8,000
10,000
12,000
2010 2011 2012 2013 2014 2015 2016 2017 2018 2019 2020 2021 2022 2023 2024 2025 2026 2027 2028 2029 2030
BAU Combined Option 10 Combined Option 11
Combined Option 12 Combined Option 13 Combined Option 14

AECOM Economic Appraisal of Wood Smoke Control Measures - Final Report
29 June 2011
C-7
Emissions Projections
0
2,000
4,000
6,000
8,000
10,000
12,000
2010 2011 2012 2013 2014 2015 2016 2017 2018 2019 2020 2021 2022 2023 2024 2025 2026 2027 2028 2029 2030
BAU Combined Option 10 Combined Option 11
Combined Option 12 Combined Option 13 Combined Option 14
0
50
100
150
200
250
300
350
2010 2011 2012 2013 2014 2015 2016 2017 2018 2019 2020 2021 2022 2023 2024 2025 2026 2027 2028 2029 2030
BAU Combined Option 10 Combined Option 11
Combined Option 12 Combined Option 13 Combined Option 14

AECOM Economic Appraisal of Wood Smoke Control Measures - Final Report
29 June 2011
C-8
Cost Benefit Analysis – (NPV $M)
Control Options Total Costs Health Benefit over BAU Net Benefit
Combined option 10 -$4.6 $6 $1.6
Combined option 11 -$1.7 $6 $3.9
Combined option 12 -$0.9 $3 $2.5
Combined option 13 -$1.5 $6 $4.3
Combined option 14 $0.6 $3 $3.3
0
50
100
150
200
250
300
350
2010 2011 2012 2013 2014 2015 2016 2017 2018 2019 2020 2021 2022 2023 2024 2025 2026 2027 2028 2029 2030
BAU Combined Option 10 Combined Option 11
Combined Option 12 Combined Option 13 Combined Option 14

AECOM Economic Appraisal of Wood Smoke Control Measures - Final Report
29 June 2011
C-9
South Eastern statistical region Stock Projections
0
5,000
10,000
15,000
20,000
25,000
30,000
35,000
40,000
45,000
50,000
2010 2011 2012 2013 2014 2015 2016 2017 2018 2019 2020 2021 2022 2023 2024 2025 2026 2027 2028 2029 2030
BAU Combined Option 10 Combined Option 11
Combined Option 12 Combined Option 13 Combined Option 14
0
5,000
10,000
15,000
20,000
25,000
30,000
35,000
40,000
45,000
50,000
2010 2011 2012 2013 2014 2015 2016 2017 2018 2019 2020 2021 2022 2023 2024 2025 2026 2027 2028 2029 2030
BAU Combined Option 10 Combined Option 11
Combined Option 12 Combined Option 13 Combined Option 14
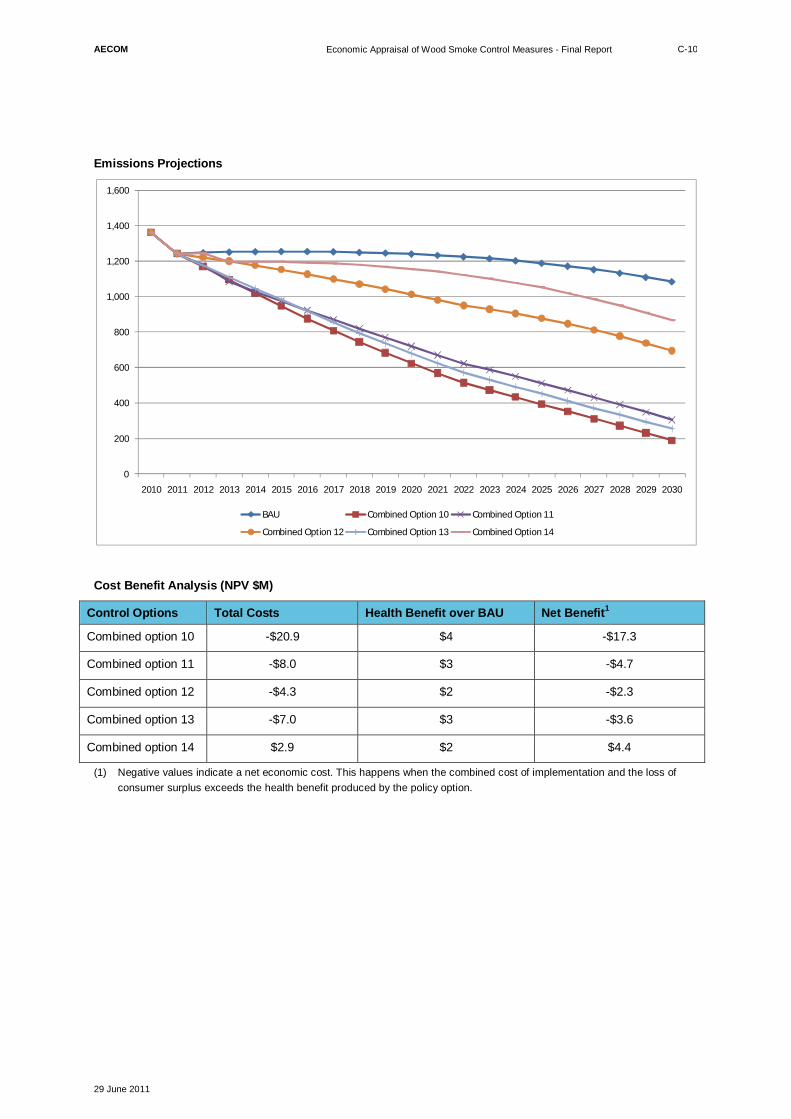
AECOM Economic Appraisal of Wood Smoke Control Measures - Final Report
29 June 2011
C-10
Emissions Projections
Cost Benefit Analysis (NPV $M)
Control Options Total Costs Health Benefit over BAU Net Benefit1
Combined option 10 -$20.9 $4 -$17.3
Combined option 11 -$8.0 $3 -$4.7
Combined option 12 -$4.3 $2 -$2.3
Combined option 13 -$7.0 $3 -$3.6
Combined option 14 $2.9 $2 $4.4
(1) Negative values indicate a net economic cost. This happens when the combined cost of implementation and the loss of consumer surplus exceeds the health benefit produced by the policy option.
0
200
400
600
800
1,000
1,200
1,400
1,600
2010 2011 2012 2013 2014 2015 2016 2017 2018 2019 2020 2021 2022 2023 2024 2025 2026 2027 2028 2029 2030
BAU Combined Option 10 Combined Option 11
Combined Option 12 Combined Option 13 Combined Option 14

AECOM Economic Appraisal of Wood Smoke Control Measures - Final Report
29 June 2011
C-11
Illawarra statistical region Stock Projections
Emissions Projections
0
5,000
10,000
15,000
20,000
25,000
30,000
35,000
40,000
45,000
50,000
2010 2011 2012 2013 2014 2015 2016 2017 2018 2019 2020 2021 2022 2023 2024 2025 2026 2027 2028 2029 2030
BAU Combined Option 10 Combined Option 11
Combined Option 12 Combined Option 13 Combined Option 14
0
200
400
600
800
1,000
1,200
1,400
1,600
2010 2011 2012 2013 2014 2015 2016 2017 2018 2019 2020 2021 2022 2023 2024 2025 2026 2027 2028 2029 2030
BAU Combined Option 10 Combined Option 11
Combined Option 12 Combined Option 13 Combined Option 14
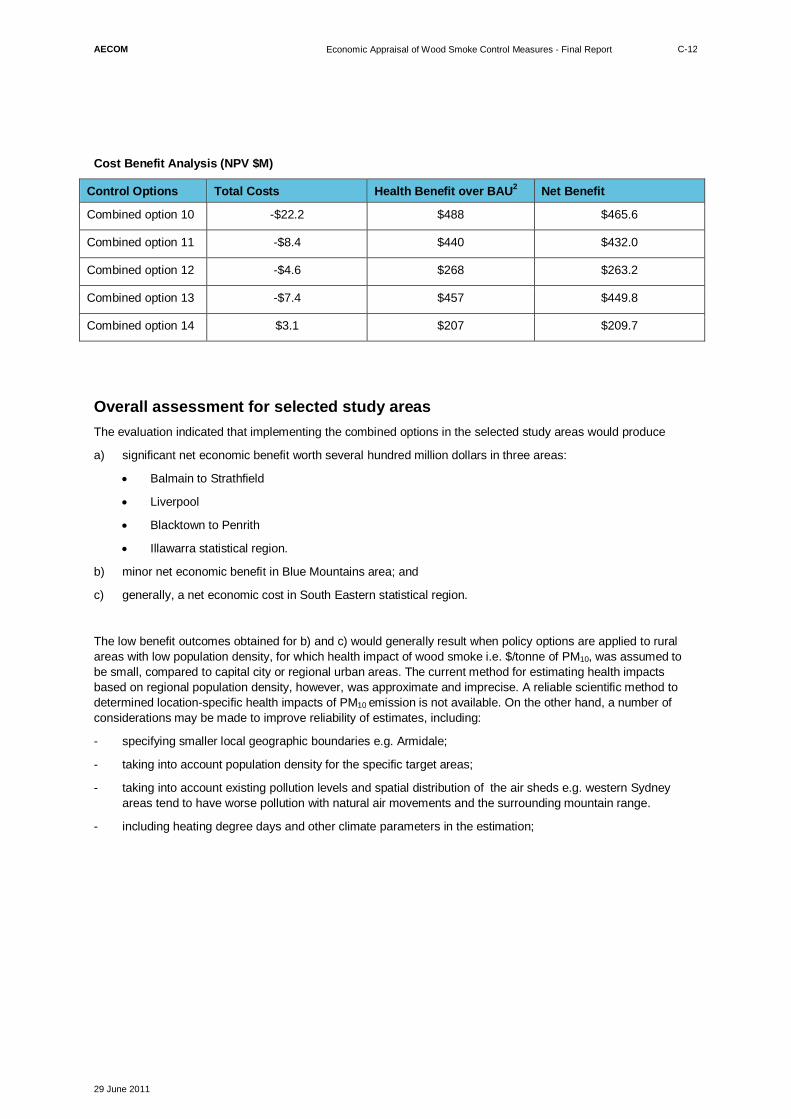
AECOM Economic Appraisal of Wood Smoke Control Measures - Final Report
29 June 2011
C-12
Cost Benefit Analysis (NPV $M)
Control Options Total Costs Health Benefit over BAU2 Net Benefit
Combined option 10 -$22.2 $488 $465.6
Combined option 11 -$8.4 $440 $432.0
Combined option 12 -$4.6 $268 $263.2
Combined option 13 -$7.4 $457 $449.8
Combined option 14 $3.1 $207 $209.7
Overall assessment for selected study areas The evaluation indicated that implementing the combined options in the selected study areas would produce
a) significant net economic benefit worth several hundred million dollars in three areas:
Balmain to Strathfield
Liverpool
Blacktown to Penrith
Illawarra statistical region.
b) minor net economic benefit in Blue Mountains area; and
c) generally, a net economic cost in South Eastern statistical region.
The low benefit outcomes obtained for b) and c) would generally result when policy options are applied to rural areas with low population density, for which health impact of wood smoke i.e. $/tonne of PM10, was assumed to be small, compared to capital city or regional urban areas. The current method for estimating health impacts based on regional population density, however, was approximate and imprecise. A reliable scientific method to determined location-specific health impacts of PM10 emission is not available. On the other hand, a number of considerations may be made to improve reliability of estimates, including:
- specifying smaller local geographic boundaries e.g. Armidale;
- taking into account population density for the specific target areas;
- taking into account existing pollution levels and spatial distribution of the air sheds e.g. western Sydney areas tend to have worse pollution with natural air movements and the surrounding mountain range.
- including heating degree days and other climate parameters in the estimation;