Economic and Political Liberalizations Francesco Giavazzi and Guido Tabellini.
28
Economic and Political Liberalizations Francesco Giavazzi and Guido Tabellini
-
Upload
randolf-clark -
Category
Documents
-
view
218 -
download
0
Transcript of Economic and Political Liberalizations Francesco Giavazzi and Guido Tabellini.

Economic and Political Liberalizations
Francesco Giavazzi and Guido Tabellini

2
Study economic and political liberalizations
Do they improve govt incentives and economic performance?Eg: what advice should IMF give to Egypt, or Pakistan
Is there an optimal sequencing? Eg: China vs Russia or India
What are the interactions?

3
Effects of economic and political liberalizations?
Two separate lines of research, on economic outcomes
1. Effects of economic liberalizations?Good for growth, investment, trade (Sachs-Werner, Wacziarg-Welch)
2. Effects of political liberalizations?Disagreement, or no effect
This paper: Interactions and feedbacks between economic and
political liberalizationsEffects on policies, not just economic outcomes
Persson (2004): effect of different types of demo on liberalizations and structural policies

4
Specific questions
• Effects of economic and political liberalizations, separately?
On economic outcomes
On other structural policies
On macro policies
• Feedback effects, and in which directions?
• Complementarities?
• Does sequencing matter?

5
Priors? • No theoretical model
• But priors and questions motivated by previous research– Economic liberalizations improve outcomes
Is it trade or other economic policy reforms?– No effect of democracy on outcomes
Is it due to opposite policy effects?democratization → less corruption, more public goodsdemocratization → more redistribution, more veto players
– Feedbacks: causality could go either way – Interactions and Sequencing: no priors
• Don’t study heterogeneity among democracies

6
Data on reformEcon. Liberalization: becoming “open”
“Closed” if: (i) average tariff > 40%; or (ii) NTB on > 40% of goods; or
(iii) socialist economy; or (iv) black mkt premium >20%; or (v) state
monopoly in exports
Wacziarg and Welch (2003), Sachs and Werner (1995)
Political liberalization: becoming “democracy” Polity2 > 0
Sample: about 150 countries in 1960-2000Some always open / closed
Others liberalize in 1960-2000

7
Data on performance
Economic Outcomes (1960-2000)
Growth, investment rate, (trade)
Governance (1982-97)
GADP, corruption
Macroeconomic policy (1960-2000, 1970-2000)Inflation (in logs), budget deficit (% GDP)

8
Difference in difference estimation (Persson 2004)
2 types of countries: “Controls” & “Treated”
Compare before/after reform in “treated”, with “controls” over
same period
(YT1 - YT
0 ) - (YC1 - YC
0 )
Exploit both cross-country & time variation
More credible identification than pure cross-country comparisons /
before-after comparison
Identifying assumption: no unobserved variable moving over
time in different ways between treated / controls
Eg.: technological progress does not affect T / C differently
Eg.: What triggers reform does not have independent influence on
performance

9
Estimationyit = ai + bt + Reformit + eit
Reform =1 in the “treated” after reform
Problems:
- Are treated / control similar?
On average, yes (controls: always open / closed)
Condition also on years*continents as regressors
- Definition of treated / controls varies with performance
- Reversals ? A few
Distinguish between temporary / permanent reforms
End of period problems: discard observations if reform at end
10
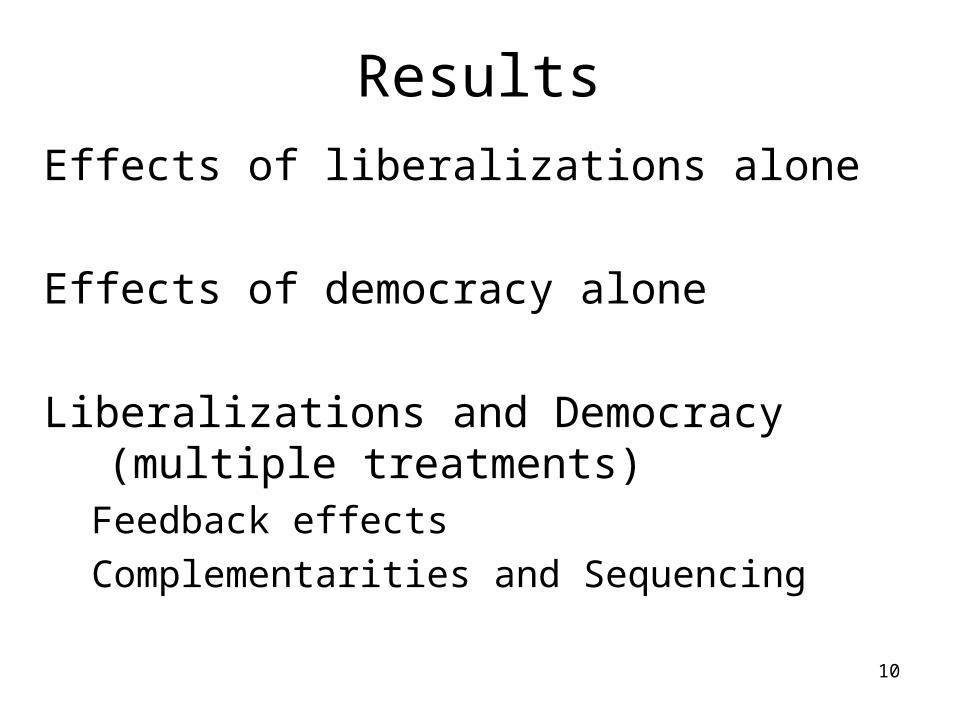
Results
Effects of liberalizations alone
Effects of democracy alone
Liberalizations and Democracy (multiple treatments)
Feedback effects
Complementarities and Sequencing

11
Liberalization increases growth and investment
Dep. Var growth Investment lib 0.99 0.85 0.36 0.39 1.12 1.21 1.62 1.62 (0.36)***
(0.39)** (0.39)** (0.34)
(0.42) (0.36) (0.36)
(0.31)*** (0.86)
(0.33)***
(0.29)*** (0.82)*
(0.30)*** (0.99)
3y_pre -0.95 -2.14
(0.49)* (0.60)
(0.42)*** (0.87)**
3y_post 0.46 -1.03
(0.46) (0.45)
(0.39)*** (1.03)
post_lib 0.94 1.76
(0.44)** (0.44)**
(0.38)*** (1.17)
treatment Perm. Perm. Perm. all all Perm. Perm. Perm. all all
Y*conts No Yes No No Yes No yes No No Yes

12
liberalization improves gadp and corruption
Dep. Var gadp Corruption lib 0.35 0.24 0.36 0.24 0.25 0.22 0.25 0.22 (0.07)***
(0.16)** (0.08)*** (0.07)***
(0.16)** (0.08)*** (0.16)
(0.06)*** (0.13)*
(0.06)*** (0.06)*** (0.13)*
(0.06)*** (0.15)
3y_pre -0.23 0.04 (0.09)***
(0.15) (0.08)
(0.14)
3y_post 0.01 0.15
(0.09) (0.22)
(0.08)* (0.18)
post_lib 0.63 0.49 (0.10)***
(0.26)** (0.21)**
(0.21)**
treatment Perm. Perm. Perm. all all Perm. Perm. Perm. all all Y*conts No Yes No No Yes No Yes No No Yes

13
Liberalization reduces inflation and deficit?
Dep. Var Inflation deficit
lib 0.16 -0.05 0.04 -0.08 -1.16 -1.07 -0.85 -0.66 (0.06)**
(0.18) (0.07) (0.06)
(0.18) (0.06) (0.18)
(0.40)*** (1.03)
(0.45)** (0.39)** (1.02)
(0.45) (1.51)
3y_pre 1.13 0.55
(0.08)*** (0.18)***
(0.50) (0.76)
3y_post 0.76 -0.66
(0.08)*** (0.17)***
(0.48) (1.07)
post_lib 0.26 -1.44
(0.08)*** (0.23)
(0.53)*** (1.27)
treatment Perm. Perm. Perm. all all Perm. Perm. Perm. all all Y*conts No Yes No No Yes No Yes No No Yes

14
No effect of democracy on growth and investment
Dep. Var growth Investment
dem 0.07 -0.00 0.36 0.39 -0.33 -0.75 0.15 0.03 (0.40)
(0.47) (0.43) (0.43)
(0.34) (0.42)
(0.36) (0.36)
(0.34) (1.04)
(0.35)** (0.35)**
(0.29) (0.83)
(0.29) (0.29)
3y_pre -0.61 -0.32
(0.61) (0.68)
(0.52) (1.00)
3y_post 0.09 -0.67
(0.55) (0.62)
(0.47) (1.07)
post_dem -0.15 -0.21
(0.48) (0.52)
(0.40) (1.38)
treatment Perm. Perm. Perm. all all Perm. Perm. Perm. all all
Y*conts No Yes No No Yes No Yes No No Yes

15
Democracy improves gadp and corruption Dep. Var gadp Corruption
dem 0.40 0.37 0.12 0.10 0.38 0.38 0.24 0.27 (0.08)***
(0.20)** (0.43) (0.43)
(0.07) (0.18)
(0.07) (0.07)
(0.07)*** (0.17)**
(0.07)*** (0.06)*** (0.17)
(0.06)*** (0.06)***
3y_pre -0.21 -0.10
(0.11)* (0.17)
(0.08) (0.16)
3y_post 0.12 0.20
(0.10) (0.22)
(0.08)** (0.22)
post_dem 0.58 0.54
(0.12)*** (0.29)**
(0.10)*** (0.24)**
treatment Perm. Perm. Perm. all all Perm. Perm. Perm. all all Y*conts No Yes No No Yes No Yes No No Yes
16
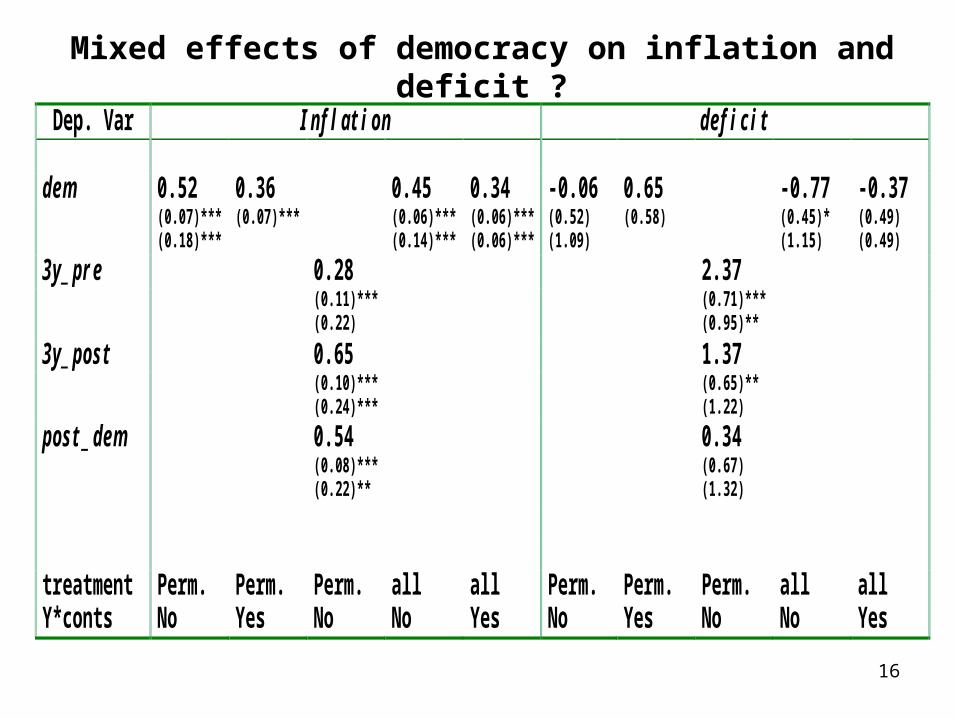
Mixed effects of democracy on inflation and deficit ?
Dep. Var Inflation deficit
dem 0.52 0.36 0.45 0.34 -0.06 0.65 -0.77 -0.37 (0.07)***
(0.18)*** (0.07)*** (0.06)***
(0.14)*** (0.06)*** (0.06)***
(0.52) (1.09)
(0.58) (0.45)* (1.15)
(0.49) (0.49)
3y_pre 0.28 2.37
(0.11)*** (0.22)
(0.71)*** (0.95)**
3y_post 0.65 1.37
(0.10)*** (0.24)***
(0.65)** (1.22)
post_dem 0.54 0.34
(0.08)*** (0.22)**
(0.67) (1.32)
treatment Perm. Perm. Perm. all all Perm. Perm. Perm. all all Y*conts No Yes No No Yes No Yes No No Yes

17
Summary• Effects of Liberalizations (after 3 years or more)
– Better economic outcomes– Better governance – Better macro-policies
• Liberalizations preceded by – Worse investment– Worse macro-policies
• Effects of Democracy– None on economic outcomes– Better governance (after 3 years or more)– Macro-policies? (changes precede reform)
• Identification: are reforms random?

18
Controls (always) & treated (before liberalization)
-4
-2
0
2
4
(mea
n)
t_re
sid
s
-3-2
-10
12
(mea
n)
c_re
sid
s
1960 1970 1980 1990 2000year
(mean) c_resids (mean) t_resids
GrowthLiberalization
-.8
-.6
-.4
-.2
-5.55e-17
.2
(mea
n)
t_re
sid
s
-.1
-.0
50
.05
.1(m
ea
n)
c_re
sid
s
1960 1970 1980 1990 2000year
(mean) c_resids (mean) t_resids
GapdLiberalization
-.5
0
.5
1
(mea
n)
t_re
sid
s
-.4
-.2
-5.5
5e-1
7.2
.4(m
ea
n)
c_re
sid
s
1960 1970 1980 1990 2000year
(mean) c_resids (mean) t_resids
InflationLiberalization
-2
-1
0
1
2
(mea
n)
t_re
sid
s
-10
12
(mea
n)
c_re
sid
s
1960 1970 1980 1990 2000year
(mean) c_resids (mean) t_resids
Investment
Liberalization
-.2
0
.2
.4
.6
(mea
n)
t_re
sid
s
-.1
-.0
50
.05
.1(m
ea
n)
c_re
sid
s
1960 1970 1980 1990 2000year
(mean) c_resids (mean) t_resids
Corruption
Liberalization
-1
0
1
2
3
4
(mea
n)
t_re
sid
s
-.5
0.5
(mea
n)
c_re
sid
s1960 1970 1980 1990 2000
year
(mean) c_resids (mean) t_resids
Overall_deficit_surplus
Liberalization

-4
-2
0
2
4
6
(mea
n)
t_re
sid
s
-.5
0.5
11
.5(m
ea
n)
c_re
sid
s
1960 1970 1980 1990 2000year
(mean) c_resids (mean) t_resids
GrowthDemocratization
-.4
-.2
0
.2
(mea
n)
t_re
sid
s
-.0
4-.
02
0.0
2.0
4(m
ea
n)
c_re
sid
s1960 1970 1980 1990 2000
year
(mean) c_resids (mean) t_resids
GadpDemocratization
-1
-.5
0
.5
(mea
n)
t_re
sid
s
-.1
-.0
50
.05
.1(m
ea
n)
c_re
sid
s
1960 1970 1980 1990 2000year
(mean) c_resids (mean) t_resids
InflationDemocratization
-2
-1
0
1
2
(mea
n)
t_re
sid
s
-.5
0.5
1(m
ea
n)
c_re
sid
s
1960 1970 1980 1990 2000year
(mean) c_resids (mean) t_resids
Investment
Democratization
-.2
0
.2
.4
(mea
n)
t_re
sid
s
-.0
4-.
02
0.0
2(m
ea
n)
c_re
sid
s
1960 1970 1980 1990 2000year
(mean) c_resids (mean) t_resids
Corruption
Democratization
-2
0
2
4
6
8
(mea
n)
t_re
sid
s
-.4
-.2
0.2
.4(m
ea
n)
c_re
sid
s1960 1970 1980 1990 2000
year
(mean) c_resids (mean) t_resids
Overall_deficit_surplus
Democratization
Controls (always) and Treated (before democracy)

20
Democracy happens before liberalization….
Dep var polity2 liberalization
Lib 1.83 1.27 1.46 1.09 (0.22)***
(0.75)** (0.23)*** (0.20)***
(0.69)** (0.22)*** (0.82)
Dem 0.28 0.20 0.12 0.08 (0.02)***
(0.06)*** (0.02)*** (0.01)***
(0.05)** (0.01)*** (0.01)***
5y_pre 2.12 (0.36)***
(0.60)***
3y_pre 2.79 0.05 (0.30)***
(0.75)*** (0.02)**
(0.05)
3y_post 3.18 0.19 (0.28)***
(0.92)*** (0.02)***
(0.06)***
post_treat 2.72 0.35 (0.28)***
(1.04)*** (0.02)***
(0.07)***
Treatment Perm. Perm. Perm. all all Perm. Perm. Perm. all all Y*conts no yes No no Yes no Yes No no Yes

21
But identification problematic – treated improve in the 1990s relative to controls
0
.1
.2
.3
.4
(mea
n) t_r
esids
-.04
-.02
0.02
.04.06
(mea
n) c_
resids
1960 1970 1980 1990 2000year
(mean) c_resids (mean) t_resids
LiberalizationDemocratization
-1
0
1
2
3
(mea
n) t_r
esids
-1-.5
0.5
11.5
(mea
n) c_
resids
1960 1970 1980 1990 2000year
(mean) c_resids (mean) t_resids
Polity2Liberalization

22
Multiple treatments: dem & libControls: no reform at all
Specification: – Mutually exclusive partition (avoid bias due to
heterogeneous treatment effects)Eg. Lib_1t = 1 after Lib in single treatment countries
Lib_2t = 1 after Lib in double treatment countries…
– Test whether sequencing matters
– Allow for a few other sources of heterogeneity in treatment effects

23
controls (always) and treated (before first reform)
-4
-2
0
2
4
6
(mea
n)
t_re
sid
s
-.5
0.5
11
.5(m
ea
n)
c_re
sid
s
1960 1970 1980 1990 2000year
(mean) c_resids (mean) t_resids
GrowthDemocratization
-.4
-.2
0
.2
(mea
n)
t_re
sid
s
-.0
4-.
02
0.0
2.0
4(m
ea
n)
c_re
sid
s
1960 1970 1980 1990 2000year
(mean) c_resids (mean) t_resids
GadpDemocratization
-1
-.5
0
.5
(mea
n)
t_re
sid
s
-.1
-.0
50
.05
.1(m
ea
n)
c_re
sid
s
1960 1970 1980 1990 2000year
(mean) c_resids (mean) t_resids
InflationDemocratization
-2
-1
0
1
2
(mea
n)
t_re
sid
s
-.5
0.5
1(m
ea
n)
c_re
sid
s
1960 1970 1980 1990 2000year
(mean) c_resids (mean) t_resids
Investment
Democratization
-.2
0
.2
.4
(mea
n)
t_re
sid
s
-.0
4-.
02
0.0
2(m
ea
n)
c_re
sid
s
1960 1970 1980 1990 2000year
(mean) c_resids (mean) t_resids
Corruption
Democratization
-2
0
2
4
6
8
(mea
n)
t_re
sid
s
-.4
-.2
0.2
.4(m
ea
n)
c_re
sid
s1960 1970 1980 1990 2000
year
(mean) c_resids (mean) t_resids
Overall_deficit_surplus
Democratization

24
Definitions of dummy variables
dem_1t
1 after demo, if 1 reform only
dem_2t
1 after demo, if had 2 reforms
lib_1t
1 after lib, if 1 reform only
lib_2t
1 after lib, if had 2 reforms
dem_after
1 after second reform, if dem came second
lib_after
1 after second reform, if lib came second

25
1. Lib. improves economic outcomes
2. Demo after Lib gives a further boost
growth investment dem_1t 0.88 0.53 1.86 1.22 dem_2t 0.32 0.99 -1.11 -0.38 lib_1t 1.00 0.91 0.81 0.88 lib_2t 1.78 1.77 1.31 1.64 dem_after 0.58 -0.29 3.96 1.72 lib_after -0.66 -1.76 1.11 -0.87 Treatment all all all all Y*conts&oil No Yes No Yes

26
1. Lib improves macro outcomes2. But Lib after Demo does not
Dep. var. Inflation deficit dem_1t 0.23 0.24 -3.26 -3.00 dem_2t 0.57 0.27 1.98 1.40 lib_1t 0.13 -0.05 -0.85 -0.82 lib_2t -0.49 -0.66 -3.67 -2.89 dem_afer -0.38 -0.32 -0.31 0.56 lib_after 0.42 0.66 2.19 2.67
Treatment all all All All Y*conts&oil No Yes No No Yes

27
Lib and Demo improve governance, additive effects
Dep. var. gadp Corruption dem_1t -0.08 -0.02 0.02 0.10 dem_2t 0.03 0.18 0.32 0.41 lib_1t 0.17 0.13 0.16 0.19 lib_2t 0.29 0.31 0.36 0.34 dem_after 0.13 -0.04 0.09 0.06 lib_after 0.32 0.19 -0.15 -0.13
Treatment all all All all Y*conts&oil No Yes No Yes

28
Summary• Sequence matters:
Democracies that follows Liberalizations give better results
Liberalizations enacted by democracies less effective
Eg: China vs Russia; Chile vs India
• Why?– Better democracy in an open environment?
Constraints on redistributive policies by democracies?
– More far reaching liberalization in Dictatorship?Dictator who opens up the economy has fewer veto players, does
it more effectively?