Economic and Financial Report ‘07 - Zonebourse.com SA... · la Diputación s/n Edificio Inditex,...
102
Economic and Financial Report ‘07
Transcript of Economic and Financial Report ‘07 - Zonebourse.com SA... · la Diputación s/n Edificio Inditex,...

Economic and Financial Report
‘07

Inditex´s headquarters in Arteixo, A Coruña (Spain)

3
(*) Free translation from the original in Spanish. In the event of discrepancy, the Spanish-language version prevails)
1. CONSOLIDATED INCOME STATEMENT
2. II. CONSOLIDATED BALANCE SHEET
3. III. CONSOLIDATED STATEMENT OF CASH FLOWS
4. IV. CONSOLIDATED STATEMENT OF CHANGES IN EQUITY
5. NOTES TO THE CONSOLIDATED ANNUAL ACCOUNTS
5.1. Activity and description of the Group
5. 2. Net sales
5. 3. Cost of merchandise
5. 4. Operating expenses
5. 5. Other net operating income/expenses
5. 6. Financial results
5. 7. Earnings per share
5. 8. Segment reporting
5. 9. Trade and other receivables
5. 10. Inventories
5. 11. Property, plant and equipment
5. 12. Investment property
5. 13. Rights over leased premises and other intangible assets
5. 14. Goodwill
5. 15. Financial investments
5. 16. Investments in associate companies
5. 17. Other non-current assets
5. 18. Trade and other payables
5. 19. Net financial position
5. 20. Provisions
5. 21. Other long-term liabilities
5. 22. Capital and reserves
5. 23. Income tax
5. 24. Operating leases
5. 25. Finance leases
5. 26. Risk management and financial instruments
5. 27. Employee benefits
5. 28. Interest in joint ventures
5. 29. Proposed distribution of parent company profit
5. 30. Remuneration of the board of directors and transactions with related parties
5. 31. External auditors
Economic and Financial Report
Inditex Group consolidated annual accounts 31 January 2008*
44
5.32. 32. Selected accounting policies
5.32.1. . Basis of consolidation
5.32.2. Accounting principles
a) Foreign currency transactions
b) Property, plant and equipment
c) Rights over leased premises
d) Other intangible assets
e) Financial investments
f) Investment property
g) Impairment
h) Trade and other receivables
i) Inventories
j) Cash and cash equivalents
k) Employee benefits
l) Provisions
m) Financial liabilities
n) Derivatives and hedging operations
o) Income recognition
p) Leases
q) Financial income and expenses
r) Income taxes
s) Current and non-current assets and liabilities
t) Own shares
5.33. 33. Environment
Appendix I- Structure of the Inditex Group
Appendix II- Article 127 ter of the Spanish Companies Act


66

7What is it?
What did it do in 2007?
How did it do it?
Where is it?
How is it governed?
Who forms the teams?
How does it ensure sustainability?
Economic and Financial Report
Annual Corporate Governance Report
1 Consolidated income statement
Industria de Diseño Textil, S.A. and subsidiary companies
(in thousands of euros) (Notes) 31-01-08 31-01-07
Net sales (2) 9,434,670 8,196,265
Cost of merchandise (3) (4,085,959) (3,589,276)
Gross profit 5,348,711 4,606,989
56.7% 56.2%
Operating expenses
Other net operating expenses and income (4) (3,226,369) (2,800,243)
Operating profit (EBITDA) (5) 26,501 (17,060)
2,148,843 1,789,686
Amortization and depreciation
Operating profit (EBIT) (11,12,13) (496,663) (433,427)
1,652,180 1,356,259
Financial results
Equity accounting losses (6) 964 (14,035)
Income before taxeS (16) (7,508) (2,786)
1,645,636 1,339,438
Income tax
Net income (23) (387,872) (329,502)
1,257,764 1,009,936
Minorities
Net income attributable to minority interest 7,495 8,396
1,250,269 1,001,540
Earnings per share, cents (7) 201.4 161.3

88
2 Consolidated balance sheets
Industria de Diseño Textil, S.A. and subsidiary companies
(in thousands of euros) (notes) 31-01-08 31-01-07
Assets
Current assets 2,981,595 2,148,332
Cash and cash equivalents (19) 1,465,835 906,148
Receivables (9) 463,716 363,635
Inventories (10) 1,007,213 823,903
Income tax receivable (23) 1,719 20,870
Other current assets 43,112 33,776
Non-current assets 4,124,007 3,593,830
Property, plant and equipment (11) 3,182,112 2,788,816
Investment property (12) 9,475 11,851
Rights over leased assets (13) 504,604 454,196
Other intangible assets (13) 13,344 15,220
Goodwill (14) 125,583 98,992
Financial investments (15) 36,174 33,375
Investments in associates (16) - 4,446
Deferred tax assets (23) 133,020 88,851
Other (17) 119,695 98,083
Total assets 7,105,602 5,742,162
Liabilities
Current liabilities 2,458,067 1,884,741
Trade and other payables (18) 1,975,251 1,618,825
Financial debt (19) 371,276 145,077
Income tax payable (23) 111,540 120,839
Non-current liabilities 430,484 386,817
Financial debt (19) 42,358 47,314
Deferred tax liabilities (23) 110,957 104,319
Provisions (20) 47,681 45,114
Other non-current liabilities (21) 229,488 190,070
Equity 4,217,051 3,470,604
Net equity attributable to the parent 4,193,129 3,448,377
Net equity attributable to minority interest 23,922 22,227
Total equity and liabilities 7,105,602 5,742,162

9What is it?
What did it do in 2007?
How did it do it?
Where is it?
How is it governed?
Who forms the teams?
How does it ensure sustainability?
Economic and Financial Report
Annual Corporate Governance Report
3 Consolidated statement of cash flows
Industria de Diseño Textil, S.A. and subsidiary companies
(in thousands of euros) 2007 2006
Income before taxes and minority interest 1,645,636 1,339,438
Adjustments to income
Amortization and depreciation 496,663 433,427
Income tax (387,872) (329,502)
Deferred tax assets and liabilities (38,465) (13,285)
Foreign exchange translation differences 1,837 271
Other 39,338 61,335
Cash flows generated 1,757,137 1,491,684
Variación en activos y pasivos
Inventories (197,485) (135,457)
Receivables and other current assets (87,608) (51,312)
Current payables 345,408 92,426
Operating working capital 60,315 (94,344)
Cash flows from operations 1,817,452 1,397,340
Acquisition of intangible assets (87,967) (79,101)
Acquisition of property, plant and equipment (850,109) (783,598)
Acquisition of subsidiaries (7,147) (28,688)
Acquisition of other financial investments (10,307) (6,114)
Other investments (26,572) (16,094)
Proceeds from sales of assets and collections of other non-current assets 9,536 26,560
Disposals of entities 30,712 -
Cash flows from investing activities (941,854) (887,035)
Variation in non-current financial debt (16,513) (28,226)
Variation in non-current non-financial debt 15,763 (67,143)
Variation in current financial debt 214,514 (64,115)
Dividends (521,591) (417,632)
Other financing activities 518 -
Cash flows used in financing activities (307,308) (577,116)
Net (decrease) increase in cash and cash equivalents 568,290 (66,810)
Effect of exchange rate fluctuations on cash and cash equivalents (8,603) (15,446)
Cash and cash equivalents at opening date 906,148 988,405
Cash and cash equivalents at closing date 1,465,835 906,148

1010
4 Consolidated statement of changes in equity
Industria de Diseño Textil, S.A. and subsidiary companies
Equity attributable to the parent
(in thousands of euros) CapitalShare
premiumRetained earnings
Translation differences
Treasury shares
Other reserves
Equity attributable
to the parent
Minority interest Equity
Balance at 01/02/2006 93,500 20,379 2,717,706 19,774 (6,970) 54,489 2,898,878 21,995 2,920,873
Transfers - - 3,092 (3,092) - - - - -
Other - - 17,929 - - 17,929 - 17,929
Effect of movement in foreign exchange - - - (52,338) - - (52,338) - (52,338)
Restatement due to inflation - - - - - - - 117 117
Net income recognized directly in equity - - 21,021 (55,430) - - (34,409) 117 (34,292)
Profit for the year - - 1,001,540 - - - 1,001,540 8,396 1,009,936
Total net income recognized directly in equity - - 1,022,561 (55,430) - - 967,131 8,513 975,644
Dividends - - (417,632) - - (417,632) (8,281) (425,913)
Balance at 31/01/2007 93,500 20,379 3,322,635 (35,656) (6,970) 54,489 3,448,377 22,227 3,470,604
Balance at 01/02/2007 93,500 20,379 3,322,635 (35,656) (6,970) 54,489 3,448,377 22,227 3,470,604
Transfers - - 35,347 (35,347) - - - - -
Other - - 40,401 - 43 - 40,444 (3,268) 37,176
Effect of movement in foreign exchange - - (24,366) - - (24,366) - (24,366)
Restatement due to inflation - - - - - - - - 0
Net income recognized directly in equity - - 75,748 (59,713) 0 - 16,078 (3,268) 12,810
Profit for the year - - 1,250,269 - - 1,250,269 7,495 1,257,764
Total net income recognized directly in equity - - 1,326,017 (59,713) 0 - 1,266,347 4,227 1,270,574
Dividends - - (521,591) - (521,591) (2,532) (524,123)
Balance at 31/01/2008 93,500 20,379 4,127,061 (95,369) (6,927) 54,489 4,193,133 23,922 4,217,055

11What is it?
What did it do in 2007?
How did it do it?
Where is it?
How is it governed?
Who forms the teams?
How does it ensure sustainability?
Economic and Financial Report
Annual Corporate Governance Report
(*) Free translation from the original in Spanish. In the event of discrepancy, the Spanish-language version prevails)
5 Consolidated annual accounts of the Inditex group as at 31 january 2008*
The consolidated annual accounts of the Inditex Group for 2007 have been prepared by the board of
directors of the Company and will be submitted for approval at the corresponding annual general share-
holders’ meeting. The directors consider that the consolidated annual accounts will be approved without
changes. These annual accounts have been prepared in accordance with International Financial Repor-
ting Standards adopted by the European Union (hereinafter EU-IFRS), in compliance with Regulation
(EC) No. 1606/2002 of the European Parliament.
Inditex’s financial year and that of most of its subsidiaries starts on 1 February of each year and ends
on 31 January of the following year. The twelve-month period ended 31 January 2007 will hereinafter be
referred to as the 2006 period or year, the period ended 31 January 2008 as 2007, and so on.
Unless otherwise stated, the amounts shown in the consolidated annual accounts are expressed in
thousands of euro. The euro is the functional and presentation currency of the Company.
The individual annual accounts of the parent company (Inditex) for 2007 have been prepared by the
board of directors in a separate document.
It is estimated that the consolidated annual accounts for 2007 will be approved by the shareholders at
their ordinary annual general meeting without significant changes. The consolidated annual accounts for
2006 were approved by the shareholders at their ordinary general meeting held on 17 July 2007.
These consolidated annual accounts present fairly the consolidated shareholders’ equity, financial
position and changes in equity of the Inditex Group as at 31 January 2008, as well as the results of its
operations and cash flows for the year then ended.
The consolidated annual accounts for 2007 have been prepared on the basis of the accounting records of
Inditex and the remaining group companies
These consolidated annual accounts have been prepared on a historical cost basis, except for derivative
financial instruments, which were not accounted for using hedge accounting and are stated at fair value.
The basis of consolidation and accounting principles applied are explained in note 32.
1212
5.1 Activity and description of the Group
Industria de Diseño Textil, S.A. (hereinafter Inditex), which has its registered offices at Avenida de
la Diputación s/n Edificio Inditex, Arteixo (A Coruña, Spain), is the parent of a group of companies,
the principal activity of which consists of the distribution of fashion items, mainly clothing, footwear,
accessories and household textile products. Inditex carries out its activity through various commercial
formats such as Zara, Pull & Bear, Massimo Dutti, Bershka, Stradivarius, Oysho and Zara Home, which are
managed separately but which share certain corporate functions. Inditex is domiciled in Spain, is listed
on all four Spanish stock exchanges and, together with its subsidiary companies, comprises the Inditex
Group (the Group).
Each concept’s commercial activity is carried out through chains of stores managed directly by com-
panies in which Inditex holds all or the majority of the share capital, with the exception of certain
countries where, for various reasons, the retail selling activity is performed through franchises.
Inditex business model is characterized by the search for flexibility in adapting production to market
demand by controlling the supply chain throughout the different stages of design, manufacture and
distribution. This enables it to focus both its own and suppliers’ production on changes in market trends
during each commercial campaign.
The Group’s logistics system is based on constant deliveries from the distribution centers of the various
commercial formats to stores throughout each season. This system essentially operates through centrali-
zed logistics centers for each concept in which inventory is stored and distributed to stores worldwide.
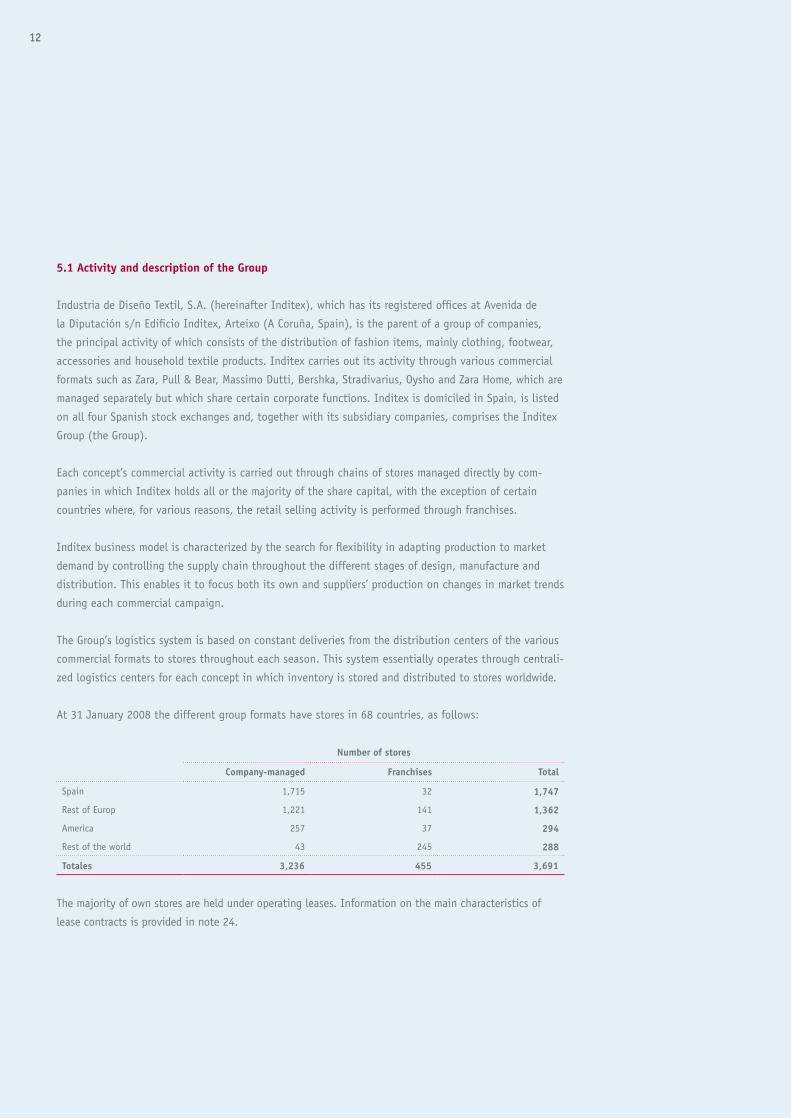
At 31 January 2008 the different group formats have stores in 68 countries, as follows:
Number of stores
Company-managed Franchises Total
Spain 1,715 32 1,747
Rest of Europ 1,221 141 1,362
America 257 37 294
Rest of the world 43 245 288
Totales 3,236 455 3,691
The majority of own stores are held under operating leases. Information on the main characteristics of
lease contracts is provided in note 24.
Number of stores

13What is it?
What did it do in 2007?
How did it do it?
Where is it?
How is it governed?
Who forms the teams?
How does it ensure sustainability?
Economic and Financial Report
Annual Corporate Governance Report
5.2 Net sales
Revenue in the consolidated income statement includes amounts received from the sale of goods and
income from rentals, royalties and other services rendered in the ordinary course of the Group’s business,
net of VAT and other sales-related taxes.
Details of this caption for 2007 and 2006 are as follows:
2007 2006
Net sales in Company-managed stores 8,666,110 7,587,355
Net sales to franchises 667,947 523,295
Other sales and services rendered 100,613 85,615
Total 9,434,670 8,196,265
5.3 Cost of merchandise
Details of this caption for 2007 and 2006 are as follows:
2007 2006
Raw materials and consumables 4,269,269 3,728,787
Change in inventories (183,310) (139,511)
Total 4,085,959 3,589,276
Raw materials and consumables mainly include amounts relating to the acquisition or production by
third parties of products held for sale or transformation and other direct expenses related to the acquisi-
tion of goods.
5.4 Operating expenses
Details of “Operating expenses” are as follows:
2007 2006
Gastos de personal 1,472,900 1,250,845
Arrendamientos operativos (nota 24) 855,378 717,915
Otros gastos operativos 898,091 831,483
Totales 3,226,369 2,800,243
At 31 January 2008 Group had a total of 79,517 employees (69,240 at 31 January 2007). Note 27 (em-
ployee benefits) provides additional information on personnel expenses.

1414
Lease expenses mainly relate to the rental, through operating leases, of the commercial premises from
which the Group carries out its activity. Note 24 provides more detailed information on the main charac-
teristics of these leases, together with the related minimum future payment commitments.
“Other operating expenses” mainly include expenses relating to store operations, logistics and general
overheads, such as electricity, commissions on credit and debit card payments, travel, transportation
of merchandise from logistic centers to stores, decoration expenses, communications and all kinds of
professional services.
5.5 Other net operating income/expenses
This caption includes all operating expenses and income other than those associated with the Group’s
commercial and logistics activity, which are included under “Operating expenses” in the consolidated
income statement, as described in the prior note.
This caption mainly include gains on the sale of the companies mentioned in note 32 and variations in
the debt related to reciprocal sales and purchase options between the Group and shareholders with a
partial stake in certain subsidiaries, as these options are considered a deferred acquisition of the shares
which constitute the underlying asset (see notes 21 and 32). These variations are mainly due to the
relationship between the price of the options and the number of stores operated, shareholders’ equity
and the results of these subsidiary companies.
A continuación se describen las principales opciones de compraventa cruzadas sobre dichas participaciones:
a) Subsidiary companies domiciled in Germany
At 31 January 2008 the Group has a call option on 22% of the share capital of Zara Deuts-
chland, GmbH. This shareholding belongs to Otto GmbH and Co. KG, which in turn has a put
option to sell this shareholding to Industria de Diseño Textil, S.A..
These options may be exercised by the holders at any time. However, the exercised call option
effectiveness is delayed to certain dates determined in the related agreement, which vary
depending on the exact date on which the option is exercised. These options have no premium
or compensation of any kind attached and the strike price will depend mainly on the contribu-
tions made by Otto GmbH and Co. KG to the shareholders’ equity of the subsidiary and on the
number of ZARA stores opened in Germany after 1 February 2006.
b) Subsidiary companies domiciled in Mexico
The Group has call options on 5% of the share capital of Zara México, S.A. de C.V., 3% of the
share capital of Bershka México, S.A. de C.V., and 1.5% each of Oysho México, S.A. de C.V.

15What is it?
What did it do in 2007?
How did it do it?
Where is it?
How is it governed?
Who forms the teams?
How does it ensure sustainability?
Economic and Financial Report
Annual Corporate Governance Report
and Pull & Bear México, S.A. de C.V., which are held by the minority shareholder. The exercise
period of these options extends over the term of the agreements between the parties. The
options have no premium attached and the strike price will depend on the shareholders’ equity
of the subsidiaries.
5.6 Financial results
Details of “Net financing revenue/costs” in the consolidated income statements for 2007 and 2006 are
as follows:
2007 2006
Interest income 20,603 16,425
Foreign exchange gains 15,280 3,515
Dividends 144 223
Changes in fair value of financial instruments
- -
Total income 36,026 20,163
Interest expense (4,659) (10,993)
Foreign exchange losses (28,836) (21,067)
Changes in fair value of financial instruments
(1,568) (2,137)
Total expenses (35,063) (34,198)
Total 964 (14,035)
Financial income and expenses mainly comprise interest accrued on the Group’s financial assets and
liabilities during the year (see note 19). Net foreign exchange translation differences are principally due
to fluctuations in the currencies with which the Group operates (see note 26) between when income,
expenses, acquisitions or disposals of assets are recognized and when the corresponding assets or liabi-
lities are realized or settled under applicable accounting principles.
Details of financial income and expenses recognized in equity during the period are as follows
2007 2006
Variation in fair value derived from hedging (5,827) 1,123
Foreign exchange conversion differences (6,516) (14,845)
Total (12,343) (13,722)
5.77) Earnings per share
Basic earnings per share were calculated based on the net profit for the year divided by the weighted
average number of ordinary shares in circulation during the year, excluding the average number of
treasury shares held by the Group (see note 22), which in 2007 and 2006 totaled 620,942,175 and
620,941,017, respectively.

16
Diluted earnings per share are calculated based on profit attributable to shareholders of the Company
and a weighted average number of ordinary shares outstanding after adjustment for the effect of all
dilutive potential ordinary shares. The share-based payment plan referred to in note 27 has not had a
significant impact on the calculation of diluted earnings per share.
5.8 Segment reporting
Business segments
The principal activity of the Inditex Group comprises the retail distribution of clothing, footwear,
accessories and household textile products through various commercial format stores aimed at different
targeted sectors of the public. These commercial formats are managed independently in such a way that
each constitutes a business segment which is subject to risks and rewards different to those experienced
by the rest of the Group, although each carries out its activity in the same sector.
The seven business formats of Inditex are: Zara, Pull & Bear, Massimo Dutti, Bershka, Stradivarius, Oysho
and Zara Home. Each format manages its own supply chain, corporate policy and network of stores, whi-
le taking advantage of the synergies of belonging to the Inditex Group, mainly in the areas of support,
market knowledge, economic solvency before third parties and in all corporate activities. As a result of
strategic modifications to the Group, the business segment which, until the previous year, comprised
the operations of the Kiddy’s Class format is no longer subject to different risks and rewards which
would require it to be presented separately from the Zara segment, with which it has been grouped, and
therefore, comparative information has been duly modified following the requirements of international
financial reporting standards.

What is it?
What did it do in 2007?
How did it do it?
Where is it?
How is it governed?
Who forms the teams?
How does it ensure sustainability?
Economic and Financial Report
Annual Corporate Governance Report
17
Geographical segments
All Inditex Group commercial formats operate in different markets with varying economic, commercial
and legal environments, and are therefore subject to different risks and rewards. The four geographical
segments of the Group’s activities – Spain, Rest of Europe, Asia and the Rest of the World, and Ameri-
ca – are determined based on the similarity of commercial, economic and political conditions and the
proximity of operations. In the presentation of information by geographical segment, ordinary income
is based on the geographical location of customers and segment assets are based on the geographical
location of assets.
Primary and secondary segments
The origin and predominant nature of the risks and rewards of the Inditex Group’s business units are at-
tributable to business segments, as these risks and rewards are mainly influenced by the fact that each
cash generating unit belongs to a particular commercial format and geographical location. The internal
organization of the Inditex Group, the decision-making process and the system for communicating in-
formation to the board of directors and group management is organized primarily by commercial format,
followed by geographical areas.

1818
Details of the Inditex Group by segments are as follows.
Primary segments
2006
Zara Rest of formats Eliminations on consolidation
Total
Total revenue 5,827,011 2,663,156 - 8,490,167
Inter-segment revenue 292,931 970 (293,901) -
Revenue from third parties 5,534,080 2,662,185 - 8,196,265
Segment result 910,700 445,559 - 1,356,259
Segment assets 3,085,349 1,884,530 - 4,969,878
Segment liabilities 1,422,240 536,089 - 1,958,329
Segment investments 662,916 305,562 - 968,478
Amortization and depreciation 302,645 130,783 - 433,427
Expenses without cash outflow 50,540 4,449 - 54,989
ROCE 40% 50% - 43%
Number of stores 1,175 1,956 - 3,131
2007
Zara Rest of formats Eliminations on consolidation
Total
Total revenue 6,661,184 3,172,269 - 9,833,453
Inter-segment revenue 399 ,134 1,649 (398,782) -
Revenue from third parties 6,264,050 3,170,620 - 9,434,670
Segment result 1,117,316 534,864 - 1,652,180
Segment assets 3,668,278 2,343,621 - 6,011,899
Segment liabilities 1,766,793 588,342 - 2,355,135
Segment investments 641,062 376,793 - 1,018,395
Amortization and depreciation 338,879 157,785 - 496,663
Expenses without cash outflow 45,607 4,735 - 50,342
ROCE 41% 50% - 43%
Number of stores 1,361 2,330 - 3,691

What is it?
What did it do in 2007?
How did it do it?
Where is it?
How is it governed?
Who forms the teams?
How does it ensure sustainability?
Economic and Financial Report
Annual Corporate Governance Report
19
2006
Zara Pull & BearMassimo
Dutti Bershka Stradivarius Oysho Zara HomeEliminations on
consolidation Total
Total revenue 5,827,011 519,082 614,490 798,210 427,648 164,604 139,121 - 8,490,167
Inter-segment revenue 292,931 278 312 376 - - 5 (293,901) -
Revenue from third parties 5,534,080 518,804 614,178 797,835 427,648 164,604 139,116 - 8,196,265
Segment result 910,700 78,030 80,683 131,294 98,205 39,021 18,326 - 1,356,259
Segment assets 3,085,349 329,879 550,537 541,537 234,605 126,653 101,319 - 4,969,878
Segment liabilities 1,422,240 99,417 112,606 171,318 83,463 29,237 40,047 - 1,958,329
Segment investments 662,916 55,642 67,202 76,645 46,099 32,169 27,805 - 968,478
Amortization and depreciation 302,645 25,819 37,041 35,820 17,780 9,362 4,961 - 433,427
Expenses without cash outflow 50,540 1,284 1,029 1,188 73 547 328 - 54,989
ROCE 40% 43% 33% 55% 86% 55% 33% - 43%
Number of stores 1,175 467 399 433 304 201 152 - 3,131
2007
Zara Pull & BearMassimo
Dutti Bershka Stradivarius Oysho Zara HomeEliminations on
consolidation Total
Total revenue 6,661,184 615,091 696,092 925,637 520,864 213,201 201,384 - 9,833,453
Inter-segment revenue 399,134 742 479 427 - - 1 (398,782) -
Revenue from third parties 6,264,050 614,348 695,613 925,211 520,864 213,201 201,383 - 9,434,670
Segment result 1,117,316 99,193 105,674 153,650 119,433 40,045 16,868 - 1,652,180
Segment assets 3,668,278 405,693 616,411 641,814 327,392 197,191 155,121 - 6,011,899
Segment liabilities 1,766,793 111,829 149,732 161,060 81,191 42,317 42,212 - 2,355,135
Segment investments 641,602 76,595 35,171 74,026 81,104 59,622 50,276 - 1,018,395
Amortization and depreciation 338,879 29,139 37,021 45,862 20,412 14,817 10,534 - 496,663
Expenses without cash outflow 45,607 1,337 1,117 1,023 231 411 615 - 50,342
ROCE 41% 47% 44% 59% 74% 39% 18% - 43%
Number of stores 1,361 519 426 510 381 290 204 - 3,691

20
The segment result refers to the operating result (EBIT) of the segment. In accordance with IAS 14,
and with a view to maintaining the coherence between the figures in the balance sheet and income
statement, segment assets and liabilities indicated in the table above exclusively refer to those used in
or derived directly from activity, and do not include assets or liabilities relating to income tax, accounts
receivable or payable, loans, investments or any other item that generates financial results, as these are
not included in the segment result. Income, expenses, assets and liabilities which are considered corpo-
rate in nature or as belonging to the Group of segments as a whole have been assigned to each segment
in accordance with criteria considered reasonable by Group management.
ROCE is defined as the ratio between the segment’s result for the year (EBIT) and the total net average
assets of the segment, which include those derived from activity as well as financial and tax-related
assets.
Segmentos secundarios
Ventas a terceros
2007 2006
Spain 3,746,817 3,417,631
Rest of Europe 4,093,086 3,349,580
América 974,089 940,701
Rest 620,678 488,352
Total 9,434,670 8,196,265
Net assets
31/01/08 31/01/07
Spain 1,980,293 1,935,091
Rest of Europe 3,487,227 2,542,954
América 411,362 378,175
Rest 133,017 113,657
Total 6,011,899 4,969,878
Investments
2007 2006
Spain 433,770 427,735
Rest of Europe 477,636 433,457
América 80,024 80,091
Rest 26,965 27,195
Total 1,018,395 968,478

What is it?
What did it do in 2007?
How did it do it?
Where is it?
How is it governed?
Who forms the teams?
How does it ensure sustainability?
Economic and Financial Report
Annual Corporate Governance Report
21
5.9 Trade and other receivables
Details of this caption at 31 January 2008 and 2007 are as follows:
31/01/08 31/01/07
Trade receivables 88,502 62,047
Sales to franchises 112,094 90,859
Public entities 188,554 144,319
Other current receivables 74,566 66,410
Total 463,716 363,635
Trade receivables mainly correspond to debit/credit card payments pending collection.
Part of the Group’s activity is carried out through franchised stores (see note 2). Sales to franchises are
made under agreed collection terms and generate the receivables shown in the table above, which are
secured as described in note 26.
Balances receivable from public entities comprise VAT and other taxes and duties incurred by group
companies in the countries in which they operate.
Other current receivables include items such as rental incentives due from shopping center developers
(see note 24) and outstanding balances on sundry operations.
5.10 Inventories
Details at 31 January 2008 and 2007 are as follows:
31/01/08 31/01/07
Raw materials and consumables 46,395 38,661
Work in progress 23,826 18,058
Finished goods for sale 936,992 767,184
Total 1,007,213 823,903
The Group contracts insurance policies to cover potential inventory-related risks.

22
5.11 Property, plant and equipment
Details of and movement in the “Property, plant and equipment” caption of the consolidated balance
sheet are as follows:
Land and buildings Leasehold improvements,machinery and furniture
Other property, plant and equipment
Advances and work in progress
Total
Cost
Balance at 01/02/2006 606,932 2,842,691 111,390 106,091 3,667,104
Acquisitions 37,827 580,093 29,703 184,616 832,239
Acquisition of subsidiaries - 16,068 - - 16,068
Disposals (13,974) (129,454) (1,678) (13,367) (158,473)
Transfers 13,909 47,887 1,327 (73,024) (9,901)
Effect of movements in foreign exchange (1,238) (24,088) (815) (6,365) (32,506)
Balance at 31/01/2007 643,456 3,333,197 139,927 197,951 4,314,531
Balance at 01/02/2007 643,456 3,333,197 139,927 197,951 4,314,531
Acquisitions 138,156 605,524 34,251 122,484 900,415
Acquisition of subsidiaries -
Disposals (16,741) (94,034) (3,811) (14,477) (129,063)
Transfers 78,594 (4,889) 4,034 (80,947) (3,208)
Effect of movements in foreign exchange (1,348) (26,963) (618) (587) (29,516)
Balance at 31/01/2008 842,117 3,812,835 173,783 224,424 5,053,159
Accumulated depreciation
Balance at 01/02/2006 121,617 1,047,407 62,092 - 1,231,117
Depreciation charge for the year 16,710 347,777 15,513 - 380,000
Acquisition of subsidiaries - - - - -
Disposals (1,638) (90,635) (1,337) - (93,610)
Transfers (773) 1,742 (3,875) - (2,906)
Effect of movements in foreign exchange (153) (13,972) (259) - (14,384)
Restatement due to inflation - - - - -
Balance at 31/01/2007 135,763 1,292,319 72,134 - 1,500,216
Balance at 01/02/2007 135,763 1,292,319 72,134 - 1,500,217
Depreciation charge for the year 21,014 412,062 20,911 - 453,987
Disposals (3,551) (89,342) (1,711) - (94,604)
Transfers (3,644) (3,841) 366 - (7,119)
Effect of movements in foreign exchange (55) (2,308) 95 - (2,268)
Balance at 31/01/2008 149,527 1,608,890 91,795 - 1,850,212
Impairment losses (note 32.2-g)
Balance at 01/02/2006 - 25,956 - - 25,956
Impairment charge - 8,596 - - 8,596
Applications - (9,053) - - (9,053)
Balance at 31/01/2007 - 25,499 - - 25,499
Balance at 01/02/2007 - 25,499 - - 25,499
Impairment charge - 4,861 - - 4,861
Applications - (3,113) - - (3,113)
Disposals - (6,024) - - (6,024)
Effect of movements in foreign exchange - (388) - - (388)
Balance at 31/01/2008 - 20,835 - - 20,835
Net carrying amount
Balance at 31/01/2007 507,693 2,015,379 67,793 197,951 2,788,816
Balance at 31/01/2008 692,590 2,183,110 81,988 224,424 3,182,112

What is it?
What did it do in 2007?
How did it do it?
Where is it?
How is it governed?
Who forms the teams?
How does it ensure sustainability?
Economic and Financial Report
Annual Corporate Governance Report
23
“Other property, plant and equipment” includes, inter alia, information technology equipment and motor
vehicles.
Fully depreciated items of property, plant and equipment include certain items, mainly machinery, insta-
llations and furniture, whose gross cost value amounted to euros 330,713 thousand and euros 284,344
thousand at 31 January 2008 and 2007, respectively.
The Group contracts insurance policies to cover potential risks affecting items under property, plant and
equipment.
Through its corporate management risk policy, the Group identifies, assesses and controls damage and
responsibility-related risks to which its subsidiaries are exposed. It does this by compiling and measu-
ring the main risks of damage, loss of profits and responsibilities affecting the Group and implements
prevention and protection policies aimed at reducing the frequency and intensity of these risks.
Likewise, standard measurement criteria are established at corporate level which enable the different
exposure risks to be quantified and measured.
The Group contracts insurance policies through corporate insurance programs to protect its equity from
risk and establishes limits, policy excesses and conditions according to the nature thereof and the finan-
cial relevance of the subsidiary. This structure mainly comprises worldwide insurance programs through
which the main risks insured by the Group are organized.

24
5.12 Investment property
Investment property mainly corresponds to premises and other properties leased to third parties. Move-
ment in this caption during 2007 and 2006 is as follows:
Cost 31/01/08 31/01/07
Opening balance 19,678 19,644
Acquisitions - 34
Closing balance 19,678 19,678
Amortization and depreciation
Opening balance 7,827 5,417
Acquisitions 2,376 2,410
Closing balance 10,203 7,827
Net carrying amount 9,475 11,851
The total market value of investment property at 31 January 2008 is approximately euros 23,450
thousand.
During 2007, euros 1,678 thousand (euros 1,747 thousand in 2006) of rental income on these properties
has been included under Net sales – Other sales and services rendered (see note 2) in the consolidated
income statement.
5.13 Rights over leased premises and other intangible assets
Rights over leased premises include amounts paid to both proprietors and third parties in respect of
transfer rights, access premiums or tenancy right waivers in order to lease commercial premises.
Other intangible assets include amounts paid for the registration and use of Group brand names and the
external cost of software applications. Details of and movement in other intangible assets during 2007
and 2006 are as follows:

What is it?
What did it do in 2007?
How did it do it?
Where is it?
How is it governed?
Who forms the teams?
How does it ensure sustainability?
Economic and Financial Report
Annual Corporate Governance Report
25
Rights over leased property
Industrial property
Software Advances and other intangible assets
Total
Cost
Balance at 01/02/2006 571,687 18,570 7,221 2,721 600,199
Acquisitions 80,444 1,991 1,157 4,891 88,483
Disposals (10,577) (4) (3,406) (321) (14,308)
Transfers 19,667 (797) 797 989 20,656
Effect of movements in foreign exchange
(4,306) - 2,135 - (2,171)
Balance at 31/01/2007 656,915 19,760 7,904 8,280 692,859
Balance at 01/02/2007 656,915 19,760 7,904 8,280 692,859
Acquisitions 94,291 3,510 1,964 1,269 101,034
Disposals (8,964) (222) - - (9,186)
Transfers 5,476 - - (5,476) -
Effect of movements in foreign exchange
(5,681) - (238) (249) (6,168)
Balance at 31/01/2008 742,037 23,048 9,630 3,824 778,539
Amortization
Balance at 01/02/2006 160,604 11,853 4,685 2,705 179,847
Amortization for the year 45,931 1,042 797 170 47,940
Disposals (645) (1) (354) - (1,000)
Transfers 754 (280) 280 - 754
Effect of movements in foreign exchange
(4,295) - (173) - (4,468)
Balance at 31/01/2007 202,349 12,614 5,235 2,875 223,073
Balance at 01/02/2007 202,349 12,614 5,235 2,875 223,073
Amortization for the year 35,398 1,396 848 69 37,711
Disposals (2,432) (22) - - (2,454)
Transfers 840 - - - 840
Effect of movements in foreign exchange
851 - 145 (2) 994
Balance at 31/01/2008 237,006 13,988 6,228 2,942 260,164
Impairment losses (note 32.2-g)
Balance at 01/02/2005 393 - - - 393
Impairment charge (23) - - - (23)
Balance at 31/01/2006 370 - - - 370
Balance at 01/02/2006 370 - - - 370
Applications 57 - - - 57
Balance at 31/01/2007 427 - - - 427
Net carrying amount
Balance at 31/01/2007 454,196 7,146 2,669 5,405 469,416
Balance at 31/01/2008 504,604 9,060 3,402 882 517,948

2626
5.14 Goodwill
Details of and movement in goodwill during 2007 and 2006 are as follows:
2007 2006
Opening balance 98,992 79,094
Acquisitions 39,002 19,822
Disposals (13,000) -
Other 589 76
Closing balance 125,583 98,992
Subsidiary 2007 2006
Stradivarius Espa_a, S.A. 53,253 53,253
BCN Dise_os, S.A. de C.V. 15,523 14,934
Zara Polska, S.p. Zo.o. 29,838 10,983
Zao Zara CIS 19,822 19,822
Pull&Bear CIS 428 -
Stradivarius CIS 6,719 -
Closing balance 125,583 98,992
Goodwill corresponding to Stradivarius España, S.A. was generated upon acquisition of this company in
1998 and is stated at its net carrying amount at 1 February 2004, the date of transition to EU-IFRS.
The goodwill corresponding to BCN Diseños, S.A. de C.V. was generated upon acquisition of the holder of
the franchise rights to Massimo Dutti franchise in Mexico in 2004.
In 2005 Inditex acquired a 51% share in the Polish company previously known as Young Fashion Sp.
Z.o.o. (currently Zara Polska, S.p. Zo.o), which until then held the franchise rights to Zara in that
country, and reserved the right to acquire an additional 29% as of 1 February 2008. The voting rights of
80% of share capital had already been acquired by Inditex, being paid in August 2005, although legal
ownership of the aforementioned 29% of shares will remain with the partner until Inditex exercises the
acquisition right.
Inditex granted the seller a put option on 20% of the remaining share capital, which is exercisable
between April and May 2008 for a price conditional upon the company’s results, but with a set minimum
of euros 8 million (€8,000,000). In the event this option is not exercised, the minority interest has a
further put option on the 20% share which may be exercised as of June 2008 and which will depend
exclusively on results for the year prior to that in which the option is exercised, with no set minimum.
Inditex has a call option on the remaining 20% of the company, exercisable as of May 2011 for a strike
price which depends exclusively on the results of the company during the year prior to that in which

What is it?
What did it do in 2007?
How did it do it?
Where is it?
How is it governed?
Who forms the teams?
How does it ensure sustainability?
Economic and Financial Report
Annual Corporate Governance Report
27
the option is exercised. At 31 January 2008 a current liability has been recorded with a balancing entry
under “Goodwill” in order to recognize these put options granted to the minority shareholder.
In 2006 Inditex acquired 100% of the share capital of the Russian company previously known as Zao
Stockmann-Kranoselskaya, (currently Zao Zara CIS) which until then held the franchise rights to Zara in
that country.
In 2007, Inditex also rescinded the franchise contracts of the companies which operated the franchi-
se rights to the Pull&Bear and Stradivarius formats in Russia, thus generating goodwill of euros 428
thousand and 6,719 thousand, respectively. As indicated in note 16, in 2007 the company Fibracolor
was fully consolidated. The resulting goodwill has been completely written off during the year through
ÅgAmortization and depreciationÅh in the consolidated income statement.
The acquisitions referred to above had the following effect on the Group’s assets and liabilities in the
corresponding years:
2007 2006
Fibracolor Zao Zara CIS
Tangible assets 20,692 16,068
Other non-current assets - 7
Cash and cash equivalents - 478
Inventories 2,239 4,054
Other current assets 19,074 4,120
Current liabilities (41,603) (6,521)
Non-current liabilities (11,348) (8,862)
Minority interest (2,054)
Net identified assets and liabilities (13,000) 9,344
Goodwill - 19,822
Cost of acquisition - 29,166
Amount disbursed - 29,166
Cash acquired (2,733) (478)
Net cash outflow - 28,688

28
El fondo de comercio resultante de la adquisición o rescisión de los contratos con las franquicias corres-
ponde al importe de los intangibles que no cumplen con los requisitos establecidos por la NIIF 3 para su
reconocimiento separado. El Grupo determina el valor en uso de las mencionadas unidades generadoras
de efectivo a partir de los presupuestos aprobados por la Dirección y las expectativas de flujos de efec-
tivo futuros, sin que hasta la fecha se haya considerado necesario registrar importe alguno en concepto
de provisión por deterioro de valor (nota 32.2-g).
5.15 Financial investments
Details of and movement in financial investments during 2007 and 2006 are as follows:
Investment securities
Investments in EIGs
Bank deposits Loans and other credit facilities
Total
Balance at 01/02/2006 5,491 22,178 11,001 22,351 61,021
Acquisitions - - 2,782 1,242 4,024
Reductions - (11,535) - (20,135) (31,670)
Transfer to current assets - - - - -
Other - - - - -
Balance at 31/01/2007 5,491 10,643 13,783 3,458 33,375
Balance at 01/02/2007 5,491 10,643 13,783 3,458 33,375
Acquisitions - 24,464 - 13,136 37,600
Disposals - (20,476) - - (20,476)
Transfer to current assets - - (13,783) - (13,783)
Other - - - (542) (542)
Balance at 31/01/2008 5,491 14,631 - 16,052 36,174
Non-current investment securities mainly correspond to a euros 4,955 thousand stake in Banco
Gallego, S.A.
The investment in Economic Interest Groupings (EIGs) comprises Inditex’s shareholding in fourteen
economic interest groupings, the activity of which is the leasing of assets managed by a separate, non-
group entity which retains most of the profits and is exposed to the risks associated with this activity.
These groupings have applied the fiscal incentives established in prevailing Spanish legislation (see
note 23), the effect of which is shown under “Income tax” in the consolidated income statement.

What is it?
What did it do in 2007?
How did it do it?
Where is it?
How is it governed?
Who forms the teams?
How does it ensure sustainability?
Economic and Financial Report
Annual Corporate Governance Report
29
5.16 Investments in associate companies
In 2006, Inditex’s 39.9% stake in Fibracolor, S.A. was classified under this caption. This company ren-
ders services to several Inditex Group companies and its activity is the dyeing and printing of all types
of fabrics, as well as other related finishing processes
As of 31 January 2007 the rest of shareholders of this company were EPLICSA (Empresa de Promoció i
Localització Industrial de Catalunya, S.A.), with a 25.2% stake, and other shareholders which held not
more than 7% of share capital.
As agreed among the shareholders, EPLICSA had the right to sell its 25.2% shareholding to the other
shareholders based on their percentage ownership. This sale agreement was exercised by EPLICSA with
effect from 31 December 2007, the final deadline agreed by the interested parties. As a result, Inditex
now holds the majority of voting rights.
The investment in Fibracolor, S.A. has been treated as a subsidiary, as Inditex is understood to exercise
control over this company. The impact on the Group’s net assets, liabilities and results has not been
significant.
Movement in this caption in 2007 and 2006 has been as follows:
2007 2006
Opening balance 4,446 7,040
Loss of the year (7,508) (2,786)
Disposals 3,062 -
Other - 192
Closing balance - 4,446

30
5.17 Other non-current assetss
Details of and movement in this caption of the consolidated balance sheet during 2007 and 2006 are as
follows:
Guarantees Other Total
Balance at 01/02/2006 72,969 14,193 87,162
Acquisitions 11,978 4,968 16,946
Disposals (926) - (926)
Loss for the year - (841) (841)
Transfers (37) - (37)
Effect of movements in foreign exchange (2,807) (1,414) (4,221)
Balance at 31/01/2007 81,177 16,906 98,083
Balance at 01/02/2007 81,177 16,906 98,083
Acquisitions 23,713 5,886 29,599
Disposals (1,586) (1,880) (3,466)
Loss for the year - - -
Transfers - 300 300
Effect of movements in foreign exchange (795) (4,026) (4,821)
Balance at 31/01/2008 102,509 17,186 119,695
Guarantees mainly correspond to amounts extended to proprietors of leased commercial premises to
ensure compliance with the conditions stipulated in lease contracts (see note 24).
5.18 Trade and other payables
Details of this caption of the 2007 and 2006 consolidated balance sheets are as follows:
31/01/08 31/01/07
Trade payables 1,455,784 1,183,009
Trade payables due to associates - 91
Personnel 122,151 97,038
Public entities 296,179 242,209
Other current payables 101,137 96,479
Total 1,975,251 1,618,825

What is it?
What did it do in 2007?
How did it do it?
Where is it?
How is it governed?
Who forms the teams?
How does it ensure sustainability?
Economic and Financial Report
Annual Corporate Governance Report
31
5.19 Net financial position
Details of “Cash and cash equivalents” in the consolidated balance sheets are as follows:
31/01/08 31/01/07
Cash in hand and at banks 538,660 403,770
Short-term deposits 134,393 66,839
Fixed-income securities 792,782 435,539
Total cash and cash equivalents 1,465,835 906,148
Details of Group debt with banks are as follows:
31/01/2008 31/01/2007
Current Non-current Total Current Non-current Total
Loans 31,775 33,663 65,439 42,938 1,342 44,280
Credit facilities 333,494 - 333,494 97,394 34,129 131,523
Finance leases 6,006 8,695 14,701 3,654 11,843 15,497
Other financial debt
- - - - - -
Otras deudas financieras
- - - 1,091 - 1,091
371,276 42,358 413,634 145,077 47,314 192,391
At 31 January 2008 the Group has a drawdown limit of euros 824,982 thousand on its credit facilities
(euros 691,692 thousand at 31 January 2007).
Financial debt interest is negotiated by the Group on the respective financial markets and usually
consists of a monetary market index plus a spread in line with the solvency of the company (parent or
subsidiary) contracting the debt.
Financial debt is stated in the following currencies:
31/01/08 31/01/07
Euro 290,913 51,519
American Dollar 10,102 27,143
Other European currencies 49,600 41,515
Other American currencies 44,942 42,765
Other currencies 18,076 29,449
413,634 192,391

3232
The maturity of group debt with banks at 31 January 2008 and 2007 is as follows:
31/01/08 31/01/07
Less than one year 371,276 145,077
Between one and five years 42,358 47,314
More than five years - -
413,634 192,391
5.20 Provisions
Details of and movement in this caption of the consolidated balance sheet during 2007 is as follows:
Pensions and similar obli-gations with personnel
Liabilities Total
Balance at 01/02/2007 5,934 39,180 45,114
Provisions made during the year 1,187 11,757 12,944
Provisions used during the year (2,306) (8,153) (10,459)
Transfers (18) - (18)
Effect of movements in foreign exchange 100 - 100
Balance at 31/01/2008 4,897 42,784 47,681
Provision for pensions and similar obligations with personnel
In accordance with prevailing collective labor agreements, certain group companies are obliged to pay
retirement bonuses. The Group created a provision to cover the liability corresponding to the estimated
accrued portion at the closing date (see note 27). This liability has been externalized and therefore no
amount is recorded for this item under “Provisions” on the balance sheet.
Provision for liabilities
Given the Group’s international presence, it has certain legal, customs, tax and other contingencies.
The amounts shown here correspond to current obligations from legal claims or constructive obligations
deriving from past actions which include a probable outflow of resources that has been reliably estima-
ted. At the date of preparation of these consolidated accounts, there are no litigation proceedings the
final outcome of which could significantly affect the Company’s equity situation. The directors of Inditex
consider that the provisions recorded in the consolidated balance sheet adequately cover risks deriving
from litigation proceedings, arbitration hearings and other contingencies, and do not expect any addi-
tional liabilities to arise therefrom. Given the nature of the risks, it is not possible to estimate when any
eventual liabilities may have to be settled.

What is it?
What did it do in 2007?
How did it do it?
Where is it?
How is it governed?
Who forms the teams?
How does it ensure sustainability?
Economic and Financial Report
Annual Corporate Governance Report
33
5.21 Other non-current liabilities
Details of and movement in this caption of the consolidated balance sheet during 2007 and 2006 are as
follows:
Shareholder share options
Lease incentives Non-current payables
Other Total
Balance at 01/02/2006 77,806 114,035 - 14,522 206,363
Acquisitions 7,700 44,589 - - 52,289
Changes through profit or loss 38,786 (8,027) - - 30,759
Transfers of assets - - - - -
Disposals (94,910) - - (5,312) (100,222)
Effect of movements in foreign exchange 881 - - - 881
Balance at 31/01/2007 30,263 150,597 - 9,210 190,070
Balance at 01/02/2007 30,263 150,597 - 9,210 190,070
Acquisitions 4,043 49,119 - 1,145 54,307
Changes through profit or loss - (12,734) - - (12,734)
Transfers of assets - (781) - - (781)
Disposals - - - - -
Effect of movements in foreign exchange (726) (648) - - (1,374)
Balance at 31/01/2008 33,580 185,553 - 10,355 229,488
Additions through profit and loss have been recognized under “Other net operating income/expenses”
and “Operating expenses” (euros 2,475 thousand in 2007 and euros 39,560 thousand in 2006) (see note
5) and “Financial results” (euros 1,568 thousand in 2007 and euros 1,043 thousand in 2006) (see note
6) of the consolidated income statement.
5.22 Capital and reserves
Share capital
At 31 January 2008 and 2007, parent company share capital amounted to euros 93,499,560 and is
represented by 623,330,400 registered shares of euros 0.15 par value each, subscribed and fully paid.
All shares belong to a single class and series, have the same voting and profit sharing rights and are
represented by book entries.
Inditex shares are listed on the four Spanish stock exchanges and, consequently, the Company is
unaware of how exactly its share capital is held. According to public information registered with the
Spanish Stock Exchange Commission, at 31 January 2008 the members of the board of directors or
related companies controlled approximately 59.327% of parent company share capital, compared to
59.325% as at 31 January 2007 (see note 30).

3434
Treasury shares
Treasury shares held by the Inditex Group comprise the following:
- 41,000 treasury shares at 31 January 2008 (41,000 as at 31 January 2007) with an average
acquisition cost of euros 2.18 per share.
- 2,333,809 shares with an acquisition cost of euros 2.93 per share, corresponding to the
following operation:
At the meetings held on 20 July 2000, 19 January and 20 April 2001 the shareholders of Inditex agreed
to launch a share option plan which awarded board members and management of Inditex and its group
of subsidiaries option rights over a maximum of 3,018,400 ordinary Inditex shares of euros 0.15 par
value each.
In order to hedge the share option plan, Banco Bilbao Vizcaya Argentaria, S.A. subscribed to 3,018,400
shares of a capital increase carried out in January 2001 and signed a call option agreement in favor of
Inditex whereby the latter could acquire the shares for sale to beneficiaries in the event they exercised
their option rights. This financial entity also subscribed a swap contract with Inditex in order to set the
return on the investment in the Company’s shares and regulate the associated cash flows. Upon expiry of
this plan, 2,348,383 residual shares remained, which Inditex acquired in 2007 and recorded as treasury
shares. As described in note 27, the shareholders at an annual general meeting agreed to incorporate
these remaining shares into a new share-based remuneration plan.
5.23 Income tax
With the exception of Inditex, S.A. and Indipunt, S.L., companies whose information is incorporated in
these consolidated annual accounts file individual tax returns.
Inditex, S.A. is the parent of a group of companies which files consolidated tax returns in Spain. The
consolidated fiscal group is composed of Inditex, S.A., the parent, and Spanish subsidiaries which com-
ply with prevailing tax legislation for filing consolidated tax returns. The subsidiaries that comprise the
aforementioned tax group are the following:
Bershka Logística, S.A. Lefties España, S.A. Stear, S.A.
Bershka BSK España, S.A. Massimo Dutti Logística, S.A. Stradivarius España, S.A.
Choolet, S.A. Massimo Dutti, S.A. Stradivarius Logística, S.A.
Comditel, S.A. Nikole, S.A. Trisko, S.A.
Confecciones Fíos, S.A. Oysho España, S.A. Uterqüe España, S.A.
Confecciones Goa, S.A. Oysho Logística, S.A. Uterqüe Logística, S.A.
Denllo, S.A. Plataforma Europa, S.A. Uterqüe, S.A.

What is it?
What did it do in 2007?
How did it do it?
Where is it?
How is it governed?
Who forms the teams?
How does it ensure sustainability?
Economic and Financial Report
Annual Corporate Governance Report
35
Glencare, S.A. Plataforma Logística León, S.A. Zara España, S.A.
Goa-Invest, S.A. Plataforma Logística Meco, S.A. Zara Home España, S.A.
Grupo Massimo Dutti, S.A. Pull & Bear España, S.A. Zara Home Logística, S.A.
Hampton, S.A. Pull & Bear Logística, S.A. Zara Logística, S.A.
Inditex, S.A. Samlor, S.A. Zara, S.A.
Kiddy’s Class España, S.A. Skhuaban, S.A. Zintura, S.A.
Indipunt, S.L. is also the parent company of a separate fiscal group whose sole subsidiary is Jema Crea-
ciones Infantiles, S.A.
“Income tax payable” in the consolidated balance sheet corresponds to the 2007 income tax provision,
net of withholdings and payments on account made during the period. “Trade and other payables” inclu-
de the liability deriving from the remaining applicable taxes.
“Trade and other receivables” in the consolidated balance sheet mainly include the difference between
VAT recoverable and VAT receivable.
Inditex, S.A. holds a 49% stake in nine economic interest groupings (EIG), and during the year acquired
a 46% interest in a new EIG. The principal activity of EIG’s is the leasing of assets. These groupings re-
quested from the tax authorities, and were granted, tax incentives provided for in income tax legislation
(see note 15).
This year, these economic interest groupings generated tax loss carryforwards which reduced the income
tax expense and which Inditex, S.A. has opted to apply to the taxable period in which the annual
accounts are approved. These investments are considered as a financing operation, the estimated net re-
sult of which will be recognized over their expected lives. Forecast future years’ taxable and accounting
income have raised accrued income tax by euros 17,875 thousand.
The 2007 income tax calculation is based on profit reported for accounting purposes, obtained in
conformity with EU-IFRS, which may differ from the profit for fiscal purposes. The income tax expense
includes both current and deferred income tax as follows:
2007 2006
Current taxes 407,519 260,108
Deferred taxes (19,647) 69,394
A reconciliation of the income tax expense under the prevailing Spanish general income tax rate to
“Profit before tax” and the expense recorded in the consolidated income statement, and a reconciliation
thereof with the net income tax payable for 2007 and 2006, is as follows:

3636
2007 2006
Consolidated accounting income 1,250,269 1,001,540
Accrued income tax 387,872 329,502
Net permanent differences:
Individual companies (233,153) (30,882)
Consolidation adjustments 54,473 80,340
Offset of prior years' loss carryforwards
(15,146) (11,285)
Taxable accounting income 1,444,315 1,369,215
Tax rate 33% 35%
Total income tax 469,402 479,225
Effect of tax rates in foreign jurisdictions
(4,982) (78,664)
Tax credits and deductions (65,673) (161,618)
Foreign witholding taxes 15,750 14,578
Other adjustments (26,625) 75,981
Income tax expense 387,872 329,502
Temporary differences 19,647 (69,394)
Net income tax 407,519 260,108
Positive permanent differences mainly correspond to non-deductible expenses, charges to non-de-
ductible provisions and the portion of the contribution of rights to use certain assets to a subsidiary
attributable to taxable income.
Negative permanent differences basically correspond to tax loss carryforwards generated by the econo-
mic interest groupings.
Temporary differences have given rise to the corresponding deferred tax assets and liabilities, details of
which for 2007 and 2006 are as follows:
Deferred tax liabilities: 2007 2006
Lease operations 3,924 4,297
Intragroup operations 50,577 40,792
Amortization 13,910 17,456
Reinvestment of profits 4,304 4,719
Other 38,242 37,055
Total 110,957 104,319
Deferred tax assets: 2007 2006
Provisions 17,881 15,791

What is it?
What did it do in 2007?
How did it do it?
Where is it?
How is it governed?
Who forms the teams?
How does it ensure sustainability?
Economic and Financial Report
Annual Corporate Governance Report
37
Amortization 1,505 6,327
Tax losses 24,895 31,250
Other 37,875 35,483
Total 82,156 88,851
These balances have been determined based on tax rates which, according to enacted fiscal legislation,
will be in force during the year in which the balances are expected to reverse and which, in certain
cases, differ from the tax rates prevailing this year.
The difference between balances calculated at the prevailing and new tax rates has impacted accrued
income tax.
As permitted by the prevailing tax legislation in each country, group companies have applied tax credits
amounting to euros 65,673 thousand. Although these companies have, in general, not yet filed their in-
come tax returns for 2007, deductions and credits of euros 116,538 thousand have been included in the
income tax provision, which is shown in the accompanying annual accounts. The surplus included in the
calculation of the provision for the current year corresponds to credits which were unable to be applied
in the previous year due to a shortfall in income tax. The deferred tax asset recognized in the previous
year has been cancelled with a charge to accrued income tax.
At 31 January 2008, the Group has tax losses of euros 138,053 (euros 109,154 thousand at 31 January
2007) which may be offset against future profits, the majority of which may be utilized indefinitely. De-
ferred tax assets in respect of tax losses are only recognized when there is evidence that future taxable
profits will be available against which the asset can be utilized.
Years open to inspection by the tax authorities for all main applicable taxes vary depending on the tax
legislation in each country. The directors do not expect that any significant additional liabilities affec-
ting Group equity or results would arise in the event of inspection.
5.24 Operating leases
Most of the commercial premises from which the Group carries out its retail distribution activities are
leased from third parties. These rental contracts are classified as operating leases since, irrespective of
the lease term and the amounts paid or due to the owners of the leased premises, there is no transfer of
risks and rewards inherent to ownership.
Due to the presence of the Group in different countries, the variety of legislation governing lease con-
tracts, the diverse nature and economic status of the owners and other factors, there is a broad range of
clauses regulating lease contracts.

38
In many cases the lease contracts simply establish a fixed rental payment, normally monthly, adjusted
for inflation based on a price index. In other cases the amounts payable to the lessor are a percentage
of the sales obtained by the Group in the leased premises. These variable lease payments or contingent
rent may have minimum guaranteed amounts or certain rules of calculation attached. In some countries
lease contracts are periodically indexed to market rates, which on occasion entails an increase in rent,
but not when market rates are lower. Occasionally, staggered rental payments are agreed, which means
cash outflows can be reduced during the initial years of commercial premises use, even if the expense is
recognized on a straight-line basis (see note 32.2-p). Free rental periods are also frequently established
in order to avoid having to pay rent when premises are being refurbished and prepared for opening.
Rental contracts also sometimes require lessees to pay certain amounts to the lessor, which, from an
economic perspective, could be considered advance rental payments, or to the previous tenants so that
they waive certain rights or transfer them to the Group (transfer rights or different types of indemni-
ties). These amounts are recognized as non-current assets (see note 13) and are generally amortized
over the term of the lease contract.
On certain occasions, shopping center developers or the proprietors of leased premises make contri-
butions towards the establishment of the Group’s business in their premises. These contributions are
treated as lease incentives (see note 21) and are taken to income over the lease term.
A wide variety of situations also apply to the duration of lease contracts, which generally have an
initial term of between 15 and 25 years. However, legislation in certain countries or the situations in
which lease contracts are typically used means the duration of contacts is sometimes shorter. In some
countries, legislation or the lease contracts themselves protect the right of the lessee to terminate the
contract providing sufficient advance notice (e.g. three months) is given. In other cases, however, the
Group is obliged to comply with the full term of the contract, or at least a significant part thereof. Some
contracts combine these undertakings with termination clauses that may only be exercised at certain
times over the term of the contract (e.g. every five years or at the end of the tenth year).
Details of operating lease expenses are as follows:
2007 2006
Minimum installments 701,410 587,304
Contingent installments 153,968 130,611
855,378 717,915
Sub-leasing collections 2,046 4,269

What is it?
What did it do in 2007?
How did it do it?
Where is it?
How is it governed?
Who forms the teams?
How does it ensure sustainability?
Economic and Financial Report
Annual Corporate Governance Report
39
Future minimum payments and receipts under non-cancelable operating leases are as follows:
2007 2006
Less than 1 year
Between 1 and 5 years
More than 5 years
Less than 1 year
Between 1 and 5 years
More than 5 years
Lease payments 533,457 1,099,425 799,299 466,687 957,015 701,686
5.25 Finance leases
The Group has contracted finance leases mainly for commercial premises and logistics centers. The co-
rresponding leased assets are recorded under tangible assets in the consolidated balance sheet (see note
11), while the related debt is recognized as a financial liability (see note 19). The net carrying amount
of items acquired under lease financing and the future amounts payable until the leases expire are as
follows:
31/01/08 31/01/07
Cost of the asset 54,386 62,600
Accumulated depreciation (12,310) (13,836)
42,076 48,764
Minimum payments
31/01/08 31/01/07
Less than one year 6,006 5,588
Between one and five years 8,695 17,682
More than five years - 492
14,701 23,762
5.26 Risk management and financial instruments
Financial risk management policies
The Group’s activities are exposed to certain types of financial risk: market risk (including exchange rate
risk), credit risk, liquidity risk and interest rate risk on cash flows. The Group’s risk management policy
centers on the uncertainty of financial markets and attempts to minimize the potential adverse effects
on the Group’s profitability through the use of certain financial instruments as described below.
This note provides information on the Group’s exposure to each of the aforementioned risks, the Group’s
objectives, policies and processes for managing risk, the methods used to measure these risks and any
changes from the previous year

40
Exchange rate risk
The Group operates in an international environment and, accordingly, is exposed to exchange rate risk,
particularly from the US Dollar, and to a lesser extent, the Mexican Peso, the Japanese Yen and the
Pound Sterling. Exchange rate risk arises on future commercial transactions, assets and liabilities recor-
ded in foreign currencies and net investments in foreign businesses.
In order to control the exchange rate risk on future commercial transactions and assets and liabilities
recorded in currencies other than the Company’s functional currency, group companies use forward
exchange contracts. The Group manages each currency’s net position through external forward foreign
currency contracts or other financial instruments.
The Group has various investments in foreign businesses, the net assets of which are exposed to exchan-
ge rate risk which is managed in line with Group management policies.
During 2007, had the value of the euro increased by 10% compared to the US Dollar and, as a result,
compared to the rest of the foreign currencies linked to the US Dollar, all other things being equal, con-
solidated profit after income tax would have been approximately euros 48,524 thousand higher (euros
47,213 thousand in 2006), primarily because of the conversion of subsidiaries’ financial statements
expressed in currencies other than the euro, and the impact on the portion of merchandise purchases in
US Dollars not covered by exchange-rate hedges.
Credit risk
The Group is not exposed to significant concentrations of credit risk, as policies are in place to cover
sales to franchises and retail sales comprise the vast majority of revenue. Collections are primarily made
in cash or through credit card payments.
The Group also limits its exposure to credit risk by investing solely in products that have high liquidity
and credit ratings.
Provision is made for the impairment of trade receivables when objective evidence exists that the Group
will be unable to recover all the outstanding amounts in accordance with the original contractual con-
ditions of the receivables. The provision amounts to the difference between the asset’s carrying amount
and the present value of estimated cash flows, discounted at the effective interest rate, and is recogni-
zed in the income statement. Charges to the provision during the year as a result of value adjustments
to the balances recorded under this caption have not been significant.
At 31 January 2008 and 2007 no significant outstanding balances exist. Furthermore, based on available
historical data, the Group does not consider it necessary to make value adjustments to receivables which
are not past due. The fair value of receivables is equal to their carrying amount.

What is it?
What did it do in 2007?
How did it do it?
Where is it?
How is it governed?
Who forms the teams?
How does it ensure sustainability?
Economic and Financial Report
Annual Corporate Governance Report
41
The Group’s policy is to only extend financial guarantees to subsidiaries.
Liquidity risk
The Group is not exposed to significant liquidity risk, as it maintains sufficient cash and cash equiva-
lents to meet the outflows of normal operations. In the event the Group requires financing, either in
euros or in other currencies, it reverts to loans, credit facilities or other types of financial instruments
(see note 19).
Details of financial liabilities are disclosed in note 19, along with their expected maturities. The fair
value of these financial liabilities does not differ substantially from their carrying amount.
Interest-rate risk
Interest rate fluctuations affect the fair value of assets and liabilities which accrue a fixed rate of
interest, as well as future cash flows from assets and liabilities indexed to a variable interest rate. Group
exposure to this risk is not significant for the reasons mentioned above.
The Group does not have any financial assets or liabilities at fair value through profit or loss or interest-
rate financial derivatives. Consequently, any changes in interest rates at year end will not significantly
affect consolidated profits.
Capital management
The Group’s capital management objectives are to safeguard the Group’s ability to continue operating
as a going concern so that it can continue to generate returns for shareholders, benefit other interested
parties, and maintain an optimal capital structure to reduce the cost of capital.
The Group manages its capital structure and makes adjustments thereto in response to changes in eco-
nomic conditions. No significant changes to capital management have been made during the year.
Neither the Company or Inditex group subsidiaries are subject to strict capital management criteria.
Financial instruments
Merchandise and goods for resale are partly acquired from foreign suppliers in US Dollars. In accordance
with prevailing exchange rate risk policies, group Management contracts derivatives, mainly forward
contracts, to hedge cash flow fluctuations related with exchange rates.
42
Moreover, and as described in note 32.2.n), the Group applies hedge accounting to mitigate the volatile
effect that contracting hedge instruments prior to recording the associated transactions would have on
the consolidated income statement.
Consequently, the fair value of hedging derivatives has been recognized in equity during the year. A
total of euros 1,626 thousand (euros 1,130 thousand in 2006) was reclassified to the income statement,
the hedged portion of which was recognized under cost of sales and the speculative portion under net
financing revenue/(costs). The ineffective portion of hedging derivatives has not been significant and
has also been taken to net financing revenue/(costs).
At 31 January 2008 the Group held derivatives, mainly forward purchases and options, in US Dollars
and Pounds Sterling for a par value of approximately US Dollars 529,950 thousand and Pounds Sterling
9,100 thousand, respectively (US Dollars 387,800 thousand and Pounds Sterling 33,000 thousand at 31
January 2007), and Mexican Pesos 895,000 thousand.
The fair value of forward exchange-rate contracts has been calculated based on market value, whe-
re available, and has otherwise been estimated by discounting the difference between the amount
contracted and the value of the contract at year end at a risk-free rate, taking into account its residual
maturity.
Approximately 60% of cash flows associated with hedges in US Dollars are expected to be generated
during the seven months subsequent to year end, while the remaining 40% is expected to be generated
within six months to a year. It is also likely that the impact on consolidated profit and loss will arise
during these periods.
Details of the various financial asset and liability categories are disclosed in notes 15 and 19. No
amount has been recognized for the impairment of financial assets during 2007.
5.27 Employee benefits
Defined benefit or contribution plan obligations
In general, the Group has no defined benefit or contribution plan obligations with its employees.
However, in line with prevailing labor legislation or customary practice in certain countries, the Group
assumes certain commitments related with the payment of specific amounts for accidents, illness, reti-
rement, etc., to which employees sometimes contribute. The associated risk is partially or fully externa-
lized through insurance policies. Furthermore, in some countries employees receive a share of company
profits. The liabilities associated with these items are recognized under “Trade and other receivables”
and “Other non-current liabilities” in the consolidated balance sheet. The impact of these obligations on
the consolidated income statement and the consolidated balance sheet is not significant.

What is it?
What did it do in 2007?
How did it do it?
Where is it?
How is it governed?
Who forms the teams?
How does it ensure sustainability?
Economic and Financial Report
Annual Corporate Governance Report
43
Share-based payments
At their respective meetings held on 18 July 2006, the directors and shareholders of Inditex agreed to
a share-based payment plan (hereinafter the Plan) whereby certain group employees would receive free
on 1 October 2008 ordinary Inditex shares of euros 0.15 par value each belonging to the same class and
series as the remaining shares of the Company.
Through this Plan, beneficiaries are assigned an initial number of “units” (not shares) in order to deter-
mine the number of shares they will receive, which is based on the number of units that can be conver-
ted into shares in line with the conditions attached. These units are not transferable to third parties,
inter vivos or causa mortis, who may only entitled to compensation in the event of early settlement
deriving from the death of a beneficiary.
The Plan is aimed at members of the management team, including two executive board members and
seven general managers, and other key employees of the Inditex Group.
The Plan is limited to a maximum of 2,348,383 shares, equivalent to 0.37% of share capital, which is
the surplus amount of a previous share option plan. These shares were issued through a capital increase
subscribed by a financial entity in order for the Company to fulfill its commitments with the benefi-
ciaries of the plan. The Company acquired these shares by exercising its call option with the financial
entity.
The Plan came into effect on 18 July 2006, the date on which the shareholders approved the Plan, and
vests on 1 October 2008, when the beneficiaries’ right to receive the shares materializes, without preju-
dice to any early settlement.
One of the conditions for receiving shares is that the beneficiary must be employed by Inditex or any In-
ditex group company on the Plan’s vesting date, 1 October 2008, except in the case of early settlement
(e.g. death, retirement, unfair dismissal or maternity leave), in which case the number of convertible
units would be calculated in proportion to the time elapsed since the grant date (18 July 2006) and the
Plan’s vesting date (1 October 2008).
The final number of shares to be received upon vesting of the Plan will depend on the share’s reva-
luation in accordance with the conditions established by the board of directors: beneficiaries will be
entitled to receive 100% of the shares corresponding to the units initially assigned when the average
quotation price during 2006 and 2007 exceeds the weighted average quotation price during the last
quarter of 2005 by a certain percentage established by the board of directors, based on the different
forecast revaluation scenarios.
Fair value at the plan concession date was estimated at euros 48,046 thousand using commonly accep-
ted valuation techniques, taking into account assumptions corresponding to the value of the share at

4444
the grant date, the average quotation, interest rates, the dividend payable or “dividend yield” and vola-
tility. Personnel expenses recorded in the consolidated income statement for the year amount to euros
22,139 thousand (euros 11,100 thousand in 2006), with a balancing entry in equity.
5.28 Interest in joint ventures
Inditex has a 50% stake in the group formed by the parent Tempe, S.A. and its subsidiaries Tempe Méxi-
co, S.A. de C.V., Tempe Brasil, S.A. and Tempe Logística, S.A. The principal activity of these companies
is the design, supply and distribution of footwear to Inditex Group companies, their main customer.
The assets, liabilities, income and expenses of this joint venture which have been consolidated are as
follows:
2007 2006
Non-current assets 24,238 12,127
Current assets 80,231 91,547
Non-current liabilities (832) (752)
Current liabilities (50,839) (47,652)
Net assets 52,798 55,270
Revenues (*) 253,123 229,094
Expenses (215,930) (201,920)
(*) Revenues to third parties: 31,988 and 24,835 thousand euros in 2007 and 2006, respectively.
5.29 Proposed distribution of parent company profit
The directors will propose that the 2007 net profit of the parent company, which amounts to euros
699,699 thousand, be distributed as follows: euros 652,000 thousand as dividends (euros 1.05 per sha-
re) and euros 47,699 thousand to voluntary reserves.5.30 Remuneración de consejeros y transacciones
con partes vinculadas
Remuneration of the board of directors
Remuneration received by the board of directors and senior management during 2007 is shown in the
section on transactions with related parties.
As in 2006, the Group has no commitments in respect of pension plans or life insurance schemes.

What is it?
What did it do in 2007?
How did it do it?
Where is it?
How is it governed?
Who forms the teams?
How does it ensure sustainability?
Economic and Financial Report
Annual Corporate Governance Report
45
Other information concerning the board of directors
According to the public registers of the Spanish Stock Exchange Commission (CNMV), at 31 January 2008
the members of the board of directors held the following direct and indirect investments in the share
capital of Inditex:
Name or company name of director
Number of direct shares
Number of indirect shares
Percentage of capital
Mr. Amancio Ortega Gaona - 369,600,063 (1) 59.294%
Mr. Pablo Isla Álvarez de Tejera 39,800 - 0.006%
Mr. Carlos Espinosa de los Monteros Bernaldo de Quirós
37,000 - 0.006%
GARTLER, S.L. 311,727,598 - 50.010%
Mr. Francisco Luzón López - - 0%
Ms. Irene R. Miller 30,239 - 0.005%
Mr. Juan Manuel Urgoiti López de Ocaña 27,739 - 0.004%
Mr. José Luis Vázquez Mariño 5,000 - 0.000%
Mr. Antonio Abril Abadín 76,015 - 0.012%
Total 59.327%
(1) Through Gartler, S.L. and Partler 2006, S.L.
Transactions with related parties
Related parties are subsidiaries, joint ventures and associates, details of which are shown in Appendix I
to the consolidated annual accounts, as well as significant or controlling shareholders, members of the
board of directors of Inditex and key management.
Inditex Group companies
Operations between Inditex and its subsidiaries form part of regular activities and have been fully elimi-
nated in the consolidation process and are therefore not shown in this note.
Details of operations between Inditex and its joint ventures or associates, which have not been comple-
tely eliminated in the consolidation process as they are proportionately consolidated or accounted for
using the equity method, are as follows:
Company Thousands of euros
2007 2006
Associates -- (7,515)
Joint ventures (221,135) (193,749)

46
Details of operations with significant shareholders, the members of the board of directors and manage-
ment are as follows.
Significant shareholders
According to the information in the public registers of the Spanish Stock Exchange Commission,
Gartler, S.L. holds 50.010% of Industria de Diseño Textil, S.A. and is, therefore, the controlling
shareholder of the Inditex Group. During 2007 and 2006, operations carried out by the Inditex Group
with the controlling shareholder, or with related persons or companies, are as follows:
2007:
Nature of the relationship Type of operation Amount (thousands €)
Contractual Asset leasing (6,104)
Contractual Asset leasing 279
Contractual Works 4,544
2006:
Nature of the relationship Type of operation Amount (thousands €)
Contractual Asset leasing (5,460)
Contractual Asset leasing 138
Contractual Works 4,598
According to the table above, the Inditex Group has earned income on transactions with persons or
companies related to the controlling shareholder amounting to euros 5,054 thousand. These transactions
correspond mainly to construction works performed by the group company Goa-Invest, S.A., which were
carried out under market conditions.
Various group companies have leased commercial premises belonging to companies related to the con-
trolling shareholder. The majority of these lease contracts were signed prior to 1994 and mature between
2014 and 2016. According to the table above, lease payments made by the Group on the aforementioned
premises in 2007 amounted to euros 6,104 thousand.
Members of the board of directors and management
Total remunerations and indemnities received by Inditex board members and management during 2007
are as follows:

What is it?
What did it do in 2007?
How did it do it?
Where is it?
How is it governed?
Who forms the teams?
How does it ensure sustainability?
Economic and Financial Report
Annual Corporate Governance Report
47
Board members Management
Remunerations 4,518 10,179
Indemnities - 560
Share-based payments - -
Total remunerations and indemnities received by Inditex board members and management during 2006
are as follows:
Board members Management
Remunerations 3,950 9,395
Indemnities - -
Share-based payments - -
During 2006, Inditex approved a share-based payment plan aimed at the management team, including
two executive board members, and other key employees of the Inditex Group, the features of which are
described in note 27.
As regards transactions with related parties, details of the maximum number of shares receivable by key
management personnel, board members and senior management upon vesting of the Plan (1 October
2008), providing all terms and conditions are met, are as follows:
Minimum no. of shares Maximum no. of shares % of capital
Board members 121,500 0.019
Management - 441,426 0.073
In 2007, a part of this plan was partially liquidated, being provided one manager with 14,574 shares.
Finally and as part of the operations with directors or individuals related to the directors, the Inditex
Group has received income of euros 231 thousand during 2007. This income is from the construction
work performed by the Group’s construction company Goa-Invest, S.A., which was performed at arm’s
length.
5.31 External auditors
Details of fees and expenses accrued by KPMG Auditores, S.L. (main auditor) and associated firms in
relation to services rendered to consolidated companies are as follows:
2007 2006
Audit services 3,433 3,232
Other services 360 309
Total 3,793 3,541

4848
In addition to the audit of the Inditex Group annual accounts, audit services rendered by KPMG Audito-
res, S.L. also include certain audit work related with the external audit.
Non-audit services, mainly relating to corporate social responsibility, include inspection of suppliers’
workshops and factories and other services rendered to certain foreign group subsidiaries
According to information received from the auditors, fees received from the Inditex Group by KPMG
International or associated firms do not exceed 0.027% of total revenue.
5.32 Selected accounting policies
5.32.1 Basis of consolidation
a) Subsidiaries
Subsidiaries are those entities controlled by the parent company. Control exists when the pa-
rent company has the power, directly or indirectly, to govern financial and operating policies.
Subsidiaries are consolidated by aggregating the total amount of assets, liabilities, income,
expenses and cash flows, after carrying out the adjustments and eliminations relating to
intragroup operations. The results of subsidiaries acquired during the year are included in the
consolidated annual accounts from the date that control commences.
Net identifiable assets acquired, liabilities and contingent liabilities assumed as part of a
business combination are stated at fair value at the date of acquisition, providing this has
taken place after 1 January 2004, the date of transition to EU-IFRS. Any excess over the fair
value of identifiable assets acquired, liabilities and contingent liabilities assumed at that date
is recognized as goodwill, and otherwise is recorded as income for the year. Acquisitions of
entities prior to this date were recognized in accordance with generally accepted accounting
principles in Spain once all necessary corrections and adjustments at the transition date were
taken into account. In accordance with EU-IFRS, goodwill is not amortized but is systemati-
cally tested for impairment. Minority interest shown in the consolidated statement of changes
in equity corresponds to investments held in group companies prior to the date of transition
to EU-IFRS. Consequently, these investments are measured at an amount equivalent to the
percentage of the net carrying amount of the assets and liabilities of the companies of which
they are shareholders.
Any loss attributable to minority interest exceeding their interest is assumed by the Group
when preparing its annual accounts. Minority interest in the equity and results of subsidiaries
is presented under “Net equity attributable to minority interest” and “Profit attributable to mi-
nority interest”, respectively. Details of subsidiaries, joint ventures and associates are provided
in Appendix I.

What is it?
What did it do in 2007?
How did it do it?
Where is it?
How is it governed?
Who forms the teams?
How does it ensure sustainability?
Economic and Financial Report
Annual Corporate Governance Report
49
b) Joint ventures
Joint ventures are those entities over whose activities the Group has joint control, established
by contractual agreement. The consolidated annual accounts include, in each individual caption
of the balance sheet and income statement, the Group’s proportionate share in these entities’
assets, liabilities, revenue, expenses and cash flows from the date that joint control commen-
ces until the date that joint control ceases.
c) Associates
Associates are those entities in which the Group has significant influence, but not control or
joint control, over the financial and operating policies. The consolidated annual accounts inclu-
de the Group’s share of the total recognized gains, losses, assets and liabilities of associates
on an equity accounted basis, from the date that significant influence commences until the
date that significant influence ceases. When the Group’s share of losses exceeds its interest in
an associate, the Group’s carrying amount is reduced to nil and recognition of further losses
is discontinued except to the extent that the Group has incurred legal obligations or made
payments on behalf of an associate.
d) Harmonization of criteria
Each of the entities included in the consolidated group prepares its annual accounts and other
accounting records in accordance with accounting policies and legislation applicable in the
country of origin. When these accounting criteria and policies are different to those adopted
by Inditex in the preparation of its consolidated annual accounts, they have been adjusted in
order to present the consolidated annual accounts using homogenous accounting principles.
e) Intragroup eliminations
Intragroup balances and transactions, and any unrealized gains or losses arising from tran-
sactions with third parties, are eliminated in the consolidation process. In the case of jointly
controlled entities, balances, revenues and expenses between intragroup companies, and any
unrealized gains or losses arising from transactions with third parties, are eliminated in the
consolidation process to the extent of the Group’s interest in the entity. Unrealized gains or
losses arising from transactions with associates are eliminated from the consolidated annual
accounts to the extent of the Group’s interest in the entity.
f) Translation of foreign currency operations
The Group has applied the exemption relating to accumulated translation differences from IFRS
1 First-time Adoption of International Financial Reporting Standards and therefore, any trans-

5050
lation differences recognized in the consolidated annual accounts generated prior to 1 January
2004 are recorded under reserves. Since that date, the financial statements of entities with a
functional currency other than the euro are translated as follows:
- Assets and liabilities are translated to euro at foreign exchange rates ruling at the
balance sheet date.
- Items that comprise the net equity of these entities are translated to euro at historical
exchange rates (or, for accumulated results, at the average exchange rate for the year
in which they were generated).
- Revenues and expenses are translated to euro at the average exchange rate for the year.
Differences arising from the application of these exchange rates are included in consolidated
equity under “Translation differences”.
Foreign exchange differences of consolidated companies deriving from monetary operations
with other consolidated entities which, in substance, form part of the net investment made
by the Group in foreign entities, and whose collection or payment is not foreseeable or is not
likely to occur, are classified as consolidated equity until disinvestment in the subsidiary takes
place, at which time the differences are recognized as income or expense for the year.
Exchange differences deriving from trade balances payable and receivable and financing ope-
rations between group companies, with foreseeable settlement, are recognized in the income
statement for the year.
f) Financial statements in hyperinflationary countries
The financial statements of foreign operations in countries considered to have hyperinflationary
economies have been adjusted prior to translation to euro to account for the effect of changes
in prices.
g) Entities with a closing date different to that of the Group
Entities with a closing date different to that of the consolidated accounts have been consoli-
dated with the financial statements at their closing date (31 December 2007; see Appendix I).
Significant operations carried out between the closing date of these subsidiaries and that of
the consolidated accounts are harmonized accordingly.

What is it?
What did it do in 2007?
How did it do it?
Where is it?
How is it governed?
Who forms the teams?
How does it ensure sustainability?
Economic and Financial Report
Annual Corporate Governance Report
51
h) Changes to the consolidated group
The following entities were incorporated and consolidated for the first time during the year:
Zara Macau, Ltd. Pull & Bear Magyaroszg Massimo Dutti Hong Kong Bershka Ukraine, LTD
Zara Croatia, Ltd. Pull & Bear Ro, Srl Massimo Dutti Polonia Stradivarius Magyaroszg
Zara Bucuresti, Srl Pull and Bear Ukraine, LTD Massimo Dutti Ro, Srl Stradivarius Croacia, LTD.
Zara Ukraine LLC Pull & Bear Slovakia, S.R.O. Massimo Dutti Macau Ltd. Stradivarius Slovakia, S.R.O.
Zara Slovakia, S.R.O. Pull & Bear Croacia, LTD Massimo Dutti Ukraine, LTD Stradivarius Ro, Srl
Zara Retail Corea, Ltd. Oysho Ukraine, LTD Bershka Croatia, Ltd. Stradivarius Ukraine, LTD
Inditex Vastgoed Corea, Ltd. Oysho Hungria Bershka Magyaroszg Zara Home Ro, Srl
Uterqüe España, S.A. Oysho Ro, Srl Bershka Slovakia, S.R.O. Zara Home CIS
Uterqüe Logística, S.A. Oysho France, S.A.R.L. Bershka Carpati, Srl Zara Home Ukraine, LTD
Furthermore, as explained in note 16, Fibracolor, S.A. is now considered as a subsidiary.
The companies named Sircio, S.A. and Kettering, S.A. at 31 January 2007 have changed their name
during the year to Plataforma Logística Meco, S.A. and Skhuaban, S.A. respectively. The company named
Often España, S.A. at 31 January 2007 has also changed its name to Uterqüe, S.A.
The following companies are no longer consolidated: Zara Venezuela, S.A., Pull&Bear Venezuela, S.A. and
Bershka Venezuela, S.A.
The changes in the consolidated Group referred to in the previous paragraphs have not had a material
impact on the consolidated annual accounts for 2007.
5.32.2 Accounting principles
In 2007, the Group applied IFRS 7 “Financial Instruments: disclosures” for the first time and disclosed
new information on the capital management objectives, criteria and principles referred to in IAS 1.124A
and subsequent paragraphs. The changes contained in the new standard, which became effective for
accounting periods ended on or after 1 January 2007, affect the disclosure requirements to be included
in the primary financial statements and are summarized in notes 6, 15, 19 and 26 to these consolidated
accounts.
The International Accounting Standards Board (IASB) has published the following standards which are
pending adoption by the European Union and which will become effective for accounting periods ended
on or after the dates indicated for each case:
- Amendments to the presentation of financial statements (1 January 2009);
- Amendments to IAS 23: Borrowing Costs (1 January 2009);

5252
- Amendments to IAS 27: Consolidated and Separate Financial Statements (1 January 2009);
- Amendments to IFRS 2: Vesting Conditions and Cancellations (1 January 2009);
- IFRS 3 (revised) Business Combinations (1 January 2009);
- IFRIC 13 Customer Loyalty Programmes (1 July 2008);
- IFRIC 14 and IAS 19 – The Limit on a Defined Benefit Asset, Minimum Funding. Requirements and
their Interaction (1 January 2008);
The European Union has adopted IFRS 8 Operating Segments, which will become effective for accounting
periods ending on or after 1 January 2009. The directors of the Company have not implemented early
application of the standards and interpretations listed above. Moreover, the adoption of new standards
is not expected to have a material effect on the Group’s consolidated annual accounts.
The preparation of the consolidated annual accounts requires Inditex Group management to make
judgments and estimates that affect the application of policies and reported amounts of certain assets,
liabilities, income and expenses. The estimates are reviewed on an ongoing basis and are based on
historical experience and various other factors, including expectations of future events that are believed
to be reasonable under the circumstances. These estimates mainly refer to the valuation of assets to
determine the existence of impairment losses, the useful lives of property, plant and equipment and
intangible assets, as well as the likelihood of occurrence of undetermined or contingent liabilities.
Although these estimates have been made on the basis of the best information available on the matters
analyzed at the time of preparing these consolidated annual accounts, it is possible that events may
take place in the future which could make it necessary to amend, increase or decrease these estimates
in future accounting periods, which would be carried out prospectively, recognizing the effects of the
change in estimation in the corresponding future consolidated annual accounts.
a) Foreign currency transactions
Foreign currency transactions are translated to euro using the exchange rate ruling at the date of
the transaction. Monetary assets and liabilities denominated in foreign currencies at the balance
sheet date are translated to euro at the foreign exchange rate ruling at that date. Foreign exchange
differences arising on translation are recognized in the income statement as financial results.
Differences arising from the application of these exchange rates are included in consolidated
equity under “Translation differences”.
Cash flows from transactions in foreign currency are translated into euro in the consolidated
cash flow statement at the exchange rate prevailing at the transaction date. The effect of
variations in exchange rates on cash and cash equivalents expressed in foreign currencies is
presented separately in the consolidated cash flow statement under “Effect of exchange rate
fluctuations on cash and cash equivalents”.
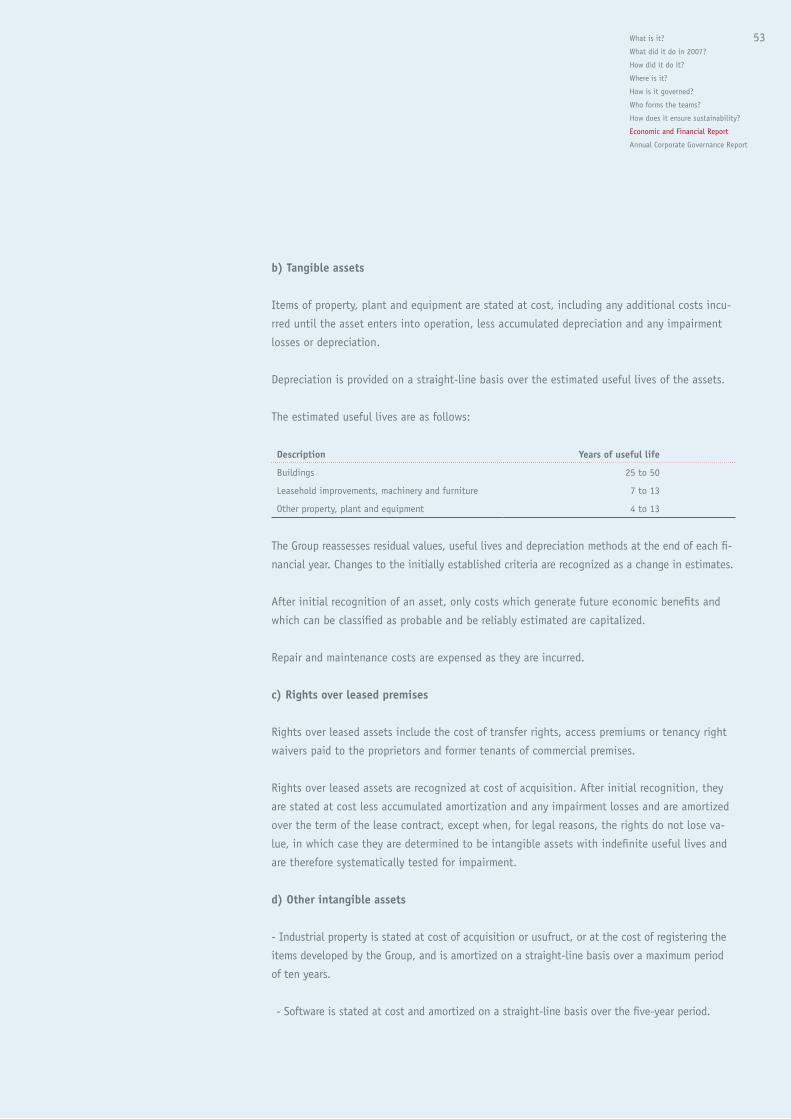
What is it?
What did it do in 2007?
How did it do it?
Where is it?
How is it governed?
Who forms the teams?
How does it ensure sustainability?
Economic and Financial Report
Annual Corporate Governance Report
53
b) Tangible assets
Items of property, plant and equipment are stated at cost, including any additional costs incu-
rred until the asset enters into operation, less accumulated depreciation and any impairment
losses or depreciation.
Depreciation is provided on a straight-line basis over the estimated useful lives of the assets.
The estimated useful lives are as follows:
Description Years of useful life
Buildings 25 to 50
Leasehold improvements, machinery and furniture 7 to 13
Other property, plant and equipment 4 to 13
The Group reassesses residual values, useful lives and depreciation methods at the end of each fi-
nancial year. Changes to the initially established criteria are recognized as a change in estimates.
After initial recognition of an asset, only costs which generate future economic benefits and
which can be classified as probable and be reliably estimated are capitalized.
Repair and maintenance costs are expensed as they are incurred.
c) Rights over leased premises
Rights over leased assets include the cost of transfer rights, access premiums or tenancy right
waivers paid to the proprietors and former tenants of commercial premises.
Rights over leased assets are recognized at cost of acquisition. After initial recognition, they
are stated at cost less accumulated amortization and any impairment losses and are amortized
over the term of the lease contract, except when, for legal reasons, the rights do not lose va-
lue, in which case they are determined to be intangible assets with indefinite useful lives and
are therefore systematically tested for impairment.
d) Other intangible assets
- Industrial property is stated at cost of acquisition or usufruct, or at the cost of registering the
items developed by the Group, and is amortized on a straight-line basis over a maximum period
of ten years.
- Software is stated at cost and amortized on a straight-line basis over the five-year period.

54
e) Financial investments
Financial instruments which represent less than 20% of share capital are stated at fair value.
f) Propiedades de inversión
f) Investment property
Investment properties are assets held to generate rental income, capital appreciation or both,
and are stated at cost of acquisition less accumulated depreciation and any impairment losses
or depreciation. Depreciation is calculated on a straight-line basis over the useful lives of the
corresponding assets.
Details of the market value of investment properties are shown in note 12.
g) Impairment
The Group systematically tests for impairment of consolidated assets which are not conside-
red biological assets, financial assets, inventories, deferred tax assets and non-current assets
classified as held for sale, in order to determine whether the carrying amount exceeds the reco-
verable value (impairment). In order to do this, the Group has developed a general, systematic
procedure for carrying out these impairment tests based on the monitoring of certain events or
circumstances such as the performance of commercial premises, operating decisions regarding
the continuity of a particular location, or other circumstances which indicate that the value of
an asset may not be recovered in full.
The recoverable amount of goodwill or assets with indefinite useful lives is estimated at the
closing date, and thereafter at least once a year.
Calculation of recoverable amount
The recoverable amount of assets is the higher of fair value less selling costs and value in use.
Value in use takes into account expected future cash flows deriving from the use of the asset,
forecast variations in the amount or distribution of the cash flows, the time value of money,
the risks specific to the asset and other current market assessments.
The recoverable amount is calculated for individual assets unless they do not generate largely
independent cash flows, in which case the recoverable amount is determined for the cash-
generating unit (CGU) to which the asset belongs.

What is it?
What did it do in 2007?
How did it do it?
Where is it?
How is it governed?
Who forms the teams?
How does it ensure sustainability?
Economic and Financial Report
Annual Corporate Governance Report
55
Based on actual management of operations, the Group has defined each of the commercial
premises in which it carries out its activities (stores) as basic cash generating units, although
these basic units can be aggregated to chain-country level, or even to all the companies loca-
ted in the same country. Group assets which are not clearly assignable under this scheme (for
example industrial or logistical assets) are treated separately within the context of this general
policy according to their specific nature.
Impairment losses recognized for cash-generating units are initially allocated to reduce good-
will attributed to the CGU and then to the other assets of the CGU pro rata on the basis of the
carrying amount of each of the assets.
Reversals of impairment
Impairment losses in respect of goodwill are not reversed in subsequent years. For assets other
than goodwill, impairment losses are reversed if there has been a change in the estimates used
to determine the recoverable amount.
An impairment loss is reversed only to the extent that an asset’s carrying amount does not
exceed the carrying amount that would have been determined, net of depreciation or amortiza-
tion, if no impairment loss had been recognized.
The reversal of an impairment loss in a cash generating unit is distributed among its assets,
except for goodwill, which is distributed in accordance with its carrying amount and taking
into account the limitation set out in the previous paragraph.
Impairment losses are debited to amortization and depreciation in the consolidated income
statement. Reversals of impairment losses on assets other than goodwill are credited to this
account once internal or external sources of information have been analyzed and it can be con-
cluded that the impairment indicators which determined the recognition of value adjustments
no longer exist or have been partially mitigated.
h) Receivables
Trade and other receivables are recognized at fair value. After initial recognition, they are sta-
ted at amortized cost in accordance with the effective interest rate method, less any provision
for impairment.
Provision is made for impairment of trade receivables when there is objective evidence that
the Group will not be able to collect all the amount owed by the debtor in accordance with
the condition of the debt. This provision is calculated as the difference between the carrying

5656
amount and the present value of future estimated cash flows discounted at the effective inter-
est rate and is recognized in the income statement.
i) Inventories
Inventories are measured at the lower of cost and net realizable value.
Cost comprises all costs of acquisition, transformation and other costs incurred in bringing the
inventories to their present location and condition.
Transformation costs comprise the costs directly related to the units produced and a systemati-
cally calculated portion of indirect, variable and fixed costs incurred during the transformation
process.
Cost is calculated on a FIFO basis and includes the cost of materials consumed, labor and
manufacturing expenses.
The cost of inventories is adjusted when cost exceeds net realizable value. Net realizable value
is considered as the following:
- Raw materials and other supplies: replacement cost. However, materials are not written
down below cost if the finished products in which they will be incorporated are expected to
be sold at or above cost;
- Goods for resale: estimated selling price, less selling costs;
- Work in progress: the estimated selling price for the corresponding finished products, less
estimated costs of completion and selling costs.
j) Cash and cash equivalents
Cash and cash equivalents include cash in hand, call deposits with banks and other short-term
highly-liquid investments, providing they are easily convertible into cash, which are exposed
to insignificant risk of changes in value. Investments which mature in less than three months
from the acquisition date are also included.
Bank overdrafts on demand which form part of the Group’s cash management are included in
the statement of cash flows as a component of cash and cash equivalents and are recognized
as financial liabilities in the consolidated balance sheet.

What is it?
What did it do in 2007?
How did it do it?
Where is it?
How is it governed?
Who forms the teams?
How does it ensure sustainability?
Economic and Financial Report
Annual Corporate Governance Report
57
The Group recognizes cash flows relating to interest and dividends paid and received as finan-
cing activities.
k) Employee benefits
In line with prevailing collective labor agreements, certain group companies are obliged to pay
retirement bonuses. The Group has created a provision to cover the actuarial liability of the
estimated portion accrued at 31 January 2008.
Equity instruments granted to group employees are measured at the grant date. Personnel
expenses accrued during the year are determined on the basis of the fair value of equity ins-
truments at the grant date, the period over which services will be rendered and the number of
instruments estimated to be definitively consolidated at the end of the period.
Transactions relating to share-based payments entered into prior to 7 November 2002 were
recognized using accounting principles prevailing in Spain at the date of transition to
EU-IFRS.
Personnel expenses accrued by the beneficiaries of the plan referred to in note 27 to the con-
solidated annual accounts are recognized with a credit to equity accounts during the period in
which services are rendered.
l) Provisions
Provisions are recognized in the balance sheet when:
- the Group has a present legal or constructive obligation as result of a past event;
- it is probable that an outflow of economic benefits will be required to settle the obligation;
and
- the amount can be reliably estimated.
Provisions are based on the best information available at the date of preparation of the annual
accounts and are revised at each balance sheet date.
If it is no longer probable that an outflow of resources embodying economic benefits will be
required to settle the obligation, the provision is reversed against the consolidated income
statement caption where the corresponding expense was recorded.

58
m) Financial liabilities
Financial liabilities, including trade and other payables, are initially recognized at fair value
less any transaction costs directly attributable to issuance of the liabilities, and are subse-
quently carried at amortized cost using the effective interest method.
n) Derivatives and hedging operations
Financial instruments acquired to hedge transactions in foreign currencies are initially recogni-
zed at fair value plus any transaction costs directly attributable to acquiring the instrument
Foreign exchange rate hedges relating to firm purchase commitments are treated as cash flow
hedges and are recognized in the consolidated statement of recognized income and expense,
net of gains or losses derived from measuring the instrument at fair value which correspond
to the effective portion of the hedge. The ineffective portion is taken to financial income or
expense as appropriate.
Amounts recognized in equity are taken to income when the transaction takes place with a
debit or credit to the account in which it was recognized. Losses recognized in equity which
are not expected to be recovered in the future are reclassified to financial income or expense.
o) Revenue recognition
The sale of goods is recognized when the significant risks and rewards of ownership of the
goods are transferred.
Sales to franchises are recognized when the aforementioned conditions are met and when the
revenue can be reliably determined and collection is considered probable.
Rental income is recognized on a straight-line basis over the term of the lease.
Revenue from royalties is recognized using the accrual principle based on the substance of
the contracts, providing collection is considered probable and the amount can be reliably
estimated.
p) Leases
Lease contracts in which the significant risks and rewards inherent to ownership of the asset
are substantially transferred to third parties are classified as finance leases, and are otherwise
recorded as operating leases.

What is it?
What did it do in 2007?
How did it do it?
Where is it?
How is it governed?
Who forms the teams?
How does it ensure sustainability?
Economic and Financial Report
Annual Corporate Governance Report
59
Assets acquired through a finance lease are recognized as non-current assets at the lower of
the present value of the future lease minimum payment and the fair value of the leased asset,
while the corresponding debt with the lessor is recognized as a liability. Lease payments are
apportioned between the reduction of the outstanding liability and the finance charge, which
is recorded as a financial expense during the year.
In the case of operating leases, non-contingent or fixed rent payments are charged to the
income statement on a straight-line basis over the term of the lease. Contingent rent is recog-
nized in the period in which payment is probable, as are variable rent increases linked to the
consumer price index.
Incentives received from shopping center developers or owners of commercial premises are
recognized as non-current liabilities and booked as a reduction in rental expense under “Other
operating expenses” on a straight-line basis over the term of the respective lease contracts.
q) Financial income and expenses
Financial income and expenses are recognized on an accrual basis using the effective interest
method. Dividend income is recognized when the right to receive payment is established.
r) Income tax
Income tax comprises current and deferred tax and is recognized in the income statement and
included in the determination of net profit or loss for the year, except to the extent that it re-
lates to a transaction which has been recognized in the same or different years, in which case
it is recognized in equity, or to a business combination.
Current tax is the expected tax payable on the taxable income for the year, using tax rates
enacted or substantially enacted at the balance sheet date, and any adjustment to tax payable
in respect of previous years.
Deferred tax is calculated using the balance sheet method, which provides for temporary diffe-
rences between the carrying amounts of assets and liabilities for financial reporting purposes
and the amounts used for tax purposes. Deferred tax liabilities comprise income tax amounts
payable in the future on account of taxable temporary differences while deferred tax assets
are amounts recoverable due to the existence of deductible temporary differences, tax loss
carryforwards or deductions pending application.
The Group recognizes deferred tax assets and liabilities derived from timing differences, except
those relating to the initial recognition of goodwill and to the initial recognition of assets or
liabilities of a transaction which is not a business combination and which did not affect either

6060
accounting or taxable profit (losses). Deferred tax assets and liabilities are also recognized for
timing differences relating to investments in subsidiaries, except when the parent company
can control their reversal and the timing differences will probably not reverse in the foreseea-
ble future.
Deferred tax assets and liabilities are measured at the tax rates that are expected to apply to
the years when the asset is realized or the liability is settled, based on tax rates and tax laws
that have been enacted or substantially enacted by the balance sheet date and reflecting the
tax consequences that would follow from the manner in which the Group expects to recover or
settle the carrying amount of its assets or liabilities.
Deferred tax assets are recognized to the extent that it is probable that future taxable profits
will be available against which the asset can be utilized. Deferred tax assets, whether recogni-
zed or not, are reviewed at each balance sheet date.
The Group only offsets current tax assets and liabilities if it has a legally enforceable right to
set off the recognized amounts and intends either to settle on a net basis, or to realize the
asset and settle the liability simultaneously.
Deferred tax assets and liabilities are recognized on the consolidated balance sheet under non-
current assets or liabilities, irrespective of the date of realization or settlement.
s) Current and non-current assets and liabilities
The Group classifies assets and liabilities as current and non-current. Assets and liabilities are
classified as current when they are expected to be realized or settled within twelve months of
the balance sheet date, and are otherwise classified as non-current.
Assets and liabilities are not netted unless there are specific requirements to the contrary or a
standard or interpretation so permits.
t) Treasury shares
Treasury shares acquired by the Group have been presented separately at cost as a reduction in
equity in the consolidated balance sheet, and no gains or losses have been recorded as a result
of transactions carried out with treasury shares.
Costs incurred in treasury share transactions are recorded as a reduction in equity, after consi-
deration of any tax effect.

What is it?
What did it do in 2007?
How did it do it?
Where is it?
How is it governed?
Who forms the teams?
How does it ensure sustainability?
Economic and Financial Report
Annual Corporate Governance Report
61
5.33 Environment
Costs incurred in environmental activities are recognized under other operating expenses in the year in
which they are incurred.

6262
Appendix I- Structure of the Inditex Group
Company Effective % of ownership
Location Consolidation method
Year end Format Activity
Subsidiaries:
Industria de Diseño Textil, S.A.
Parent Company
La Coruña - Spain Global I. 01/31/2008 - Parent company
Comditel, S.A. 100,00% Barcelona - Spain Global I. 01/31/2008 Zara Centralized textile manufacturing
Inditex Asia, Ltd. 100,00% Hong Kong - China Global I. 01/31/2008 Zara Centralized textile manufacturing
Zara Asia, Ltd. 100,00% Hong Kong - China Global I. 01/31/2008 Zara Centralized textile manufacturing
Choolet, S.A. 100,00% La Coruña - Spain Global I. 01/31/2008 Zara Textile manufacturing
Confecciones Fíos, S.A. 100,00% La Coruña - Spain Global I. 01/31/2008 Zara Textile manufacturing
Confecciones Goa, S.A. 100,00% La Coruña - Spain Global I. 01/31/2008 Zara Textile manufacturing
Denllo, S.A. 100,00% La Coruña - Spain Global I. 01/31/2008 Zara Textile manufacturing
Hampton, S.A. 100,00% La Coruña - Spain Global I. 01/31/2008 Zara Textile manufacturing
Jema Creaciones Infantiles, S.L.
45,90% La Coruña - Spain Global I. 01/31/2008 Zara Textile manufacturing
Nikole, S.A. 100,00% La Coruña - Spain Global I. 01/31/2008 Zara Textile manufacturing
Samlor, S.A. 100,00% La Coruña - Spain Global I. 01/31/2008 Zara Textile manufacturing
Stear, S.A. 100,00% La Coruña - Spain Global I. 01/31/2008 Zara Textile manufacturing
Trisko, S.A. 100,00% La Coruña - Spain Global I. 01/31/2008 Zara Textile manufacturing
Zintura, S.A. 100,00% La Coruña - Spain Global I. 01/31/2008 Zara Textile manufacturing
Glencare, S.A. 100,00% La Coruña - Spain Global I. 01/31/2008 Zara Textile manufacturing
Indipunt, S.L. 51,00% La Coruña - Spain Global I. 01/31/2008 Zara Textile manufacturing
UAB Rofestas 100,00% Vilnius - Lithuania Global I. 01/31/2008 Zara Textile manufacturing
Zara España, S.A. 100,00% La Coruña - Spain Global I. 01/31/2008 Zara Retailing
Zara Argentina, S.A. 100,00% Buenos Aires - Argentina
Global I. 01/31/2008 Zara Retailing
Zara Belgique, S.A. 100,00% Brussels - Belgium Global I. 01/31/2008 Zara Retailing
Zara Chile, S.A. 100,00% Santiago de Chile - Chile
Global I. 12/31/2007 Zara Retailing
Zara USA, Inc. 100,00% New York - USA Global I. 01/31/2008 Zara Retailing
Zara France, S.A.R.L. 100,00% Paris - France Global I. 01/31/2008 Zara Retailing
Zara UK, Ltd. 100,00% London - United Kingdom
Global I. 01/31/2008 Zara Retailing
Zara Hellas, S.A. 100,00% Athens - Greece Global I. 01/31/2008 Zara Retailing
Zara México, S.A. de C.V. 95,00% Mexico DF - Mexico Global I. 12/31/2007 Zara Retailing
Zara Portugal Confecçoes Lda.
100,00% Lisbon - Portugal Global I. 01/31/2008 Zara Retailing
G.Zara Uruguay, S.A. 100,00% Montevideo-Urugay Global I. 01/31/2008 Zara Retailing
Zara Brasil, Lda. 100,00% Sao Paulo -Brasil Global I. 12/31/2007 Zara Retailing
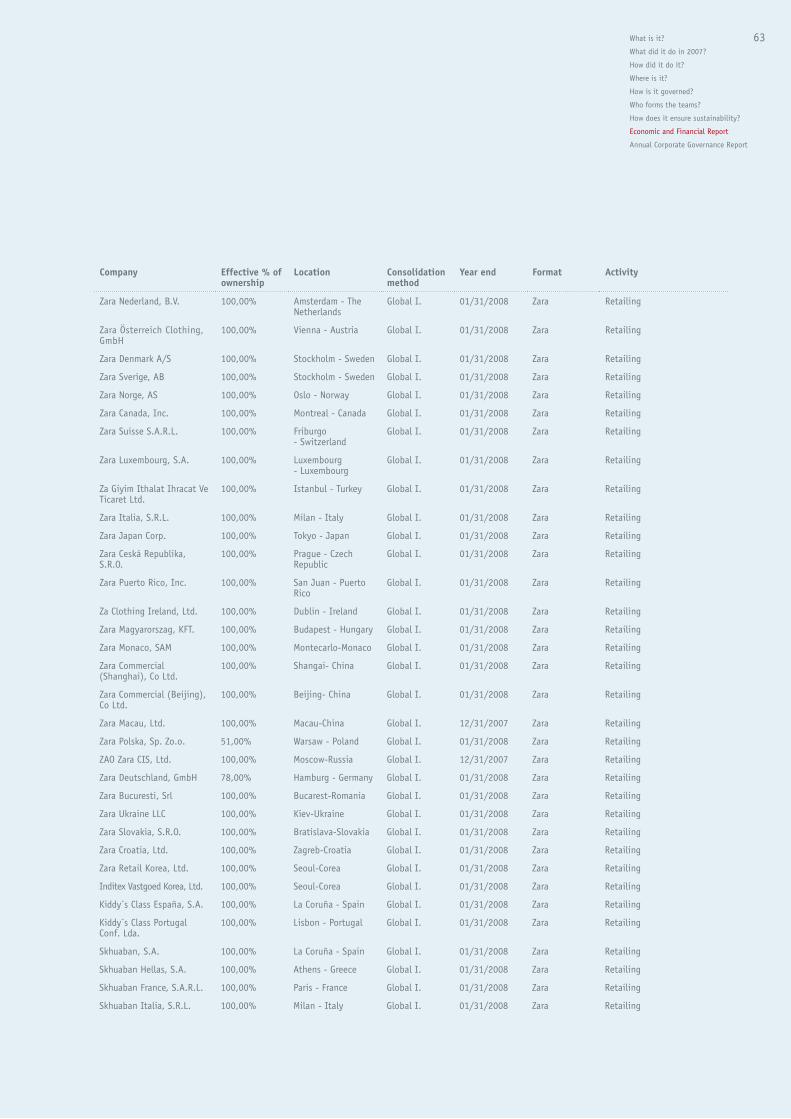
What is it?
What did it do in 2007?
How did it do it?
Where is it?
How is it governed?
Who forms the teams?
How does it ensure sustainability?
Economic and Financial Report
Annual Corporate Governance Report
63
Company Effective % of ownership
Location Consolidation method
Year end Format Activity
Zara Nederland, B.V. 100,00% Amsterdam - The Netherlands
Global I. 01/31/2008 Zara Retailing
Zara Österreich Clothing, GmbH
100,00% Vienna - Austria Global I. 01/31/2008 Zara Retailing
Zara Denmark A/S 100,00% Stockholm - Sweden Global I. 01/31/2008 Zara Retailing
Zara Sverige, AB 100,00% Stockholm - Sweden Global I. 01/31/2008 Zara Retailing
Zara Norge, AS 100,00% Oslo - Norway Global I. 01/31/2008 Zara Retailing
Zara Canada, Inc. 100,00% Montreal - Canada Global I. 01/31/2008 Zara Retailing
Zara Suisse S.A.R.L. 100,00% Friburgo - Switzerland
Global I. 01/31/2008 Zara Retailing
Zara Luxembourg, S.A. 100,00% Luxembourg - Luxembourg
Global I. 01/31/2008 Zara Retailing
Za Giyim Ithalat Ihracat Ve Ticaret Ltd.
100,00% Istanbul - Turkey Global I. 01/31/2008 Zara Retailing
Zara Italia, S.R.L. 100,00% Milan - Italy Global I. 01/31/2008 Zara Retailing
Zara Japan Corp. 100,00% Tokyo - Japan Global I. 01/31/2008 Zara Retailing
Zara Ceská Republika, S.R.O.
100,00% Prague - Czech Republic
Global I. 01/31/2008 Zara Retailing
Zara Puerto Rico, Inc. 100,00% San Juan - Puerto Rico
Global I. 01/31/2008 Zara Retailing
Za Clothing Ireland, Ltd. 100,00% Dublin - Ireland Global I. 01/31/2008 Zara Retailing
Zara Magyarorszag, KFT. 100,00% Budapest - Hungary Global I. 01/31/2008 Zara Retailing
Zara Monaco, SAM 100,00% Montecarlo-Monaco Global I. 01/31/2008 Zara Retailing
Zara Commercial (Shanghai), Co Ltd.
100,00% Shangai- China Global I. 01/31/2008 Zara Retailing
Zara Commercial (Beijing), Co Ltd.
100,00% Beijing- China Global I. 01/31/2008 Zara Retailing
Zara Macau, Ltd. 100,00% Macau-China Global I. 12/31/2007 Zara Retailing
Zara Polska, Sp. Zo.o. 51,00% Warsaw - Poland Global I. 01/31/2008 Zara Retailing
ZAO Zara CIS, Ltd. 100,00% Moscow-Russia Global I. 12/31/2007 Zara Retailing
Zara Deutschland, GmbH 78,00% Hamburg - Germany Global I. 01/31/2008 Zara Retailing
Zara Bucuresti, Srl 100,00% Bucarest-Romania Global I. 01/31/2008 Zara Retailing
Zara Ukraine LLC 100,00% Kiev-Ukraine Global I. 01/31/2008 Zara Retailing
Zara Slovakia, S.R.O. 100,00% Bratislava-Slovakia Global I. 01/31/2008 Zara Retailing
Zara Croatia, Ltd. 100,00% Zagreb-Croatia Global I. 01/31/2008 Zara Retailing
Zara Retail Korea, Ltd. 100,00% Seoul-Corea Global I. 01/31/2008 Zara Retailing
Inditex Vastgoed Korea, Ltd. 100,00% Seoul-Corea Global I. 01/31/2008 Zara Retailing
Kiddy´s Class España, S.A. 100,00% La Coruña - Spain Global I. 01/31/2008 Zara Retailing
Kiddy´s Class Portugal Conf. Lda.
100,00% Lisbon - Portugal Global I. 01/31/2008 Zara Retailing
Skhuaban, S.A. 100,00% La Coruña - Spain Global I. 01/31/2008 Zara Retailing
Skhuaban Hellas, S.A. 100,00% Athens - Greece Global I. 01/31/2008 Zara Retailing
Skhuaban France, S.A.R.L. 100,00% Paris - France Global I. 01/31/2008 Zara Retailing
Skhuaban Italia, S.R.L. 100,00% Milan - Italy Global I. 01/31/2008 Zara Retailing

6464
Company Effective % of ownership
Location Consolidation method
Year end Format Activity
Fibracolor Decoración, S.A. 39,97% Barcelona - Spain Global I. 12/31/2007 Zara Decoration
Fibracolor, S.A. 39,97% Barcelona - Spain Global I. 12/31/2007 Zara Purchase and treatment of textile
Oysho España, S.A. 100,00% Barcelona - Spain Global I. 01/31/2008 Oysho Retailing
Oysho Venezuela, S.A. 100,00% Caracas - Venezuela Global I. 01/31/2008 Oysho Retailing
Oysho Portugal, Conf. Lda. 100,00% Lisbon - Portugal Global I. 01/31/2008 Oysho Retailing
Oysho Mexico, S.A. de C.V. 98,50% Mexico DF - Mexico Global I. 12/31/2007 Oysho Retailing
Oysho Italia, S.R.L. 100,00% Milan - Italy Global I. 01/31/2008 Oysho Retailing
Oysho Hellas, S.A. 100,00% Athens - Greece Global I. 01/31/2008 Oysho Retailing
Oysho Österreich, GmbH 100,00% Vienna - Austria Global I. 01/31/2008 Oysho Retailing
Oysho Giyim Ithalat Ihracat Ve Ticaret Ltd.
100,00% Istanbul - Turkey Global I. 01/31/2008 Oysho Retailing
Oysho Polska, Sp zo.o 100,00% Warsaw - Poland Global I. 01/31/2008 Oysho Retailing
Oysho CIS, Ltd. 100,00% Moscow-Russia Global I. 12/31/2007 Oysho Retailing
Oysho France, S.A.R.L. 100,00% Paris - France Global I. 01/31/2008 Oysho Retailing
Oysho MAGYARORSZAG, KFT 100,00% Budapest - Hungary Global I. 01/31/2008 Oysho Retailing
Oysho Ro, Srl 100,00% Bucarest-Romania Global I. 01/31/2008 Oysho Retailing
Oysho Ukraine, Llc 100,00% Kiev-Ukraine I.Global 01/31/2008 Oysho Retailing
Oysho Deutschland, GmbH 100,00% Hamburg - Germany Global I. 01/31/2008 Oysho Retailing
Often Portugal Conf. Lda. 50,00% Lisbon - Portugal Global I. 01/31/2008 - Retailing
Grupo Massimo Dutti, S.A. 100,00% Barcelona - Spain Global I. 01/31/2008 Massimo Dutti Retailing
Massimo Dutti Hellas, S.A. 100,00% Athens - Greece Global I. 01/31/2008 Massimo Dutti Retailing
Massimo Dutti Giyim Itha-lat Ih.Ve Tic. Ltd.
100,00% Istanbul - Turkey Global I. 01/31/2008 Massimo Dutti Retailing
Massimo Dutti Venezuela, S.A.
100,00% Caracas - Venezuela Global I. 01/31/2008 Massimo Dutti Retailing
Massimo Dutti France, S.A.R.L.
100,00% Paris - France Global I. 01/31/2008 Massimo Dutti Retailing
Massimo Dutti UK, Ltd. 100,00% London - United Kingdom
Global I. 01/31/2008 Massimo Dutti Retailing
Massimo Dutti Suisse, S.A.R.L.
100,00% Friburgo - Switzerland
Global I. 01/31/2008 Massimo Dutti Retailing
Massimo Dutti Sverige, AB 100,00% Stockholm - Sweden Global I. 01/31/2008 Massimo Dutti Retailing
Massimo Dutti Norge, AS. 100,00% Oslo - Norway Global I. 01/31/2008 Massimo Dutti Retailing
Massimo Dutti Italia, S.R.L. 100,00% Milan - Italy Global I. 01/31/2008 Massimo Dutti Retailing
Massimo Dutti Ireland., Ltd.
100,00% London - United Kingdom
Global I. 01/31/2008 Massimo Dutti Retailing
Massimo Dutti USA, Ltd. 100,00% New York - USA Global I. 01/31/2008 Massimo Dutti Retailing
Massimo Dutti Danmark A/S
100,00% Copenhagen - Denmark
Global I. 01/31/2008 Massimo Dutti Retailing
Massimo Dutti CIS, Ltd. 100,00% Moscow-Russia Global I. 12/31/2007 Massimo Dutti Retailing
Massimo Dutti Deuts-chland, GmbH
100,00% Hamburg - Germany Global I. 01/31/2008 Massimo Dutti Retailing

What is it?
What did it do in 2007?
How did it do it?
Where is it?
How is it governed?
Who forms the teams?
How does it ensure sustainability?
Economic and Financial Report
Annual Corporate Governance Report
65
Company Effective % of ownership
Location Consolidation method
Year end Format Activity
Massimo Dutti Mexico, S.A. de C.V.
98,00% Mexico DF - Mexico Global I. 12/31/2007 Massimo Dutti Retailing
BCN Diseños, S.A. de C.V. 98,00% Mexico DF - Mexico Global I. 12/31/2007 Massimo Dutti Retailing
Zara Home Belgique, S.A. 100,00% Brussels - Belgium Global I. 01/31/2008 Massimo Dutti Retailing
Massimo Dutti, S.A. 100,00% La Coruña - Spain Global I. 01/31/2008 Massimo Dutti Dormand as of 01/31/08
Massimo Dutti Hong Kong, Ltd.
100,00% Hong Kong - China Global I. 01/31/2008 Massimo Dutti Retailing
Massimo Dutti Polska, Sp z.o.o.
100,00% Warsaw - Poland Global I. 01/31/2008 Massimo Dutti Retailing
Massimo Dutti Ro, Srl 100,00% Bucarest-Romania Global I. 01/31/2008 Massimo Dutti Retailing
Massimo Dutti Macau Ltd. 100,00% Macau-China I.Global 01/31/2008 Massimo Dutti Retailing
Massimo Dutti Ukraine, Llc 100,00% Kiev-Ukraine I.Global 01/31/2008 Massimo Dutti Retailing
Pull & Bear España, S.A. 100,00% La Coruña - Spain Global I. 01/31/2008 Pull & Bear Retailing
Pull & Bear Hellas, S.A. 100,00% Athens - Greece Global I. 01/31/2008 Pull & Bear Retailing
Pull & Bear Portugal Conf. Lda.
100,00% Lisbon - Portugal Global I. 01/31/2008 Pull & Bear Retailing
Pull & Bear Giyim Ith. Ihrac.Ve Tic. Ltd.
100,00% Istanbul - Turkey Global I. 01/31/2008 Pull & Bear Retailing
Pull & Bear Mexico, S.A. de C.V.
98,50% Mexico DF - Mexico Global I. 12/31/2007 Pull & Bear Retailing
Pull & Bear Belgique, S.A. 100,00% Brussels - Belgium Global I. 01/31/2008 Pull & Bear Retailing
Pull & Bear France, S.A.R.L. 100,00% Paris - France Global I. 01/31/2008 Pull & Bear Retailing
Pull & Bear Italia, S.R.L. 100,00% Milan - Italy Global I. 01/31/2008 Pull & Bear Retailing
Pull&Bear Ceska Republika, S.R.O.
100,00% Prague - Czech Republic
Global I. 01/31/2008 Pull & Bear Retailing
Pull&Bear Ireland, Ltd. 100,00% Dublin - Ireland Global I. 01/31/2008 Pull & Bear Retailing
Pull & Bear Magyarország Kft.
100,00% Budapest - Hungary Global I. 01/31/2008 Pull & Bear Retailing
Pull & Bear Polska, Sp zo.o 100,00% Warsaw - Poland Global I. 01/31/2008 Pull & Bear Retailing
Pull & Bear CIS, Ltd. 100,00% Moscow-Russia Global I. 12/31/2007 Pull & Bear Retailing
Pull & Bear Uk Limited 100,00% London - United Kingdom
I.Global 01/31/2008 Pull & Bear Retailing
Pull & Bear Ro, Srl 100,00% Bucarest-Romania I.Global 01/31/2008 Pull & Bear Retailing
Pull and Bear Ukraine, Llc 100,00% Kiev-Ukraine I.Global 01/31/2008 Pull & Bear Retailing
Pull & Bear Slovakia, S.R.O. 100,00% Bratislava-Slovakia I.Global 01/31/2008 Pull & Bear Retailing
Pull & Bear Croatia, LTD 100,00% Zagreb-Croatia I.Global 01/31/2008 Pull & Bear Retailing
Uterqüe, S.A. 100,00% La Coruña - Spain I.Global 01/31/2008 - Centralized purchasing
Uterqüe España, S.A. 100,00% La Coruña - Spain Global I. 01/31/2008 - Retailing
Bershka BSK España, S.A. 100,00% Barcelona - Spain Global I. 01/31/2008 Bershka Retailing
Bershka Portugal Conf. Soc. Unip. Lda.
100,00% Lisbon - Portugal Global I. 01/31/2008 Bershka Retailing
Bershka Hellas, S.A. 100,00% Athens - Greece Global I. 01/31/2008 Bershka Retailing
Bershka Mexico, S.A. de CV 97,00% Mexico DF - Mexico Global I. 12/31/2007 Bershka Retailing

6666
Company Effective % of ownership
Location Consolidation method
Year end Format Activity
Bershka Giyim Ithalat Ihracat Ve Tic.Ltd.
100,00% Istanbul - Turkey Global I. 12/31/2007 Bershka Retailing
Bershka Belgique, S.A. 100,00% Brussels - Belgium Global I. 01/31/2008 Bershka Retailing
Bershka France, S.A.R.L. 100,00% Paris - France Global I. 01/31/2008 Bershka Retailing
Bershka Suisse, S.A.R.L. 100,00% Friburgo - Switzerland
Global I. 01/31/2008 Bershka Retailing
Bershka Nederland, B.V. 100,00% Amsterdam - The Netherlands
Global I. 01/31/2008 Bershka Retailing
Bershka Italia, S.R.L. 100,00% Milan - Italy Global I. 01/31/2008 Bershka Retailing
Bershka U.K., Ltd. 100,00% London - United Kingdom
Global I. 01/31/2008 Bershka Retailing
Bershka Ireland., Ltd. 100,00% London - United Kingdom
Global I. 01/31/2008 Bershka Retailing
Bershka Ceska Republica, S.R.O.
100,00% Prague - Czech Republic
Global I. 01/31/2008 Bershka Retailing
Bershka Croatia, Ltd. 100,00% Zagreb-Croatia I.Global 01/31/2008 Bershka Retailing
Bershka Polska Sp Z O.O. 100,00% Warsaw - Poland I.Global 01/31/2008 Bershka Retailing
Bershka Slovakia, S.R.O. 100,00% Bratislava-Slovakia I.Global 01/31/2008 Bershka Retailing
Bershka Carpati, Srl 100,00% Bucarest-Romania I.Global 01/31/2008 Bershka Retailing
Bershka Ukraine, Llc 100,00% Kiev-Ukraine I.Global 01/31/2008 Bershka Retailing
Bershka Magyaroszag Kft. 100,00% Budapest - Hungary I.Global 01/31/2008 Bershka Retailing
Bershka Cis, Ltd 100,00% Moscow-Russia Global I. 12/31/2007 Bershka Retailing
Stradivarius España, S.A. 100,00% Barcelona - Spain Global I. 01/31/2008 Stradivarius Retailing
Stradivarius Hellas, S.A. 100,00% Athens - Greece Global I. 01/31/2008 Stradivarius Retailing
Stradivarius Portugal, Conf. Unip. Lda.
100,00% Lisbon - Portugal Global I. 01/31/2008 Stradivarius Retailing
Stradivarius Giyim Ithalat Ih. Ve Tic. Ltd.
100,00% Istanbul - Turkey Global I. 01/31/2008 Stradivarius Retailing
Stradivarius Polska, Sp zo.o 100,00% Warsaw - Poland Global I. 01/31/2008 Stradivarius Retailing
Stradivarius Ireland Limited
100,00% Dublin - Ireland Global I. 01/31/2008 Stradivarius Retailing
Stradivarius Italia SRL 100,00% Milan - Italy Global I. 01/31/2008 Stradivarius Retailing
Stradivarius CIS, Ltd. 100,00% Moscow-Russia Global I. 12/31/2007 Stradivarius Retailing
Stradivarius France, S.A.R.L.
100,00% Paris - France Global I. 01/31/2008 Stradivarius Retailing
Stradivarius Magyaroszag Kft.
100,00% Budapest - Hungary Global I. 01/31/2008 Stradivarius Retailing
Stradivarius Croatia, LTD. 100,00% Zagreb-Croatia Global I. 01/31/2008 Stradivarius Retailing
Stradivarius Slovakia, S.R.O.
100,00% Bratislava-Slovakia Global I. 01/31/2008 Stradivarius Retailing
Stradivarius Ro, Srl 100,00% Bucarest-Romania Global I. 01/31/2008 Stradivarius Retailing
Stradivarius Ukraine, Llc 100,00% Kiev-Ukraine Global I. 01/31/2008 Stradivarius Retailing
Zara Home España, S.A. 100,00% La Coruña - Spain Global I. 01/31/2008 Zara Home Retailing
Zara Home Portugal, Conf. Soc. Unip. Lda.
100,00% Lisbon - Portugal Global I. 01/31/2008 Zara Home Retailing
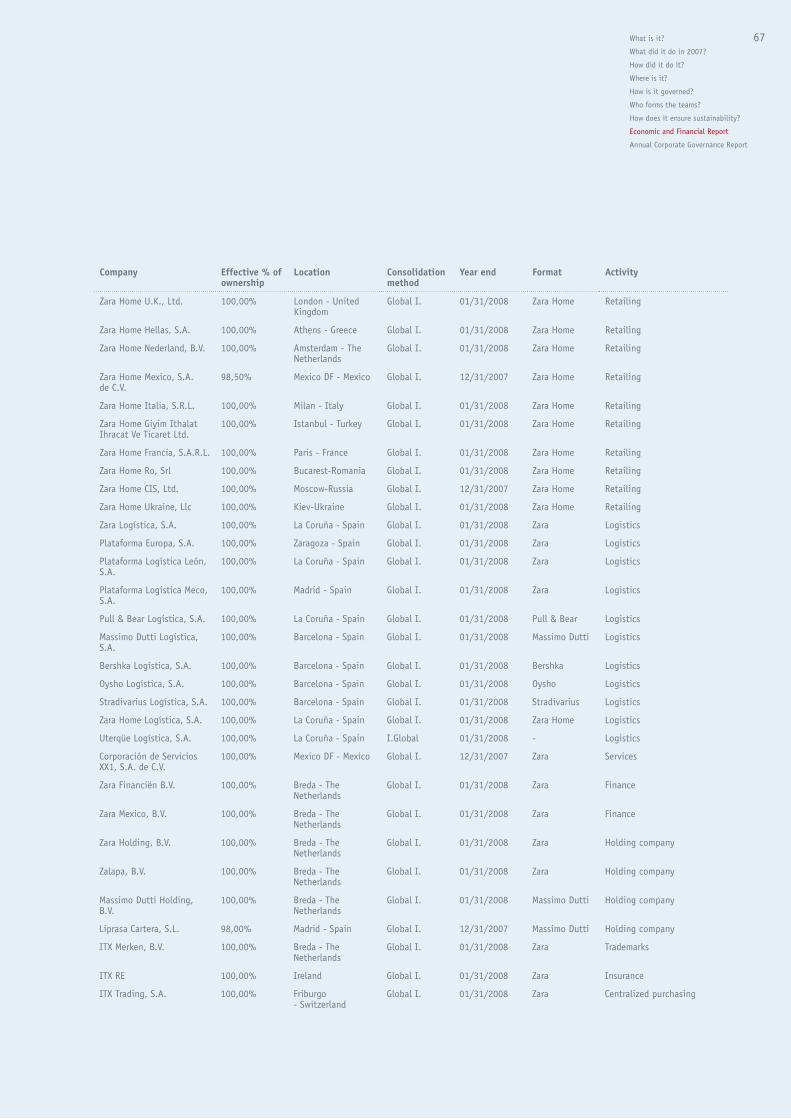
What is it?
What did it do in 2007?
How did it do it?
Where is it?
How is it governed?
Who forms the teams?
How does it ensure sustainability?
Economic and Financial Report
Annual Corporate Governance Report
67
Company Effective % of ownership
Location Consolidation method
Year end Format Activity
Zara Home U.K., Ltd. 100,00% London - United Kingdom
Global I. 01/31/2008 Zara Home Retailing
Zara Home Hellas, S.A. 100,00% Athens - Greece Global I. 01/31/2008 Zara Home Retailing
Zara Home Nederland, B.V. 100,00% Amsterdam - The Netherlands
Global I. 01/31/2008 Zara Home Retailing
Zara Home Mexico, S.A. de C.V.
98,50% Mexico DF - Mexico Global I. 12/31/2007 Zara Home Retailing
Zara Home Italia, S.R.L. 100,00% Milan - Italy Global I. 01/31/2008 Zara Home Retailing
Zara Home Giyim Ithalat Ihracat Ve Ticaret Ltd.
100,00% Istanbul - Turkey Global I. 01/31/2008 Zara Home Retailing
Zara Home Francia, S.A.R.L. 100,00% Paris - France Global I. 01/31/2008 Zara Home Retailing
Zara Home Ro, Srl 100,00% Bucarest-Romania Global I. 01/31/2008 Zara Home Retailing
Zara Home CIS, Ltd. 100,00% Moscow-Russia Global I. 12/31/2007 Zara Home Retailing
Zara Home Ukraine, Llc 100,00% Kiev-Ukraine Global I. 01/31/2008 Zara Home Retailing
Zara Logística, S.A. 100,00% La Coruña - Spain Global I. 01/31/2008 Zara Logistics
Plataforma Europa, S.A. 100,00% Zaragoza - Spain Global I. 01/31/2008 Zara Logistics
Plataforma Logística León, S.A.
100,00% La Coruña - Spain Global I. 01/31/2008 Zara Logistics
Plataforma Logística Meco, S.A.
100,00% Madrid - Spain Global I. 01/31/2008 Zara Logistics
Pull & Bear Logística, S.A. 100,00% La Coruña - Spain Global I. 01/31/2008 Pull & Bear Logistics
Massimo Dutti Logística, S.A.
100,00% Barcelona - Spain Global I. 01/31/2008 Massimo Dutti Logistics
Bershka Logística, S.A. 100,00% Barcelona - Spain Global I. 01/31/2008 Bershka Logistics
Oysho Logística, S.A. 100,00% Barcelona - Spain Global I. 01/31/2008 Oysho Logistics
Stradivarius Logística, S.A. 100,00% Barcelona - Spain Global I. 01/31/2008 Stradivarius Logistics
Zara Home Logística, S.A. 100,00% La Coruña - Spain Global I. 01/31/2008 Zara Home Logistics
Uterqüe Logística, S.A. 100,00% La Coruña - Spain I.Global 01/31/2008 - Logistics
Corporación de Servicios XX1, S.A. de C.V.
100,00% Mexico DF - Mexico Global I. 12/31/2007 Zara Services
Zara Financiën B.V. 100,00% Breda - The Netherlands
Global I. 01/31/2008 Zara Finance
Zara Mexico, B.V. 100,00% Breda - The Netherlands
Global I. 01/31/2008 Zara Finance
Zara Holding, B.V. 100,00% Breda - The Netherlands
Global I. 01/31/2008 Zara Holding company
Zalapa, B.V. 100,00% Breda - The Netherlands
Global I. 01/31/2008 Zara Holding company
Massimo Dutti Holding, B.V.
100,00% Breda - The Netherlands
Global I. 01/31/2008 Massimo Dutti Holding company
Liprasa Cartera, S.L. 98,00% Madrid - Spain Global I. 12/31/2007 Massimo Dutti Holding company
ITX Merken, B.V. 100,00% Breda - The Netherlands
Global I. 01/31/2008 Zara Trademarks
ITX RE 100,00% Ireland Global I. 01/31/2008 Zara Insurance
ITX Trading, S.A. 100,00% Friburgo - Switzerland
Global I. 01/31/2008 Zara Centralized purchasing

6868
Company Effective % of ownership
Location Consolidation method
Year end Format Activity
ITX E-commerce 100,00% Dublin - Ireland I.Global 01/31/2008 Zara E-Commerce
Goa-Invest, S.A. 100,00% La Coruña - Spain Global I. 01/31/2008 Zara Construction and real estate
Zara Vastgoed, B.V. 100,00% Breda - The Netherlands
Global I. 01/31/2008 Zara Real estate
Vastgoed Asia, Ltd. 100,00% Hong Kong - China Global I. 01/31/2008 Zara Real estate
SNC Zara France Immobiliere
100,00% Paris - France Global I. 12/31/2007 Zara Real estate
SCI Vastgoed Ferreol P03302
100,00% Paris - France Global I. 12/31/2007 Zara Real estate
SCI Vastgoed France P03301
100,00% Paris - France Global I. 12/31/2007 Zara Real estate
SCI Vastgoed General Leclerc P03303
100,00% Paris - France Global I. 12/31/2007 Zara Real estate
SCI Vastgoed Nancy P03304
100,00% Paris - France Global I. 12/31/2007 Zara Real estate
Invercarpro, S.A. 100,00% Madrid - Spain Global I. 01/31/2008 Zara Real estate
Robustae S.G.P.S. Unip. Lda.
100,00% Lisbon - Portugal Global I. 01/31/2008 Zara Real estate
Lefties España, S,A, 100,00% La Coruña - Spain Global I. 01/31/2008 Zara Real estate
Inditex Cogeneración, A.I.E.
100,00% La Coruña - Spain Global I. 01/31/2008 Zara Cogeneration plant
Inditex, S.A. 100,00% La Coruña - Spain Global I. 01/31/2008 Zara Dormand as of 01/31/08
Zara Italia, B.V. 100,00% Breda - The Netherlands
Global I. 01/31/2008 Zara Dormand as of 01/31/08
Fruminga, B.V. 100,00% Breda - The Netherlands
Global I. 01/31/2008 Zara Dormand as of 01/31/08
Zara, S.A. 100,00% La Coruña - Spain Global I. 01/31/2008 Zara Dormand as of 01/31/08
Zara, S.A. 100,00% La Coruña - Spain Global I. 01/31/2008 Zara Dormand as of 01/31/08
Multigroup companies:
Tempe, S.A. 50,00% Alicante - Spain Prop. I. 01/31/2008 Zara Commercialization of shoes
Tempe México, S.A. de C.V. 50,00% Mexico DF - Mexico Prop. I. 12/31/2007 Zara Commercialization of shoes
Tempe Logística, S.A. 50,00% Alicante - Spain Prop. I. 01/31/2008 Zara Logistics
Tempe Brasil, Ltda. 50,00% Sao Paulo -Brazil Prop. I. 12/31/2007 Zara Commercialization of shoes
Group Zara Australia Pty. Ltd.
50,00% Sydney - Australia Prop. I. 01/31/2008 Zara Dormand as of 01/31/08
Associated companies:
Naviera Elealva, A.I.E. 49,00% Las Palmas - Spain Equity Acc. 12/31/2007 Asset leasing
Naviera Celeste, A.I.E. 49,00% Las Palmas - Spain Equity Acc. 12/31/2007 Asset leasing
Naviera del Miño, A.I.E. 49,00% Las Palmas - Spain Equity Acc. 12/31/2007 Asset leasing
Naviera del Sil, A.I.E. 49,00% Las Palmas - Spain Equity Acc. 12/31/2007 Asset leasing
Naviera Venus, A.I.E 49,00% Las Palmas - Spain Equity Acc. 12/31/2007 Asset leasing
Naviera Berlín , A.I.E. 49,00% Las Palmas - Spain Equity Acc. 12/31/2007 Asset leasing
Naviera Covadonga , A.I.E. 49,00% Las Palmas - Spain Equity Acc. 12/31/2007 Asset leasing
Naviera Gran Sol , A.I.E. 49,00% Las Palmas - Spain Equity Acc. 12/31/2007 Asset leasing

What is it?
What did it do in 2007?
How did it do it?
Where is it?
How is it governed?
Who forms the teams?
How does it ensure sustainability?
Economic and Financial Report
Annual Corporate Governance Report
69
Company Effective % of ownership
Location Consolidation method
Year end Format Activity
Naviera Guadiana , A.I.E. 49,00% Las Palmas - Spain Equity Acc. 12/31/2007 Asset leasing
Naviera Manchuria , A.I.E. 46,00% Las Palmas - Spain Equity Acc. 12/31/2007 Asset leasing
Naviera Llera , A.I.E. 50,00% Las Palmas - Spain Equity Acc. 12/31/2007 Asset leasing
Nebulosa de Omega, A.I.E. 50,00% Las Palmas - Spain Equity Acc. 12/31/2007 Asset leasing
Naviera Cabo Vilaboa C-1658, A.I.E.
49,50% Las Palmas - Spain Equity Acc. 12/31/2007 Asset leasing
Naviera Cabo Domaio C-1659, A.I.E.
49,50% Las Palmas - Spain Equity Acc. 12/31/2007 Asset leasing
Appendix II- Art. 127 ter of the Spanish Companies Act
As required by article 127 ter of the Spanish Companies Act, introduced by Law 26 of 17 July 2003,
which amends Stock Market Law 24 of 28 July 1988, and the Revised Text of the Spanish Companies Act
to underpin the transparency of publicly listed companies, a list of companies with a statutory activity
which is identical, similar or complementary to that of Inditex and in which members of its board of
directors hold investments or management positions is as follows:
Board member Company tax number Company name % ownership Post
Mr. Pablo Isla Álvarez de Tejera A78276854 Bershka España, S.A. 0% Board member
Mr. Pablo Isla Álvarez de Tejera A15052160 Choolet, S.A. 0% Chairman of the board
Mr. Pablo Isla Álvarez de Tejera A15311368 Denllo, S.A 0% Chairman of the board
Mr. Pablo Isla Álvarez de Tejera A15037393 Confecciones Fíos, S.A 0% Chairman of the board
Mr. Pablo Isla Álvarez de Tejera A15018476 Confecciones Goa, S.A 0% Chairman of the board
Mr. Pablo Isla Álvarez de Tejera A15643620 Glencare, S.A 0% Chairman of the board
Mr. Pablo Isla Álvarez de Tejera A78115201 Grupo Massimo Dutti, S.A. 0% Board member
Mr. Pablo Isla Álvarez de Tejera A15155625 Hampton, S.A 0% Chairman of the board
Mr. Pablo Isla Álvarez de Tejera A15137318 Kenner, S.A 0% Chairman of the board
Mr. Pablo Isla Álvarez de Tejera A15049299 Nikole, S.A 0% Chairman of the board
Mr. Pablo Isla Álvarez de Tejera A15026347 Oysho España, S.A. 0% Board member
Mr. Pablo Isla Álvarez de Tejera A15108673 Pull&Bear España, S.A. 0% Board member
Mr. Pablo Isla Álvarez de Tejera A70126164 Uterqüe España, S.A. 0% Board member
Mr. Pablo Isla Álvarez de Tejera A15022585 Samlor, S.A 0% Chairman of the board
Mr. Pablo Isla Álvarez de Tejera A15568165 Stear, S.A 0% Chairman of the board
Mr. Pablo Isla Álvarez de Tejera A60348240 Stradivarius España, S.A. 0% Board member
Mr. Pablo Isla Álvarez de Tejera A15234065 Tempe, S.A. 0% Vice chairman of the board
Mr. Pablo Isla Álvarez de Tejera A15058324 Trisko, S.A 0% Chairman of the board
Mr. Pablo Isla Álvarez de Tejera A15022510 Zara España, S.A. 0% Board member
Mr. Pablo Isla Álvarez de Tejera A15121049 Zintura, S.A. 0% Chairman of the board
Mr. Pablo Isla Álvarez de Tejera A70086350 Massimo Dutti, S.A. 0% Board member

7070
Board member Company tax number Company name % ownership Post
Mr. Pablo Isla Álvarez de Tejera ZME920824KM3 Zara México, S.A. de C.V. 0% Board member
Mr. Antonio Abril Abadín A78276854 Bershka BSK España, S.A. 0% Secretary, non-board member
Mr. Antonio Abril Abadín A78111671 Bershka Logística, S.A. 0% Secretary, non-board member
Mr. Antonio Abril Abadín A15114424 Comditel, S.A. 0% Secretary, non-board member
Mr. Antonio Abril Abadín A15052160 Choolet, S.A. 0% Secretary, non-board member
Mr. Antonio Abril Abadín A15311368 Denllo, S.A 0% Secretary, non-board member
Mr. Antonio Abril Abadín A15037393 Confecciones Fíos, S.A 0% Secretary, non-board member
Mr. Antonio Abril Abadín A15018476 Confecciones Goa, S.A 0% Secretary, non-board member
Mr. Antonio Abril Abadín A15643620 Glencare, S.A 0% Secretary, non-board member
Mr. Antonio Abril Abadín A15121031 Goa Invest, S.A. 0% Secretary, non-board member
Mr. Antonio Abril Abadín A78115201 Grupo Massimo Dutti, S.A. 0% Secretary, non-board member
Mr. Antonio Abril Abadín A15155625 Hampton, S.A 0% Secretary, non-board member
Mr. Antonio Abril Abadín G15632003 Inditex Cogeneración, A.I.E.
0% Joint director
Mr. Antonio Abril Abadín A80317043 Invercarpro, S.A. 0% Secretary, non-board member
Mr. Antonio Abril Abadín A15137318 Kenner, S.A 0% Secretary, non-board member
Mr. Antonio Abril Abadín A08478448 Kettering, S.A. 0% Secretary, non-board member
Mr. Antonio Abril Abadín A15388366 Kiddys Class España, S.A. 0% Secretary, non-board member
Mr. Antonio Abril Abadín A15334725 Lefties España, S.A. 0% Secretary, non-board member
Mr. Antonio Abril Abadín B83077594 Liprasa Cartera, S.A. 0% Secretary, non-board member
Mr. Antonio Abril Abadín A70086350 Massimo Dutti, S.A. 0% Secretary, non-board member
Mr. Antonio Abril Abadín A15569890 Massimo Dutti Logística, S.A.
0% Secretary, non-board member
Mr. Antonio Abril Abadín A15049299 Nikole, S.A 0% Secretary, non-board member
Mr. Antonio Abril Abadín A15346166 Often Textil, S.A. 0% Secretary, non-board member
Mr. Antonio Abril Abadín A15026347 Oysho España, S.A. 0% Secretary, non-board member
Mr. Antonio Abril Abadín A15327612 Oysho Logística, S.A. 0% Secretary, non-board member
Mr. Antonio Abril Abadín A15497225 Plataforma Europa, S.A. 0% Secretary, non-board member
Mr. Antonio Abril Abadín A70020714 Plataforma Logística de León, S.A.
0% Secretary, non-board member
Mr. Antonio Abril Abadín A15355290 Plataforma Logística Meco, S.A.
0% Secretary, non-board member
Mr. Antonio Abril Abadín A15108673 Pull&Bear España, S.A. 0% Secretary, board member
Mr. Antonio Abril Abadín A15458128 Pull&Bear Logística, S.A. 0% Secretary, non-board member
Mr. Antonio Abril Abadín A15022585 Samlor, S.A 0% Secretary, non-board member
Mr. Antonio Abril Abadín A08478448 Skhuaban, S.A. 0% Secretary, non-board member
Mr. Antonio Abril Abadín A15568165 Stear, S.A 0% Secretary, non-board member
Mr. Antonio Abril Abadín A60348240 Stradivarius España, S.A. 0% Secretary, non-board member
Mr. Antonio Abril Abadín A15137318 Stradivarius Logística, S.A.
0% Secretary, non-board member
Mr. Antonio Abril Abadín A15234065 Tempe, S.A. 0% Vice secretary, board member
Mr. Antonio Abril Abadín A15058324 Trisko, S.A 0% Secretary, non-board member
Mr. Antonio Abril Abadín A15346166 Uterqüe, S.A. 0% Secretary, non-board member

What is it?
What did it do in 2007?
How did it do it?
Where is it?
How is it governed?
Who forms the teams?
How does it ensure sustainability?
Economic and Financial Report
Annual Corporate Governance Report
71
Board member Company tax number Company name % ownership Post
Mr. Antonio Abril Abadín A70126164 Uterqüe España, S.A. 0% Secretary, non-board member
Mr. Antonio Abril Abadín A70126149 Uterqüe Logística, S.A. 0% Secretary, non-board member
Mr. Antonio Abril Abadín A08447427 Zara, S.A. 0% Secretary, non-board member
Mr. Antonio Abril Abadín A15022510 Zara España, S.A. 0% Secretary, board member
Mr. Antonio Abril Abadín A15710965 Zara Logística, S.A. 0% Secretary, non-board member
Mr. Antonio Abril Abadín A15121049 Zintura, S.A. 0% Secretary, non-board member
Mr. Antonio Abril Abadín 450661802 Zara Belgique, S.A. 0% Board member
Mr. Antonio Abril Abadín 895218121 Zara Canada, S.A. 0% Board member
Board member Company tax number Company name % ownership Post
Mr. Antonio Abril Abadín - Zara Chile, S.A. 0% Board member
Mr. Antonio Abril Abadín 24209717 Zara Danmark, S.A. 0% Board member
Mr. Antonio Abril Abadín 94352564 Zara Hellas, S.A. 0% Board member
Mr. Antonio Abril Abadín 803910010B01 Zara Vastgoed, B.V. 0% Board member
Mr. Antonio Abril Abadín 8753489B01 Zara Holding, B.V. 0% Supervisory Director
Mr. Antonio Abril Abadín - Zara Norge, S.A.. 0% Board member
Mr. Antonio Abril Abadín 556569857701 Zara Sverige, Ab 0% Board member
Mr. Antonio Abril Abadín 548644 Zara Suisse, S.A.R.L. 0% Board member
Mr. Antonio Abril Abadín 213950900014 G.Zara Uruguay, S.A. 0% Board member
Mr. Antonio Abril Abadín 30536946-1 Zara Venezuela, S.A. 0% Board member
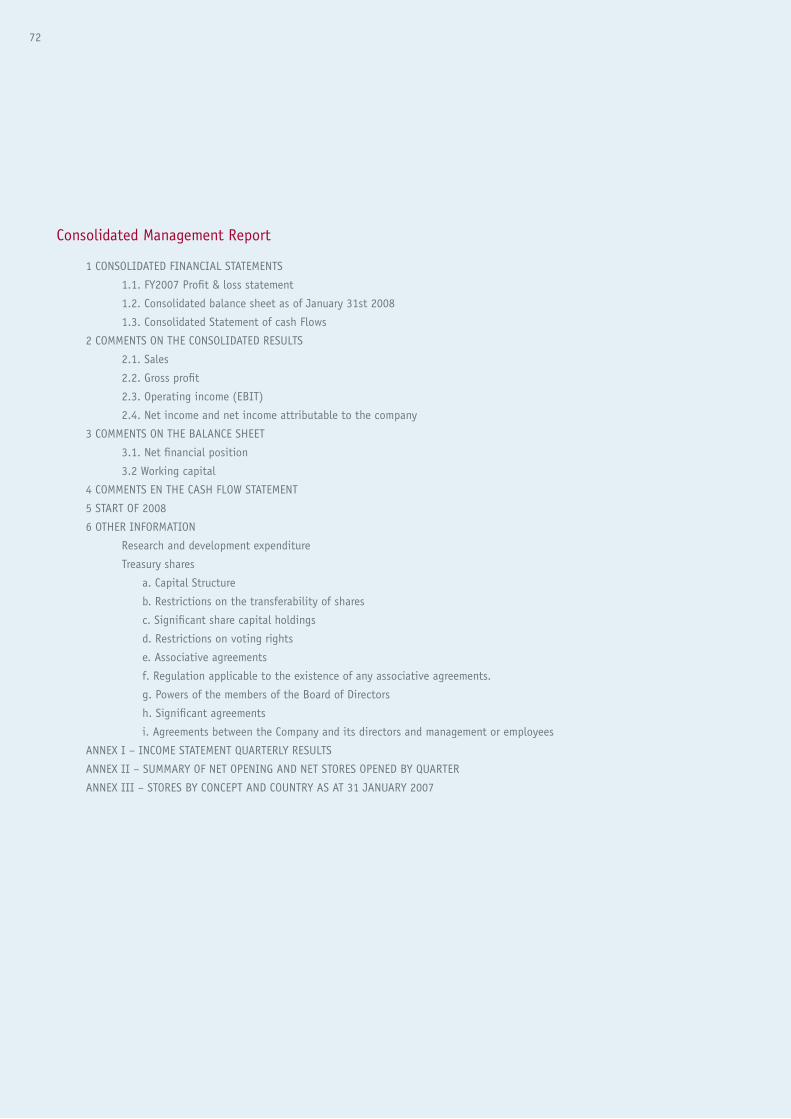
72
1 CONSOLIDATED FINANCIAL STATEMENTS
1.1. FY2007 Profit & loss statement
1.2. Consolidated balance sheet as of January 31st 2008
1.3. Consolidated Statement of cash Flows
2 COMMENTS ON THE CONSOLIDATED RESULTS
2.1. Sales
2.2. Gross profit
2.3. Operating income (EBIT)
2.4. Net income and net income attributable to the company
3 COMMENTS ON THE BALANCE SHEET
3.1. Net financial position
3.2 Working capital
4 COMMENTS EN THE CASH FLOW STATEMENT
5 START OF 2008
6 OTHER INFORMATION
Research and development expenditure
Treasury shares
a. Capital Structure
b. Restrictions on the transferability of shares
c. Significant share capital holdings
d. Restrictions on voting rights
e. Associative agreements
f. Regulation applicable to the existence of any associative agreements.
g. Powers of the members of the Board of Directors
h. Significant agreements
i. Agreements between the Company and its directors and management or employees
ANNEX I – INCOME STATEMENT QUARTERLY RESULTS
ANNEX II – SUMMARY OF NET OPENING AND NET STORES OPENED BY QUARTER
ANNEX III – STORES BY CONCEPT AND COUNTRY AS AT 31 JANUARY 2007
Consolidated Management Report

What is it?
What did it do in 2007?
How did it do it?
Where is it?
How is it governed?
Who forms the teams?
How does it ensure sustainability?
Economic and Financial Report
Annual Corporate Governance Report
73
1. Consolidated financial statements
1.1. FY2007 profit & loss statement
(Million euros) Year 2007 Year 2006 Var %07/06
Net sales 9,435 8,196 15%
Cost of sales (4,086) (3,589)
Gross profit 5,349 4,607 16%
Gross margin 56.7% 56.2%
Operating expenses (3,226) (2,800) 15%
Other net operating income (losses) 27 (17)
Operating cash flow (EBITDA) 2,149 1,790 20%
EBITDA margin 22.8% 21.8%
Amortisation and depreciation (497) (433) 15%
Operating income (EBIT) 1,652 1,356 22%
EBIT margin 17.5% 16.5%
Financial results 1 (14)
Results from companies consolidated by equity method (8) (3)
Income before taxes 1,646 1,339 23%
EBT margin 17.4% 16.3%
Taxes (388) (330)
Net income 1,258 1,010 25%
Net margin 13.3% 12.3%
Minorities 7 8
Net income attributable to the controlling company 1,250 1,002 25%
Net income margin 13,3% 12,2%
Earnings per share, cents of euro (*) 201 161 25%
(*) Shares for EPS calculation 620.9 million for 2007 and 2006.

74
1.2 Consolidated Balance Sheet as of 31 January 2008
Assets (Million euros) 31 January 2008 31 January 2007
CURRENT ASSETS 2,982 2,148
Cash & cash equivalents 1,466 906
Receivables 464 364
Inventories 1,007 824
Other 45 55
NON CURRENT ASSETS 4,124 3,594
Tangible assets 3,192 2,801
Intangible assets 644 568
Financial investments 36 38
Other 253 187
Total assets 7,106 5,742
Liabilities 31 January 2008 31 January 2007
CURRENT LIABILITIES 2,458 1,885
Payables 2,087 1,740
Financial debt 371 145
NON CURRENT LIABILITIES 430 387
Financial debt 42 47
Deferred taxes 111 104
Other 277 235
SHAREHOLDERS' EQUITY 4,217 3,471
Equity attributable to the Group 4,193 3,448
Minority interests 24 22
Total liabilities & shareholders’ equity 7,106 5,742
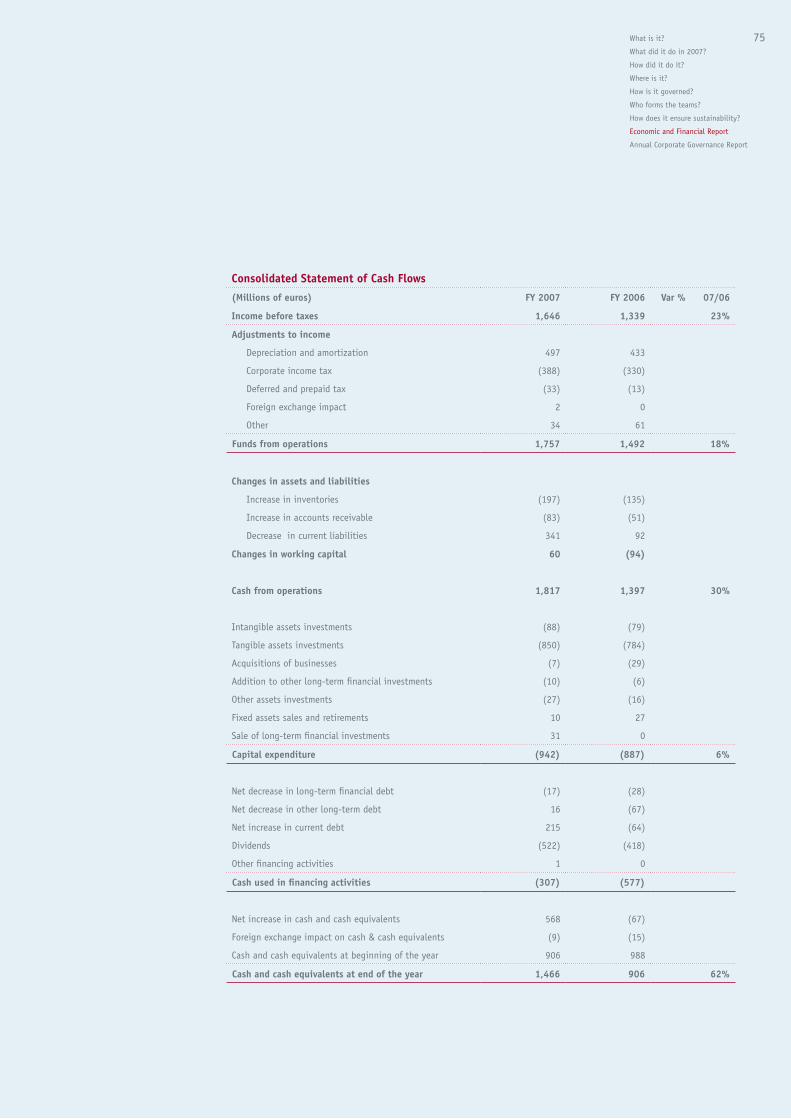
What is it?
What did it do in 2007?
How did it do it?
Where is it?
How is it governed?
Who forms the teams?
How does it ensure sustainability?
Economic and Financial Report
Annual Corporate Governance Report
75
Consolidated Statement of Cash Flows
(Millions of euros) FY 2007 FY 2006 Var % 07/06
Income before taxes 1,646 1,339 23%
Adjustments to income
Depreciation and amortization 497 433
Corporate income tax (388) (330)
Deferred and prepaid tax (33) (13)
Foreign exchange impact 2 0
Other 34 61
Funds from operations 1,757 1,492 18%
Changes in assets and liabilities
Increase in inventories (197) (135)
Increase in accounts receivable (83) (51)
Decrease in current liabilities 341 92
Changes in working capital 60 (94)
Cash from operations 1,817 1,397 30%
Intangible assets investments (88) (79)
Tangible assets investments (850) (784)
Acquisitions of businesses (7) (29)
Addition to other long-term financial investments (10) (6)
Other assets investments (27) (16)
Fixed assets sales and retirements 10 27
Sale of long-term financial investments 31 0
Capital expenditure (942) (887) 6%
Net decrease in long-term financial debt (17) (28)
Net decrease in other long-term debt 16 (67)
Net increase in current debt 215 (64)
Dividends (522) (418)
Other financing activities 1 0
Cash used in financing activities (307) (577)
Net increase in cash and cash equivalents 568 (67)
Foreign exchange impact on cash & cash equivalents (9) (15)
Cash and cash equivalents at beginning of the year 906 988
Cash and cash equivalents at end of the year 1,466 906 62%

76
2 Comments on the consolidated results
The results for FY2007 reflect significant growth in sales and a strong operating performance, resulting
in the Group improving its financial returns.
At FYE INDITEX operated 3,691 stores in 68 countries through seven different concepts: Zara, Pull &
Bear, Massimo Dutti, Bershka, Stradivarius, Oysho and Zara Home.
INDITEX has made the decision to coordinate in full the product ranges and the retailing operations of
Zara Childrenswear and Kiddy’s Class. Due to this reason, operating figures from Kiddy’s Class are now
reported as part of Zara.
2.1. Sales
Net sales reached €9,435 million, an increase of 15% over the previous year. Sales growth in local cu-
rrencies and constant perimeter has been 17%.
Number of stores and openings
The list of openings and existing stores at FYE is as follows:
Net openings Total stores
Concept 2007 2006 31 january 2008 31 january 2007
Zara 186 174 1,361 1,175
Pull and Bear 52 40 519 467
Massimo Dutti 27 30 426 399
Bershka 77 65 510 433
Stradivarius 77 41 381 304
Oysho 89 47 290 201
Zara Home 52 42 204 152
Total 560 439 3,691 3,131
A list of quarterly openings and stores opened as at FYE by concept and by country is included in An-
nexes II and III.
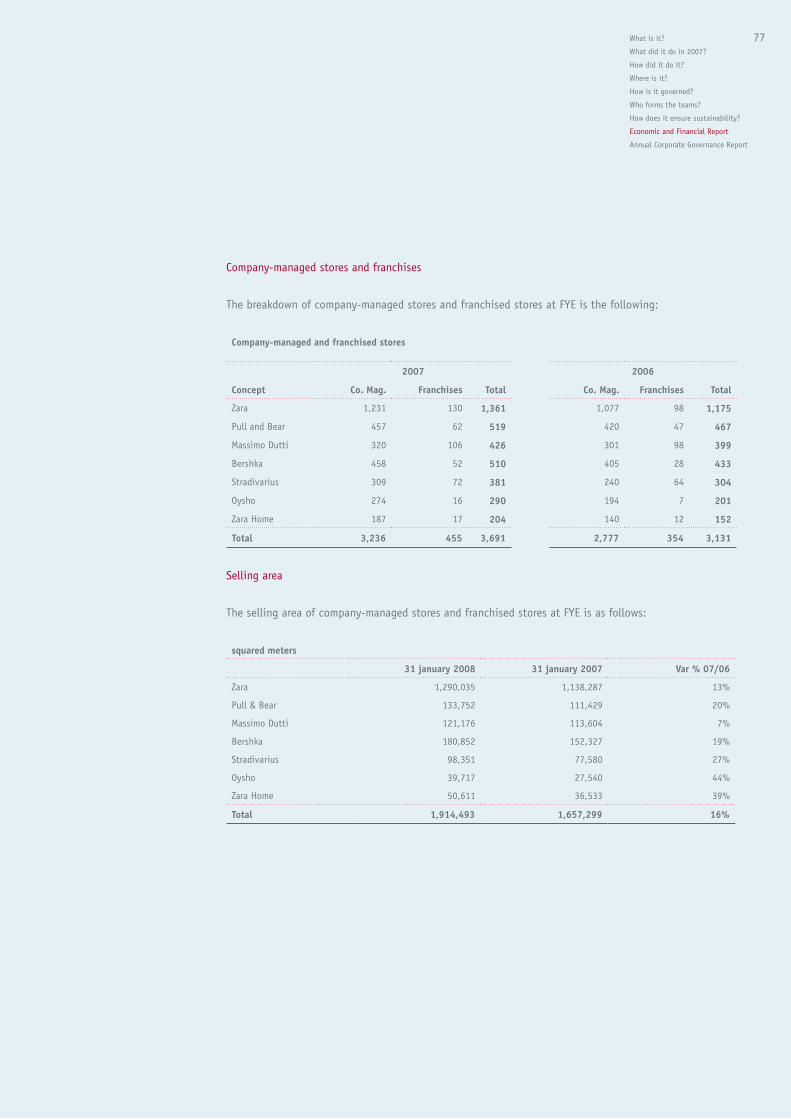
What is it?
What did it do in 2007?
How did it do it?
Where is it?
How is it governed?
Who forms the teams?
How does it ensure sustainability?
Economic and Financial Report
Annual Corporate Governance Report
77
Company-managed stores and franchises
The breakdown of company-managed stores and franchised stores at FYE is the following:
Company-managed and franchised stores
2007 2006
Concept Co. Mag. Franchises Total Co. Mag. Franchises Total
Zara 1,231 130 1,361 1,077 98 1,175
Pull and Bear 457 62 519 420 47 467
Massimo Dutti 320 106 426 301 98 399
Bershka 458 52 510 405 28 433
Stradivarius 309 72 381 240 64 304
Oysho 274 16 290 194 7 201
Zara Home 187 17 204 140 12 152
Total 3,236 455 3,691 2,777 354 3,131
Selling area
The selling area of company-managed stores and franchised stores at FYE is as follows:
squared meters
31 january 2008 31 january 2007 Var % 07/06
Zara 1,290,035 1,138,287 13%
Pull & Bear 133,752 111,429 20%
Massimo Dutti 121,176 113,604 7%
Bershka 180,852 152,327 19%
Stradivarius 98,351 77,580 27%
Oysho 39,717 27,540 44%
Zara Home 50,611 36,533 39%
Total 1,914,493 1,657,299 16%

78
Like-for-like sales (LFL)
Store sales are those that occur in company-managed stores and franchised stores of any of the Group’s
concepts, net of any consumption tax and converted to euros at the average exchange rates for the
fiscal year.
The Group’s like-for-like sales grew by 5% in FY2007. Like-for-like represents the annual change in store
sales of any concept of the Group that were opened for the whole of fiscal years 2007 and 2006, conver-
ted to a fixed exchange rate.
Below is the increase in like-for-like sales bi-annually for the last two fiscal years:
2007 2006
First Half 7% 5%
Second Half 3% 6%
Full Year 5% 5,5%
The like-for-like calculation includes 65% of FY2007 store sales (i.e. sales in stores opened for the whole
of fiscal years 2007 and 2006).
Sales by concept
Net sales by concept in FY2007 and FY2006 are shown in the table below:
“Net Sales (Million €)” % on total
Concept 2007 2006 Var % 07/06 2007 2006
Zara 6,264 5,534 13% 66,4% 67,5%
Non-Zara 3,171 2,662 19% 33,6% 32,5%
Pull and Bear 614 519 18% 6,5% 6,3%
Massimo Dutti 696 614 13% 7,4% 7,5%
Bershka 925 798 16% 9,8% 9,7%
Stradivarius 521 428 22% 5,5% 5,2%
Oysho 213 165 30% 2,3% 2,0%
Zara Home 201 139 45% 2,1% 1,7%
Total sales 9,435 8,196 15% 100,0% 100,0%
Zara sales growth in local currencies and constant perimeter has been 16%.

What is it?
What did it do in 2007?
How did it do it?
Where is it?
How is it governed?
Who forms the teams?
How does it ensure sustainability?
Economic and Financial Report
Annual Corporate Governance Report
79
Store sales by geographic area
The following graph shows store sales by geographic areas:
2007
Spain 37,5%
Asia & RoW 9,4%
Europe ex-Spain 42,4%
America 10,8%
2006
Spain 39,6%
Asia & RoW 8,9%
Europe ex-Spain 40,6%
America 11%
Due to the International expansion strategy of the Group, Europe ex-Spain is the area with the highest
growth on store sales.
The percentage of international store sales by concept is the following:
% International store sales
Concept 2007 2006
Zara 72,0% 70,5%
Non-Zara 44,3% 40,0%
Pull and Bear 45,3% 40,2%
Massimo Dutti 51,3% 49,4%
Bershka 49,6% 45,0%
Stradivarius 24,9% 19,7%
Oysho 40,4% 35,1%
Zara Home 44,9% 35,4%
Total 62,5% 60,4%

80
Sales in company-managed and franchised stores
The table below shows the breakdown of sales in company-managed and franchised stores for each of
the concepts of the Group:
Store sales in company-managed and franchised stores
2007 2006
Concept Company managed Franchised Company managed Franchised
Zara 88% 12% 91% 9%
Non-Zara 85% 15% 86% 14%
Pull and Bear 88% 12% 90% 10%
Massimo Dutti 72% 28% 72% 28%
Bershka 90% 10% 95% 5%
Stradivarius 84% 16% 81% 19%
Oysho 94% 6% 97% 3%
Zara Home 92% 8% 93% 7%
Total 87% 13% 89% 11%
The change in FY2007 over FY2006 is mainly due to the agreement to operate the Venezuelan subsidiary
on a franchised basis with a local partner.
2.2. Gross profit
The gross profit rose to €5,349 million, 16% higher than the previous year. The Gross margin has rea-
ched 56.7% of sales (56.2% in FY2006).
Should currencies remain at current level, INDITEX considers a stable level as its best estimate for the
FY2008 gross margin based on that of FY2007.
2.3. Operating income (EBIT)
FY2007 EBITDA came to €2,149 million, an increase of 20% compared to the previous year, reaching
22.8% of sales (21.8% in FY2006).

What is it?
What did it do in 2007?
How did it do it?
Where is it?
How is it governed?
Who forms the teams?
How does it ensure sustainability?
Economic and Financial Report
Annual Corporate Governance Report
81
Below is a breakdown of Operating expenses over the last two years:
(Million euros) 2007 2006 Var %
Personnel expenses 1,473 1,251 18%
Rental expenses 855 718 19%
Other operating expenses 898 831 8%
Total operating expenses 3,226 2,800 15%
At FYE 2007 the number of employees reached 79,517 (69,240 at FYE2006).
Operating expenses include all the start-up costs for new openings (essentially leases and salaries paid
for stores that are not yet open).
The future lease commitments as a result of the minimum non cancellable lease payments amounted to
€2,432 million at FYE2007.
The Reduce 3 plan to improve the operational efficiency of the Group is on track to meet the target set
by INDITEX.
EBIT came to €1,652 million, 22% higher, reaching 17.5% of sales (16.5% in FY2006).
EBIT by concept
The breakdown of EBIT by concept is the following:
EBIT by concept (Million €) % EBIT on sales EBIT by concept on total (%)
Concept 2007 2006 Var % 07/06 2007 2006 2007 2006
Zara 1,116 911 23% 17.8% 16.5% 67.5% 67.1%
Non-Zara 536 446 20% 16.9% 16.7% 32.5% 32.9%
Pull and Bear 99 78 27% 16.1% 15.0% 6.0% 5.8%
Massimo Dutti 106 81 31% 15.2% 13.1% 6.4% 5.9%
Bershka 154 131 17% 16.6% 16.5% 9.3% 9.7%
Stradivarius 119 98 22% 22.9% 23.0% 7.2% 7.2%
Oysho 40 39 3% 18.8% 23.7% 2.4% 2.9%
Zara Home 18 18 1% 9.2% 13.2% 1.1% 1.4%
Total EBIT 1,652 1,356 22% 17.5% 16.5% 100.0% 100.0%
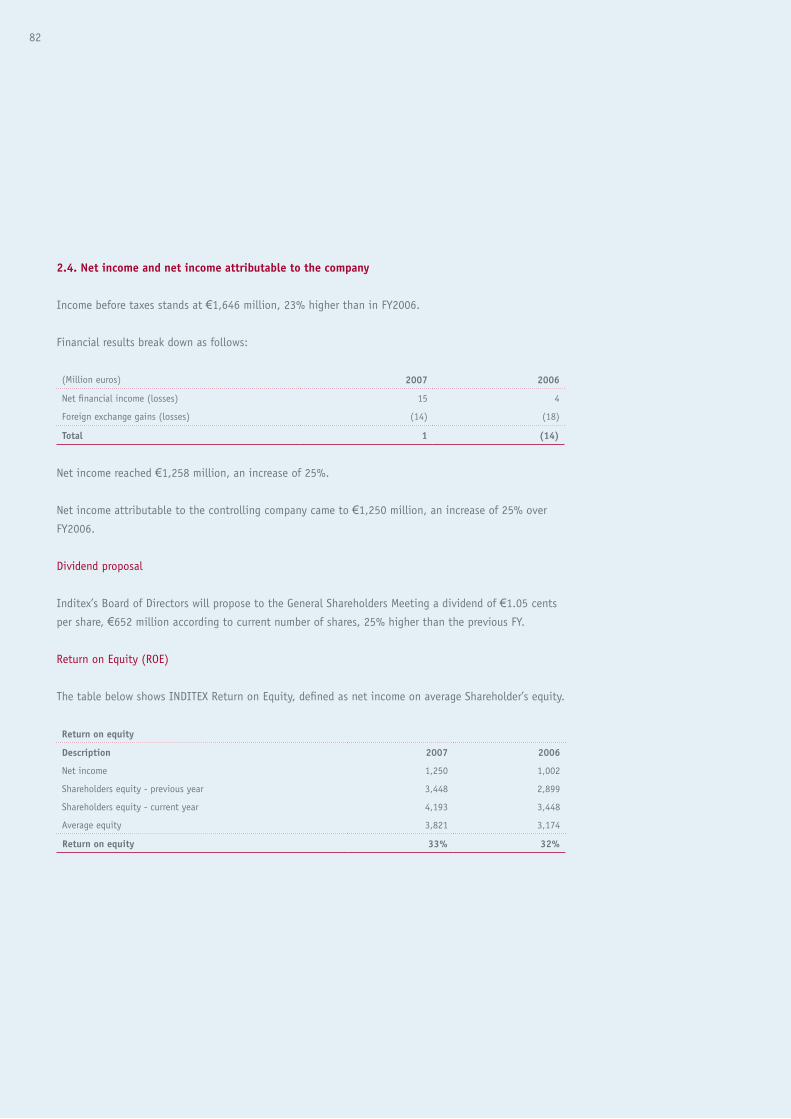
82
2.4. Net income and net income attributable to the company
Income before taxes stands at €1,646 million, 23% higher than in FY2006.
Financial results break down as follows:
(Million euros) 2007 2006
Net financial income (losses) 15 4
Foreign exchange gains (losses) (14) (18)
Total 1 (14)
Net income reached €1,258 million, an increase of 25%.
Net income attributable to the controlling company came to €1,250 million, an increase of 25% over
FY2006.
Dividend proposal
Inditex’s Board of Directors will propose to the General Shareholders Meeting a dividend of €1.05 cents
per share, €652 million according to current number of shares, 25% higher than the previous FY.
Return on Equity (ROE)
The table below shows INDITEX Return on Equity, defined as net income on average Shareholder’s equity.
Return on equity
Description 2007 2006
Net income 1,250 1,002
Shareholders equity - previous year 3,448 2,899
Shareholders equity - current year 4,193 3,448
Average equity 3,821 3,174
Return on equity 33% 32%

What is it?
What did it do in 2007?
How did it do it?
Where is it?
How is it governed?
Who forms the teams?
How does it ensure sustainability?
Economic and Financial Report
Annual Corporate Governance Report
83
Return on Capital Employed (ROCE)
The table below shows INDITEX Return on Capital Employed, defined as EBIT on average capital emplo-
yed (Shareholder’s equity plus net financial debt).
Return on capital employed
Description 2007 2006
Ebit 1,652 1,356
Average capital employed
Average shareholders' equity 3,821 3,174
Average net financial debt (*) 0 0
Total average capital employed 3,821 3,174
Return on capital employed 43% 43%
(*) Zero when net cash
ROCE by concept
The table below shows the Return on Capital Employed by concept:
Roce by concept
Concept 2007 2006
Zara 41% 40%
Non Zara 50% 50%
Pull & Bear 47% 43%
Massimo Dutti 44% 33%
Bershka 59% 55%
Stradivarius 74% 86%
Oysho 39% 55%
Zara Home 20% 33%
Total 43% 43%

84
3 Comments on the balance sheet
INDITEX Consolidated Balance Sheet maintains a similar structure to that it showed at FYE2006, without
net financial debt and with a negative operating working capital position, a consequence of the busi-
ness model.
Net financial position
The net financial position is shown in the table below:
Net financial cash (DEBT) (MillIon euros)
31 january 2008 31 january 2007
Cash & cash equivalents 1,466 906
Current financial debt (371) (145)
Non current financial debt (42) (47)
Net financial cash (DEBT) 1,052 714
Working capital
The table below shows a breakdown of working capital of the last two fiscal years:
Working capital (million euros)
31 january 2008 31 january 2007
Inventories 1,007 824
Receivables 464 364
Payables (2,087) (1,740)
Other 45 55
Operating working capita (571) (497)

What is it?
What did it do in 2007?
How did it do it?
Where is it?
How is it governed?
Who forms the teams?
How does it ensure sustainability?
Economic and Financial Report
Annual Corporate Governance Report
85
4 Comments on the cash flow statement
The summary of the cash flow statement is the following:
Cash flow summary
(millons euros) FY2007 FY2006 Var % 07/06
Net income 1,646 1,339 23%
Funds from operations 1,757 1,492 18%
Changes in working capital 60 (94)
Cash from operations 1,817 1,397 30%
Net capital expenditure (942) (887) 6%
Free cash flow 876 510 72%
Dividends (522) (418)
Net debt decrease (355) (93)
Others 1 -
Funds from Operations grew by 18% in 2007, reaching €1,757 million. Working Capital financing has
taken Cash from Operations to €1,817 million, 30% higher than in FY2006.
Capital Expenditure for the FY amounted to €942 million, 6% higher.
Free cash flow increased by 72% to €876 million and a €522 million dividend was paid to shareholders.

86
5 Start of 2008
During the beginning of 1H2008 sales performance is according to Management expectations. Store
sales in local currencies have increased by 17% from 1 Feb. to 23 Mar. 2008.
Inditex will launch a new accessories concept in the Second Half 2008 under the name Uterqüe. The new
concept expects to open between 20 and 30 stores in 2008.
The store openings plan for FY2008 is the following:
2008 Openings forecast
Concept Range % International Total 2007
Zara 145 - 155 85% 186
Pull and Bear 65 - 75 80% 52
Massimo Dutti 45 - 55 75% 27
Bershka 85 - 95 85% 77
Stradivarius 75 - 85 70% 77
Oysho 85 - 95 65% 89
Zara Home 40 - 50 80% 52
Uterqüe 20 - 30 20% -
Total net openings 560 - 640 560
Approximately 70% of the contracts have been signed but in some cases openings may not take place in
2008.
Expected CAPEX in FY2008 is approximately €1 billion. The opening of new stores and the refurbishment
of existing stores will represent the majority of the CAPEX.

What is it?
What did it do in 2007?
How did it do it?
Where is it?
How is it governed?
Who forms the teams?
How does it ensure sustainability?
Economic and Financial Report
Annual Corporate Governance Report
87
6 Other information
Research and development expenditure
The Inditex Group has not performed and has not outsourced to third parties any research and develo-
pment projects, which are considered as projects to which amounts are allocated over several years to
develop products that are expected to generate profits over a number of years.
Nonetheless, since its incorporation, management of the Company has been underpinned by available
technology in all areas of its activity to improve the manufacturing and distribution processes, and
by developing, using its own resources or with the support of third parties, instruments that facilitate
business management. Examples of this technology include point-of-sale terminals, inventory manage-
ment and administration systems, delivery systems in the distribution centers, in-store communication
systems, and in-store clothing and footwear labeling systems.
Treasury shares
Inditex holds 2,374,809 treasury shares of fifteen eurocents par value each, while the group companies
do not hold any shares in the Parent Company.
a. Capital structure
The share capital of Inditex amounts to Euros 93,499,560, divided into 623,330,400 shares
of fifteen eurocents (Euros 0.15) par value each, all of the same class and series, which are
subscribed and fully paid up.
Shares confer the holder the condition of partner and the rights established in the Spanish
Companies Act, other applicable legislation, and the Company’s legal organization documents.
Each share confers the right to one vote, while a minimum number of shares does not have to
be held to be able to attend general meetings.
b. Restrictions on the transferability of shares
There are no statutory restrictions on the transfer of shares and no shareholder agreements
restricting or defining the conditions for the free transfer of shares.

88
c. Significant share capital holdings
According to the information provided on the website of the Spanish National Securities Market
Commission and information provided to Inditex by the shareholder, Rosp Corunna Participa-
ciones Empresariales, S.L., the holders of the most significant share capital holdings in the
Company at 31 January 2008, excluding board members, were as follows:
Name or company name of shareholder Number of direct voting rights
Number of indirect voting rights (*)
Voting rights as per-centage of total
Mr. Amancio Ortega Gaona (1) 0 369,600,063 59.294%
Ms. Rosalía Mera Goyenechea (2) 0 36,550,000 5.864%
CAPITAL RESEARCH AND MANAGEMENT COMPANY (3)
0 32,204,298 5.166%
(*) Through:
Name or company name of direct shareholder Number of direct voting rights
Voting rights as percentage of total
(1) GARTLER, S.L. 311,727,598 50.010%
(1) PARTLER 2006, S.L. 57,872,465 9.284%
(2) ROSP CORUNNA PARTICIPACIONES EMPRESARIALES, S.L. 36,550,000 5.864%
(3) INSTITUCIONES DE INVERSIÓN COLECTIVA GESTIONADAS 32,204,298 5.166%
According to the information provided by the Spanish National Securities Market Commission on
its website, at 31 January 2008 Chase Nominees Ltd., as custodian bank/international deposi-
tory agent, holds a 10% direct share capital holding in the Company.
d. Restrictions on voting rights
No legal or statutory restrictions on exercising voting rights exist, except for the restriction
established in Article 44 of the Spanish Companies Act, which stipulates that any sharehol-
ders that default on payment of unpaid shareholder contributions cannot exercise their voting
rights.
e. Associative agreements
The Company is not aware of the existence of any associative agreements.
f. Regulations applicable to the appointment and replacement of members of the Board of Direc-
tors and modifications to the Company’s articles of association

What is it?
What did it do in 2007?
How did it do it?
Where is it?
How is it governed?
Who forms the teams?
How does it ensure sustainability?
Economic and Financial Report
Annual Corporate Governance Report
89
Appointment and replacement of members of the Board of Directors
The system for selecting, appointing and re-electing members of Inditex’s Board of Directors
consists of a formal and transparent procedure, expressly regulated by the Company’s articles of
association and the Board of Directors Regulations.
Board members will be appointed by the shareholders in a general meeting and will perform
their duties during the period established in the articles of association, which is currently five
years.
In general meetings, shareholders can re-elect board members an indefinite number of times
for equal terms. Shareholders can also agree the dismissal of board members at any time.
The Board of Directors can temporarily appoint replacements for vacant positions on the board
by selecting individuals from among the shareholders until the next general meeting is held.
Any proposals to appoint board members presented by the Board of Directors for consideration
by the shareholders in general meetings and any appointment decisions made by the share-
holders via the cooption powers with which they have been legally vested must be preceded
by the corresponding report from the Appointments and Remunerations Committee and, in the
case of independent board members, by the relevant proposal from this Committee.
When the Board of Directors does not follow the recommendations of the Appointments and
Remunerations Committee, it must present reasons for its action, which must be documented
in minutes.
The Board of Directors and the Appointments and Remunerations Committee will, within the
scope of their powers, endeavor to ensure that the potential candidates have recognized
solvency, ability and experience, and will exercise due rigor when assessing candidates for the
position of independent board member.
The Board of Directors may not propose or appoint any candidate for the position of indepen-
dent board member who simultaneously holds positions as director in more than four listed
companies in addition to the Company. Individuals cannot be proposed or appointed for the
position of independent board member unless they fulfill the independence criteria established
in Section 1.(c) of Article 7 of the Board of Directors Regulations.
Any proposals to re-appoint board members which the Board of Directors decides to present
to the shareholders in a general meeting must be formally prepared and must include a report
issued by the Appointments and Remunerations Committee evaluating the quality of work and
dedication to the post of the board members proposed during the preceding mandate and, in

90
the case of independent board members, the corresponding proposal from the Committee to
re-appoint them.
Furthermore, the Board of Directors must provide a description of the character of each board
member to the shareholders in general meetings, and the shareholders must perform or ratify
the appointment, which must be confirmed, or where applicable, modified in the Annual Corpo-
rate Governance Report subsequent to being verified by the Appointments and Remunerations
Committee.
Regarding the replacement of board members, board members must resign from their posts
when the term of their appointment expires and when the shareholders so decide in accordance
with the legal or statutory powers vested.
Board members must offer their resignation to the Board of Directors and formalize, where
necessary, their resignation in the following circumstances:
a) When they reach 68 years of age. Nonetheless, the board members occupying the posi-
tion of Managing Director or General Manager must offer their resignation to the Board
of Directors when they reach 65 years of age, being able to continue as board members
until they reach the age of 68. Exceptionally, the aforementioned rules will not apply in
the case of the founding Chairman of the Company, Mr. Amancio Ortega Gaona..
b) When they resign from the executive positions with which they were associated on
being appointed as board members.
c) When they are subject to any of the circumstances of incompatibility or prohibition
established by law, in the Company’s articles of association, or in the Board of Directors
Regulations. In particular, independent board members must offer their resignation to
the Board of Directors and formalize, where necessary, their resignation when they are
subject to any of the circumstances of incompatibility stipulated in Article 7.1.(c) of
these Regulations or when they subsequently become directors in more than four listed
companies in addition to the Company.
d) When they receive a serious warning from the Control and Audit Committee for having
breached their obligations as board members.
Board members must also inform the Board of Directors and, where necessary, offer the Board
of Directors and formalize their resignation if the board considers resignation is necessary
because of circumstances which could affect the credit or reputation of the Company or, by
whatever means, expose the Company’s interests to risk, and when the reasons for the board
members being appointed no longer prevail.

What is it?
What did it do in 2007?
How did it do it?
Where is it?
How is it governed?
Who forms the teams?
How does it ensure sustainability?
Economic and Financial Report
Annual Corporate Governance Report
91
Board members representing shareholders must offer their resignation when the shareholders
they represent sell their entire share capital holding or reduce it to a level which requires the
number of board members representing shareholders to be decreased.
Lastly, when a board member leaves the post before the end of the mandate, as a result of
resignation or any other reason, an explanation for the reasons must be given in a letter to
all the members of the Board of Directors, and the Company must present these reasons in the
Annual Corporate Governance Report. In the case of independent board members, the Appo-
intments and Remunerations Committee must also present a proposal for early dismissal or
resignation.
Modification to the articles of association
The procedure for modifying Inditex’s articles of association is established in Article 144 of
the Spanish Companies Act which requires, among others, that the modification agreement
be accepted by the shareholders in a general meeting with the quorum required to constitute
and adopt agreements stipulated in Article 103 of the aforementioned Act. Inditex’s articles of
association have not increased the quorum for modifying the statutory text.
g. Powers of the members of the Board of Directors
The Board of Directors is responsible for managing, administering and representing the Com-
pany with full powers and without prejudice to the legal or statutory powers with which the
shareholders have been vested.
Within the legally established limits, the chairman of the Board of Directors and the Executive
Commission, Mr. Amancio Ortega Gaona and the First Vice Chairman and Managing Director, Mr.
Pablo Isla Álvarez de Tejera have been vested with all the powers listed below in order that
they be exercised in the following way and under the following conditions: jointly and severally
and indistinctively, except for certain powers which involve: a) the use of funds exceeding a
certain amount, in which case joint or shared action will be required by the two aforementio-
ned members of the Executive Committee or by one of these individuals and another individual
who, by any legal title, has also been vested with the same power; and/or b) the disposal or
encumbrance of the Company’s real estate assets, in which case prior approval is required from
the Executive Committee or, where applicable, the Board of Directors.
The requirement to act jointly stipulated in the previous paragraph will not be applicable in
the case of operations, actions or contracts, irrespective of their value, that are performed or
signed by INDITEX Group companies. These companies are considered to be any Spanish or
foreign companies in which INDITEX, S.A. directly or indirectly through other subsidiaries holds
at least a 50% interest. In these circumstances, either of the two members of the Commission

92
who have been vested with powers can act jointly and severally alone, on behalf of and repre-
senting the Company, irrespective of the amount involved.
Details of powers:
1.- Appear on behalf of and represent the Company before any authorities, bodies, centers,
sections or offices of the Spanish government, whether it be centrally or in outlying areas;
of the autonomous regional governments; of the provinces and municipalities; of corporate
government; of independent government; and of European government, including public
registries of any type; and, in general, any public or private entity. Sign and present all types
of applications, petitions, simple or sworn statements, manuscripts and documents. Define
and uphold any objectives and, in general, exercise all the powers required in order to mana-
ge and defend the rights of the Company.
2.- Sign, issue, receive and collect from the post office any postal or telegram corres-
pondence comprising ordinary or registered letters, money transfers, postal orders and
telegrams. File with these offices any claims necessary and collect, where applicable, any
compensation.
3.- Verify shipments of products and goods of any type by land, sea or air, and receive
deliveries on behalf of the Company. Make any necessary claims to rail, maritime or
transport companies in general for any damage, delay, loss or any other breach of the
transport contract, collecting any compensation where applicable agreed with these
companies or established by the courts. Sign agreements of any type with transport com-
panies, travel agencies, hotels, restaurants and any other individuals or entities involved
in the transport of passengers or in the hotel and catering sector.
4.- Claim for and collect any amounts owed to the Company, signing receipts and authorizing
any acknowledgements of receipt. Make payments. Disclose accounts and demand disclosure
of accounts, and challenge or approve accounts. Set up, cancel and withdraw guarantee
deposits of all classes including those placed with/and of the General Bank for Deposits of
the Spanish Treasury and its branches.
5.- Arrange all types of loan and credit agreements. Open current, credit, savings and any
other type of account with public and private credit institutions and/or financial institu-
tions, as well as any other accounts in the name of the Company. Pay in funds, withdraw
funds or obtain funds by way of receipts and checks. Make or order payments by bank
transfer. Endorse or permit charging of bills of exchange, bank transfers and credit notes,
as well as receipts or invoices payable by the Company. Approve or contest the balances
of the aforementioned accounts. Act as guarantor for other INDITEX Group companies

What is it?
What did it do in 2007?
How did it do it?
Where is it?
How is it governed?
Who forms the teams?
How does it ensure sustainability?
Economic and Financial Report
Annual Corporate Governance Report
93
and, therefore, sign on their behalf guarantees, deposits and any other similar documents,
along with guarantee and counter-guarantee documents. In general, perform any activities
permitted by banking legislation and best practice.
6.- Release, endorse, cede or transfer by any means other than endorsement, accept and
sign, demand consent for, guarantee, require cession of provision of, collect, discount
and pay bills of exchange, promissory notes, checks, money orders, and any other trade
notes. Intervene in the approval or payment thereof. Contest such bills or notes or make
the necessary declarations and responses in the relevant protests stating the reasons for
not accepting or paying bills and notes charged to the Company. Actively or passively act
in all types of legal proceedings, actions or negotiations, pre-court and court proceedings
resulting from contesting or not paying charges, as well as any other activity established
in the Exchange and Check Law or other applicable legislation.
7.- Considering the restriction described above regarding real estate assets, execute all ty-
pes of deeds and contracts relating to all types of assets, rights, securities, stakes, sha-
res and share capital holdings for and with the prices, amounts paid, amounts received,
terms, periods, agreements, clauses and conditions established. In particular, acquire,
cede, grant, dispose of or transfer by any means, including awarding in settlement, of
all types of assets, rights, brands, other trademarks and industrial property, securities,
stakes, shares, and share capital holdings. Contract all types of obligatory and voluntary
insurance. Execute works, services and supplies of all types. Act as lessor or lessee in
rental, finance lease or sub-let agreements. Set up, modify, recognize and cancel land
and building rights, including real estate mortgages and pledges without transfer of
ownership and any type of encumbrance over all types of assets and rights held by the
Company. Apply for land groupings, aggregations, divisions and segregations, permits
for new construction projects, and divisions of buildings under joint ownership regime;
establishing the statutes governing such activities. Conduct and collaborate with measu-
rement, demarcation and boundary definition work, approving such work and signing any
deeds that are drawn up. Intervene using full powers to execute and fulfill such deeds
and contracts; demanding, where applicable, fulfillment of any requirements therein, and
modifying, renewing, canceling or withdrawing these deeds and contracts.
8.- Execute all types of deeds and contracts relating to information technology, manage-
ment, security and telecommunications products, equipment and systems, as well as any
assets relating to copyrights deriving from or related with these assets and, in general,
any rights relating to all types of buildings. Contract work, services and supplies of all
types for or with the prices, amounts paid, amounts received, terms, periods, agree-
ments, clauses and conditions established. In particular, acquire, cede, grant, encum-
ber, dispose of or transfer any ownership, including awarding in settlement, over the
aforementioned assets. Obtain or offer such assets as lessor or lessee through rental,
finance lease or sub-let agreements. Set up, modify, recognize and cancel land and

94
building rights and pledges over real estate assets held by the Company. Intervene using
full powers to execute and fulfill such deeds and contracts, demanding, where applicable,
fulfillment of any requirements therein, and modifying, renewing, canceling or with-
drawing these deeds and contracts.
9.- Execute any type of collaborative agreement such as franchise agreements, joint
ventures, cashpooling, distribution agreements, trade agreements, concessions, agency
agreements, and, in general, any agreements that could be intrinsic to the national and
international expansion of the Company.
10.-Appear in deeds on the incorporation, modification, merger or winding-up of all types
of entities and companies, and attend on behalf of the Company assemblies, meetings,
or ordinary and extraordinary meetings. Intervene in such meetings, cast votes in the
appropriate manner, whatever the issues in question, and accept agreements. Accept
positions and appointments and, in general, exercise on behalf of the Company any rights
it is granted.
11.- Attend on behalf of and in representation of the Company residents’ association and
joint-owner meetings. Intervene in such meetings, cast votes in the appropriate manner,
whatever the issues in question, and accept agreements. Accept positions and appo-
intments and, in general, exercise on behalf of the Company any rights it is granted in
jointly-owned buildings. Attend and intervene in any meetings held in accordance with
the prevailing Law on Buildings under Joint Ownership and other applicable legislation.
12.- Attend on behalf of the Company all types of auctions and tenders organized by
the State, autonomous regional governments, provinces, municipalities, and public and
private individuals and entities and, to this end, present specifications, declarations,
projects and budgets; prepare bids and set up guarantee deposits, making definitive and
unlimited use of the powers required to obtain and accept, provisionally or definitively,
based on the conditions considered appropriate, the tender in question. Exercise the
rights and fulfill the obligations related with these tenders.
13.- Set up the offices, centers and branches of the Company and organize the services
therein. Hire personnel. Establish the conditions for selecting and appointing personnel.
Freely appoint and separate them, including directors and qualified personnel. Establish
their rights, obligations, powers and functions, salaries, bonuses and compensation.
Agree promotions and transfers. Exercise the powers to sanction and discipline. Act on
behalf of the Company in relations with workers’ committees and represent the Company
when negotiating agreements in any area or of any type.
14.- Represent the Company before any government authorities or bodies responsible for
labor and Social Security issues; prepare reports and claims; demand the suspension of or

What is it?
What did it do in 2007?
How did it do it?
Where is it?
How is it governed?
Who forms the teams?
How does it ensure sustainability?
Economic and Financial Report
Annual Corporate Governance Report
95
accept contested assessments; appear and intervene on behalf of the Company in procee-
dings in progress in which the Company has a direct or indirect interest by presenting and
defending all types of evidence, requesting and obtaining documents, copies, certifica-
tes and notifications; and presenting, preparing and defending all types of declarations,
requests and statements. In general, intervene in any proceedings required during the
life of the Company such as registering the Company with the labor and Social Security
authorities; conducting the procedures required to contract all types of workers, including
requesting and collecting grants and bonuses, registering workers, etc.; conducting the
procedures required to modify or cancel employment contracts, train staff, present and pay
Social Security contributions, and request Social Security payment deferrals and rebates.
Conduct the procedures required in relations between the Company and temporary employ-
ment and personnel selection agencies. In general, follow procedures for all formalities and
incidents, filing appeals, where necessary, until outright rulings are issued and enforced.
15.- Represent the Company before any government authorities or bodies responsible for
health and safety at work and occupational risk issues, preparing reports and claims and,
in general, any documents the Company considers necessary in relation to any procee-
dings in which it has a direct or indirect interest. Perform any actions necessary to
promote and guarantee worker safety in work centers by complying with legislation on
occupational health and safety and other complementary legislation. Plan and execute
the risk prevention policy. Act on behalf of the Company in relations with workers and
their representatives regarding health and safety measures. Prepare and implement
a professional risk plan. Organize the risk prevention service, allocating the human
resources and assets required to operate the service. Negotiate and sign agreements with
approved entities which render external risk prevention procedures. Negotiate, organize
and perform risk assessments, medical examinations, and other health checks and risk
prevention systems. Contract external health and safety audits and, in general, audits
of any actions related with such risks. Obtain insurance to cover common and professio-
nal contingencies to which workers are exposed by signing agreements and associative
agreements with Social Security management entities and occupational health and safety
insurance companies affiliated with the Social Security system, or other entities that
have taken over performing the functions and duties of these entities, renouncing or
canceling in the past any contracts signed, and accepting appointment to and partici-
pation in the governing and advisory boards of such entities that collaborate with the
management of the Social Security system.
16.- As permitted by legislation, take any action which is the responsibility of the prin-
cipal and renounce any claims lodged against it. Appear before the ordinary and special
courts and tribunals of any instance and jurisdiction in all types of legal cases, as well
as in relation to any type of voluntary, administrative and economic and administrative
legal proceedings. Consequently, participate in conciliation acts with or without agree-
ment; intervene in inquests; prepare necessary court declarations; respond to summons

96
and writs; sue, dispute or agree, and report or bring action; present and ratify briefs;
request and obtain documents; request any type of proceedings be conducted including
prosecutions, imprisonments, and releases from prison; hear writs, subpoenas, summons,
and notifications; exercise and challenge powers; promote joinders of writs and challen-
ges of judges and court clerks; present and defend evidence and provide court confes-
sions; make court appearances and visits and attend meetings with full voting rights in-
cluding meetings of creditors of all types of bankruptcy proceedings, being authorized to
participate in auctions and request the awarding of assets in part or full payment for the
outstanding receivables claimed; settle in or out of court, lodge and, basically, follow
lawsuits or legal proceedings during each stage of the process and in relation to possible
incidents and appeals until an outright ruling or sentence is reached and enforced; under
special circumstances, make any appeals, out-of-court settlements, waivers and state-
ments that could lead to a stay of proceedings either through an out-of-court settlement
or due to nullity; exercise any other power not listed above stipulated in Articles 25 and
414.2 of Law 1 of 7 January 2000 governing lawsuits; take charge of any funds or assets
involved in the legal proceedings and, in general, exercise on behalf of the Company any
rights the Company is entitled to under this law.
17.- Settle and agree through arbitration any issues under the director’s jurisdiction and using
any means and to the extent and following the requirements stipulated in Spanish arbitration
law and international trade arbitration legislation.
18.- Appoint a public notary to file affidavits and prepare and receive writs and summons.
19.- Replace, in whole or in part, the preceding authorities, grant corresponding powers and
revoke powers granted, and obtain copies of all types of legal records and deeds.
20.- File by public deed any agreements made by the shareholders, Board of Directors or
Executive Committee.
The General Secretary and Secretary to the Board of Directors, Mr. Antonio Abril Abadín, is
Inditex’s proxy and, subject to the same conditions and limitations applicable to the managing
directors stipulated in the second and third paragraph of this section, has the powers described
in points 1, 2, 4, 5, 6, 7, 9, 10, 11, 12, 14, 16, 17, 18, 19 and 20 of the above list.
Finally and in relation to the possibility of issuing or re-purchasing shares, in the general mee-
ting held on 17 July 2007, Inditex’s shareholders authorized the Board of Directors to acquire
treasury shares in the Company or shares in its subsidiaries, within the limits established by
prevailing legislation.

What is it?
What did it do in 2007?
How did it do it?
Where is it?
How is it governed?
Who forms the teams?
How does it ensure sustainability?
Economic and Financial Report
Annual Corporate Governance Report
97
h. Significant agreements
Inditex has not signed any significant agreements which enter into force, are modified or expi-
re as a result of a change in control in the Company deriving from a public takeover bid.
i. Agreements between the Company and its directors and management or employees
Except for the agreements with the two executive board members and eight directors described
below, the employment contracts of Inditex employees do not contain any specific clauses
establishing compensation on termination of employment and, therefore, employees are only
entitled to the compensation established under prevailing labor law.
In its meeting held on 9 June 2005 and having obtained a favorable report from the Appo-
intments and Remunerations Committee, Inditex’s Board of Directors agreed and approved ten
(10) contracts with guarantee or golden parachute clauses in favor of certain members of the
Board of Directors including two executive board members (the First Vice Chairman and Mana-
ging Director, and the General Secretary and Secretary to the Board of Directors).
The aforementioned agreements establish that if an employment contract is terminated due
to, among others, unfair dismissal or resignation as a result of certain causes (including a
change in control of the Company, on the condition that a significant number of the Company’s
governing boards are reappointed, or a change in the content and objectives of its principal
activity), the director will be entitled to compensation equivalent to two full years’ salary,
calculated based on the salary of the last year worked.

98
Annex I
Income statement: quarterly results
FY2007 FY2006
Q1 Q2 Q3 Q4 Q1 Q2 Q3 Q4
Net sales 2,039.4 2,084.5 2,508.8 2,802.0 1,714.9 1,760.8 2,190.0 2,530.6
Cost of sales (889.1) (937.0) (1,017.0) (1,242.8) (759.2) (806.7) (906.0) (1,117.4)
Gross profit 1,150.3 1,147.5 1,491.8 1,559.2 955.7 954.0 1,284.0 1,413.2
Gross margin 56.40% 55.05% 59.46% 55.64% 55.73% 54.18% 58.63% 55.84%
Operating expenses (752.4) (774.4) (798.3) (901.3) (639.6) (656.3) (694.5) (809.9)
Other net operating income (losses) (0.6) 11.3 (0.2) 16.1 (3.4) (5.7) (10.8) 2.8
Operating cash flow (EBITDA) 397.2 384.4 693.3 673.9 312.7 292.1 578.8 606.1
EBITDA margin 19.48% 18.44% 27.63% 24.05% 18.23% 16.59% 26.43% 23.95%
Amortisation and depreciation (116.6) (122.8) (121.1) (136.3) (99.1) (101.5) (108.7) (124.1)
Operating income (EBIT) 280.7 261.7 572.2 537.6 213.5 190.6 470.1 482.0
EBIT margin 13.76% 12.55% 22.81% 19.19% 12.45% 10.82% 21.47% 19.05%
Financial results (3.9) 2.0 4.0 (1.1) (4.6) 4.8 (2.2) (12.0)
Results from companies consolidated by equity method
(0.5) (1.3) (0.9) (4.8) (0.2) 0.1 (1.3) (1.4)
Income before taxes 276.3 262.4 575.3 531.7 208.7 195.4 466.6 468.7
Taxes (75.7) (68.1) (140.4) (103.7) (57.4) (50.8) (124.3) (97.0)
Net income 200.6 194.3 434.9 428.0 151.3 144.6 342.3 371.7
Minorities 1.0 1.2 2.7 2.6 0.8 0.6 3.2 3.7
Net income attributable to the controlling company 199.6 193.1 432.2 425.4 150.5 144.0 339.1 367.9
Net income margin 9.79% 9.26% 17.23% 15.18% 8.78% 8.18% 15.48% 14.54%

What is it?
What did it do in 2007?
How did it do it?
Where is it?
How is it governed?
Who forms the teams?
How does it ensure sustainability?
Economic and Financial Report
Annual Corporate Governance Report
99
Annex II
Summary of net openings and net stores opened by quarter
Number of net store openings in each quarter
Concept 1Q 2007
2Q 2007
3Q 2007
4Q 2007
total 2007
1Q 2006
2Q 2006
3Q 2006
4Q 2006
total 2006
Zara 45 25 70 46 186 53 28 52 41 174
Pull & Bear 8 17 19 8 52 13 8 5 14 40
Massimo Dutti 3 2 15 7 27 7 7 10 6 30
Bershka 12 11 31 23 77 16 16 17 16 65
Stradivarius 20 7 26 24 77 5 10 14 12 41
Oysho 14 21 29 25 89 8 16 12 11 47
Zara Home 12 8 16 16 52 12 9 8 13 42
Total stores 114 91 206 149 560 114 94 118 113 439
Number of stores by the end of each quarter
Concept 1Q 2007
2Q 2007
3Q 2007
4Q 2007
1Q 2006
2Q 2006
3Q 2006
4Q 2006
Zara 1,220 1,245 1,315 1,361 1,054 1,082 1,134 1,175
Pull & Bear 475 492 511 519 440 448 453 467
Massimo Dutti 402 404 419 426 376 383 393 399
Bershka 445 456 487 510 384 400 417 433
Stradivarius 324 331 357 381 268 278 292 304
Oysho 215 236 265 290 162 178 190 201
Zara Home 164 172 188 204 122 131 139 152
Total stores 3,245 3,336 3,542 3,691 2,806 2,900 3,018 3,131

100
Annex III
Stores by concept and country as at 31 January 2007
Zara Pull and BearMassimo
Dutti Bershka Stradivarius Oysho Zara Home Inditex
Andorra 1 1 1 1 1 1 6
Argentina 7 7
Austria 10 10
Bahrein 1 1 1 1 4
Belgium 23 1 19 7 4 54
Brazil 22 22
Canada 14 14
Chile 6 6
China 12 2 14
Colombia 4 4
Costa Rica 2 2
Croacia 1 1 2
Cyprus 4 3 2 5 5 1 2 22
Czech Republic 5 2 2 9
Denmark 4 4
Dominican Republic 1 1
El Salvador 2 1 1 4
Estonia 2 1 3
Finland 4 4
France 109 6 13 36 9 1 10 184
Germany 62 6 68
Greece 48 16 10 19 4 10 5 112
Guatemala 1 1 1 3
Hungary 4 2 1 1 1 9
Iceland 2 2
Indonesia 6 3 9
Ireland 8 7 1 5 2 23
Israel 15 17 32
Italy 74 26 6 29 19 46 18 218
Japan 29 29
Jordan 2 2 2 1 2 1 1 11
Kuwait 5 4 2 2 3 3 2 21
Latvia 3 2 2 7
Lebanon 2 3 3 2 2 2 1 15
Lithuania 4 2 4 10

What is it?
What did it do in 2007?
How did it do it?
Where is it?
How is it governed?
Who forms the teams?
How does it ensure sustainability?
Economic and Financial Report
Annual Corporate Governance Report
101
Zara Pull and BearMassimo
Dutti Bershka Stradivarius Oysho Zara Home Inditex
Luxembourg 2 1 3
Malaysia 5 2 4 11
Malta 1 5 1 7
Mexico 47 27 24 39 27 12 176
Monaco 1 1
Morocco 3 2 3 8
Netherlands 12 5 1 18
Norway 2 2 4
Oman 1 1 1 1 4
Panama 2 2
Philippines 5 5
Poland 18 7 8 6 6 45
Portugal 73 57 40 39 32 27 18 286
Puerto Rico 1 1
Qatar 2 2 2 1 1 1 1 10
Romania 2 2 1 1 1 7
Russia 18 9 4 6 9 3 1 50
Saudi Arabia 18 3 7 16 18 3 4 69
Serbia 3 1 1 1 1 1 8
Singapore 5 2 3 10
Slovakia 1 1 1 1 4
Slovenia 4 2 2 3 11
Spain 491 286 235 243 243 143 106 1.747
Sweden 9 3 12
Switzerland 9 4 1 14
Thailand 3 2 5
Tunisia 1 1
Turkey 22 9 9 9 9 8 7 73
UAE 5 4 6 4 5 2 4 30
United Kingdom 56 6 5 5 72
Uruguay 2 2
USA 29 29
Venezuela 9 3 9 21
Total 1.361 519 426 510 381 290 204 3.691

The Annual Report 2007 provided information under the terms of the triple –economic, social and environmental- dimension.
The Annual Report 2007 is fully available on the corporate web site www.inditex.com, where additional useful information may also
be accessed.
Contact Details
Shareholders Office
Tel.: +34 901 330 212
Fax: +34 981 185 365
Investors Relations Department
Tel.: +34 981 185 364
Fax: +34 981 185 365
Communication and Institutional Relations Corporate Division
Tel.: +34 981 185 400
Fax: +34 981 185 544
Inditex S.A.
Edificio Inditex
Avda. de la Diputación, s/n
15452 Arteixo
A Coruña, Spain
+34 981 185 400
www.inditex.com