Economic Analysis of Reactive Distillation in the ... · Aspen HYSYS was used to make two...
16
University of South Carolina Scholar Commons Senior eses Honors College Spring 2018 Economic Analysis of Reactive Distillation in the Production of tert-Amyl Methyl Ether (TAME) Clayton Brandenburg [email protected] Follow this and additional works at: hps://scholarcommons.sc.edu/senior_theses Part of the Other Chemical Engineering Commons is esis is brought to you by the Honors College at Scholar Commons. It has been accepted for inclusion in Senior eses by an authorized administrator of Scholar Commons. For more information, please contact [email protected]. Recommended Citation Brandenburg, Clayton, "Economic Analysis of Reactive Distillation in the Production of tert-Amyl Methyl Ether (TAME)" (2018). Senior eses. 234. hps://scholarcommons.sc.edu/senior_theses/234
Transcript of Economic Analysis of Reactive Distillation in the ... · Aspen HYSYS was used to make two...

University of South CarolinaScholar Commons
Senior Theses Honors College
Spring 2018
Economic Analysis of Reactive Distillation in theProduction of tert-Amyl Methyl Ether (TAME)Clayton [email protected]
Follow this and additional works at: https://scholarcommons.sc.edu/senior_theses
Part of the Other Chemical Engineering Commons
This Thesis is brought to you by the Honors College at Scholar Commons. It has been accepted for inclusion in Senior Theses by an authorizedadministrator of Scholar Commons. For more information, please contact [email protected].
Recommended CitationBrandenburg, Clayton, "Economic Analysis of Reactive Distillation in the Production of tert-Amyl Methyl Ether (TAME)" (2018).Senior Theses. 234.https://scholarcommons.sc.edu/senior_theses/234


Abstract
Aspen HYSYS was used to make two flowsheets, one with plug flow reactors and
distillation columns and another with a reactive distillation column, to see which flowsheet was
better at producing tert-amyl methyl ether (TAME) and which one was more economically
feasible. The goal was to produce 15,000 metric tons of TAME per year by reacting a naptha
stream with methanol. It was found that both flowsheets were capable of producing the desired
amounts of TAME and with product purities around 100%. The conversions of the reactive
distillation was 93.93%, significantly higher than the 72.48% and 76.98% in the base case. The
cost of building the differences of the two flowsheets is shown by the bare module cost, in the
base case was $719,000 and the cost of different equipment for the reactive distillation case was
$364,000. The yearly cost to run the base case was $1,247,165 and $714,055 for the reactive
distillation case. The reactive distillation has a cheaper initial cost which is shown by the bare
module cost and has a cheaper cost to run per year. The reactive distillation flowsheet is the
better flowsheet and would be the recommended flowsheet to use if this process was to be made
since it has a cheaper cost to build and to operate.
Introduction
Tert-amyl methyl ether (TAME) is a chemical that is used as an additive in gasoline [5].
TAME is used to increase the octane of gasoline as well as reduce the amount of pollutants
released when burning gasoline, such as carbon monoxide and some volatile organic compounds
[5]. TAME is not the first chemical to be used as an additive to gasoline to increase the octane.
Other oxygenates including methyl tert-butyl ether (MTBE), ethyl tert-butyl ether (ETBE), and
tert-amyl ether ether (TAEE) have been used, but these chemicals have issues. MTBE, a
common of oxygenate, has had its usage stopped because of research suggesting that it was
polluting the water supply [5]. This has caused a ban on MTBE and has led to the increase of the
use of the other ethers.
Traditionally reactions and separations in chemical plants have been done separately.
There will be a reactor or reactors that could vary from being a plug flow reactor (PFR), a
continuous stirred-tank reactors (CSTR), or a batch reactors that will have many chemicals
coming out of it that need to be separated. That stream of chemicals is then sent to a separator
that could be a distillation column, an extractor, a centrifuge, or some other kind of separator to
separate desirable chemicals from undesirable chemicals. There is a way to combine these two
steps into one by using reactive distillation. Reactive distillation uses a distillation column to
separate chemicals while also having a chemical reaction between those chemicals take place in
the column. Research in reactive distillation began around the 1970s and the classic example of a
successful reactive distillation column is the column run by Eastman Chemical Co. that produces
methyl acetate [3]. This column was able to reduce the cost to run this process by around five
times [3]. Reactive distillation can have advantages such as less equipment being needed, which
lowers the capital cost of the operation, improved conversion of the reactor, improved product
selectivity, and being able to overcome equilibrium limitations [2]. Not every product does
benefit from using reactive distillation and in this study the use of reactive distillation in the
production of TAME was evaluated [2]. Reactive distillation does not work for every system
though. There are disadvantages if there are chemical with close relative volatilities, reactions
that have long residence times, process conditions of reaction and distillation, for example
temperature, are different, and scaling up to large flow rates [2].
TAME is commonly synthesized from reacting methanol with a naphtha mixture, which
is a mixture of liquid hydrocarbons that commonly come from natural gas condensates or
petroleum distillates. The chemical reaction to form TAME is the following:
2𝑀1𝐵 + 𝑀𝑒𝑂𝐻 ↔ 𝑇𝐴𝑀𝐸
2𝑀2𝐵 + 𝑀𝑒𝑂𝐻 ↔ 𝑇𝐴𝑀𝐸
Where 2M1B is 2-methyl-1-butene, 2M2B is 2-methyl-1-butene, and MeOH is methanol.
2M1B and 2M2B come from the naphtha mixture, but they are not the only chemicals in the
mixture. The other chemicals in the mixture are isopentane, n-pentane, 1-pentene, and 2-pentene.
These chemicals are not the major constituents of the mixture, but will still be in the process
when the methanol and the 2M1B and 2M2B react. Since there will be other chemicals in the
system, those chemicals must be separated from the product, TAME, at the end of the reaction.
Methodology
The basis for this analysis was to produce 15,000 metric tons of TAME per year using a
theoretical naptha stream that was generated from a hypothetical plant and methanol that would
be bought to react to make TAME. The naptha stream is made up of mostly C5s including
isopentane (iC5), 1-pentene (1C5-), 2-pentene (2C5-), n-pentane (nC5), 2-methyl-1-butene
(2M1B), and 2-methyl-2-butene (2M2B). Using Aspen HYSYS a process flow diagram was
made for both the traditional reactor and separators, the base case, and the reactive distillation.
The thermodynamic package that was used was the UNIQUAC in the liquid phase and the Peng-
Robinson EOS in the vapor phase. These were chosen to help deal with the azeotropes in the
system. The same feed composition and flow rate was used for both of the separation methods
and the amount of equipment needed and the compositions of the product streams after the

reactors and separator were recorded. The economic analysis was done in CAPCOST using the
information from each flowsheet on HYSYS. The amount of equipment being used, the amount
of utilities being used, and the differences in the amount of catalyst that was needed was taken
into account to find out which method was more cost effective.
Results and Discussion
Figure 1: The process flow diagram of the base case generated in Aspen HYSYS.
Table 1: The stream information for the base case.
Stream 1.2 3.2 20.3 4 5 6 7 6.2 8 9 10 23
Temperature (⁰C) 60 60 60 60 83.91 84.28 153 60.1 67.87 82.55 153.2 40
Pressure (kPa) 548.9 548.7 545 545 521.6 500 520 620 608.4 475 525 520
Vapor Fraction 0 0 0 0 0 0 0 0 0 0 0 0
Mole Flow (kmol/h) 80 20.51 50 150.5 136.5 123.5 13 123.5 119.5 114.4 5.05 18.05
Mass Flow (kg/h) 5702 657.2 1602 7962 7962 6633 1328 6633 6633 6118 515.6 1844
Component Flowrates (kmol/h)
H2O 0 0 0 0 0 0 0 0 0 0 0 0
iC5 38.56 0 0 38.56 38.56 38.56 0 38.56 38.56 38.56 0 0
1C5- 2.93 0 0 2.93 2.93 2.93 0 2.93 2.93 2.93 0 0
2C5- 12.44 0 0 12.44 12.44 12.44 0 12.44 12.44 12.44 0 0
2M1B 6.58 0 0 6.58 0.56 0.56 0 0.56 0.11 0.11 0 0
nC5 6.81 0 0 6.81 6.81 6.81 0 6.81 6.81 6.81 0 0
2M2B 12.68 0 0 12.68 4.74 4.74 0 4.74 1.11 1.11 0 0
Methanol 0 20.51 50 70.51 56.55 56.55 0 56.55 52.47 52.47 0 0
TAME 0 0 0 0 13.96 0.96 13 0.96 5.04 0 5.04 18.04

The process flow diagram of the base case, shown in figure 1, is not the complete
flowsheet of the production of TAME, it is just the reaction and separation section. Later in the
flowsheet there is a methanol separation section that ends up recycling methanol and that is
where stream 20.3 comes from. Stream 3.2 is the feed methanol and stream 1.2 is the feed
naptha. These three streams are combined into stream 4 and then fed into the first reactor, PFR-
100. As seen in table 1, this reactor produced 13.96 kmol/h of TAME, but that is not enough to
produce the desired amount of TAME per year, so another reactor was need. First the product of
the first reactor was put into a distillation column, T-100, and there was a good separation of
TAME from the other components leaving almost pure TAME coming out of the bottoms. The
tops are then sent to a heat exchanger for feed preparation to be sent into the final reactor, PFR-
101. In the last reactor almost all of the 2M1B is reacted and most of the 2M2B is reacted and
5.04 kmol/h of TAME are produced. That is then sent into a distillation column, T-101, and the
tops are sent to be processes later and the bottoms are combined with the bottoms of the first
column to have the product stream of TAME that has 18.04 kmol/h of TAME.
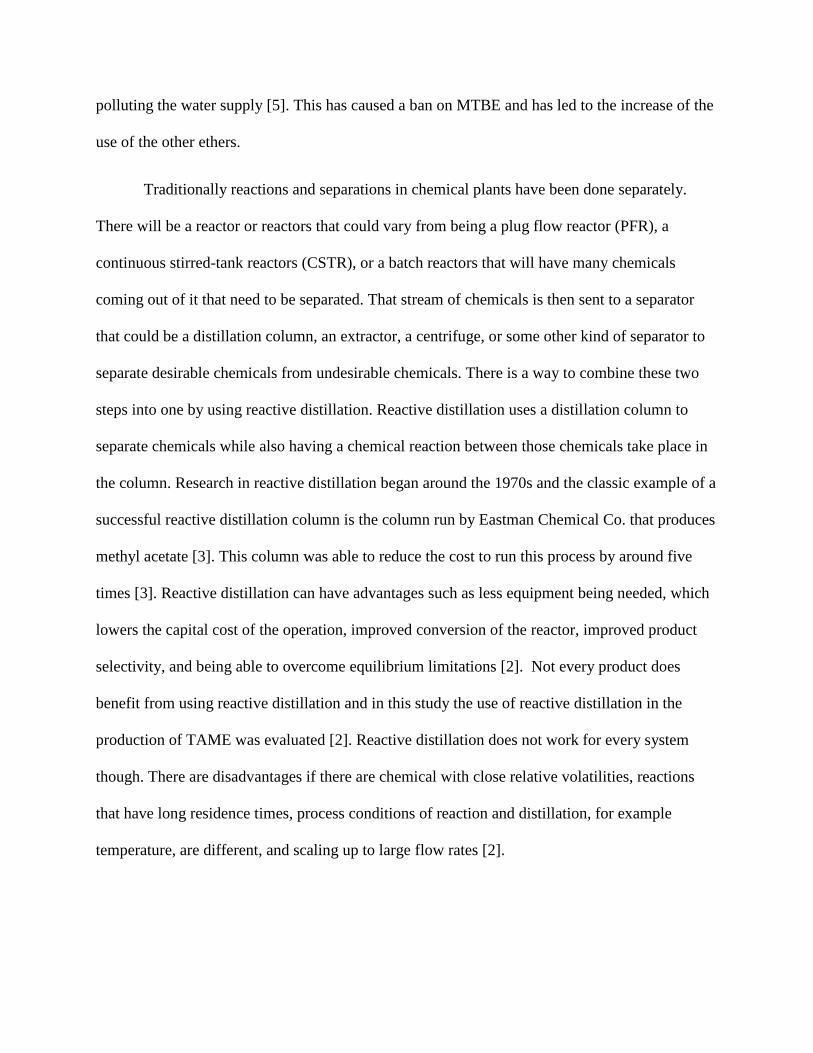
Figure 2: The process flow diagram of the reactive distillation case generated in Aspen HYSYS.

Table 2: The stream information for the reactive distillation case.
The process flow diagram of the reactive distillation case, shown in figure 2, is not the
complete flowsheet of the production of TAME, it is just the reaction and separation section. The
three feeds are the same as in the base case, in order to more easily compare the two flowsheets.
The two methanol streams, 3.2RD and 20.3RD, are combined into stream 4RD and fed into the
reactive distillation tower, T-100RD, and the naptha stream 1.2RD is also fed into the tower
separately. The reactive distillation tower is made up of 44 trays, and has 33 trays in the reactive
section with the methanol feed coming in at tray 6 and the naptha feed coming in at tray 39. As
seen in table 2, this reactive distillation tower produced 18.08 kmol/h of TAME out of the
bottoms and the tops had not TAME and could be process later. The bottoms did not have pure
TAME though so another regular distillation column, T-101RD, was need to separate the TAME
from the other constituents. From the bottoms of this tower is the product stream of TAME that
has pure TAME and a flow rate of 18.00 kmol/h. The tops of the tower would be processed later
in the process.
Stream 1.2RD 3.2RD 20.3RD 4RD 6RD 7RD 7.1RD 9RD 17RD
Temperature (⁰C) 60 60 60 60 70.05 117.7 116.6 101.6 143.8
Pressure (kPa) 548.9 548.7 545 545 400 433 420 400 430
Vapor Fraction 0 0 0 0 0 0 0 0 0
Mole Flow (kmol/h) 80 20.51 50 150.5 93.43 39 39 21 18
Mass Flow (kg/h) 5702 657.2 1602 7962 5159 2802 2802 963.1 1839
Component Flowrates (kmol/h)
H2O 0 0 0 0 0 0 0 0 0
iC5 38.56 0 0 38.56 38.56 0.01 0.01 0.01 0
1C5- 2.93 0 0 2.93 2.93 0 0 0 0
2C5- 12.44 0 0 12.44 5 7.43 7.43 7.43 0
2M1B 6.58 0 0 6.58 0.16 0 0 0 0
nC5 6.81 0 0 6.81 6.81 0 0 0 0
2M2B 12.68 0 0 12.68 1.01 0.01 0.01 0.01 0
Methanol 0 20.51 50 70.51 38.98 13.45 13.45 13.45 0
TAME 0 0 0 0 0 18.08 18.08 0.08 18

Reactor Conversion
PFR-100 72.48%
PFR-101 76.98%
T-100RD 93.93%
Table 3: Conversion of all of the reactors on the basis of 2M1B and 2M2B.
Base Case Reactive Distillation
Product Purity 99.94% 100.00%
Table 4: The product purity of the two flowsheets.
The conversions are shown in table 3 and are calculated from the following equation:
𝐶𝑜𝑛𝑣𝑒𝑟𝑠𝑖𝑜𝑛 =(2𝑀1𝐵 𝐼𝑁 + 2𝑀2𝐵 𝐼𝑁) − (2𝑀1𝐵 𝑂𝑈𝑇 + 2𝑀2𝐵 𝑂𝑈𝑇)
(2𝑀1𝐵 𝐼𝑁 + 2𝑀2𝐵 𝐼𝑁)∗ 100
The two reactors in the base case had conversions of 72.48% and 76.98%, which are conversions
that are relatively high, but in the reactive distillation column there was a conversion of 93.93%.
This improvement of almost 20% is a significant improvement on conversion and helps save
money when running a process. The reason for the increase in conversion is most likely due to
how the reactive distillation column works. As the TAME is made it is separated driving the
equilibrium of the reactions towards the product side causing more TAME to be made. The
product purity in table 4 shows that both flowsheets were able to produce very pure TAME and

that neither flowsheet had an advantage in this aspect.
Figure 3: The capital cost of the base case generated in CAPCOST.
Figure 4: The capital cost of the reactive distillation case generated in CAPCOST.
The capital cost for the base case is shown in figure 3 and for the reactive distillation case
in figure 4. These figures were generated in CAPCOST with a CEPCI value of 567.5, the value
for the year 2017, to adjust for inflation. In the base case there are six pieces of equipment that
were taken into account, a heat exchanger, a pump, two distillation columns, and two reactors.
From the specifications of those equipment that was found from HYSYS the cost associated to
build all of those pieces of equipment is $719,100. The reactive distillation case only had two
pieces of equipment, the reactive distillation tower and the regular distillation tower. From the
specifications of those equipment that was found from HYSYS the cost associated to build all of

those pieces of equipment is $364,000. When just looking at the cost to build the plant it costs
more money to build the base case than the reactive distillation case.
Figure 5: The cost of utilities for the base case generated from CAPCOST.
Figure 6: The cost of utilities for the reactive distillation case generated from CAPCOST.
Utility Cost ($/GJ)
Electricity 16.8
Cooling Water 0.354
Table 5: Table of the prices per energy for the utilities needed.
The cost of utilities for the base case is shown in figure 5 and for the reactive distillation
case in figure 6. In the base case there are six pieces of equipment that were taken into account
and only two of them had utilities costs associated with them, the heat exchanger and the pump.
Using the costs from table 5, the annual utilities cost for the base case was found to be $510,000.
The reactive distillation case only had two pieces of equipment, the reactive distillation tower

and the regular distillation tower and neither of those had utilities costs associated with them
meaning the cost of utilities for the different pieces of equipment in the reactive distillation
flowsheet had no cost with them.
Base Case
Volume of PFR-100 (m3) 2.5
Bulk Density of PFR-100 (kg/m3) 1575
Weight of Catalyst in PFR-100 (kg) 3937.5
Volume of PFR-101 (m3) 7
Bulk Density of PFR-101 (kg/m3) 1575
Weight of Catalyst in PFR-101 (kg) 11025
Total Weight of Catalyst 14962.5
Cost of Catalyst per year $49465
Table 6: The cost of the catalyst in the base case.
Reactive Distillation
Volume of T-100RD (m3) 15.23
Bulk Density of T-100RD (kg/m3) 1575
Weight of Catalyst in T-100RD (kg) 23973.2
Cost of Catalyst per year $79255
Table 7: The cost of the catalyst in the reactive distillation case.
Since the feeds for the two flowsheets is the same the cost of the raw materials for the
two flowsheets is the same expect for the cost of the catalyst. The catalyst is amberlyst 15 and
needs to be replaced three times a year with a cost of $1.16/kg. The amount of catalyst needed

was dependent on the volume of the reactors in the base case and the volume of the reactive
section in the reactive distillation case. The volume and densities of the reactors in the base case
can be seen in table 6. The cost per year of the catalyst in the base case is $49,465 per year. The
volume and the density of the reactive section of the reactive distillation column are shown in
table 7. The cost per year of the catalyst in the reactive distillation case is $79,255. More catalyst
is needed in the reactive distillation case although the cost is not difference between the two is
not that significant.
Base Case Reactive Distillation
Towers for Nnp 2 2
Reactors for Nnp 2 0
Heat Exchangers for Nnp 1 0
Total for Nnp 5 2
Cost of Labor per year $687700 $634800
Table 8: Cost of labor for both flowsheets.
The cost of labor was determined by this equation:
𝐶𝑜𝑠𝑡 𝑜𝑓 𝐿𝑎𝑏𝑜𝑟 =$52900
𝑦𝑒𝑎𝑟∗ 4.5 ∗ (6.29 + 31.7 ∗ 𝑃2 + 0.23 ∗ 𝑁𝑛𝑝)
In the equation P is the processing steps that include handling of particulate solids, which for
both of the cases is zero. The salary of each operator needed is $52,900 per year and the Nnp is
determined based off of the number of certain types of equipment. The equipment included in the
calculation for Nnp is shown in table 8. After the calculation was performed it was determined
that one more operator was needed for the base case and the cost of labor for the base case was
$687,700 per year and was $634,800 for the reactive distillation case.

Base Case Reactive Distillation
Bare Module Cost $ 719,100.00 $ 364,000.00
Cost of Utilities per year $ 510,000.00 $ -
Catalyst Cost per year $ 49,465.00 $ 79,255.00
Cost of Labor per year $ 687,700.00 $ 634,800.00
Total Cost per year $ 1,247,165.00 $ 714,055.00
Table 9: Summary of all of the costs associated with each flowsheet.
In table 9 there is a summary of all the costs associated with each of the flowsheets. The
initial cost is shown in the first row, the base case is more expensive than the reactive distillation
case in the initial cost to build the equipment. Then looking at the cost per year the base case
costs $1,247,165 per year and the reactive distillation case costs $714,055 per year. The base
case also cost more to operate per year than the reactive distillation case.
Conclusion
When comparing the base case to the reactive distillation case the first part to compare the
differences between the two flowsheets. With the same feeds both flowsheets were able to
produce around the same amount of TAME with the base case producing 18.04 kmol/h and the
reactive distillation column producing 18.00 kmol/h. The base case had a product purity of
99.94% and the reactive distillation column had a product purity of 100.00%, so both flowsheets
had around the same product purity. The difference was the base case reactors had conversions
of 72.48% and 76.98% while the reactive distillation column had a conversion of 93.93%. The
reactive distillation column caused there to be a higher conversion most likely due to it being
able to help push the equilibrium towards the product side by removing the product soon after it
forms. When comparing the economic aspect of the two flowsheets there were significant
differences. The different equipment for the base case included two distillation columns, two
reactors, one heat exchanger, and one pump that had a bare module cost of $719,000 and the
different equipment for the reactive distillation included only two distillation columns and had a
bare module cost of $364,000. The yearly cost for the base case was $510,000 for utilities,
$49,465 for the catalyst, and $687,700 for labor which has a total of $1,247,165. The yearly cost
for the reactive distillation was $0 for utilities, $79,255 for the catalyst, and $634,800 for labor
which has a total of $714,055. The reactive distillation has a cheaper initial cost which is shown
by the bare module cost and has a cheaper cost to run per year. The reactive distillation flowsheet
is the better flowsheet and would be the recommended flowsheet to use if this process was to be
made since it has a cheaper cost to build and to operate.

Works Cited
Al-Arfaj, Muhammad A, and William L Luyben. “Plantwide Control for TAME Production
Using Reactive Distillation.” AIChE Journal, vol. 50, no. 7, July 2004, pp. 1462–1473.,
doi:10.1002/aic.10138.
Al-Harthi, F., Al-Mutaz, I., & Abasaeed, A. (2009). PRODUCTION OF MTBE USING
REACTIVE DISTILLATION TECHNOLOGY. Proceedings of the Third International
Conference on Modeling, Simulation and Applied Optimization. Retrieved May 2, 2018.
Malone, M., & Doherty, M. (2000). Reactive Distillation. Industrial and Engineering
Chemistry, 39, 3953-3957. Retrieved May 2, 2018.
Mao, Wei, et al. “Thermodynamic and Kinetic Study of Tert-Amyl Methyl Ether (TAME)
Synthesis.” Science Direct, 2 Feb. 2017, pp. 761–769.
Syed, F., Egleston, C., & Datta, R. (2000). Tert-Amyl Methyl Ether (TAME).
Thermodynamic Analysis of Reaction Equilibria in the Liquid Phase. Chemical Engineering
Data, 45, 319-323. Retrieved May 2, 2018.