Economic Analysis of Farmland Market: An Introduction
39
Economic Analysis of Farmland Market: An Introduction Dr. Wendong Zhang Assistant Professor of Economics [email protected] FIN 450X, October 4 th , 2017
Transcript of Economic Analysis of Farmland Market: An Introduction

Economic Analysis of Farmland Market:
An IntroductionDr. Wendong Zhang
Assistant Professor of [email protected]
FIN 450X, October 4th, 2017

A Quick Introduction:Dr. Wendong Zhang
– Grown up in a rural county in NE China– Attended college in Shanghai and Hong
Kong– Ph.D. in Ag Econ in 2015 from Ohio State– 2012 summer intern at USDA-ERS on farm
economy and farmland values– Research and extension interests: land
value, land ownership, agriculture and the environment, China Ag

China’s Provinces
MyHometown

Why Care About Farmland Market?

ISU Land Value Survey – Iowa average farmland value
all farmland 1941−2016
0
1000
2000
3000
4000
5000
6000
7000
8000
9000
10000
1941
1944
1947
1950
1953
1956
1959
1962
1965
1968
1971
1974
1977
1980
1983
1986
1989
1992
1995
1998
2001
2004
2007
2010
2013
2016
Land
Val
ue ($
per
acr
e)
Iowa Nominal and Inflation-adjusted Farmland Values 1941-2016
Nominal value Inflation-adjusted value (2015 dollars)
$7,183As of Nov 16
-5.9% sinceone year ago

-40.0%
-30.0%
-20.0%
-10.0%
0.0%
10.0%
20.0%
30.0%
40.0%
1942
1944
1946
1948
1950
1952
1954
1956
1958
1960
1962
1964
1966
1968
1970
1972
1974
1976
1978
1980
1982
1984
1986
1988
1990
1992
1994
1996
1998
2000
2002
2004
2006
2008
2010
2012
2014
2016
Annu
al P
erce
ntag
e Ch
ange
(%)
% Change in Nominal Iowa Farmland Values 1942-2016

David Ricardo – Founding Father of Land EconomicsLegacy: Ricardian Model of Farmland Values
David Ricardo was an English political economist. He was one of the most influential of the classical economists, along with Thomas Malthus, Adam Smith, and James Mill.
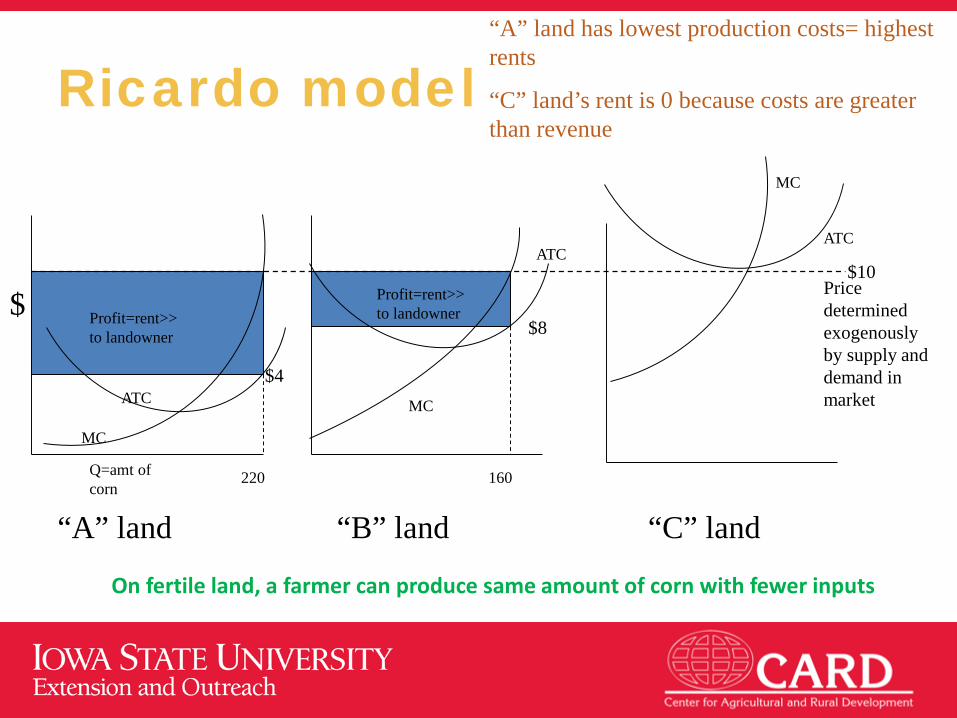
Ricardo model
ATC
MC
Profit=rent>>to landowner
ATC
MC
Profit=rent>>to landowner
160220
ATC
MC
$10
Q=amt of corn
$
“A” land “B” land “C” land
“A” land has lowest production costs= highest rents
“C” land’s rent is 0 because costs are greater than revenue
Price determined exogenously by supply and demand in market
$8
$4
On fertile land, a farmer can produce same amount of corn with fewer inputs

Market Value of Land –Capitalization FormulaLand Value = net income/ interest rate
• For simplicity, you could think of land value as the present value of all future annual land rental payments a landowner could charge
• PV = R/i
∑= +
=n
tti
RPV0 )1(

Guiding Framework
Land Value = localized net income /
universal interest rate

US Farm Income 1990-2026
Source: USDA OCE 2016

Federal Reserve Bank of Chicago, July 2017 Ag LetterRealtor Land Institute
Iowa

The “temporary break” in continued declines results from limited land supply
Source: Ag Decision Maker

The “temporary break” in continued declines results from limited land supply
Source: Ag Decision Maker

Annual Agricultural turnover ratio2001 - 2010
Blue: <0.5%Red: 1.5-2%
Illinois<0-3%>
Farmland Market is Very Thin! Few Observations

Capitalization Formula and Sources of Income
• Agricultural productivity variables Ait such as soil quality• Natural amenities variables Nit such as proximity to surface water • Urban influence variables Uit such as surrounding urban population,
access to highway• Agricultural market influence variables Mit such as proximity to ethanol
plants, grain elevators and agricultural output terminals
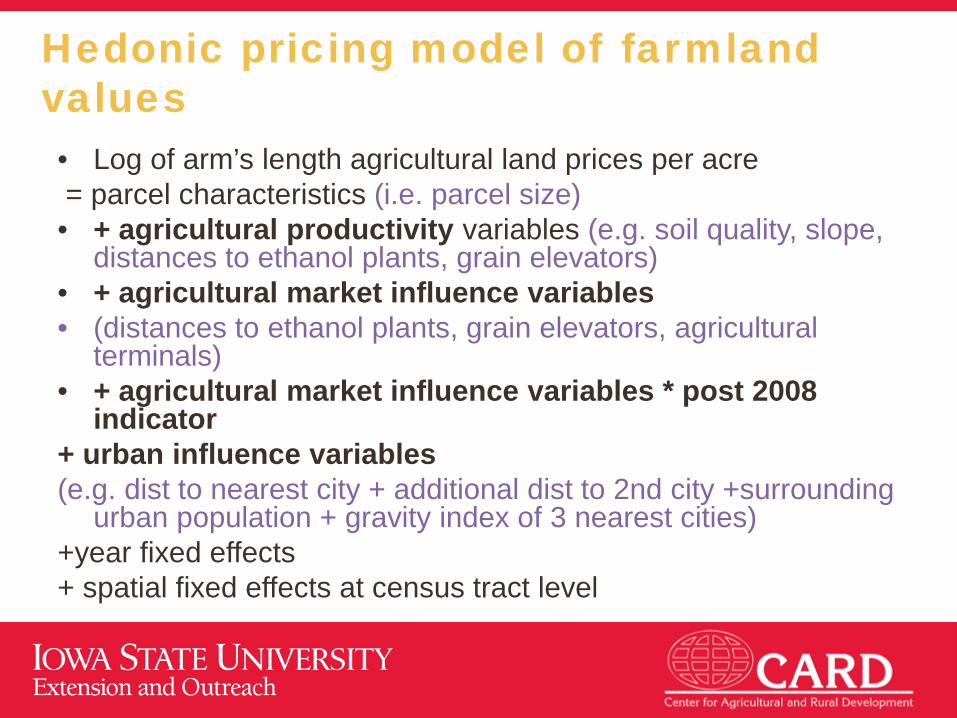
Hedonic pricing model of farmland values• Log of arm’s length agricultural land prices per acre= parcel characteristics (i.e. parcel size)
• + agricultural productivity variables (e.g. soil quality, slope, distances to ethanol plants, grain elevators)
• + agricultural market influence variables• (distances to ethanol plants, grain elevators, agricultural
terminals)• + agricultural market influence variables * post 2008
indicator+ urban influence variables(e.g. dist to nearest city + additional dist to 2nd city +surrounding
urban population + gravity index of 3 nearest cities)+year fixed effects+ spatial fixed effects at census tract level

Marginal values of farmland characteristics: Agricultural productivity variables
Agricultural Profitability Influence Variables - Marginal Value
Agricultural productivity index (NCCPI) + $77.84/ 10% increase
Prime soil % of parcel + $9.3 / 10% increase
Steep slope − $203.11/ from non-steep to steep
Distance to nearest grain elevator − $15.87 / 1 mile further
Distance to other agricultural terminal − $21.04 / 1 mile further

CSR2 – Corn Suitability Rating
Source: ISU Agronomy

Land Values by County, 2016

Urban Influence and Farmland Values – Housing Market Bust
Source: Standard & Poor

2001-2006
2009-2010
Ohio Cropland Sale Prices 2001-2010

The evolution of urban premium over time

District AverageValue
% Change
HighQuality
% Change
Medium Quality
% Change
Low Quality % Change
Northwest $9,243 -4.6% $10,650 -5.2% $8,468 -4.1% $6,019 -3.7%
North Central $7,562 -5.0% $8,442 -5.9% $6,992 -4.9% $5,164 -3.9%
Northeast $7,313 -7.0% $8,892 -7.1% $6,994 -6.2% $4,847 -7.5%
West Central $7,358 -8.7% $8,874 -8.4% $6,870 -9.4% $4,577 -9.9%
Central $7,841 -7.8% $9,299 -7.8% $7,186 -7.4% $5,158 -2.5%
East Central $7,917 -6.9% $9,502 -7.6% $7,396 -6.8% $5,153 -4.0%
Southwest $6,060 -4.9% $7,527 -6.3% $5,683 -5.9% $4,189 2.9%
South Central $4,241 -3.6% $5,980 -7.2% $4,128 -3.6% $2,892 5.2%
Southeast $6,716 -2.6% $9,265 -2.8% $6,283 -3.7% $3,783 -0.4%
Iowa Avg. $7,183 -5.9% $8,758 -6.5% $6,705 -5.9% $4,665 -3.5%
Land Values by District and Land Quality, Nov 2016

Livestock and Crop Inventory by District
Inventory 2012 Harvested Acres 2015Chickens,
Layers Hogs Milk Cows Cattle Corn Soybean
Northwest 30% 26% 29% 22% 15% 16%
North Central 64% 16% 4% 6% 14% 13%Northeast 1% 12% 51% 16% 12% 8%
West Central 0% 13% 1% 13% 15% 16%Central 3% 13% 1% 7% 15% 14%
East Central 1% 5% 10% 11% 10% 10%
Southwest 0% 2% 0% 9% 7% 9%
South Central 0% 2% 1% 9% 4% 5%Southeast 1% 11% 3% 6% 7% 8%
State Inventory 20.4 million 60.5 million 0.17 million 2.34 million 13.2 million 9.8 million
Source: USDA Ag Census 2012

Capitalization Rate (Cap Rate)Rent to Value Ratio

Farmland Price/Rent Ratio vs. S&P 500 P/E Ratio
Source: Purdue UniversityBaker et al. 2015

Farmland Values vs. Capitalized Land Values

S&P 500 vs. Farmland Values: A Question of Timing
Source: Mike DuffyAg DM Newsletter June 2014
1960

S&P 500 vs. Farmland Values: A Question of Timing
Source: Zhang and DuffyAg DM Newsletter April 2016
1980

S&P 500 vs. Farmland Values: A Question of Timing 1950-2015
Return to S & P Investment Relative
to Iowa Farmland Investment
Source: Zhang and DuffyAg DM Newsletter April 2016
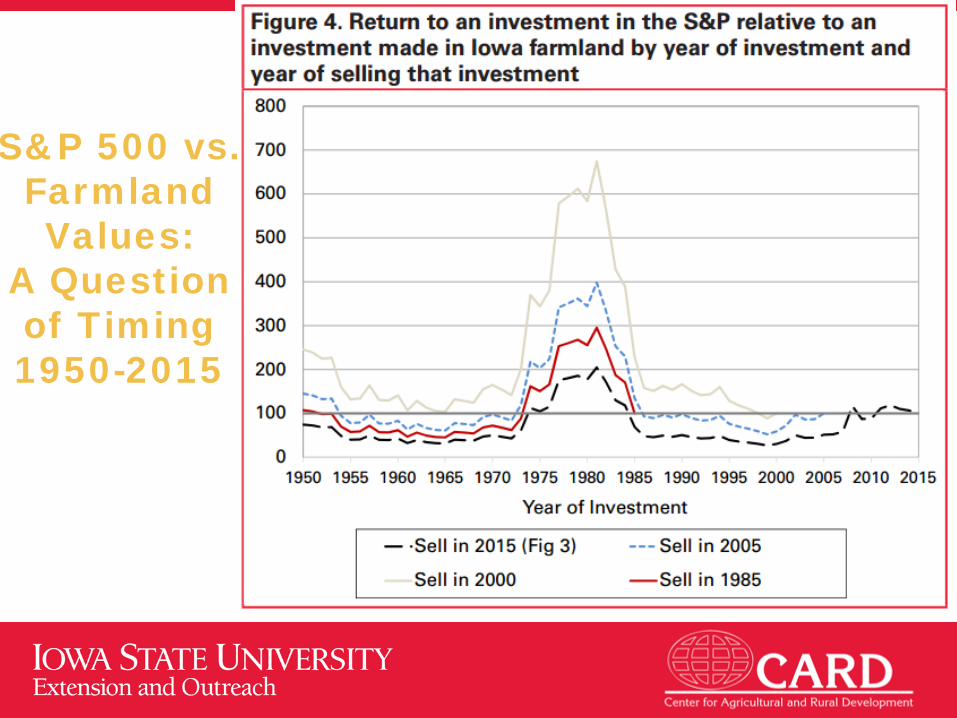
S&P 500 vs. Farmland Values:
A Question of Timing 1950-2015

Source: USDA-NASS;Ag Census
Iowa Ag Real Estate Values 1850-2016

A replay of 1920s or 1980s farm crisis?
Source: USDA-ERS, Ag DM C2-70

Iowa Farmland Value Portal
twitter#ISUlandvalue
http://card.iastate.edu/farmland


If you only remember one thing
• PV = R/I• Land Values =
Net Income/Discount RateLand Value Depends on the Source of Income

Thank You!Wendong Zhang
Assistant Professor and Extension Economist478C Heady Hall
Iowa State University515-294-2536
[email protected]://www2.econ.iastate.edu/faculty/zhang/
http://card.iastate.edu/farmland/