
ECONOMIC ANALYSIS OF DEEP SEA FISHING FLEETS · PDF fileThis paper should be cited as:...
42
This paper should be cited as: Hewamanage, L. A. K. 2010. Economic efficiency of the deep sea fishing fleet of Sri Lanka. United Nations University Fisheries Training Programme, Iceland [final project]. http://www.unuftp.is/static/fellows/document/lalith09prf.pdf unuftp.is Final Project 2009 ECONOMIC EFFICIENCY OF THE DEEP SEA FISHING FLEET OF SRI LANKA Lalith Amaralal Kariyawasam Hewamanage Socio-economic and marketing research division (SED) National Aquatic Resources Research and Development Agency (NARA) Colombo 15, Sri Lanka [email protected], [email protected] Supervisors: Ögmundur Knútsson University of Akureyri [email protected] Helgi Gestsson University of Akureyri [email protected] ABSTRACT The aim of the study was to estimate the economic efficiency of vessels operating in the deep sea fisheries in Sri Lanka, in relation to the length of these vessels. The results can then be used as a management tool for the improvement of the deep sea fisheries. Multi-day deep sea operating vessels (MDOVs) vary in length from 28-60 ft. According to a questionnaire survey conducted, all MDOVs´ had average trip duration of 9-22 days and 5-10 fishing days. Labour, fuel, food, ice and water contributed to about 41, 39, 12, 7 and 1 per cent of the total operational cost of the vessels respectively. The average net profit showed that all size classes operated with profit. The highest calculated yearly return of the capital investment of 66% was earned by the 35-39 ft group, followed 28-34 ft MDOV that earned 51%. The lowest, 9%, was earned by the > 44 ft MDOVs. Nearly one fourth of the captains surveyed had problems with foreign vessels arriving into Sri Lankan waters and about one fifth of them with fish price instability at the markets. About 13, 12 and 7% of the captains respectively named the insufficient harbour services, the constantly increasing input prices and the danger of being taken into custody by neighbouring countries when crossing EEZ country boarders as a problem. Collaboration of all actors in the industry will be the most suitable solution for the development of the industry. The possibility of vertical integration should be promoted for the development of deep sea fisheries in Sri Lanka.
Transcript of ECONOMIC ANALYSIS OF DEEP SEA FISHING FLEETS · PDF fileThis paper should be cited as:...

This paper should be cited as: Hewamanage, L. A. K. 2010. Economic efficiency of the deep sea fishing fleet of Sri Lanka. United Nations University Fisheries Training Programme, Iceland [final project]. http://www.unuftp.is/static/fellows/document/lalith09prf.pdf
unuftp.is Final Project 2009
ECONOMIC EFFICIENCY OF THE
DEEP SEA FISHING FLEET OF SRI LANKA
Lalith Amaralal Kariyawasam Hewamanage
Socio-economic and marketing research division (SED)
National Aquatic Resources Research and Development Agency (NARA)
Colombo 15, Sri Lanka
[email protected], [email protected]
Supervisors:
Ögmundur Knútsson
University of Akureyri
Helgi Gestsson
University of Akureyri
ABSTRACT
The aim of the study was to estimate the economic efficiency of vessels operating in the deep
sea fisheries in Sri Lanka, in relation to the length of these vessels. The results can then be used
as a management tool for the improvement of the deep sea fisheries. Multi-day deep sea
operating vessels (MDOVs) vary in length from 28-60 ft. According to a questionnaire survey
conducted, all MDOVs´ had average trip duration of 9-22 days and 5-10 fishing days. Labour,
fuel, food, ice and water contributed to about 41, 39, 12, 7 and 1 per cent of the total operational
cost of the vessels respectively. The average net profit showed that all size classes operated
with profit. The highest calculated yearly return of the capital investment of 66% was earned
by the 35-39 ft group, followed 28-34 ft MDOV that earned 51%. The lowest, 9%, was earned
by the > 44 ft MDOVs. Nearly one fourth of the captains surveyed had problems with foreign
vessels arriving into Sri Lankan waters and about one fifth of them with fish price instability
at the markets. About 13, 12 and 7% of the captains respectively named the insufficient harbour
services, the constantly increasing input prices and the danger of being taken into custody by
neighbouring countries when crossing EEZ country boarders as a problem. Collaboration of all
actors in the industry will be the most suitable solution for the development of the industry.
The possibility of vertical integration should be promoted for the development of deep sea
fisheries in Sri Lanka.

Hewamanage
UNU – Fisheries Training Programme
2
TABLE OF CONTENTS
LIST OF TABLES ............................................................................................................................ 4
LIST OF FIGURES ........................................................................................................................... 5
1 INTRODUCTION ................................................................................................................... 6
2 CONCEPTUAL FRAMEWORK AND LITTERATURE REVIEW........................................................ 7 2.1 INDUSTRIAL ANALYSIS.................................................................................................................. 7
2.1.1 Cost volume profit relationship (CVP) .............................................................................. 8 2.1.2 CVP terminology ............................................................................................................... 8
2.2 REVIEW OF PREVIOUS RESEARCH CONDUCTED ON DEEP SEA FISHERIES IN SRI LANKA .............................. 9
3 DEEP SEA FISHERIES IN SRI LANKA ...................................................................................... 10 3.1 THE HISTORICAL DEVELOPMENT OF DEEP SEA FISHERIES .................................................................. 10 3.2 TYPES OF DEEP SEA VESSELS IN OPERATION ................................................................................... 11 3.3 NUMBER AND AGE OF OPERATING VESSELS ................................................................................... 12
3.3.1 Deep sea fish catch .......................................................................................................... 14 3.4 THE VALUE CHAIN OF THE DEEP SEA FISHERIES ............................................................................... 15
3.4.1 Domestic market value chain of deep sea fisheries ......................................................... 15 3.4.2 The exports value chain of deep sea fisheries ................................................................. 16
4 METHODOLOGY ................................................................................................................. 16 4.1 DATA ..................................................................................................................................... 16
4.1.1 Sampling .......................................................................................................................... 17 4.1.2 Data analysis ................................................................................................................... 17 4.1.3 Categorization of MDOVs into groups ........................................................................... 18
4.2 LIMITATION TO THE STUDY ......................................................................................................... 18
5 ANALYSIS OF THE QUESTIONNAIRE SURVEY ........................................................................ 19 5.1 OPERATIONAL REVENUE ............................................................................................................ 20
5.1.1 Catch ............................................................................................................................... 20 5.1.2 Catch composition of deep sea vessels (Kg) ................................................................... 20 5.1.3 Comparison of estimated catch with official catch data ................................................. 21 5.1.4 Unit price of fish .............................................................................................................. 22 5.1.5 Revenue ........................................................................................................................... 22
5.2 OPERATIONAL COSTS ................................................................................................................ 23 5.2.1 Composition of operational cost of deep sea vessels (Rs) ............................................... 23
5.3 CAPITAL INVESTMENT ............................................................................................................... 24 5.3.1 Composition of capital investment of deep sea vessels (Rs) ........................................... 25
5.4 CAPITAL COST .......................................................................................................................... 26 5.4.1 Composition of capital cost of deep sea vessels (Rs) ...................................................... 26
5.5 GROSS PROFIT ......................................................................................................................... 27 5.5.1 Net profit ......................................................................................................................... 27 5.5.2 Return on capital investment (ROcI in Percent) ............................................................. 28
5.6 PROBLEMS IN DEEP SEA FISHERIES ............................................................................................... 28
6 ANALYSIS OF THE BENCHMARKING INTERVIEWS ................................................................. 30 6.1 FISH PROCESSING COMPANIES .................................................................................................... 30
6.1.1 Importance of quality aspects of the products................................................................. 30 6.1.2 Importance of continuous product supply to buyers ....................................................... 30 6.1.3 Importance of vertical integration .................................................................................. 31 6.1.4 Importance of targeting export market and price ........................................................... 31 6.1.5 Importance of competitive position compared to other countries ................................... 31
6.2 FISH MARKETS ......................................................................................................................... 32

Hewamanage
UNU – Fisheries Training Programme
3
6.2.1 Fish auction company ..................................................................................................... 32 6.2.2 The Fish market in Ísafjörður ......................................................................................... 32
6.3 THE SRI LANKAN RELEVANCE ...................................................................................................... 32
7 CONCLUSION AND RECCOMENDATIONS ............................................................................. 33
ACKNOWLEDGEMENTS .............................................................................................................. 36
LIST OF REFERENCES ................................................................................................................... 37
APPENDIX 1 ............................................................................................................................... 39
APPENDIX 2 ............................................................................................................................... 41
APPENDIX 3 ............................................................................................................................... 42

Hewamanage
UNU – Fisheries Training Programme
4
LIST OF TABLES
Table 1: Sample frame of the study ......................................................................................... 17
Table 2: Basic characteristics of the samples .......................................................................... 19
Table 3: Average number of hooks and drift gill net used ...................................................... 19
Table 4: Annual catch of deep sea vessels (Kg) ...................................................................... 20
Table 5: Estimated annual catch data (Kg) - 2008 ................................................................... 21
Table 6: Annual revenue of deep sea vessels (Rs) ................................................................... 22
Table 7: Annual operational cost (Rs) ..................................................................................... 23
Table 8: Capital investment of deep sea vessels (Rs) .............................................................. 25
Table 9: Annual capital cost of deep sea vessels (Rs) ............................................................. 26
Table 10: Annual gross operational profit of deep sea vessels (Rs) ........................................ 27
Table 11: Annual net profit of deep sea vessels (Rs) ............................................................... 27
Table 12: Periodic return to capital investment of deep sea vessels (in percents) ................... 28
Table 13: Problems in deep sea fishing ................................................................................... 29

Hewamanage
UNU – Fisheries Training Programme
5
LIST OF FIGURES
Figure 1: Areas and seasons of operation of MDOVs in Sri Lanka ....................................... 11
Figure 2: General appearances of the MDOVs in Sri Lanka ................................................... 11
Figure 3: Registration year of vessels operating at the end of September 2009 ...................... 12
Figure 4: Present age composition of deep sea vessels by size groups (in feet) ...................... 13
Figure 5: Annual deep sea fish catch (t) 1980-2008 ................................................................ 14
Figure 6: Value chain of the deep sea fisheries in Sri Lanka................................................... 15
Figure 7: Catch composition (Kg) ........................................................................................... 21
Figure 8: Price of fish (1Kg/Rs)............................................................................................... 22
Figure 9: Operational cost of deep sea vessels (Rs) ................................................................ 24
Figure 10: Capital investment of deep sea vessels (Rs) ........................................................... 25
Figure 11: Capital cost of deep sea vessels (Rs) ...................................................................... 26

Hewamanage
UNU – Fisheries Training Programme
6
1 INTRODUCTION
Sri Lanka is an island nation located in the Indian Ocean between lat 5° and 10oN, long 79° and
81°E. Sri Lanka is a highly populated country with about 21.3 million people and has a total
land area of 65,625 km². Sri Lanka is a multi-racial and multi-religious country and about 75
per cent of the total population is Sinhalese. Tamil, Moor, Burger and Malay make up the rest.
Majority is Buddhists and the official languages are Sinhalese, Tamil and English (CIA n.d).
Sri Lanka has a coastline of 1,777 km, which consists of bays, lagoons, estuaries and coastal
wetlands (NARA 2008). Since the declaration of 200 miles Exclusive Economic Zone (EEZ)
in 1978, Sri Lanka has sovereign right over 517,000 km² of the ocean (NARA 2008). There is
approximately 200,000 hectare of fresh water bodies. Fisheries have a long history and can be
divided into marine and inland water fisheries. Although, the present contribution of the
fisheries to the Gross Domestic Production (GDP) of the country is relatively small or about
1.2 per cent, it provides about 160,000 direct and about 400,000 indirect employments (NARA
2008). Fisheries play an important role in the society in terms of protein supply and foreign
currency earnings. About 60 per cent of animal protein intake of the people comes from fish
(Amaralal 2004). In the last two decades, export of fish and fishery products has developed
rapidly bringing a substantial amount of foreign exchange earnings to the country. In 2007,
about 2.2 per cent of country’s total export earnings came from fish and fishery products
(NARA 2008).
Total fish production of the country in 2008 was 319,000 t (NARA 2008). Marine fisheries
constitute 87 per cent of the total fish production while inland water fisheries contributed the
rest (NARA 2008). Of marine fisheries production, about 109,000 t or 40 per cent came from
deep sea fisheries that year. About 18,000 fishermen are employed and about 3,600 vessels
were registered in deep sea fisheries in the same year.
Deep sea fisheries target medium and large pelagic species mainly tuna and tuna like fish
(Maldeniya and Amarasooriya 1998). Deep sea fisheries of Sri Lanka can be divided into a gill
net fishery and a long- line fishery and extend from the edge of the continental shelf to the
outer limits and beyond the EEZ of the country.
Since 1980 the number of vessels operating in deep sea fisheries has increased by about 3,600
with the introduction of inboard-engine multi-day vessels to the deep sea fisheries in the late
1980s. Fish landings of deep sea fisheries have increased from about 8,000 t in 1989 to about
109,000 t in 2008. The types of multi-day deep sea operating vessels (MDOV) vary profoundly
in length and the degree of having sophisticated technological equipment.
Deep sea fisheries are characterised by open access resulting in the increase in the number of
vessels year by year. The uncontrolled new entries are often attributed to the absence of proper
management measures and policies. This situation can lead to decrease profitability of fishing
operations in the future. This situation can thus limit the incomes of thousands of fishermen
and other employees as well as the profitability of investments. Generally, investors make their
decisions primarily based on income expectations and subject to maximization of net benefit
from the operations (Lane 1988). For investors to be able to make sound investment decisions
the availability of reliable and real-time scientific information related to economic aspects of
the deep sea fisheries are critically important. These aspects are presently given to little
concern. In the recent past, investors have claimed that their investments have been faced with

Hewamanage
UNU – Fisheries Training Programme
7
great risk because of the reduction of operational profits due to increased operational costs as
well as low levels of catch of the fishing trips.
The government of Sri Lanka, under its present fisheries policy objectives, has planned to
increase the number of employments and food security of the people by developing the deep
sea fisheries further through introducing large sized vessels with sophisticated technology
therefore it is important to study the economic efficiency of multi-day deep sea fishing
operations in the hope of evaluating the profitability of the present deep sea fishing operations.
It is also important to undertake a benchmarking study of similar fishing operations in order to
address the causes of poor productivity of the deep sea fishing operations of Sri Lanka and in
the future find ways of improving the deep sea operations. An attempt has been made here to
achieve this through benchmarking with a part of the Icelandic fisheries.
The aim of the study was to estimate economic efficiency in relation to the length of the vessels
operating in the deep sea fisheries in Sri Lanka, which can be used as a management tool for
the improvement of these fisheries. More precisely, the objectives of the study were:
To estimate operational income of vessels operating in deep sea fisheries in Sri Lanka.
To estimate operational cost of vessels operating in deep sea fisheries in Sri Lanka.
To examine critical operational factors of vessels operating in deep sea fisheries in Sri
Lanka.
To find ways to make improvements of operational factors of vessels through
benchmarking with Icelandic fisheries.
This study will provide some preliminary answers to the questions related to the economic
aspects and management of the deep sea fisheries. On that basis it is hoped that policies and
management measures may be derived for the Sri Lankan deep sea fisheries.
2 CONCEPTUAL FRAMEWORK AND LITTERATURE REVIEW
Economic efficiency is, in general, measured as profitability in any business company or
industry that generates revenues and costs. Generally, it is also reasonable to consider that
current profitability is related to past investment and that current investment is related to future
profitability (Richardson et al. 2005). In this context it is important to be able to measure
profitability of the deep sea vessels operating in deep sea fisheries in Sri Lanka. If that is made
possible it can lead to better fisheries policies, sounder management decisions and also increase
the probability of sustainability of the industry. For analysing the industrial environment and
for calculating profitability of deep sea fishing vessels, industrial analysis was partly conducted
and both cost analysis and strategic cost management theories were considered.
2.1 Industrial analysis
A systematic way of analysing industries is important. Management decision making is
complex in a dynamic environment and needs a rational knowledge to make sound strategic
decisions to face rivalry actions in the industry. With the present increased pressure of new
entries into deep sea fisheries in Sri Lanka it is important to identify the state of the industry,
its driving forces which can completely change the industry’s profitability and the key factors
of success for the industry. Thompson and Strickland (2010) in their textbook on strategy use

Hewamanage
UNU – Fisheries Training Programme
8
a holistic model of industrial analysis. In their model they put forward seven questions that
provide a holistic understanding of the economic and competitive factors of an industry. The
questions asked are:
1. What are the industries’ dominant economic features?
2. What kind of competitive forces are industry members facing?
3. What forces are driving industry changes and what impacts will they have?
4. What market positions do rivals occupy- who is strongly positioned and who is not?
5. What strategic moves are rivals likely to make next?
6. What are the key factors for future competitive success?
7. Does the outlook for the industry offer companies’ good opportunity to earn attractive
profits?
Industrial analysis is by nature a single company specific view of the industry. The lack of
reliable data on number and the size of boats operating in the deep sea industry in Sri Lanka as
well as on revenue and costs also limit the use of this holistic model. For the purpose of this
study it is used here to give an overview of the industry and its profitability and is only used as
a guideline for the analysis that follows leaving out the company specific aspects of the
questions. This means that for guidance for the industrial analysis the author focuses on
questions 1, 2, 3 and 6. This coupled with the results from the questionnaire survey conducted
will hopefully add meaningful understanding of the industry and be used as a first step for
future management decisions for these fisheries.
2.1.1 Cost volume profit relationship (CVP)
Cost volume profit analysis examines the behaviour of total revenues, total cost and operating
profit as changes occur in the output level, selling price, variable cost or fixed cost. This
analysis is used to answer questions that have a “what if” theme (Bhimani et al. 2008). This
method was used to calculate the main economic criterion related to the deep sea fisheries in
Sri Lanka. Revenues are received by harvesters (fishermen) from assemblers (buyers) in
exchange for the catch of fish at the markets (landing centres). Selling price of fish, the volume
of fish harvested and operational cost affect revenues of deep sea fishing. The quality of the
fish is an important part of the price. Changes in a cost factor in turn cause a change in both
the total cost and the net revenue of the operation. The main operational cost factors of deep
sea fisheries in Sri Lanka have in earlier research been identified as fuel, ice, water, food and
labour (Amarasinghe 2001).
2.1.2 CVP terminology
In the context of Sri Lankan deep sea fisheries it is assumed here that total costs are made up
of only two categories: Operational cost, as a synonym for variable cost, and fixed cost.
Therefore, Total Cost = Operational Cost + Fixed Cost.
Operational cost includes all variable cost related to fishing operations at the sea such as
drinking water, ice, fuel, wages and food expenses. Similarly, fixed cost includes all fixed costs
related to the capital investments such as on the vessel, fishing gears and communication and
navigation equipment. Other fixed costs related to the operations are not calculated here. The
main equipment associated with deep sea fishing vessels are radio communication equipment
and satellite navigators.

Hewamanage
UNU – Fisheries Training Programme
9
Cost of the capital is assumed to be the depreciation cost of vessel, engine, gear and equipment.
These were calculated on the basis of a straight forward depreciation method. The following
life-times were used in calculating of depreciation costs:
Hull = 16 Years
Engine = 8 Years
Equipment = 12 Years
Gear = 4 Years
These life values of fixed assets are in accordance with a technical report of Bay of Bengal
Programme (BOBP), on exploratory fishing for large pelagic species in Sri Lanka by
Maldeniya and Suraweera (1991). Both operational and fixed costs were estimated using the
authors´ questionnaire survey results.
Operating profit or Gross profit in the deep sea fisheries is found as the total revenues from
fishing operations minus the total operational costs of the operations or as follows:
Operating profit (Gross profit) = Total Revenues - Total Operational Costs
Net profit is then found as the Operating profit (Gross profit) minus fixed costs. Thus, net profit
was calculated as follows:
Net Profit= Operating Profit - Fixed Cost
Return on the fixed capital investment was calculated as a ratio by dividing net profit by the
total fixed capital investment. The ratio as such does only show the return for the period, which
the net profit is calculated. The result was then expressed as a percentage of the total value of
the fixed capital investment:
Return on the capital investment = (Net profit/Fixed Capital Investments)*100
Due to the lack of reliable financial data no attempt was made to find the return on investment
over a lifetime of the investment taking into account the time value of money and the expected
return for the investment.
2.2 Review of previous research conducted on deep sea fisheries in Sri Lanka
Only a handful of studies have been conducted addressing issues related to the economic and
social aspects of the deep sea multi day fisheries in Sri Lanka. In the BOBP proceedings
Madeniya and Suraweera (1991) studied operational income and cost of deep sea operations
and later Gulbrandsen (1998) in his FAO technical paper evaluated those data under the techno-
economic valuation of offshore boats. His conclusions were that those operations were not
economically viable, showing that 34 ft deep sea vessels owners had earned only 3 per cent
return on their investment. Amarasinghe (2001) studied economic and social implications of
multi-day fishing in Sri Lanka and concluded that annual revenues did not increase in
proportion to the length of the vessels and that the capital cost of vessels increased with length.
He found that hull, engine and gear accounted for 38, 29 and 33 per cent of the total cost of the
vessels respectively. Of operational cost 50 per cent went to labour and 20 per cent for fuel. It
should be noted that in his study he categorized vessels into groups differently from the
categorization of this study.

Hewamanage
UNU – Fisheries Training Programme
10
Kumara (2001) examined issues related to deep sea fishermen and their families due to their
detention in foreign countries and concluded that fishermen wives and family members, more
than others, were faced with difficulties in managing their daily activities, due to the absence
of their husbands. Thordarson (2008) studied the value chain of yellow fin tuna in Sri Lanka
and concluded that the arrival of foreign vessels into Sri Lankan waters was both criticised and
protested by fishermen. He further found that the new entry, substitute products, buyers and
inputs suppliers bargaining power and rivalry among existing companies of deep sea fisheries
had made negative effects to the industry and may have an effect to reduce the profitability of
the industry in future.
3 DEEP SEA FISHERIES IN SRI LANKA
The administrative and policymaking organization for fisheries in Sri Lanka is the Ministry of
Fisheries. It was set up in 1970. The functions of the Ministry are to promote the development
of the fishing industry, regulate fisheries activities and look after the welfare of those who
engage in fishing. The deep sea multi-day fisheries of the country are still managed as an open
access fishery. At present the department of fisheries handles a scheme to issue licenses for
deep sea vessels for fishing operations under the fisheries act. It is generally considered that
the management of deep sea fisheries is a difficult task due to the increase of unregistered
vessels entering the deep sea fisheries over the last few years.
3.1 The historical development of deep sea fisheries
With the high rate of population growth in Sri Lanka fish foods demand increases too. To cater
to this increased demand, higher rates of exploitation of fish beyond the existing levels have
become necessary. In order to face this challenge the state decided to expand fish production
by introducing multi-day fishing vessels in the late 1980s to develop offshore fisheries.
After experiments conducting the late 1950s by the state using one-day operating crafts
(ODOC) with inboard engine for deep sea fisheries for facilitating fishing up to 40 km from
the coastline that type of fishing became popular among fisher folk. However, these types of
boats were not equipped with facilities to chill or freeze the fish and therefore they had to
confine their fisheries only one day. By the late 1980s as a solution to mitigate this problem
the fishers started introducing an ice compartment to their existing one-day crafts. These
became very popular as tank boats or tanki boattu. These tank boats were later replaced by
multi-day deep sea operating vessels (MDOV), which were longer, and with more sophisticated
equipment, an ice hold and a cabin for the crewmembers (Amarasinghe 2001).
The over 28 ft long MDOVs are mainly engaged in deep sea fisheries using large-mesh gill
nets and long lines. The main areas and seasons of operation of the MDOVs´ within and outside
the Sri Lanka’s EEZ are shown in Figure 1.
Deep sea fisheries in Sri Lanka operate mostly in 3 areas depending on both oceanographic
conditions and fisheries. Oceanographic conditions around Sri Lanka are driven by bimodal
pattern of monsoonal winds. These monsoons give rise to two periods of fishing operations,
the North-East one from December to February and the South-West one from May to
September. However, fishing is conducted in the South throughout the year.

Hewamanage
UNU – Fisheries Training Programme
11
Figure 1: Areas and seasons of operation of MDOVs in Sri Lanka.
In the south, south-east and the east gillnets are used alone but in the west and the south-west
gillnets are used together with long lines (Maldeniya and Amarasooriya 1998).
3.2 Types of deep sea vessels in operation
The types of the MDOVs´ presently operating in the deep sea fisheries are made of fibreglass
but vary in length and the degree of having sophisticated technological equipment. A general
appearance of the modern MDOVs can be seen in Figure 2.
Figure 2: General appearances of the MDOVs in Sri Lanka.
Hewamanage
UNU – Fisheries Training Programme
12
The lengths of these vessels generally vary from 28 to 60 ft and inboard-engines power them.
Most of the MDOVs in operation today are 28 to 40 ft powered by 45 to 110 hp engines. These
MDOVs are often equipped with navigation and communication equipment. To enable the
MDOVs to engage in longer fishing trips a water tank, two fuel tanks, an ice hold, a fish hold
and a cabin facilitate them for crewmembers. With the increase in the length of the vessels, the
size of its fuel tanks, water tank, ice holding and fish holding capacities have also increased,
making longer trips possible and more efficient. Generally 3 crew members and the captain are
employed of the vessels from 28 to 32 ft while 4 crew members and the captain are employed
for the 32-45 ft. Most of the time vessels > 45 ft are employ 4 crew members and the captain
but some of the bigger vessels employ 5 crew members and the captain for their fishing
operations. Drift gill nets and lone line are used by all size categories of the vessels but the
larger vessels over 39 ft often use mostly long line, targeting tuna for export markets. Smaller
sized vessels, below 39 ft, mostly use drift gill nets for fishing rather than long line.
Gulbrandsen (1998) has indicated that the present day barge-like shape of the MDOVs´ may
have adverse influence on the stability of the vessels. He also emphasised that many of the
MDOVs´ operating in deep sea fisheries do not meet the international safety standards and are
not equipped with onboard safety devices. Even at present, since facilities for freezing are not
available in most MDOVs´, fish can´t be preserved for a long period. A few MDOVs, which
are equipped with chill bathing facilities, practice fishing for a longer period at sea, sometimes
longer than one month.
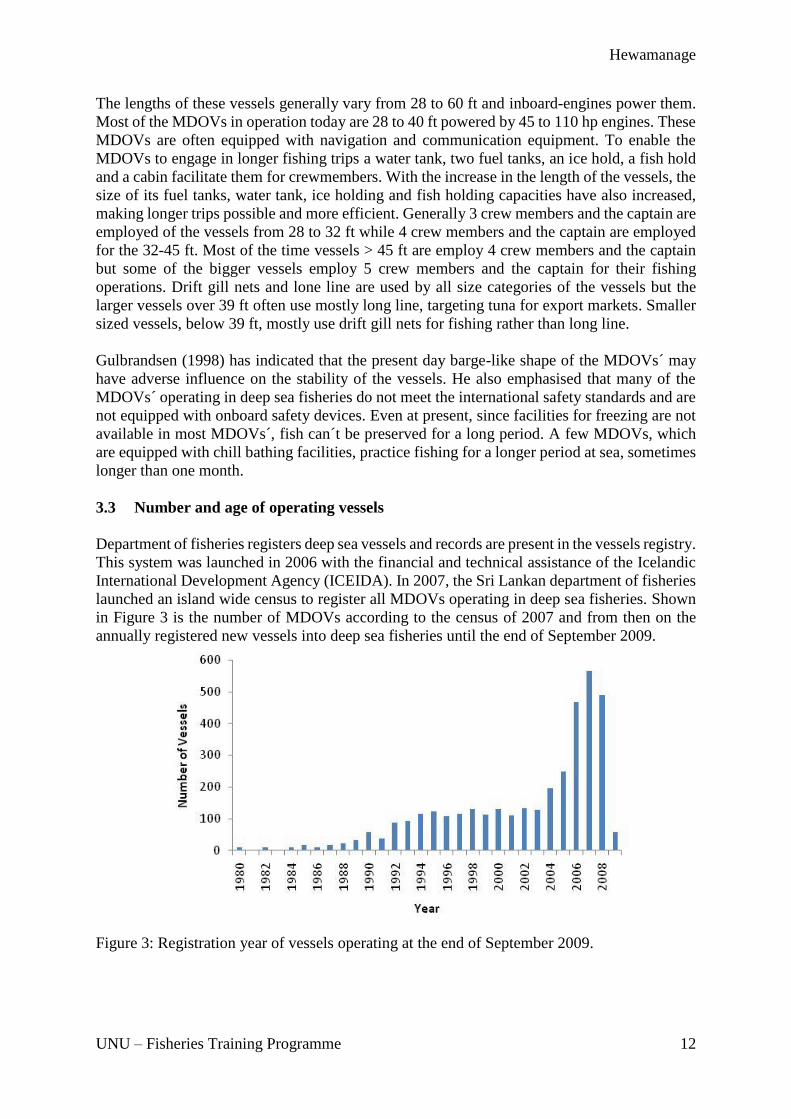
3.3 Number and age of operating vessels
Department of fisheries registers deep sea vessels and records are present in the vessels registry.
This system was launched in 2006 with the financial and technical assistance of the Icelandic
International Development Agency (ICEIDA). In 2007, the Sri Lankan department of fisheries
launched an island wide census to register all MDOVs operating in deep sea fisheries. Shown
in Figure 3 is the number of MDOVs according to the census of 2007 and from then on the
annually registered new vessels into deep sea fisheries until the end of September 2009.
Figure 3: Registration year of vessels operating at the end of September 2009.

Hewamanage
UNU – Fisheries Training Programme
13
The figure indicates that the now operating multi-day deep sea vessels, registered from 1980
to 1984, were relatively few. The number of operating vessels, registered since then, has been
increasing slightly over the years until 1990. The main reason for this increase was a subsidy
scheme introduced in 1983 by the government, financed through the Abu Dhabi Trust Fund.
Under this scheme 35 per cent of the capital expenditure of vessels was subsidized and a total
number of 70 vessels entered the fisheries through this program (Gulbrandsen 1998).
For the vessels registered according to the census after 1992 the number of now operating
vessels has shown a sharp increase up to 1995. The main reason for this increase was the
subsidy scheme, which was introduced by the government in 1991. Under this scheme the
government subsidized 35% the converting of the existing one day 3.5 t vessels into multi-day
deep sea vessels. Although the records of actual numbers of converted vessels through this
program are not available it is assumed that a large number of fishermen benefited and, because
of the subsidies, entered the deep sea fisheries. For the vessels now operating it can be seen
that after 1996 the number of vessels is more or less stable until 2003. At the beginning of 2005
the deep sea fisheries faced the diminishing in fish landings due to the reduction of operated
vessels, which were destroyed or damaged by tsunami devastation at the late of 2004. It was
estimated that 195 deep sea vessels were destroyed and 402 vessels were damaged due to the
tsunami devastation (MFAR 2007).
In 2006 and 2007 a sharp increase in numbers of registered vessels can be seen. The main
reason for this can be attributed to vessel donations by governmental and nongovernmental
organizations under the programme of restoration of fisheries, which were affected by tsunami
devastation. It was found that the registered number of MDOVs´ has increased by 66% in 2007
compared to the year 2004. Relevant information is not available for the estimation of the
numbers of MDOVs that were entered into the deep see fisheries as a result of donations
immediately after the tsunami (MFAR 2007). In the present study, MDOVs have been grouped
into four categories according to lengths. Figure 4 presents the age of registered vessels of the
4 categories: 28-34, 35-39, 40-44 and >44 ft.
Figure 4: Present age composition of deep sea vessels by size groups (in feet).

Hewamanage
UNU – Fisheries Training Programme
14
Age 0.5 represents newly registered vessels of 2009 while 29.5 for year the vessel registered
in 1980. A large proportion of vessels in all size categories are less than 10 years old but there
is a clear trend for an increase in the size of vessels in the past 5 years. It is clear that after the
tsunami the number of vessels in deep sea fisheries has increased sharply and a large proportion
of the increase was in the 40-44 ft size category of vessels followed by the 35-39 ft.
3.3.1 Deep sea fish catch
Deep sea fisheries mainly target by medium and large tunas with skipjack (Katsuwonus
pelamis) and yellow fin (Thunus albacares) dominating the catches while sailfish (Istiophorus
playtypterus), swordfish (Xiphias gladius) and marlin are also common in the catch. Many
species of sharks are also a part of the deep sea catches.
Catch estimates of Sri Lanka have often been criticised in the recent past. Many international
governmental and nongovernmental organizations have pointed out that country’s catch
estimates were subjected to a high degree of uncertainty (IOTC 2009). This has to be taken
into account when using Sri Lankan catch estimates. In Figure 5 below the annual total fish
catch of the country and its trend are shown based on official catch statistics.
Figure 5: Annual deep sea fish catch (t) 1980-2008.
Annual deep sea fish catch from 1980 to 1990 was very low due to low numbers of vessels
engaged in these fisheries in that period. During the period of 1990 to 1995 more than a 500%
increase is seen in deep sea fish catch. This increase can be attributed to the increase in numbers
of vessels operating in that period. Since then, fish production has been increasing up to 2004
although some fluctuations are noticed. In 2005 the deep sea catch dropped from 98,000 t in
2004 by about 32% to about only 66,000 t due to the tsunami devastation in 2004. Owing to
rehabilitation programmes and donations of vessels and gear from international organizations
the deep sea catch went in 2006 almost up to what it had been in 2003 and has been on the
increase since then. When comparing the increase in the number of vessels entered into the
fisheries from 2006 to 2008 (Figure 3), when 1,521 were added, the increase in the catch for
the same years is relatively much less. The most likely explanation is that either vessels are not
targeting the resource areas correctly or an over exploitation of the deep sea resources is taking

Hewamanage
UNU – Fisheries Training Programme
15
place. This situation should be given more concern by the authorities governing the
management of these fisheries. Most of the total catch is sold in local markets and the rest in
export market. A large proportion was exported to the high value markets especially to the
Shasimi market in Japan. Local market prices of deep sea fish, especially tuna, are high
throughout the year relative to the buying power of the locals. Almost all the catch enters the
local market without any processing. Minimum processing is done before exporting to the
Japanese market but some filleting and packaging are done for markets in the EU.
Deep sea fisheries are increasingly using new technological equipment and technology for their
operational activities, especially mobile phones, using them to communicate with assemblers
and using the Internet for communication with foreign buyers. This has resulted in a cost
reduction and an increase of the profitability of the companies. Producers for export markets
now use safety standards in processing of fish for cater international market demand, where
more concern is placed on the product quality and safety.
3.4 The Value chain of the deep sea fisheries
The value chain of deep sea fisheries of Sri Lanka is comprised of two parts, domestic market
and exports (Figure 6).
Figure 6: Value chain of the deep sea fisheries in Sri Lanka.
3.4.1 Domestic market value chain of deep sea fisheries
The domestic market value chain of the deep sea fisheries has three links connecting the
harvester and consumer, namely assembler, commission agent and retailer (Amaralal 2004).
The assembler, who is the first middleman, buys fish directly from vessels when they come
ashore and sends it to the wholesale market in Colombo where the commission agents, the
Agent Processor/Exporter
Export
Markets
Exports Value Chain
Domestic market Value Chain
Processor
Commission
agent
Retailer
Consumer
Har
ves
ting
Ass
emb
ler

Hewamanage
UNU – Fisheries Training Programme
16
second middleman in the structure, take over. The commission agents sell the fish on behalf of
assemblers for a commission. Generally they take 10 percent commission of the total revenue
and send the balance to the assemblers. Commission agents do not bear any risk on price
reduction in terms of quality deterioration of fish in between landing and the distribution of
fish to the market. Retailers, the final intermediaries, buy fish from the commission agents and
sell it to consumer with a mark-up.
3.4.2 The exports value chain of deep sea fisheries
Exports value chain of the deep sea fisheries comprises of two links, the assembler or the agent
and the processor/exporter. The latter consists of few private companies, targeting export of
yellow fin tuna to the Japanese Sashimi market and some considerable amount of yellow fin
tuna and other tuna like skipjack and big eye to the EU and Asian markets. These companies
purchase high quality fish offering a higher price than local market price through their direct
and indirect agents. After minimal processing the fish is exported by air to the foreign markets.
4 METHODOLOGY
The methodology used in this study can be described by a list of chronological steps as follows:
1. Preliminary survey and study planning
2. Drafting of study questionnaire
3. Piloting of questionnaire
4. Minor modifications to the questionnaire
5. Administration of the questionnaire (Data collection)
6. Conducting benchmarking interviews in Iceland
7. Data entry and analysis
8. Report writing
4.1 Data
A Cross-sectional questionnaire survey data was collected through direct interviews with
captains of deep sea vessels asking 7 questions on capital investment, operational cost, total
catch, unit sale price of fish, total number of days at sea, number of fishing days and barriers
they see to the deep sea fisheries. NARA officials from January to August 2009 interviewed
100 vessel captains. Some captains were unaware of the capital investment of the vessel so that
information had to be gotten from the vessels owner. Data from the vessel registry from the
Ministry of Fisheries was also used for information on the registered deep sea vessels in Sri
Lanka. Data from Icelandic fish processing and marketing companies was collected through
direct interviews. 6 semi-structured interviews with Icelandic company managers were
conducted, asking 6 to 7 questions under 5 themes; quality aspects of the products, marketing
of products and product development, marketing strategies, company competitive strategies
and company key success factors. In both Reykjavík and Ísafjöður, two mangers from fish
processing companies, were interviewed. Also in both Reykjavík and Ísafjörður author himself
interviewed one executive from a fish marketing company in January 2010.

Hewamanage
UNU – Fisheries Training Programme
17
4.1.1 Sampling
A convenience sample of 100 MDOVs captains representing all types of vessels operating out
of seven fishery harbours were selected for the study, namely out of; Beruwala, Negombo,
Tangalle, Mirissa, Trincomalee, Hikkaduwa and Kalpitiya. During the data analysis it was
found that in some cases the data was incomplete and those samples were omitted from
analysis. The final samples used were 89 MDOVs captains. The sample frame of the study is
shown in Table 1 below. The sample percentage of the first two groups (28% respectively) is
only slightly lower than the percentage of total vessels operating in these groups (32 and 33%
respectively). For the 40 to 44 ft group the sample percentage (35%) is only a bit higher than
the total percentage (32%). If this was the variation of the total sample it would tolerably
indicate that the sample represented the total boats operating.
Table 1: Sample frame of the study.
Type of
the vessel
Total number of
vessels in deep
sea fisheries
Percentage of
total vessels
Number of
samples
Percentage of
the sample
Percentage of
total vessels
28 – 34 ft 1,151 32 25 28 2
35 – 39 ft 1,208 33 25 28 2
40 – 44 ft 1,144 32 31 35 3
> 44ft 126 03 8 09 6
Total 3,629 100 89 100
Since the group >44 ft shows that the relative sample size (9%) is trice the total sample size
(3%) it can’t be said that the sample variation is a good indicator for the total of boats operating
in the deep sea fisheries.
4.1.2 Data analysis
Data analysis of this study was done with SPSS (17) software package and some graph were
developed using Microsoft Excel software package. All survey data was, before analysis, coded
and tabulated according to the requirements of SPSS. In this study the interest lies in comparing
the mean scores of four different vessel size groups, 28-34, 35-39, 40-44 and >44 and therefore
an analysis of variance (ANOVA) was conducted. To identify which groups means differ the
post-hoc tests were conducted. The study uses 4 vessel groups. Therefore, only one-way
analysis of variance between groups was used. Because the sample sizes were fairly different
in the study it was found doubtful that the population variances were equal. Therefore, the
Games-Howell procedure was chosen since it offers the best performance under such
conditions.
In the survey, data was collected for a trip. To convert the trip data into a yearly data for each
vessel group, the trip data was multiplied by the corresponding total number of trips per year
for each vessel group.
Hewamanage
UNU – Fisheries Training Programme
18
4.1.3 Categorization of MDOVs into groups
All vessels registered for deep sea fisheries were in the study categorized into 4 groups
according to their lengths. This categorization was decided on after considering the available
technical recommendations suggested by previous studies of the deep sea fisheries in Sri
Lanka. Amarasinghe (2001) indicated that vessels over 34ft in length are technically well-
suited for the deep sea fisheries in Sri Lanka even if boats as small as 28ft are taking part in the
deep sea fishing. Pajot (1993) recommended that special safety regulations for vessels less than
12 m (39ft) in length used for deep sea fishing should be introduced. The safety measures
needed thus only to be applied to boats up to 12 meters long (39.1 ft). Taking this into account
it was decided that the second deep sea fishing group was to be made up of boats 35 to 39 ft
long.Thordarson (2008) in his study recommended that vessels greater than 44 ft in length
should be promoted for Sri Lankan deep sea fisheries if the country wanted to target the
international market through enhancing the quality of fish. He emphasised that quality
standards of fish in international markets cannot be achieved without having proper onboard
handling and preservation facilities, and for this end to accommodate necessary facilities, the
vessel need to be over 44 ft in length. Thus, considering all these facts and information the
MDOVs were categorized into 4 groups as 28-34, 35-39, 40-44 and >44 ft respectively.
4.2 Limitation to the study
In Sri Lanka there are mainly to different operational strategies used in deep see fisheries;
individual deep sea fishing where captains are independently landing their trips´ catch at the
market, and the collecting of export quality catch, where bigger export companies send boats
to collect the quality catch at sea for export purposes. For the collective fishing to work a
number of boats have to work together and after few days or a week a boat collects the total
catch and brings it to land for processing and export. This way the quality is better guarantied
than with the individual fishing. In this study the boats of the sample are all using the individual
fishing strategy. Hence collective fishing strategy is not represented in the study.
Survey data of this study was collected in the period from January to August 2009. The
questions asked were for one trip. The answers were then used for calculating the annual results
of this study by multiplying answers by the number of trips pr. year. This may have an effect
on the results of the study. All study results were based on data that was given by the vessel
captains and it has to be considered how reliable the data is. Study samples did not quite
equally represent the population of the vessels operating in the deep sea fisheries in Sri Lanka.
This may have some effect on the results of the study.

Hewamanage
UNU – Fisheries Training Programme
19
5 ANALYSIS OF THE QUESTIONNAIRE SURVEY
The basic characteristics of the sample are shown in Table 2. Here, according to the
information given by the captains in the survey, the actual fishing days of the trip, total days
at the sea per year, the ratio of fishing efficiency of size categories of vessels, number of
fishing trips per year and the total number of days every year at sea are shown.
Table 2: Basic characteristics of the samples.
Vessel
Group
Frequency Total number
of days per
trip
Actual
fishing days
per trip
Ratio of
fishing
efficiency
Total
number of
trips per
year
Total days
at sea per
year
28-34 25 9 5 55.5% 27 243
35-39 25 13 6 46.2% 21 273
40-44 31 19 9 47.4% 14 266
>44 8 22 10 45.5% 12 264
The highest number of days of a trip and actual fishing days of a trip are seen for the > 44ft
group while the lowest to the 28-34 ft group. The highest number of trips a year is taken by the
28-34 ft group while the fewest trips are taken by the > 44 ft group. The ratio of fishing
efficiency is found as the actual fishing days per trip to the total days per trip. The smallest
group is most efficient and the biggest group least efficient.
Travelling distance and storage capacity of ice normally increases with the size of vessel and
therefore the number of sea days is higher for the bigger vessels.
The average number of trips per year was found by multiplying the total number of sea days of
a month per vessel group by 12. This was then divided by the total number of days per trip.
The average number of trips per year for 28-34 ft was 27 followed by 21 for the 35-39 ft, 14
for the 40-44 ft and 12 for the >44 ft size categories respectively.
The distance to the fishing area, the numbers of days that the fish can maintain export quality
on ice or in the chill baths govern the number of sea days and fishing days per trip. The bigger
vessels, which have chill baths, can sail long distance making more sea days and fishing days.
Almost all vessels, irrespective of their size categories, use hooks and drift gill nets for fishing
(Table 3). Vessels targeting the best quality tuna for export markets mostly use long line, while
other vessels use both long line and drift gill nets. Generally all size categories of vessels deploy
both nets and hooks and the how much so depends on oceanographic condition of the resource
area.
Table 3: Average number of hooks and drift gill net used.
Vessel group Average number of drift net
pieces (equal to 91 meters)
used
Average number of hooks
used
28-34 46 267
35-39 51 311
40-44 48 354
>44 56 275
Hewamanage
UNU – Fisheries Training Programme
20
According to this the largest size category of vessels uses as low an amount of hooks as the
smallest group does.
5.1 Operational revenue
Operational revenue of deep sea vessels is only made up of sale revenues. Therefore the
operational revenue is highly sensitive to the market price of fish. Thordarson (2008) found
that the unit price of grade 1 quality tuna collected for export and tuna collected for the local
market is about 3 per cent higher at the landing centre. The market price of fish changes
according to the supply of fish at the market. If the quality of fish is high the price will tend to
be higher. If the quantity of fish supplied at the market is high the price of fish will be lower.
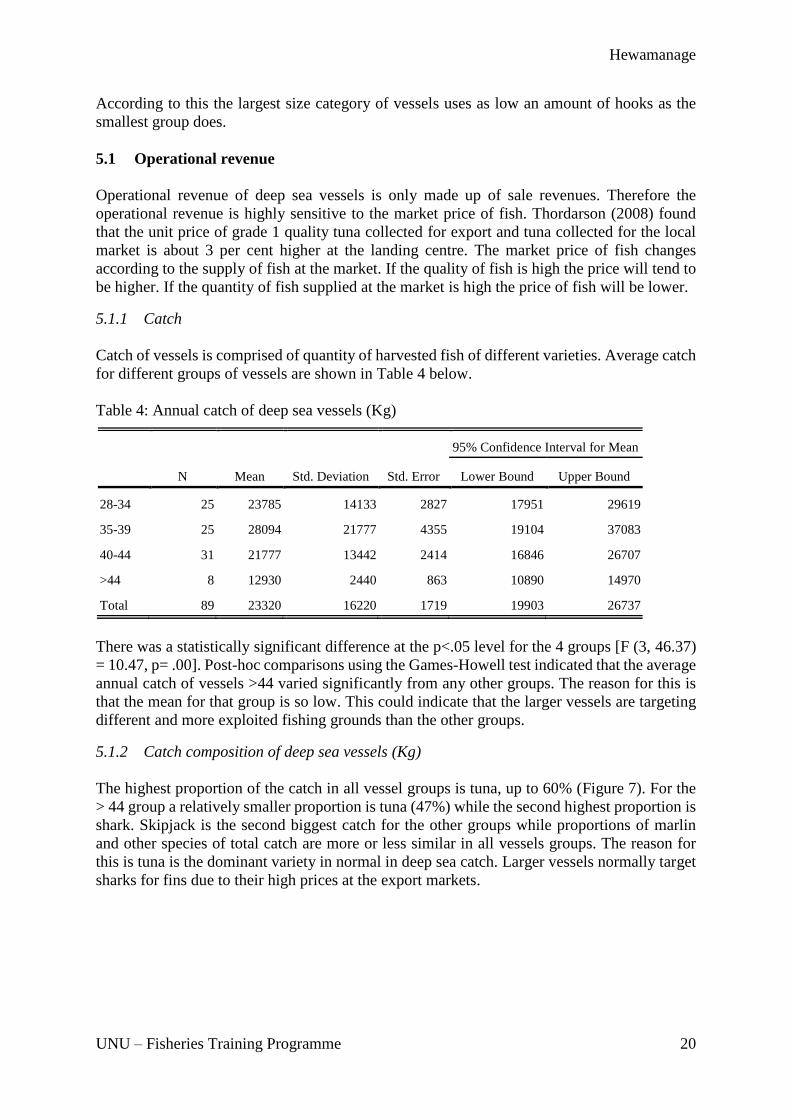
5.1.1 Catch
Catch of vessels is comprised of quantity of harvested fish of different varieties. Average catch
for different groups of vessels are shown in Table 4 below.
Table 4: Annual catch of deep sea vessels (Kg)
N Mean Std. Deviation Std. Error
95% Confidence Interval for Mean
Lower Bound Upper Bound
28-34 25 23785 14133 2827 17951 29619
35-39 25 28094 21777 4355 19104 37083
40-44 31 21777 13442 2414 16846 26707
>44 8 12930 2440 863 10890 14970
Total 89 23320 16220 1719 19903 26737
There was a statistically significant difference at the p<.05 level for the 4 groups [F (3, 46.37)
= 10.47, p= .00]. Post-hoc comparisons using the Games-Howell test indicated that the average
annual catch of vessels >44 varied significantly from any other groups. The reason for this is
that the mean for that group is so low. This could indicate that the larger vessels are targeting
different and more exploited fishing grounds than the other groups.
5.1.2 Catch composition of deep sea vessels (Kg)
The highest proportion of the catch in all vessel groups is tuna, up to 60% (Figure 7). For the
> 44 group a relatively smaller proportion is tuna (47%) while the second highest proportion is
shark. Skipjack is the second biggest catch for the other groups while proportions of marlin
and other species of total catch are more or less similar in all vessels groups. The reason for
this is tuna is the dominant variety in normal in deep sea catch. Larger vessels normally target
sharks for fins due to their high prices at the export markets.

Hewamanage
UNU – Fisheries Training Programme
21
Figure 7: Catch composition (Kg)
5.1.3 Comparison of estimated catch with official catch data
About a 21,000 t difference is found when, using survey data, the estimated annual total catch
of deep sea fisheries and the annual official total catch data from the Ministry of fisheries is
compared (Table 5). From this could be assumed that the collected survey data did not represent
the resource areas accurately or that captains might have given wrong information on catch
data from their operations.
Table 5: Estimated annual catch data (Kg) - 2008.
Vessel group Number of vessels Average catch from
sample
Estimated total catch
according to sample
average
28-34 1,151 23,785 27,376,535
35-39 1,208 28,094 33,937,552
40-44 1,144 21,777 24,912,888
>44 126 12,930 1,629,180
Total 3,629 23,320 87,856,155
Official catch 109,000,000
It can be seen that the estimated catch volume according to the survey data is about 21,000
Kg or 19% lower than official catch data. Reasons for this could be that either the survey data
given by the vessel captains are unreliable or, that due to the small sample size of the study,
the real catch of the deep sea fisheries was not represented by the sample.
Hewamanage
UNU – Fisheries Training Programme
22
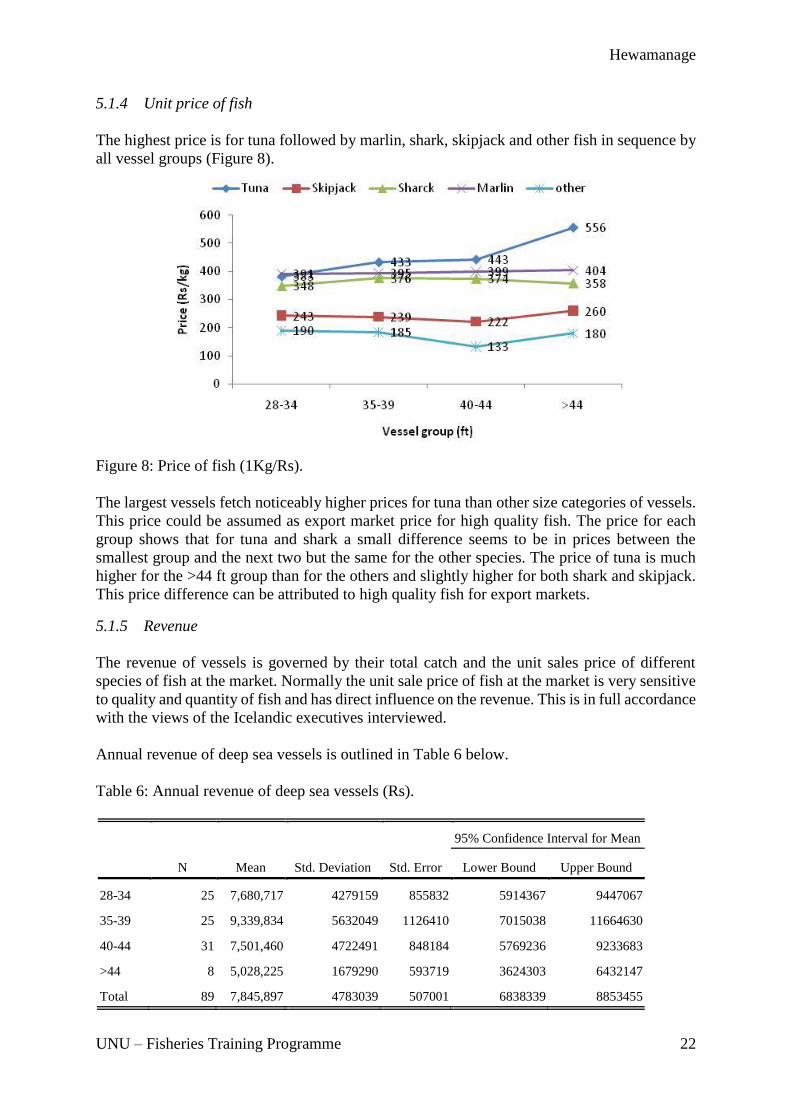
5.1.4 Unit price of fish
The highest price is for tuna followed by marlin, shark, skipjack and other fish in sequence by
all vessel groups (Figure 8).
Figure 8: Price of fish (1Kg/Rs).
The largest vessels fetch noticeably higher prices for tuna than other size categories of vessels.
This price could be assumed as export market price for high quality fish. The price for each
group shows that for tuna and shark a small difference seems to be in prices between the
smallest group and the next two but the same for the other species. The price of tuna is much
higher for the >44 ft group than for the others and slightly higher for both shark and skipjack.
This price difference can be attributed to high quality fish for export markets.
5.1.5 Revenue
The revenue of vessels is governed by their total catch and the unit sales price of different
species of fish at the market. Normally the unit sale price of fish at the market is very sensitive
to quality and quantity of fish and has direct influence on the revenue. This is in full accordance
with the views of the Icelandic executives interviewed.
Annual revenue of deep sea vessels is outlined in Table 6 below.
Table 6: Annual revenue of deep sea vessels (Rs).
N Mean Std. Deviation Std. Error
95% Confidence Interval for Mean
Lower Bound Upper Bound
28-34 25 7,680,717 4279159 855832 5914367 9447067
35-39 25 9,339,834 5632049 1126410 7015038 11664630
40-44 31 7,501,460 4722491 848184 5769236 9233683
>44 8 5,028,225 1679290 593719 3624303 6432147
Total 89 7,845,897 4783039 507001 6838339 8853455

Hewamanage
UNU – Fisheries Training Programme
23
There was a statistically significant difference at the p<.05 level for the 4 groups [F (3, 40.91)
= 5.04, p= .00]. Post-hoc comparisons using the Games-Howell test indicated that the average
annual revenue of vessels >44 ft was significantly varied from 35-39 ft vessels. The average
revenue for vessels 28-34 ft did not vary that of any other size vessels from all groups. The
reason for this was as said before the corresponding amount of catch of each group, the mix of
species caught by each group and the corresponding unit price of fish.
5.2 Operational costs
Fuel, drinking water, ice, food and labour of the fishing trip are considered as operational cost.
Yearly average operational costs of vessel groups are shown in Table 7 below.
Table 7: Annual operational cost (Rs).
N Mean Std. Deviation Std. Error
95% Confidence Interval for Mean
Lower Bound Upper Bound
28-34 25 5,283,310 2566516 513303 4223904 6342716
35-39 25 6,479,400 3295707 659141 5118999 7839801
40-44 31 5,202,097 2710280 486781 4207959 6196236
>44 8 3,678,006 845850 299053 2970857 4385154
Total 89 5,446,706 2817065 298608 4853285 6040127
There was a statistically significant difference at the p<.05 level for the 4 groups [F (3, 43.13)
= 6.75, p= .00]. Post-hoc comparisons using the Games-Howell test indicated that the annual
average operational cost of vessels >44 significantly varied from 35-39 ft. The average cost for
groups 28-34 and 40-44 ft did not vary from that of any other size vessels from all groups.
The highest operational cost is at the vessels group 35-39 ft while the lowest at the >44 ft vessel
group. Operational cost of deep sea vessels was assumed to be governed by the value of
material inputs and food consumed and the number of days of the trip. Further it can be
predicted that these two variables have a linear relationship to each other. It can be further
assumed that the cost of fuel consumption differs according to the distance travelled, the service
speed and the weather condition at sea. The weather conditions are an uncontrollable factor
and if the weather is rough it leads to lower service speed and an increase in fuel consumption
and vice versa. If the number of sea days of the trip is high the ice usage and food consumption
can be higher and vice versa. Fresh water is used for drinking and will be increased or decreased
corresponding with the number of sea days of the trip.
5.2.1 Composition of operational cost of deep sea vessels (Rs)
The highest proportion of total operational cost goes to labour followed by fuel and foods while
the lowest for water in all vessel groups (Figure 9). The highest fuel cost is about 41% and
belongs to the group >44 ft followed by 40% both for the 35-39 and 40-44 ft groups and 37%
for the 28-34 ft group respectively. These cost results differ from the previous research results
of Amarasinghe (2001). The greatest difference lies in his estimate of labour cost where he
states that labour cost is around 50% of the total variable cost.

Hewamanage
UNU – Fisheries Training Programme
24
Labour cost is a highly influential factor on operational costs which is totally governed by gross
profit of the vessels since this is calculated as a percentage of the total gross profit, 50% for the
crew and 5% for the captain. The vessel group 35-39 earned a higher average yearly gross
profit than other groups resulting in increased labour cost and in turn increased operational
cost. The vessel group 35-39 ft earned a higher average yearly gross profit than other groups
resulting in increased labour cost and in turn increased operational cost.
Figure 9: Operational cost of deep sea vessels (Rs). * Cost related to water is not shown due to the small percentage.
The composition of operational costs of vessel groups shows a slight variation between the
groups generally the labour and fuel costs are the major parts of the operational cost among all
groups. These two cost factors collectively accounted for about 80 per cent to the total
operational cost of the vessels. Food cost contributes about 13 per cent to the total operational
cost. Ice cost only contributes about 7 per cent while the smallest cost; the cost of water,
contributes less than 1 per cent to the operational cost.
5.3 Capital investment
Invested monetary values of vessel, engine, fishing gears and communication and navigation
equipment are here assumed to be the total capital investment of the deep sea vessels. The
average investment for each vessel group is shown in Table 8 below.

Hewamanage
UNU – Fisheries Training Programme
25
Table 8: Capital investment of deep sea vessels (Rs).
N Mean Std. Deviation Std. Error
95% Confidence Interval for Mean
Lower Bound Upper Bound
28-34 25 3,774,640 1761084 352217 3047700 4501580
35-39 25 4,454,320 1836446 367289 3696272 5212368
40-44 31 5,704,903 1519232 272862 5147644 6262162
>44 8 7,734,500 1540915 544796 6446263 9022737
Total 89 4,993,843 2026640 214823 4566926 5420759
There was a statistically significant difference at the p<.05 level for the 4 groups [F (3, 28.71)
= 14.48, p= .00]. Post-hoc comparisons using the Games- Howell test indicated that the average
capital investment of vessels 40-44 and >44 ft significantly varies from that of any other size
vessels from all groups. The average value of capital investment for group 28-34 ft did not vary
significantly from group 35-39 ft. The reason for this is the capital investment was assumed to
be increased with the increase in size of the vessel.
5.3.1 Composition of capital investment of deep sea vessels (Rs)
The largest proportion of total investment goes to the vessels followed by the engine and gears
while the lowest investment in all vessel groups is for the equipment (Figure 10).
Figure 10: Capital investment of deep sea vessels (Rs).

Hewamanage
UNU – Fisheries Training Programme
26
5.4 Capital cost
The average yearly capital costs of vessel groups are shown in Table 9 below.
Table 9: Annual capital cost of deep sea vessels (Rs).
N Mean Std. Deviation Std. Error
95% Confidence Interval for Mean
Lower Bound Upper Bound
28-34 25 454,537 209342 41868 368124 540949
35-39 25 470,743 193399 38680 390912 550575
40-44 31 598,372 112118 20137 557247 639498
>44 8 765,245 109095 38571 674039 856450
Total 89 537,118 191382 20286 496803 577433
There was a statistically significant difference at the p<.05 level for the 4 groups [F (3, 29.38)
= 12.98, p= .00]. Post-hoc comparisons using the Games- Howell test indicated that the annual
average capital cost of 40-44 and >44 ft vessels significantly varies from that of any other size
vessels from all groups. The average value for group 28-34 ft did not vary significantly from
group 35-39. The reason for this differs is that if the capital investment is high the capital cost
is also being higher.
5.4.1 Composition of capital cost of deep sea vessels (Rs)
A larger proportion of capital cost goes to vessels and gear among all groups of vessels whiles
a very small proportion to equipment. The capital cost of engine shows more or less similar
percentages in all groups (Figure 11).
Figure 11: Capital cost of deep sea vessels (Rs).

Hewamanage
UNU – Fisheries Training Programme
27
5.5 Gross profit
Gross profit of the operation is governed by operational income and operational cost of deep
sea operations. The average yearly gross profit of the vessel groups is shown in Table 10 below.
Table 10: Annual gross operational profit of deep sea vessels (Rs).
N Mean Std. Deviation Std. Error
95% Confidence Interval for Mean
Lower Bound Upper Bound
28-34 25 2,397,407 1829698 365940 1642145 3152669
35-39 25 2,860,434 2495663 499133 1830275 3890593
40-44 31 2,299,363 2083661 374237 1535069 3063656
>44 8 1,350,220 1026713 362998 491866 2208573
Total 89 2,399,191 2083173 220816 1960366 2838016
There was not a statistically significant difference at the p<.05 level for the 4 groups [F (3,
35.47) = 2.40, p= .08]. The yearly average gross profit indicates that all 4 groups earned a
positive gross profit indicating that their fishing operations were profitable. This is in
accordance with Amarasinghe´s results (2001). The highest gross profit was earned by the 35-
39 ft vessels group while the lowest by the >44 ft group. The reason for the lowest gross profit
of > 44 group is the lower corresponding catches of this vessel category.
5.5.1 Net profit
Net profit of the vessel is totally governed by gross profit and capital cost of the vessel. The
average yearly net profit of vessel groups is shown in Table 11 below.
Table 11: Annual net profit of deep sea vessels (Rs).
N Mean Std. Deviation Std. Error
95% Confidence Interval for Mean
Lower Bound Upper Bound
28-34 25 1,942,870 1789224 357845 1204314 2681426
35-39 25 2,389,691 2486511 497302 1363309 3416072
40-44 31 1,700,990 2060379 370055 945237 2456743
>44 8 584,975 1067375 377374 -307373 1477323
Total 89 1,862,073 2082182 220711 1423457 2300690
There was a statistically significant difference at the p<.05 level for the 4 groups [F (3, 34.69)
= 3.44, p= .02]. Post-hoc comparisons using the Games- Howell test indicated that the annual
average net profit of vessels 35-39 ft was significantly varies from that of vessels size > 44 ft.
As the capital cost of vessels gets higher the gross profit becomes lower. It was found, as could
be expected, that the highest capital cost belongs to > 44 ft vessel group while the lowest for
28-34 ft. It is clear to assume that capital cost increase with the size of the vessel.

Hewamanage
UNU – Fisheries Training Programme
28
5.5.2 Return on capital investment (ROcI in Percent)
The average yearly return on the capital investment of the deep sea fisheries is shown in Table
12.
Table 12: Periodic return to capital investment of deep sea vessels (%).
N Mean Std. Deviation Std. Error
95% Confidence Interval for Mean
Lower Bound Upper Bound
28-34 25 51 44 9 33 69
35-39 25 66 81 16 32 99
40-44 31 29 36 7 16 43
>44 8 9 14 5 -3 21
Total 89 44 56 6 32 56
There was a statistically significant difference at the p<.05 level for the 4 groups [F (3, 41.66)
= 8.29, p= .00]. Post-hoc comparisons using the Games-Howell test indicated that periodic
average return on capital investment vessels > 44 significantly varies from that of groups 28-
34 and 35-39 but did not vary significantly from group 40-44. The average value of vessels 28-
34 did not vary significantly from groups 35-39 and 40-44. Vessels 40-44 did not vary from
that of any other size vessels from all groups.
Return on the capital investment is totally governed by the net profit and the amount of capital
invested in fixed assets. It has to be mentioned, that the ratio used as such does only show the
return for the period, which the net profit is calculated. The highest return on the capital
investment was realised by the 35-39 ft group followed by the groups 28-34 and 40-44 ft while
the lowest for >44 ft group. This was due to difference in net profit earned and different amount
of invested capital by each group. The highest average capital investment was by far found by
the > 44 ft group followed by 40-44, 35-39 and 28-34 ft groups.
5.6 Problems in deep sea fisheries
The captains were asked to offer their perceptions on the barriers they are facing in the deep
sea fisheries. They were able to give more than one answer. The answers were then categorised
into the five themes and the category of “no idea” as is shown in Table 13 below.

Hewamanage
UNU – Fisheries Training Programme
29
Table 13: Problems in deep sea fishing.
Frequency Percent Valid Percent
Cumulative
Percent
Lack of harbour services 11 12.4 12.4 12.4
Fluctuation of fish price at
the market 18 20.2 20.2 32.6
Poaching of foreign vessels
on EEZ in Sri Lanka 23 25.8 25.8 58.4
High operational cost 10 11.2 11.2 69.7
Getting arrested by other
countries 6 6.7 6.7 76.4
No idea 21 23.6 23.6 100.0
Total 89 100.0 100.0
The highest problem with captains (26%) was foreign fishing vessels, poaching in Sri Lankan
EEZ. They claimed that their fishing nets were damaged and physical damages had occurred
to their vessels as well. In many occasions in the past fishermen and fishermen´ organizations
have staged protests against the authorities to compel them to take measures to prevent
poaching of foreign vessels. Thordarson (2008) in his study on the value chain of yellow fin
tuna in Sri Lanka found that foreign fishing vessels by their operations were seen threatening
the profitability of deep sea fishing companies in Sri Lanka.
Nearly 21% of captains found that fluctuation of selling prices of fish at the landing centres as
a problem in deep sea fisheries. The lack of competition at the markets, due to the small number
of buyers, was found to be the main reason for this price fluctuation. They claimed that export
oriented tuna prices were distorted by export agents hiding important market information. This
supports the importance, in accordance with the Icelandic benchmarking, of the necessary role
of the active fish markets and the necessity for easy access to market information.
Nearly 13% of the vessel captains claimed that they had problem with poor harbour services.
Lack of fresh water, ice and fuel were major issue for them. Inadequate harbour services may
have delayed the start of fishing operations. It can be helpful to see how the Icelandic fish
markets and harbours activities are designed so as to minimize these issues.
Nearly 12% of the captains had problem with the country’s rising material input prices. They
claimed that increased fuel prices at the market had had major effect on the increase of the
operational cost of fishing.
Nearly 7% of the captains also feared crossing country boarders and getting arrested by other
neighbouring countries. Sri Lankan vessels and fishermen were arrested and detained by other
countries claiming that they were crossing EEZ boarders illegally and later released, most of
the time without legal actions. Captains claimed that in many occasions they were taken even
though they were in Sri Lankan EEZ. Kumara (2001) studied the detention of fishermen in
custody of other countries and found that several social problems had created to their families

Hewamanage
UNU – Fisheries Training Programme
30
in absence of husbands. The captains stated that the lack of modern technological equipment
and knowledge caused their unwanted crossing of borders.
6 ANALYSIS OF THE BENCHMARKING INTERVIEWS
For many years senior managers in business companies all over the world have used
benchmarking intensively as quality management tool. Although a universally accepted
definition cannot be found the essence of benchmarking might be summarised as
“benchmarking is the process by which organizations learn, modelled on human learning
process” (Watson 1993). It shows the need of understanding of the organization business
process and governing process enablers for the improvement of the performance. The
interviews conducted revealed that many significant changes have taken place in the Icelandic
fishing companies and their marketing process over the years. Collected information was
summarised as follows in line with identified changes.
6.1 Fish processing companies
6.1.1 Importance of quality aspects of the products
Four fish processing company managers mentioned that the attribute of quality and maintaining
quality standards of products is of critically importance to the companies. They experienced
that quality attributes of the products is highly connected with market demand and price of the
product. Further they emphasised that the maintenance of quality should be started immediately
after the harvesting of fish. Proper handling, cooling and icing as well as storing are needed to
maintain quality of fish aboard the vessel. For storing fish all the companies used tubs, which
are produced with insulation for maintaining of quality. All the companies have their own
vessels operating in deep sea fisheries and adequate quotas. The vessel captain and his assistant
are responsible for the handling of fish aboard the boat until they unload them at the harbour.
They have to follow all necessary steps and the company guidelines, which were recommended
for maintaining quality of fish at the sea. All vessels are equipped with necessary equipment
and materials for maintaining quality of fish. Apart from the above measures in maintaining
quality of products all companies have taken measures to reduce the duration of the fishing trip
to maximum of five days.
In 4 factories quality control processes have been improved by deploying well trained quality
control teams under the supervision of a quality control manager. Overall, the companies’
attitudes have shifted towards enhancing quality of products instead of quantity.
6.1.2 Importance of continuous product supply to buyers
Four fish processing companies visited have realized that continuous supply of raw materials
to their factories as well as processed products to buyers are very important for the growth of
the company and its market share in the industry. Existing quota management system enables
them to have quota since many years, which benefitted them in acquiring enough raw materials
for their production process. If the company does not have enough own quota it can be get
quota on rental basis from others. Some companies have successfully been practicing the
culture of fish in the supporting of continuous supply of raw materials to the production
process. All companies categorically accepted that the quota system always assures continuous
supply of raw material for the production process resulted in stabilizing the market supply.
Hewamanage
UNU – Fisheries Training Programme
31
6.1.3 Importance of vertical integration
A very important distinguishing feature of all the fish processing companies was the status of
collaboration with marketing companies to sale their production. In these four cases the
processing companies did not undertake direct marketing of products to buyers and consumers.
These marketing activities were done through marketing companies. In some cases the
Icelandic fishing companies are taking care of their marketing activities themselves through
vertical integration. In all those four cases the producers were vertically integrated in
processing and harvesting giving the opportunity to control the flow of the raw material
according to the marketing demands’.
All the fish processing companies had a good link with the fish markets, and for marketing
information, always use modern electronic communication equipment and direct meetings.
They emphasised that acquiring of real time marketing information is very important and that
can even better be achieved through vertical integration. Due to high degree of vertical
integration in Icelandic fish industry managers in the industry maintains that they can better
manage the marketing effort, quickly react to the markets signals and thus better fulfil the
customer’s requirement (Knútsson, et.al. 2009) Furthermore Knútsson et al. (2009) claim that
the Icelandic fish industry has gone through development were it is becoming marketing
driving, using information from the markets to control the flow of raw material through fishing
and production. For achieving this, vessels have shortened their fishing trips putting more
emphasis on bringing in raw material of higher quality.
6.1.4 Importance of targeting export market and price
The fish processing companies had targeted specific export markets for their products while
not focusing the local market. Local market supply of all companies was less than 1 percent of
their annual production. Export markets could be characterized as fresh, frozen and salted but
presently more emphasise was given to fresh fish which fetched a higher price at the consumer
markets, especially in Europe. Export market prices of Icelandic fish products have been
increasing since last decade partly due to increase in quality attributes of the products and the
companies´ better understanding of their consumer requirements.
6.1.5 Importance of competitive position compared to other countries
All the processing companies are profitable. They are competing with rivals who produce
similar fish products in other countries. Some interviewees mentioned that they had succeeded
in making commitments with new buyers who were earlier dealing with Norwegian producers.
All companies had achieved their position in the industry through the quality of their products
and by vertically integrating the marketing function thus continuously being able to supply
buyers with their products.
Hewamanage
UNU – Fisheries Training Programme
32
6.2 Fish markets
6.2.1 Fish auction company
According to the executive of the computer service company that handles the all the online
marketing of fish in Iceland almost half of the Icelandic fish production is sold through the
auction markets annually. The Reiknistofa Fiskmarkaða hf (RSF) is the computer service
company that handles the Icelandic fish auction connecting with 168 auctions located in 30
places in to one network. It conducts daily auction where the 200-300 buyers connect online
remotely. The company collects payments from buyers and disburses to sellers and other
relevant authorities. The RSF does not handle fish itself but specialises in fish auctioning. The
company presently takes one percent commission from sales revenue for the maintaining its
services and covering up of its expenses. Buyers need to have a bank guarantee or pay in
advance to buy fish through the online auction. The buyer is given a registered number and
using it buyer can log on to the system to buy fish remotely. Auction- clock is used to show the
details of fish and handle of the auction. The company is the only company in Iceland handling
the fish auctioning system and the company management is optimistic with reliability and
accuracy of the ongoing auctioning system.
6.2.2 The Fish market in Ísafjörður
The Ísafjörður fish market operates 6 days of the week except Sunday. This fish market is
linked into the Icelandic fish auctioning system. Auctioning of fish is handled by the Icelandic
fish auctioning company (RSF) and payment for the services provided by the fish market is
disbursed. All fish sold at the market should be graded and iced by vessel captains but if buyers
request market officials take the responsibility to add more ice on the fish. Market officials
often check the fish graded by the vessel captains to verify the accuracy of the information.
The market manager interviewed explained that some complaints have been received in the
past regarding a mismatch of the grading of fish in the fish boxes. The market officials are
responsible for the distributing of fish to buyers but do not take responsibility for checking or
maintaining the quality of the fish. At the same time they take full measures in carefully
handling the fish at the market premises. The market manager assured the interviewer that the
existing online fish marketing system is quite accurate as well as a convenience to buyers since
they can, even from their home, participate in the auction. Because of the online fish marketing
system the operational cost of fish markets has been reduced dramatically due to the low
requirement of staff.
6.3 The Sri Lankan relevance
The benchmarking interviews at the Icelandic fisheries companies pointed out, clearly, that a
lack of collaboration between actors in the value chain can be harmful for the profitability of
the industry in Iceland. This implies that a collaboration of the state, vessel owners and other
stakeholders is necessary for improvement of the profitability of deep sea fishing operations.
For this to happen in Sri Lanka either a vertical integration of companies is needed, privately
owned or owned by the state, or a closer collaboration of the harvesting companies with export
agents and the marketing entities become a reality.
Through their vertically integrated value chain structure, some of the Icelandic companies were
able to market their own products directly to buyers and thus make a better profit. This can be
applied to the Sri Lankan deep sea fisheries by promoting more vertical integration of

Hewamanage
UNU – Fisheries Training Programme
33
companies, combining deep sea fish harvesting, processing and even the marketing functions
within a company. This will probably lead to the improvement of the quality of products and
the possibility of maintaining continuous supply to the market. For the yellow fin tuna industry,
which presently mostly targets sashimi in Japan, this can be extremely important in its
development. This will, through better quality products assure the constant supply to the export
markets and bring a higher unit price at the markets.
The benchmarking interviews at the Icelandic companies clearly showed that a constant supply
to markets is very important for the profitability and the maintaining the market segment of the
company. The interviewees pointed clearly out that getting real time marketing information is
very important for the control of the right quality of raw materials and products. This implies
that a real time marketing information system is also necessary for an efficient operation of the
value chain. In Sri Lanka this can be acquired through establishing a central body, possibly
under state supervision, coordinating fish markets operations and enabling the necessary
dissemination of market information to relevant parties.
The importance of product quality for the companies was also a major factor for the
effectiveness of the Icelandic fishing companies. This implies that both onboard fish handling
immediately after the harvesting and quality control in the processing of the catch has a critical
impact on the quality of raw materials and processed products and therefore the unit price at
the market. The practicing of quality standards for onboard fish handling and the processing is
thus necessary for the improvement of both catch and product quality. In order to realize major
quality improvements in the Sri Lankan deep sea fishing industry quality awareness or training
programs, educating both crew members on onboard fish handling and fish production workers
and managers on hygiene, quality and quality standards in fish processing.
7 CONCLUSION AND RECCOMENDATIONS
The introduction of deep sea vessels into Sri Lankan fisheries in the late 1980s has lead to an
increase in catch from about 8,000 t in 1989 to about 109,000 t in 2008. The MDOVs in
operation vary in lengths, degree of sophisticated equipment and in fishing efficiencies.
Bimodal pattern of monsoons, the North east and the South west has given rise to three different
areas of fishing operations. The number of fishing trips of a year has inverse relationship with
the size of the vessels. The Tsunami on the 26th of December 2004 destroyed 195 vessels and
damaged 402 vessels thereby making a setback to the development of the deep sea fisheries.
According to the findings of this study all vessels groups operating in the deep sea fisheries
have earned net profits indicating that the fishing operations are profitable. The 35 to 39 ft
vessel group followed by the 28 to 34 ft group earned the highest net profit. The lowest net
profit was earned by the > 44 ft vessel group. The 35 to 39 ft vessels group is the most profitable
group and also the smallest group made up of 28 to 34 ft also seems to be very compatible.
This indicates that the smaller vessels are more economical for the deep sea fisheries in Sri
Lanka. In terms of periodic (yearly) return on the capital investment, the highest, 66%, was
earned by the 35-39 ft vessel group followed by 28 to 34 ft and 40 to 44 ft groups earning 51
and 29% respectively. The lowest, 9%, was earned by the > 44 ft vessels group.
The study shows that revenues are highest for the group size 35-39 feet and lowest for the
biggest vessel or over 44 feet. No clear explanation can be found to this but the vessel over 44
feet gets the highest price for the Tuna of all the groups which could indicate that they are
targeting the export markets or bring in higher quality of Tuna. In contrast to this finding the

Hewamanage
UNU – Fisheries Training Programme
34
vessels over 44 feet has the fewest hooks on the lines and seam, according to Table 3, to depend
more on gillnet. The total catch of the vessels over 44 feet is only around 54% of the total catch
of the smallest vessel group and only 46% of the vessels group 35-39 feet.
The composition of the operational costs differs slightly between the vessel groups. Still, the
main cost item was labour, it contributed about 39 to 45% followed by fuel contributing about
37 to 41% to the total cost. Food cost contributes about 12 to 13% while ice is about 6 to 7%
to the operational cost of vessel. The lowest cost was for water that contributed only about 1%
to the operational costs of all vessel groups. The study results show that the total cost is highest
for the group size 35-39 feet and surprisingly lowest for the biggest vessel or the group over
44 feet. The group sizes 28-34 and 40-44 are similar in cost.
Results of the study have revealed that the highest proportion of capital investment is for the
hull followed by engine, gear and equipment in sequence in all groups. About 55 to 64% of
total capital investment for the different vessel groups was for the hull followed by 19 to 24%
for the engine, 14 to 19% for gear and 3 to 6%, for equipment respectively. Not surprisingly
the biggest vessel was the most capital intensive group and then the capital intensity decreases
in accordance the shorter size of the vessel groups.
According to the captains the critical factors of operations are many and some of them, in their
opinion, are out of their control. As an example, because of incomplete information and lack
of harbour services the market price is lower than necessary. The captains also complained
about the low and fluctuating price on the fish markets. Further research is needed to study the
reasons for this, whether that comes from the lack of transparency of the pricing of fish on the
markets or the lack of quality or instability of the quality of the fish.
Other critical factors in the operation of the deep sea fleet in Sri Lanka are the poor results that
vessel over 44 feet show in this study. The questionnaire survey on the four vessel groups found
that revenues, costs, profits and return on capital investment for the group of > 44 ft seems to
be relatively uneconomical compared to the smaller vessel groups. It is not clear whether this
is due to a small sample size of the survey. It is therefore recommended that a special study
should be conducted on the economic feasibility of larger vessels for the deep sea fisheries in
Sri Lanka.
The benchmarking with Icelandic fish industry unveiled that importance of quality and steady
supply of raw material in right quality is important. The Icelandic fish industry has gone
through development were it is marketing driving using information from the markets to
control flow of raw material through fishing and production. In archiving this vessels have
shorten their fishing trips putting more emphasis on bringing in raw material in higher quality.
Fish markets plays big role in this were information about price and bidding is open and
electronically accessible. Part of this development is also high vertical integration between
harvesting and production sector in the Icelandic industry giving the managers better
opportunity to synchronise the flow of raw material to processing and markets. It is
recommended here the Sri Lankan fish markets could learn from the Icelandic benchmarking
by increasing it transparency of pricing supporting better understanding of connection between
price and quality.
This study indicates that the profitability of the deep sea fisheries operations in Sri Lanka can
be further increased if collaboration and cooperation between all necessary stakeholders can
be developed. According to the benchmarking with the Icelandic executives it is recommended

Hewamanage
UNU – Fisheries Training Programme
35
that the possibility of introducing more vertical integration of companies in the deep sea
fisheries value chain should be explored. This could be valuable for the development of the
deep sea fisheries in Sri Lanka.
In this study only one form of a company fishing strategy, individual fishing, was studied. It
is concluded and recommended here that a study on the possibilities of a collective fishing
strategy should be conducted comparing it with the benefits of the individual fishing strategy.
From this, recommendations of changes in the operation strategy of the deep sea fleet of Sri
Lanka could be suggested. The critical factors of the deep sea fisheries of Sri Lanka should be
studied more fully as it is important to further conduct a study on the quality of the catch to get
a holistic view on the operation and the efficiency of the deep sea fleet.
This study has fulfilled all its objectives and, even if the quality of the data used has not been
as solid as the author had hoped, the survey results and the interview answers have given
interesting indications of the economic efficiency of the vessels used in the deep sea fishing
industry in Sri Lanka. It is hoped that the conclusions can be used as a management tool for
the improvement of these fisheries.

Hewamanage
UNU – Fisheries Training Programme
36
ACKNOWLEDGEMENTS
I would like to thank the United Nation University for giving me a fellowship to participate
(UNU-FTP) fisheries training programme in Iceland. If not for the invitation of attending this
program from Dr.Tumi Tómasson, director of the UNU-FTP programme, I would not have had
the opportunity to finish this thesis and therefore, my heartiest thank goes to him.
My sincere gratitude especially goes to Mr. Þór Ásgeirsson, Deputy Director of the programme
and Mrs. Sigríður Kr. Ingvarsdóttir, the Programme Officer, for their invaluable support and
encouragement they provided me to complete this programme successfully. I would like to
extend my thanks the Director of marine research institute (MRI), Iceland and his staff for their
warm welcome and assistance. My sincere thank to my two supervisors, Professor, Ögmundur
Knútsson and Mr. Helgi Gestsson for their excellent and invaluable guidance given to me.
I like to thank Mr. Gunnar Thordarson and his wife for their fullest support and encouragement
given to me. Also I thank Mr. Bjarni Eiriksson for his kind supports during my stay in Akureyri.
I extend my sincere gratitude to all the company managers and representatives who accepted
to be interviewed by me and provided me with valuable information during my benchmarking
interviews in Iceland. My sincere thank goes to the staff of University of Akureyri, Iceland, for
their warm welcome and assistance.
I would like to extend my gratitude the Chairman and Director General of National Aquatic
Resources Research and Development Agency (NARA), Sri Lanka, for nominating me for this
training programme. I would also like to extend my thanks the staff of the Socio-economic and
Marketing Research Division of NARA for their excellent assistance in field data collection.
Finally, I should remember my wife Tharanga Ekenayaka and daughter Asalisa Kariyawasam.

Hewamanage
UNU – Fisheries Training Programme
37
LIST OF REFERENCES
Amaralal, L. (2004). Market structure and key success factors in fish marketing and
distribution in Sri Lanka. Unpublished M.Sc. dissertation, University of Tromso, Norway.
Amarasinghe, O. (2001). Economic and social implications of multi-day fishing in Sri Lanka.
“In proceedings of coastal communities and Indian Ocean future”. Indian institute of
technology, Chennai, India.
Bhimani, C.A., Srikant, M. T., Foster, G. (2008). Management and Cost Accounting. 4th ed.
Prentice Hall.
CIA n.d. The World Factbook – Sri Lanka. [February 22, 2010]
https://www.cia.gov/library/publications/the-world-factbook/geos/ce.html
Gulbrandsen, O. (1998). Marine fisheries development – Tuna Long liners. Food and
Agriculture Organization, Field Document SRL/91/022. Bangkok.
IOTC. Indian Ocean Tuna Commission (2009). Report of the eleventh session of the IOTC
working party on Tropical Tunas. Kenya.
Kumara, H. (2001). Issues related to deep-sea fishermen and their families due to detention in
foreign countries. “In proceedings of coastal communities and Indian Ocean future”. Indian
institute of technology, Chennai, India.
Knútsson, Ö., Klemenson, Ó. and Gestsson, H. (2009). Changes in strategic positioning in
the Icelandic fish industry´s value chain Ingjaldur Hannibalsson (eds.): Rannsóknir í
félagsvísindum X (Researches in the Social Sciences X). Reykjavík: Institute of Social
Sciences.
Lane, D.E. (1988). Investment decision making by fishermen. Canadian Journal of Fisheries
and Aquatic Sciences 45: 782-796.
Maldeniya, R. and Amarasooriya, D. (1998). Tuna fisheries in Sri Lanka. Indian Ocean Tuna
Commission ( IOTC) Proceedings 1 : 21-25.
Maldeniya, R. and Suraweera. (1991). Exploratory fishing for large pelagic species in Sri
Lanka. Bay of Bengal Programme (BOBP), S.L. BOBP Technical Paper 47. Colombo, Sri
lanka.
Ministry of Fisheries and Aquatic Resources (MFAR). (2007). Census of fishing boats 2006/2007
Sri Lanka, Colombo, Sri Lanka: MFAR.
National Aquatic Resources Research and Development Agency (NARA). (2008). Sri Lanka
Fisheries Yearbook 2007. Crow Island, Colombo, Sri Lanka: NARA.
Pajot, G. (1993). Small Fishing Boats in Sri Lanka. Bay of Bengal Program (BOBP), Technical
Paper 61. Madras, India.
Richardson, S.A., Sloan, R.G., Soliman, M.T., Tuna, I. (2005). Accrual reliability, earnings
persistence, and stock prices. Journal of Accounting and Economics 39:437–485.

Hewamanage
UNU – Fisheries Training Programme
38
Thompson, A.A., Strickland, A.J. and Gamble, J.E. (2010). Crafting and Executing Strategy.
15th ed. New York: McGraw-Hill/Irwin.
Thordarson, G. (2008). Value chain of yellow- fin tuna in Sri Lanka. Unpublished M.Sc.
dissertation, University of Bifrost, Iceland.
Watson, H. (1993). Strategic Benchmarking. USA: John Wiley and Sons, Inc.
Willmann, R. (2001). International instruments for managing fisheries in the Indian Ocean. “In
proceedings of coastal communities and Indian Ocean future”. Indian institute of technology,
Chennai, India.

Hewamanage
UNU – Fisheries Training Programme
39
Appendix 1

Hewamanage
UNU – Fisheries Training Programme
40
57ft 58ft 59ft 60ft 62ft

Hewamanage
UNU – Fisheries Training Programme
41
Appendix 2
A Benchmarking study on Icelandic multi day boat fisheries
(Questions to be used in the interviews of company managers)
1. Can you tell me a bit about your company history and operations today?
2. Can you tell me about yourself and your position in the company?
3. Can you tell me your views on importance of quality of catch/products of your
company?
i What measures did you implement to maintain the quality of your products?
Ii How do you continue those measures regularly?
Iii What measures do you use to identify quality standards?
Iv What types of attributes do you use to standardise quality of your products?
V What is the relationship between price and quality?
Vi Is this relationship always true?
Vii How do you maintain this relationship with your products?
Viii Does your company have competitive advantage in the market through this
relationship?
4. Can you explain what the key cost factors of your operations are and how you manage
them?
I what is the trend of operational costs of your company in fast few years?
Ii What are the main operational cost factors and what percentages they represent
in the total operational cost?
Iii What measures do you follow to maintain the present trend?
5. Can you explain the way you manage your/rental fish quotas and scheduling of
fishing?
6. Can you tell me how do you use marketing information in selling and distributing of
your products?
I what kind of marketing systems do you use to market your products?
Ii How do you communicate with buyers and sellers?
Iii How do you get marketing information on quality and price?
iV How do you maintain your market segment?
V What are your value chain components?
Vi What is the contribution each support to the value addition to the product?
Vii Which kind of management integration your company practice in the market?
7. What do you consider as key success factors of your company and how did you
achieve them?
I Quality of catch
Ii Access and management of quotas
Iii Skilled employees, skippers and mates
Iv Employees, skippers and mates turn over from the company
V employees, skippers and mates contribution to the management decisions

Hewamanage
UNU – Fisheries Training Programme
42
Appendix 3
A Benchmarking study of Icelandic multi day fish markets
(Questions to be used in the interviews of market managers)
1. Can you tell me a bit about your company/market history and operations today?
2. Can you tell me about yourself and your position in the company/market?
3. Can you tell me your views on importance of quality of catch/products of your
company/market?
i What measures did you implement to maintain the quality of your products at
the market?
Ii How do you continue those measures regularly at the market?
Iii What measures do you use to identify quality standards?
Iv What types of attributes do you use to standardise quality of your products at
the market?
V What is the relationship between price and quality at the market?
Vi Is this relationship always true?
Vii How do you maintain this relationship with your products at the market?
Viii Does your company/market have competitive advantage in the market through
this relationship?
4. Can you explain what the key cost factors of your operations are and how you manage
them?
I what is the trend of operational costs of your company in fast few years?
Ii What are the main operational cost factors and what percentages they represent
in the total operational cost?
Iii What measures do you follow to maintain the present trend?
5. Can you explain the way you manage your market segment / quotas and services after
selling?
6. Can you tell me how do you use marketing information and new technology in selling
and distributing of your products?
I what kind of marketing systems do you use to market your products?
Ii How do you communicate with buyers and sellers?
Iii How do you get marketing information on quality and price?
iV How do you maintain your market segment?
V What are your value chain components?
Vi What is the contribution each support to the value addition to the product?
Vii Which kind of management integration your company practice in the market?
Viii How do you get your supplies regularly?
7. What do you consider as key success factors of your company/market and how did
you achieve them?
I Quality of catch
Ii Access and management of marketing information
Iii Skilled employees
Iv Employees turn over from the company/market
V employees’ contribution to the management decision 1