
Econ102SQ3Spring2007
8
UCLA ECONOMICS 102 E. McDEVITT SQ set #3: SOLOW GROWTH MODEL 1. What is a steady state? What is investment in a steady state? What is the intuition behind this equation? Assume the following initial values: K t = 500 , L t =100, δ = 8%, and n = 2%. The capital-to-worker ratio is k = 500/100 = 5. What would happen to the capital-to-labor ratio if actual investment was 20? How much investment is required to maintain the capital-to-labor ratio at 5? Verify by calculating the levels of K & L and the ratio k. 2. Convert the following production function into the per-worker production function: Y = AK 0.1 L 0.9 . Find k gold . Show steps. Assume that the population growth rate is 5%, the depreciation r ate is 5%, and that A = 100. Show outco me on a graph. 3. True or false? The higher the steady-state capital-lab or ratio (k) is, the more consumption each worker can enjoy in the long run. Explain. 4. What equation do we use to determine the steady state level of k? How do you interpret each side of the equation? Explain why k increases when its initial level is below the st eady state level. ...when its initial level is above the steady state level. Write out t he equation that gives us the change in k. Show these cases on graphs. Label each curve. Suppose an economy initially in a steady-state experience s an event (such as a war) that moves k below the steady-state level. What is the impact of this event on y? What is the impact on MPK (relate this to the graph)?...impact on MPL? 5. a. Using the information from question (2) find the steady state level of k when the savings rate is 5%. Show all steps. b. What is output per worker and consumption per worker in this steady state? c. What savings rate is required to bring about k gold ? 6. Using the short-cut formula, indicate how a change in A, s, or n affects the steady-state value of k in the Solow growth model. Shows these results on graphs and also show the impact on steady state y and c. 7. Assume s = 10%, δ = 3%, n = 2%, Y t = A*K t 1/3 L t 2/3 and A is constant at 1. a. Find k steady-sstate , y steady-state and c steady-state using the “short cut” formulas. b. Suppose the initial value of k was k 0 = 9. What is required investment per worker at this initial value? In what sense, do we mean “required investment”? What is actual investment per worker at this initial value? What is k in the next period? 8. Suppose the curre nt savings rate is below the saving s rate that brings about k gold . Does it follow that policies designed to increase the savings rate are desirable? Explain. 9. Comment on the following statement: “The Solow growth model implies that output per worker and consumption per worker will converge across countries.” 9.b. Assume two different countries have identical values for A, s, n, α, and δ, but that k is initially lower for one of these countries (Call it Z). Using the equat ion ∆k = sAk α – (δ+n)k show that Z will have a higher growth rate for k in the current period.
Transcript of Econ102SQ3Spring2007

8/3/2019 Econ102SQ3Spring2007
http://slidepdf.com/reader/full/econ102sq3spring2007 1/8
UCLAECONOMICS 102
E. McDEVITT
SQ set #3: SOLOW GROWTH MODEL
1. What is a steady state? What is investment in a steady state? What is the intuition behindthis equation?
Assume the following initial values: Kt= 500 , Lt =100, δ = 8%, and n = 2%. Thecapital-to-worker ratio is k = 500/100 = 5. What would happen to the capital-to-labor
ratio if actual investment was 20? How much investment is required to maintain the
capital-to-labor ratio at 5? Verify by calculating the levels of K & L and the ratio k.2. Convert the following production function into the per-worker production function: Y =
AK0.1L0.9. Find k gold. Show steps. Assume that the population growth rate is 5%, the
depreciation rate is 5%, and that A = 100. Show outcome on a graph.
3. True or false? The higher the steady-state capital-labor ratio (k) is, the more consumptioneach worker can enjoy in the long run. Explain.
4. What equation do we use to determine the steady state level of k? How do you interpreteach side of the equation? Explain why k increases when its initial level is below the steadystate level. ...when its initial level is above the steady state level. Write out the equation that
gives us the change in k. Show these cases on graphs. Label each curve. Suppose an
economy initially in a steady-state experiences an event (such as a war) that moves k belowthe steady-state level. What is the impact of this event on y? What is the impact on MPK
(relate this to the graph)?...impact on MPL?
5. a. Using the information from question (2) find the steady state level of k when the
savings rate is 5%. Show all steps.b. What is output per worker and consumption per worker in this steady state?
c. What savings rate is required to bring about k gold?
6. Using the short-cut formula, indicate how a change in A, s, or n affects the steady-statevalue of k in the Solow growth model. Shows these results on graphs and also show the
impact on steady state y and c.
7. Assume s = 10%, δ = 3%, n = 2%, Yt = A*Kt1/3
Lt2/3
and A is constant at 1.a. Find k steady-sstate , ysteady-state and csteady-state using the “short cut” formulas.
b. Suppose the initial value of k was k 0 = 9. What is required investment per worker at this
initial value? In what sense, do we mean “required investment”? What is actual investment
per worker at this initial value? What is k in the next period?8. Suppose the current savings rate is below the savings rate that brings about k gold. Does it
follow that policies designed to increase the savings rate are desirable? Explain.
9. Comment on the following statement: “The Solow growth model implies that output perworker and consumption per worker will converge across countries.”
9.b. Assume two different countries have identical values for A, s, n, α, and δ, but that k is
initially lower for one of these countries (Call it Z). Using the equation ∆k = sAk α –
(δ+n)k show that Z will have a higher growth rate for k in the current period.
8/3/2019 Econ102SQ3Spring2007
http://slidepdf.com/reader/full/econ102sq3spring2007 2/8
10. The Kaldor facts are that the following are almost constant over long periods of time.
1. Y/K ratio.2. Capital and labor share (α and 1-α).
3. Return to capital (MPK).
4. Growth of output per worker (the percentage change in Y/L)
5. Growth in capital per worker (the percentage change in K/L).Show that a model with labor-augmenting technological change can account for these
facts.
ANSWERS1. a. A steady state is a situation in which the economy's output per worker (y),
consumption per worker (c), and capital stock per worker (k) are constant.
b. It = (n+δ)Kt where n is the population growth rate (we assume that the population and
work force grow at the same rate) and δ is the depreciation rate for capital and It isinvestment in a steady state.
c. To keep capital per worker constant over time investment must increase enough to notonly replace worn-out capital (δKt) but must increase to keep pace with population growth(nKt).
d. Depreciation is 500(0.08)= 40, and so with any investment the level of capital at the end
of the period would be 500-40= 460. With actual investment at 20, this would mean K t+1 =480. The labor force at the end of the period is 100(1.02) = 102. Therefore, k falls to
480/102 = 4.71.
e. Required It = (n+δ)Kt = (0.10)(500) = 50. Kt+1 = 460+50 = 510 and k = 510/102= 5.
2. a. Divide both sides by L to get y = Ak 0.1
, where y = Y/L and k = K/L.To find k gold we use MPK = n+δ. To find MPK, differentiate the per-worker production
function with respect to k:
MPK = dy/dk = 0/k 0.9
. Set this equal to n+δ and solve for k. 10/k 0.9
= .10 k gold
= 166.8.
8/3/2019 Econ102SQ3Spring2007
http://slidepdf.com/reader/full/econ102sq3spring2007 3/8
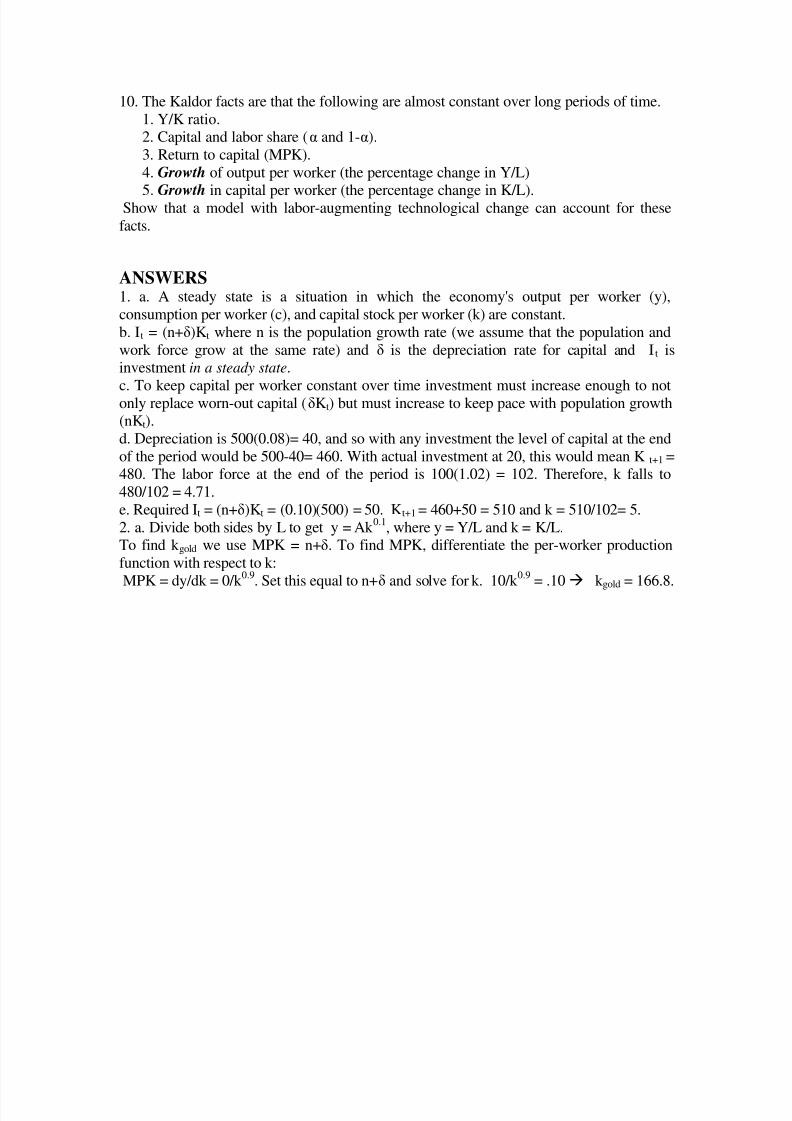
This can be seen as follows:
y (output per worker)
i = (δ
+ n)k
y = Atk α
k (capital per worker)c
cmax
k
k gold
= 166.8
3. It depends. Holding productivity constant, an increase in k will initially increase c, but
beyond some point (namely, k gold) increasing k will cause a decrease in c. This followsfrom the fact that the MPK falls as k increases (diminishing marginal returns). So
increasing k increases output per worker at a slower and slower rate (holding productivity
constant), whereas a higher k means a greater amount of output per worker must be
devoted to investment, thus leaving less for consumption. See graph from question (2).4. a. We use sA f (k) = (n+δ)k to find the steady state value of k.
b.The left-hand side tells us actual investment per worker and the right-hand side gives usrequired investment per worker. If k is below its steady state value, thenc. sA f (k) > (n+δ)k which means that actual investment per worker exceeds required
investment per worker. This economy is building enough new machines per worker to not
only replace out worn out machines and keep pace population growth but is adding to thenumber of machines per worker.
d. If k is above its steady state value, then sA f (k) < (n+δ)k which means that actual
investment per worker is less than required investment per worker. This economy is notbuilding enough new machines per worker to replace out worn out machines and keep pace
population growth, and therefore its machines per worker will fall.

8/3/2019 Econ102SQ3Spring2007
http://slidepdf.com/reader/full/econ102sq3spring2007 4/8
e. ∆k = sA f (k) - (δ+ n)k.
f.y,i
this curve tells us the i required to maintain k at some given level
(δ + n)k t
y=A f (k) this is the per-worker production functioni1
required
i1actual sA f (k) this curve tells us actual investment per worker
i0
actual
i0required
k 0 k steady-s k 1 k At k 0, the actual amount of investment per worker exceeds the amount of investment per
worker required to maintain the capital per worker ratio at k 0. Therefore k grows. At k 1,the actual amount of investment per worker is less than the amount.g. As can be from the above graph in part (f), if k is reduced to k 0, then y will fall as we
slide down the per-worker production function. Since we are further down on the per-
worker production function, hence the slope is steeper, MPK rises. This can also be seen byMPK = αA(Lt /Kt)
1-α a fall in k (= Kt /Lt) is the same as an increase in (Lt /Kt) and so
MPK increases. On the other hand, MPL =(1-α)A(Kt /Lt)α = (1-α)Ak α , and from this it can
be seen that as k falls so does MPL.
5. a. sA f (k) = (n+δ)k 0.05*100k 0.1 = .10k and solve for k. ksteady-state = 77.2.
b. y = 100*(77.2)0.1
= 154.4. c = y-i = 154.4 -(.10*77.2)= 146.7.
c. Since k gold
= 166.8, we can set it up as s*100(166.8)0.1
= .10*166.8 and solve for s. s =0.10.
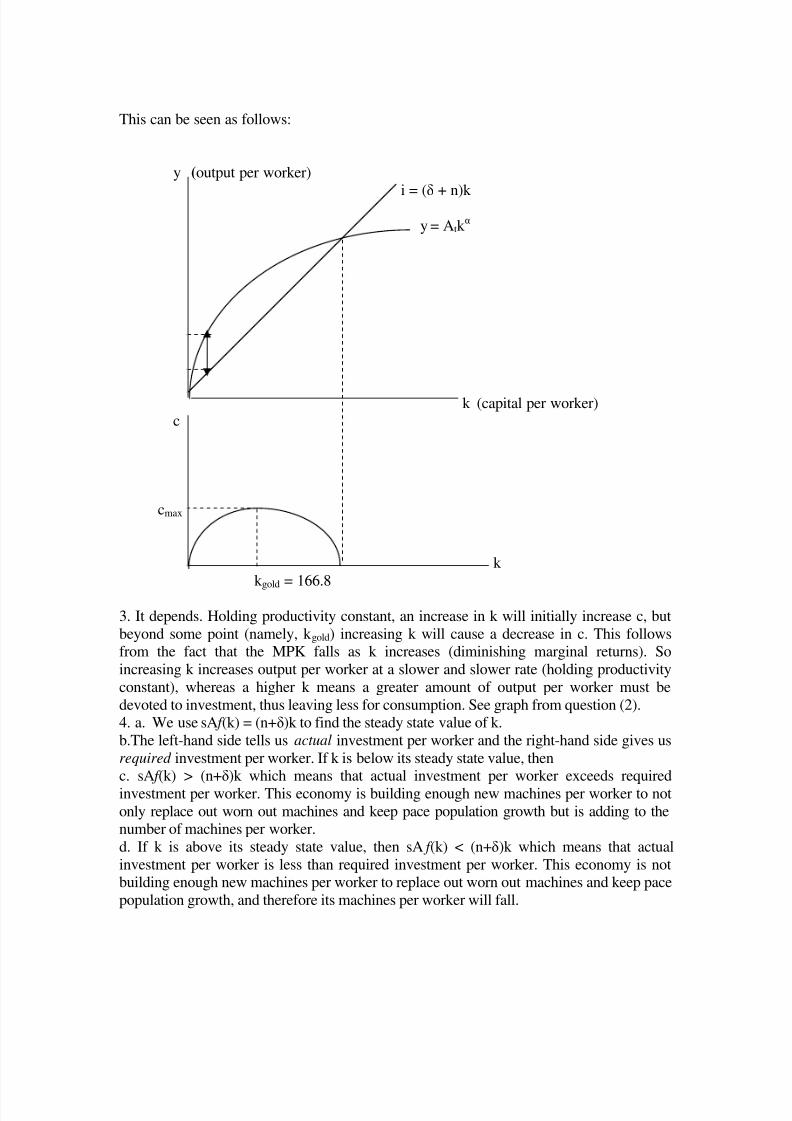
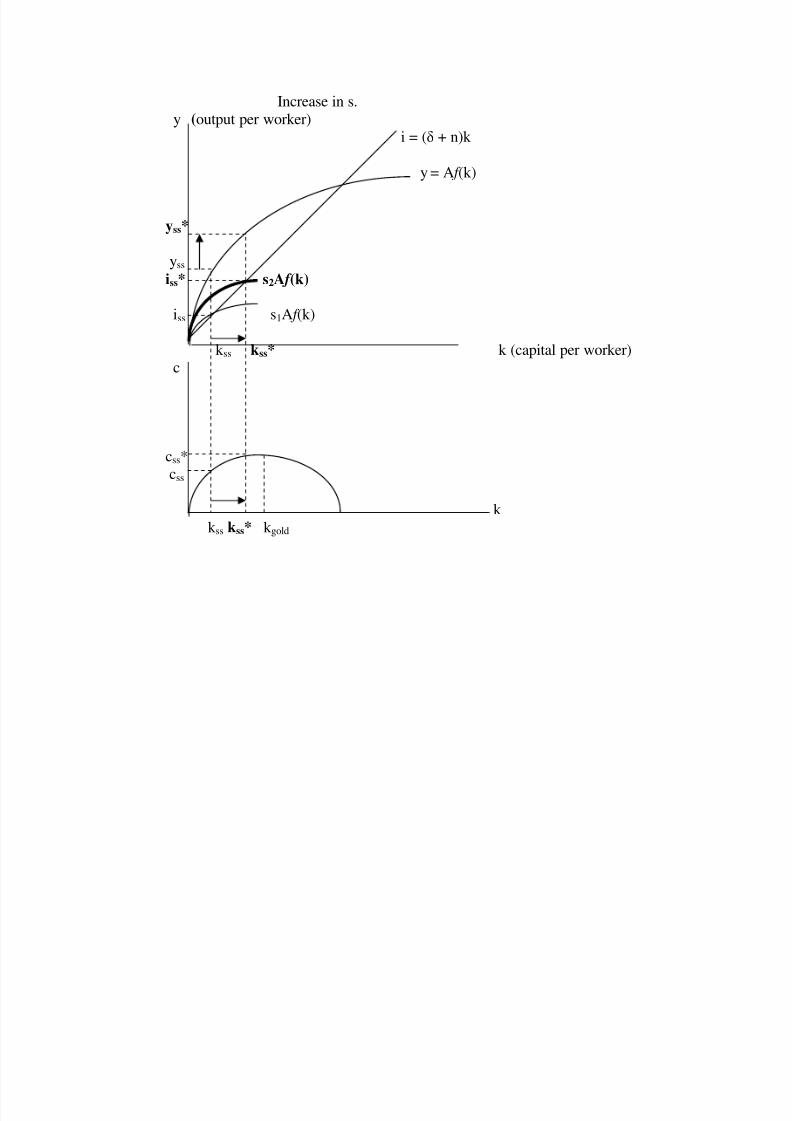
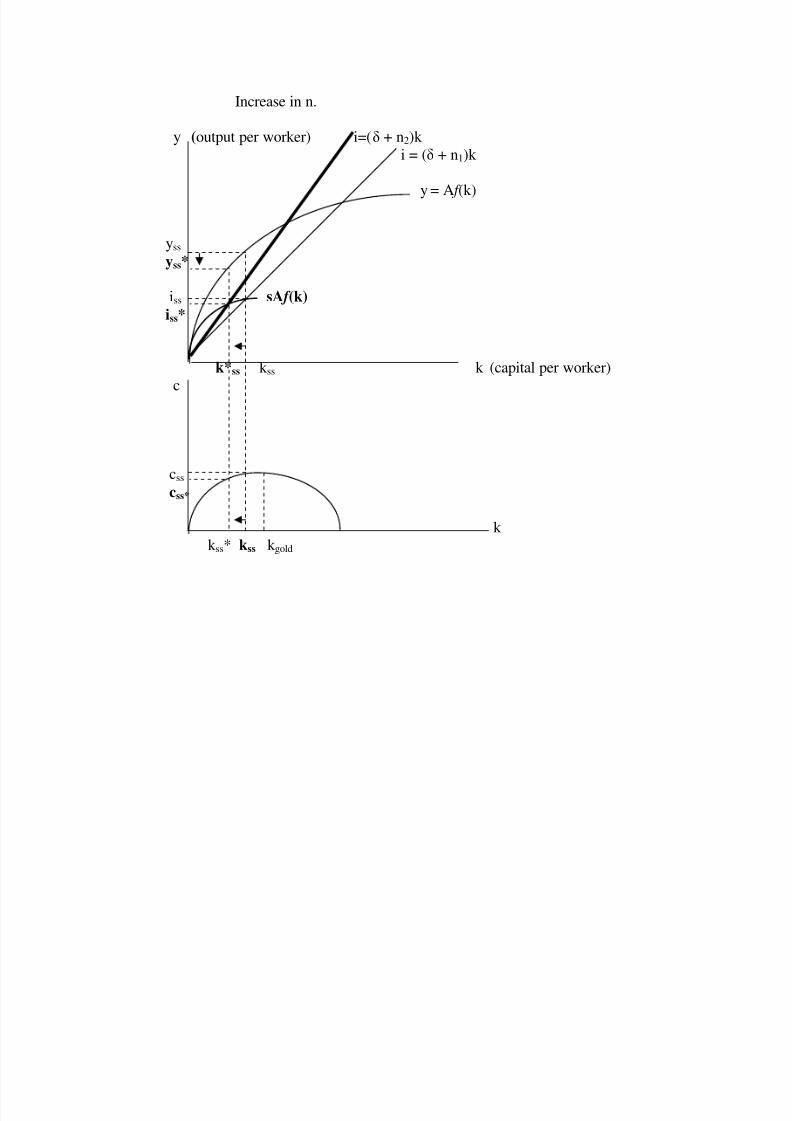
6. k steady-sstate = [(sA)/(δ+n)]1/1-α . It can be seen from this equation that an increase in A
or s will lead to an increase in steady-state k. An increase in n will lower it.
8/3/2019 Econ102SQ3Spring2007
http://slidepdf.com/reader/full/econ102sq3spring2007 5/8
Increase in s.
y (output per worker) i = (δ + n)k
y = A f (k)
yss*
yss
iss* s2A f (k)
iss s1A f (k)
k ss kss* k (capital per worker)c
css*css
k
k ss kss* k gold
8/3/2019 Econ102SQ3Spring2007
http://slidepdf.com/reader/full/econ102sq3spring2007 6/8
Increase in n.
y (output per worker) i=(δ + n2)k
i = (δ + n1)k
y = A f (k)
yss
yss*
iss sA f (k)
iss*
k*ss k ss k (capital per worker)
c
css
css*
k k ss* kss k gold

8/3/2019 Econ102SQ3Spring2007
http://slidepdf.com/reader/full/econ102sq3spring2007 7/8
An increase in total factor productivity.
y (output per worker) i = (δ + n)k
y = A2 f (k)y = A1 f (k)
yss*
yss
iss* sA2 f (k)
iss sA1 f (k)
k ss kss* k (capital per worker)c
css*
css
k
k ss kss* k 1g k
2gold
8/3/2019 Econ102SQ3Spring2007
http://slidepdf.com/reader/full/econ102sq3spring2007 8/8
7a. k steady-sstate = [(sA)/(δ+n)]1/1-α k steady-state = [(0.10)(1)/(0.05)]
3/2= [2]
1.5= 2.83
(approx).Steady-state y = A1/1-α[(s)/(δ+n)]α /1-α = [(0.10)/(0.05)]0.5 = 1.42. and
c = 1.42 – (0.05)(2.83) = 1.28.
7b. Required investment per worker = (δ + n)k = (0.05)(9) = 0.45. Required in the sense
that this is amount of investment per worker necessary to maintain k at its initial value of nine. Actual investment per worker = sA f (k) = (0.10)(1)k 1/3
= (0.10)(9)1/3
= 0.21.
∆k = sA f (k) - (δ+ n)k = 0.21- 0.45 = -0.24. So k next period will be 9 – 0.24 = 8.76.8. No. Although a higher savings rate raises c in the long run, an increase in the saving rate
initially causes c to fall (at the initial level of output more saving means less
consumption S = Y –C, for a given Y in the short run higher S means lower C.). Hencethere is a tradeoff, higher future consumption but at the expense of lower current
consumption. Society may or may not be willing to make this tradeoff.
9a. The Solow growth model implies that countries with the same technology, savings rate,
depreciation rate, and population growth rate will converge—i.e. the same set of curvesbut different starting points. If countries have different technologies or savings rates, for
example, then they will have different steady-state values.9b. We need to divide both sides of ∆k = sAk α – (δ+n)k by k to put it into growth terms.
(∆k/k) = sAk α-1 – (δ+n) or (∆k/k) = [(sA)/(k 1-α )] - (δ+n) It is clear from this equation
that
if k z < k other country then Z will have a higher growth rate (notice that k is in thedenominator, so if k falls this ratio rises). A rough intuition of this is that country Z is
further down on its per-worker production where the slope—i.e.,the MPK—is higher.
Hence, country Z will have high-yielding investment projects compared to the other
country.10. The model is now Yt = Kt
α(EtLt)1-α This model is basically the same as the one we
have been using, except that in a steady state: k = K/(E*L) is constant where E*L is
referred to as the total number of effective workers. Technological growth shows up asincreases in E. Assume Et+1 = (1+g)Et. Then:
Effective workers grow at the rate of g+n (since by assumption E grows at a rate g and
L grows at a rate of n).In a steady state (i.e., k is constant), K grows at rate (g+n) since k = K/E*L.
Since y = Y/E*L is constant in steady-state, Y also grows at rate g+n. If we divide y/k
= (Y/E*L)/(K/E*L) = Y/K. Since both y and k are constant in a steady state it follows
that Y/K is constant. In other words, since Y and K both grow at rate g+n, the ratio Y/Kis constant in a steady state.
The growth of (Y/L) = growth of Y – growth L = (n+g) – n = g. And the growth of (K/L) = (g+n) – n = g.MPL = ∂Y/ ∂L = (1-α)E1-α KαL-α = (1-α)E*E-α Kα L-α = (1-α)E*(K/E*L)α
The term “ (K/E*L)α ” is constant in a steady state, but E grows at rate g, therefore MPL
grows at rate g in steady state. Another way to see this is as follows. Recall that MPL =
αAPL = α(Y/L). In a steady state this ratio grows at rate g and so MPL grows at rate g.
MPK = ∂Y/ ∂K = αKα-1(E*L)
1-α = α [K/E*L]α-1
. Since the term “[K/E*L]” is constant
in a steady state, MPK is constant. Recall that MPK = (1-α)APK = (1-α)(Y/K). In a steady state this ratio is constant and
therefore MPK is constant.


