Ecology Population...You Must Know How biotic and abiotic factors affect the distribution of biomes....
44
Population Ecology Presented by: Czaresse, Gem, Kazzandra, Kendall, Lauryn, and Melissa
Transcript of Ecology Population...You Must Know How biotic and abiotic factors affect the distribution of biomes....
Population Ecology
Presented by: Czaresse, Gem, Kazzandra, Kendall, Lauryn, and Melissa
You Must Know➢ How biotic and abiotic factors affect the distribution of biomes.➢ How density,dispersion, and demographics can describe a population.➢ The differences between exponential and logistic models of population growth➢ How to apply mathematical models to predict changes in population growth
rates or size➢ How density-dependent and density-independent factors can control
population growth➢ Interactions between populations affect the distributions and abundance of
populations ➢ How a change in matter or energy will affect the population or community➢ The effect of age distributions and fecundity on human populations as
presented in age- structure Pyramids

40.1 Earth's ClimateHow does the earth’s climate influences the
distribution of terrestrial biomes?✢ 4 Physical Factors: Temperature, Precipitation,
Sunlight, and Wind
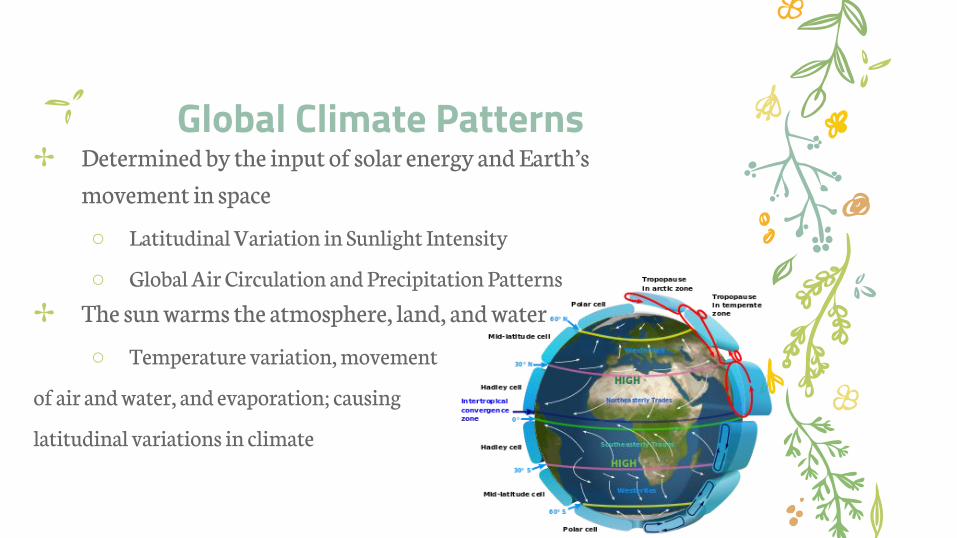
Global Climate Patterns✢ Determined by the input of solar energy and Earth’s
movement in space
○ Latitudinal Variation in Sunlight Intensity
○ Global Air Circulation and Precipitation Patterns
✢ The sun warms the atmosphere, land, and water
○ Temperature variation, movement
of air and water, and evaporation; causing
latitudinal variations in climate
Regional Effects on the Climate Climate varies seasonally and can be modified by...
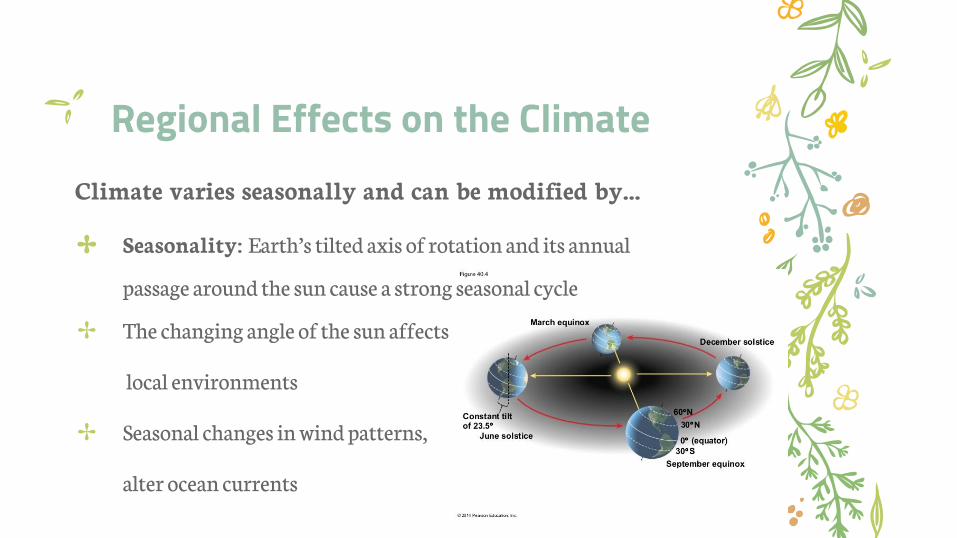
✢ Seasonality: Earth’s tilted axis of rotation and its annual
passage around the sun cause a strong seasonal cycle
✢ The changing angle of the sun affects
local environments
✢ Seasonal changes in wind patterns,
alter ocean currents
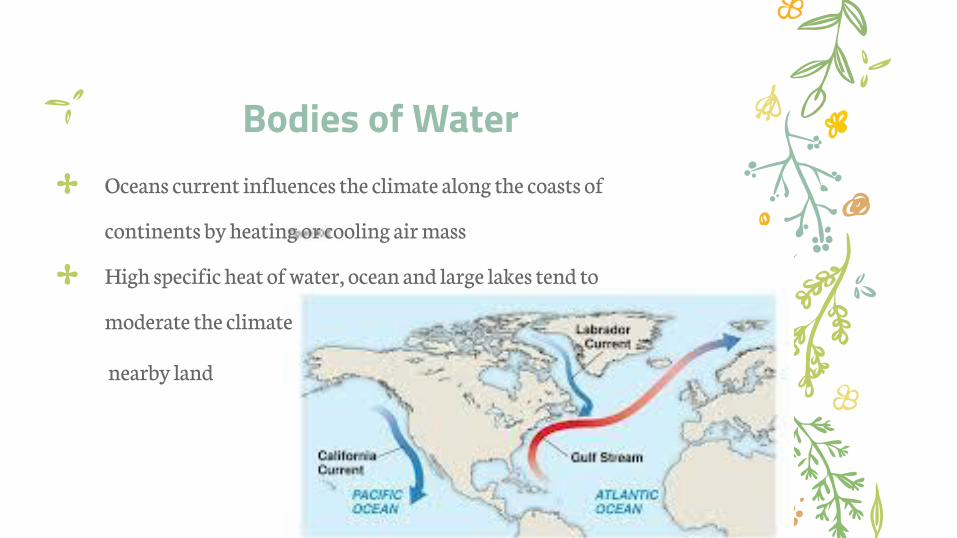
Bodies of Water ✢ Oceans current influences the climate along the coasts of
continents by heating or cooling air mass
✢ High specific heat of water, ocean and large lakes tend to
moderate the climate
nearby land
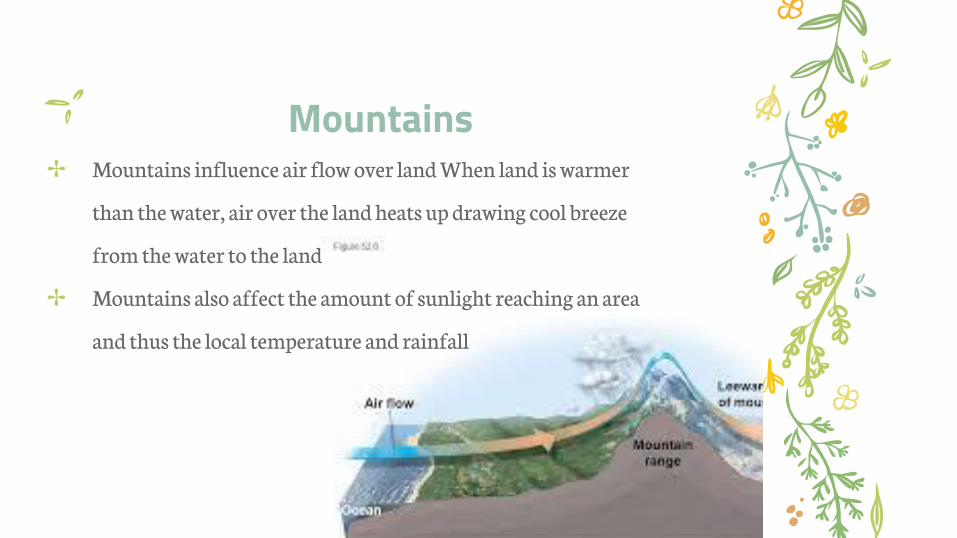
Mountains ✢ Mountains influence air flow over land When land is warmer
than the water, air over the land heats up drawing cool breeze
from the water to the land
✢ Mountains also affect the amount of sunlight reaching an area
and thus the local temperature and rainfall
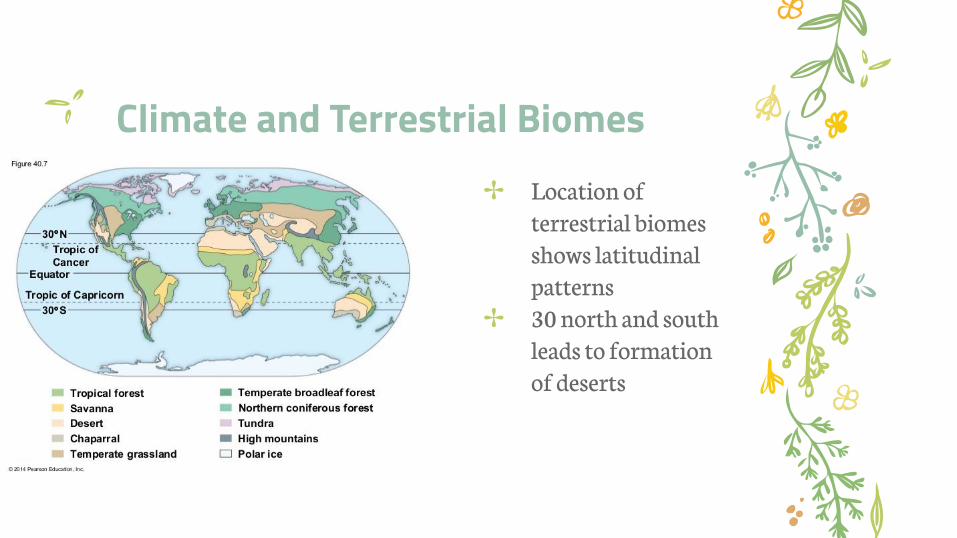
Climate and Terrestrial Biomes ✢ Location of
terrestrial biomes shows latitudinal patterns
✢ 30 north and south leads to formation of deserts
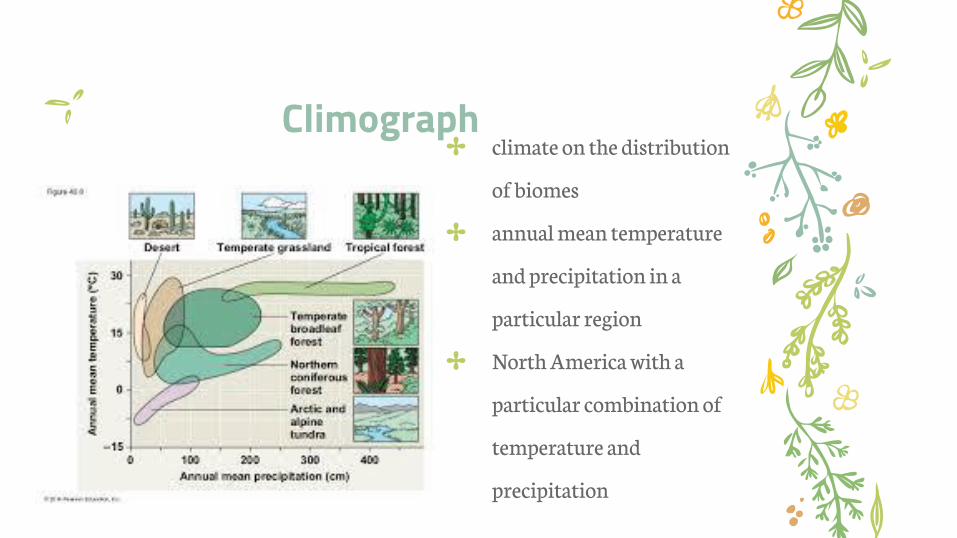
Climograph✢ climate on the distribution
of biomes
✢ annual mean temperature
and precipitation in a
particular region
✢ North America with a
particular combination of
temperature and
precipitation
Terrestrial Biomes✢ Terrestrial biomes are names for major physical or climatic
features, and their predominant vegetation
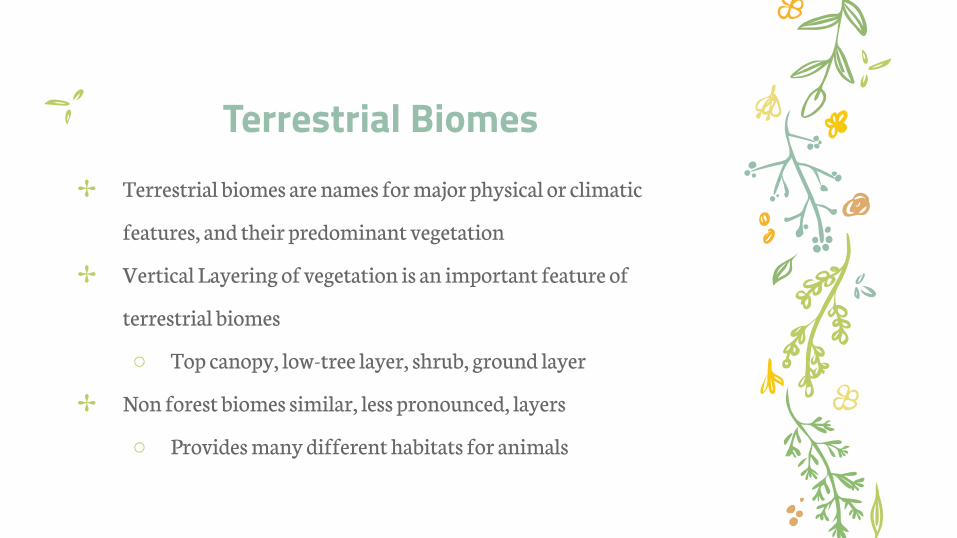
✢ Vertical Layering of vegetation is an important feature of
terrestrial biomes
○ Top canopy, low-tree layer, shrub, ground layer
✢ Non forest biomes similar, less pronounced, layers
○ Provides many different habitats for animals
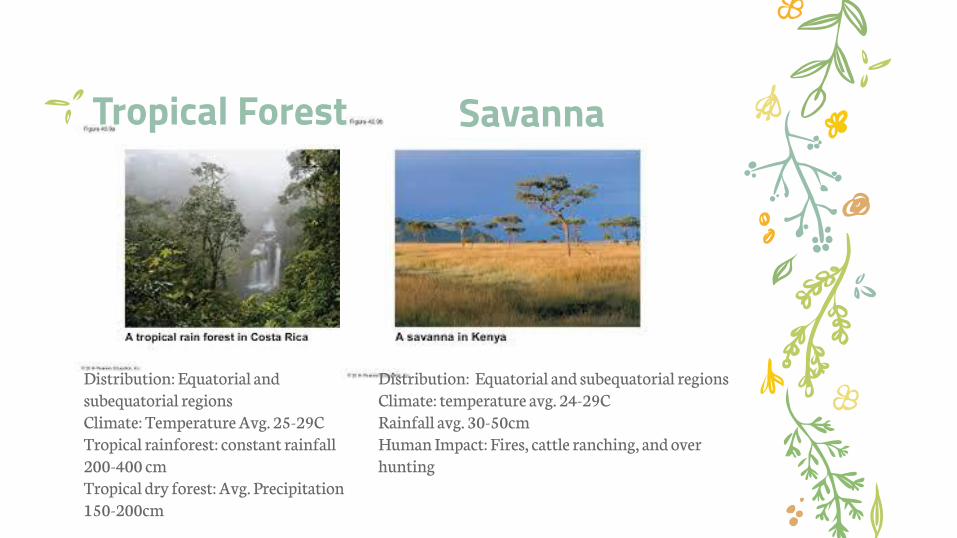
Savanna
Distribution: Equatorial and subequatorial regionsClimate: Temperature Avg. 25-29C Tropical rainforest: constant rainfall 200-400 cmTropical dry forest: Avg. Precipitation 150-200cm
Distribution: Equatorial and subequatorial regionsClimate: temperature avg. 24-29CRainfall avg. 30-50cmHuman Impact: Fires, cattle ranching, and over hunting
Tropical Forest
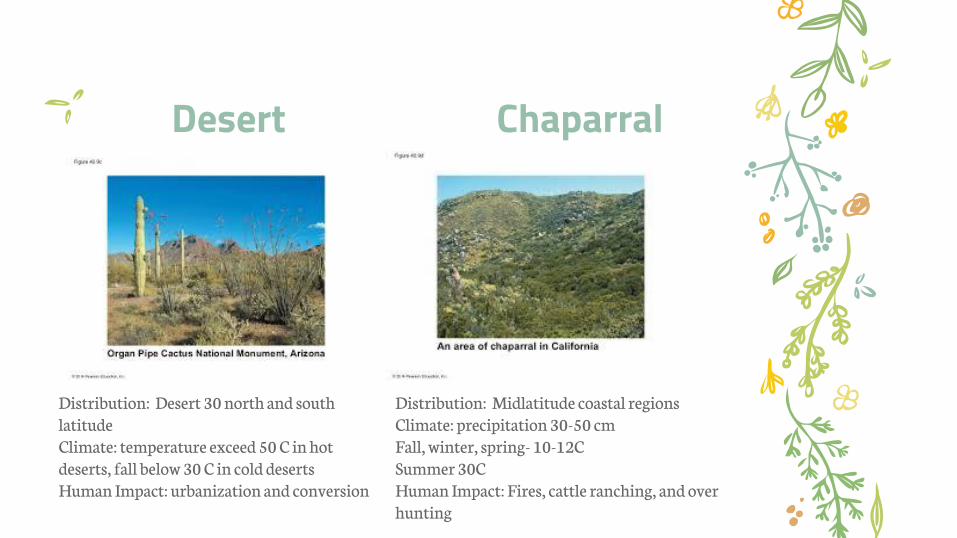
Desert Chaparral
Distribution: Desert 30 north and south latitudeClimate: temperature exceed 50 C in hot deserts, fall below 30 C in cold desertsHuman Impact: urbanization and conversion
Distribution: Midlatitude coastal regions Climate: precipitation 30-50 cmFall, winter, spring- 10-12CSummer 30CHuman Impact: Fires, cattle ranching, and over hunting
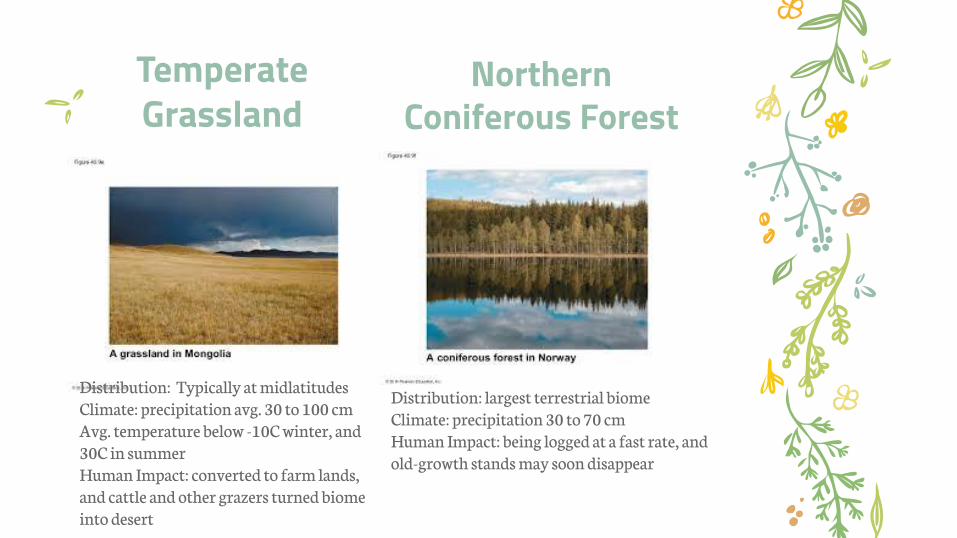
Temperate Grassland
Northern Coniferous Forest
Distribution: Typically at midlatitudesClimate: precipitation avg. 30 to 100 cmAvg. temperature below -10C winter, and 30C in summer Human Impact: converted to farm lands, and cattle and other grazers turned biome into desert
Distribution: largest terrestrial biomeClimate: precipitation 30 to 70 cmHuman Impact: being logged at a fast rate, and old-growth stands may soon disappear
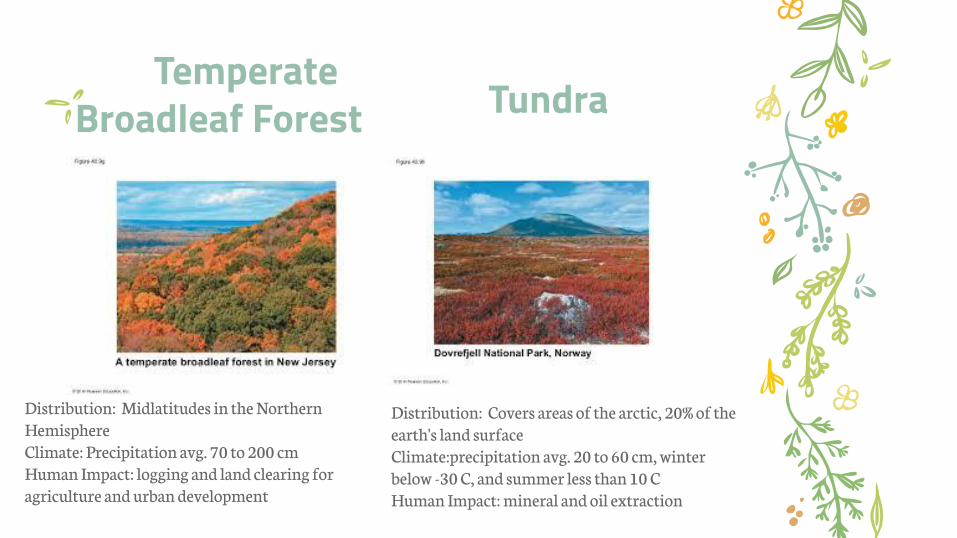
Temperate Broadleaf Forest Tundra
Distribution: Midlatitudes in the Northern HemisphereClimate: Precipitation avg. 70 to 200 cmHuman Impact: logging and land clearing for agriculture and urban development
Distribution: Covers areas of the arctic, 20% of the earth's land surface Climate:precipitation avg. 20 to 60 cm, winter below -30 C, and summer less than 10 CHuman Impact: mineral and oil extraction
40.2 Aquatic Biomes
Aquatic biomes are primarily characterized by their
physical and chemical environment.
✢ Marine Biomes: Salt concentration average 3%
✢ Freshwater: Salt Concentration <0.1%
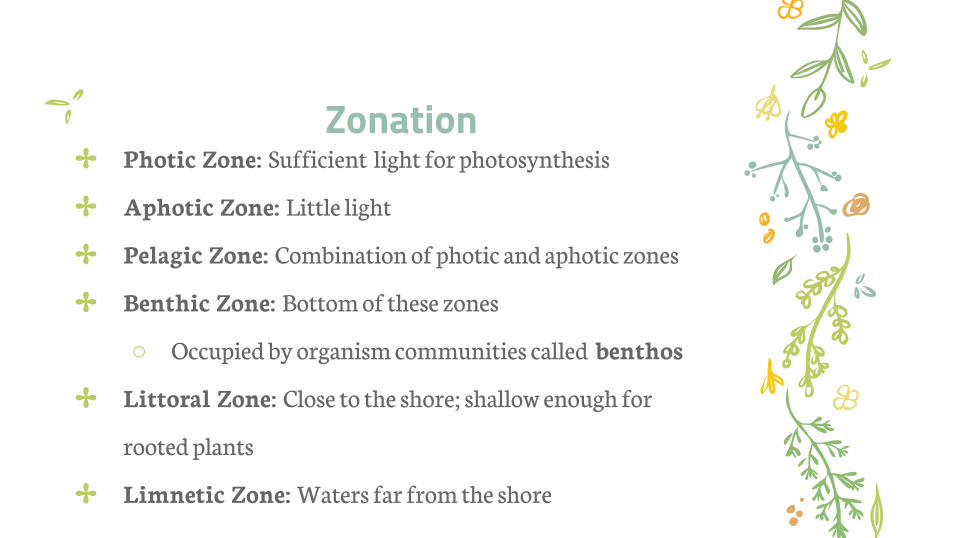
✢ Photic Zone: Sufficient light for photosynthesis
✢ Aphotic Zone: Little light
✢ Pelagic Zone: Combination of photic and aphotic zones
✢ Benthic Zone: Bottom of these zones
○ Occupied by organism communities called benthos
✢ Littoral Zone: Close to the shore; shallow enough for
rooted plants
✢ Limnetic Zone: Waters far from the shore
Zonation
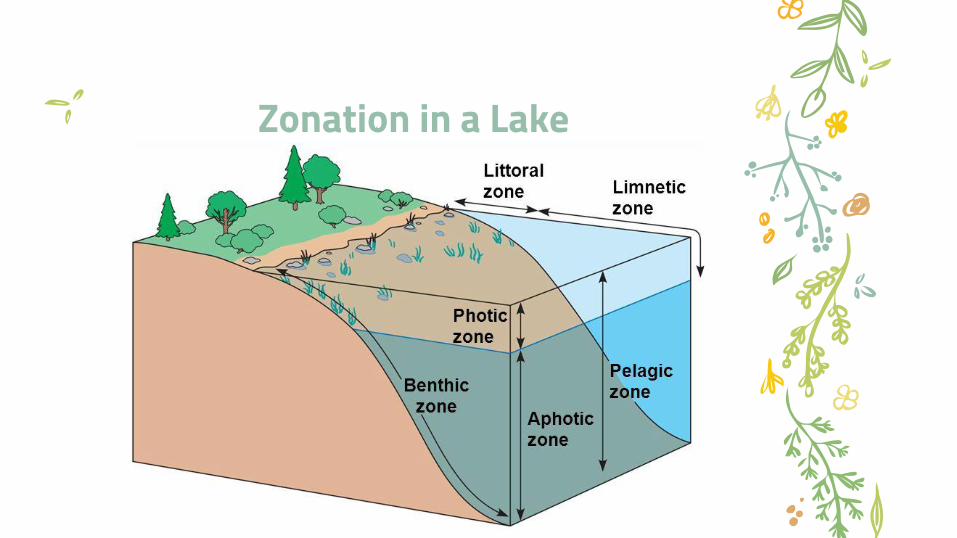
Zonation in a Lake
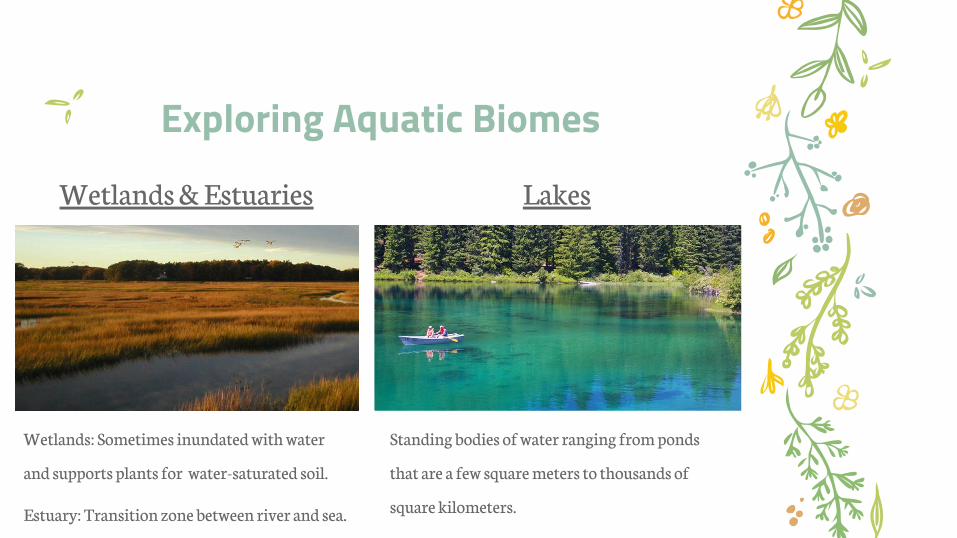
Exploring Aquatic Biomes
Wetlands & Estuaries Lakes
Wetlands: Sometimes inundated with water
and supports plants for water-saturated soil.
Estuary: Transition zone between river and sea.
Standing bodies of water ranging from ponds
that are a few square meters to thousands of
square kilometers.
Exploring Aquatic Biomes (cont’d)
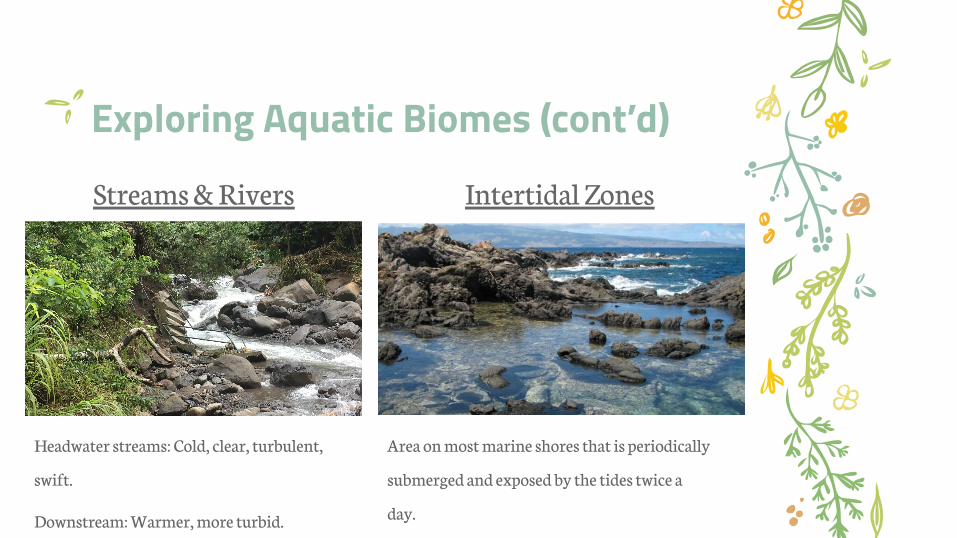
Streams & Rivers Intertidal Zones
Headwater streams: Cold, clear, turbulent,
swift.
Downstream: Warmer, more turbid.
Area on most marine shores that is periodically
submerged and exposed by the tides twice a
day.
Exploring Aquatic Biomes (cont’d)
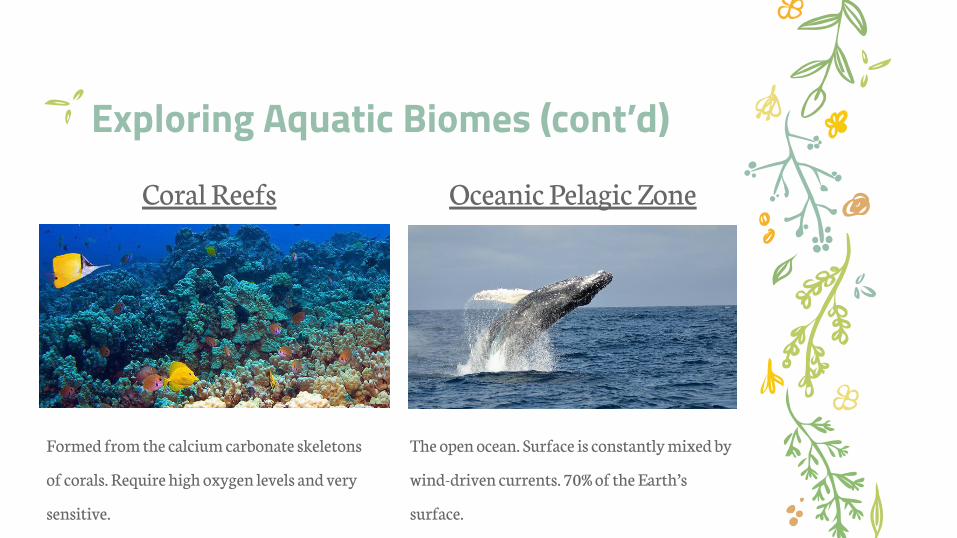
Coral Reefs Oceanic Pelagic Zone
Formed from the calcium carbonate skeletons
of corals. Require high oxygen levels and very
sensitive.
The open ocean. Surface is constantly mixed by
wind-driven currents. 70% of the Earth’s
surface.
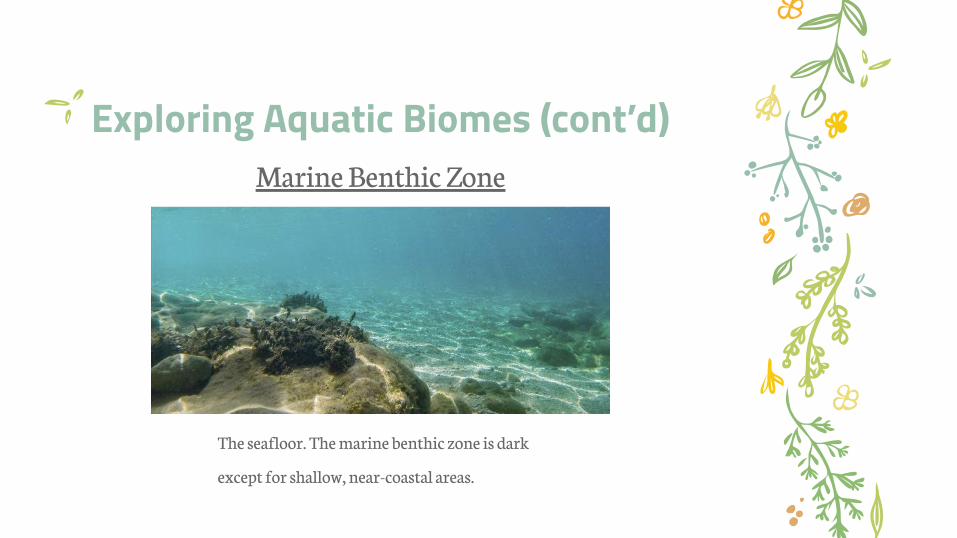
Exploring Aquatic Biomes (cont’d)Marine Benthic Zone
The seafloor. The marine benthic zone is dark
except for shallow, near-coastal areas.
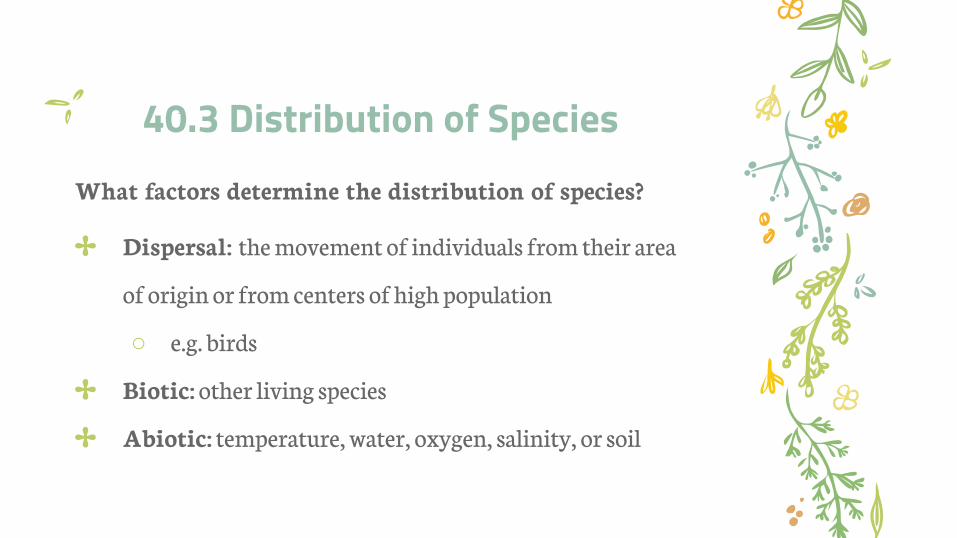
40.3 Distribution of SpeciesWhat factors determine the distribution of species?
✢ Dispersal: the movement of individuals from their area
of origin or from centers of high population
○ e.g. birds
✢ Biotic: other living species
✢ Abiotic: temperature, water, oxygen, salinity, or soil
Biotic Factors✢ Predation
○ organisms kill their prey
✢ Herbivory
○ e.g. sea urchins can limit the distribution of
seaweed
✢ Presence/absence of: pollinators, food, parasites, and
pathogens
Abiotic Factors✢ Temperature: most organisms function best within a
specific temp. range
✢ Water and Oxygen: species can be at risk of drying out
○ water can affect oxygen availability in aquatic
environments
○ oxygen concentration can be particularly low in
both deep ocean and lake waters
✢ Salinity: aquatic organisms are restricted to either
freshwater or saltwater habitats due to osmoregulation
Abiotic Factors (cont’d)✢ Sunlight: provides energy that drives most
ecosystems
○ too little sunlight can limit photosynthetic species
✢ Rocks and Soil: the pH, mineral composition, and
physical structure of rocks can limit plants, thus
herbivores and omnivores are also affected
40.4 PopulationHow does biotic and abiotic factors affect population
density, dispersion, and demographics?
✢ Density: the number of individuals per unit area or
volume
✢ Dispersion: the pattern of spacing among individuals
within the boundaries of the population
✢ Demographics: the study of vital statistics of
populations and how they change over time (particularly
birth and death rates)
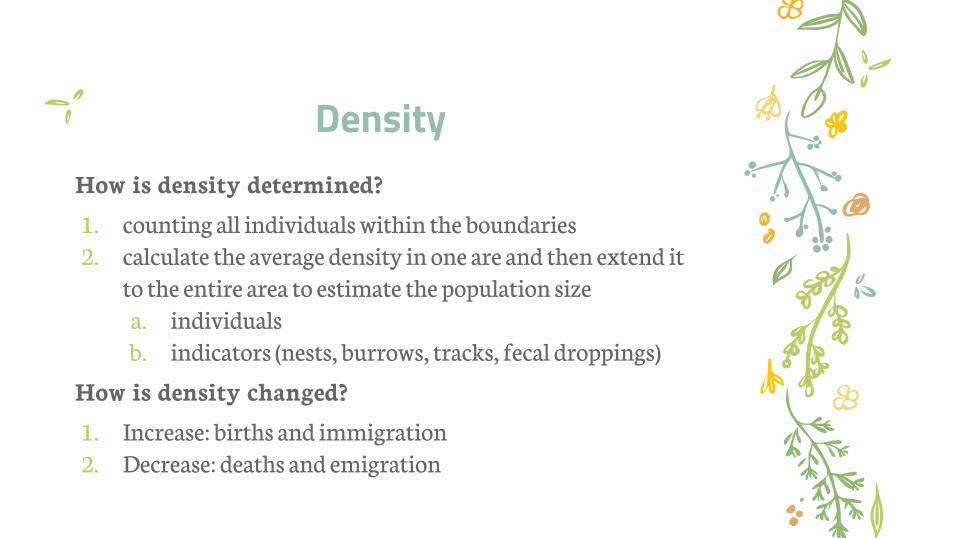
DensityHow is density determined?
1. counting all individuals within the boundaries2. calculate the average density in one are and then extend it
to the entire area to estimate the population sizea. individuals b. indicators (nests, burrows, tracks, fecal droppings)
How is density changed?
1. Increase: births and immigration 2. Decrease: deaths and emigration
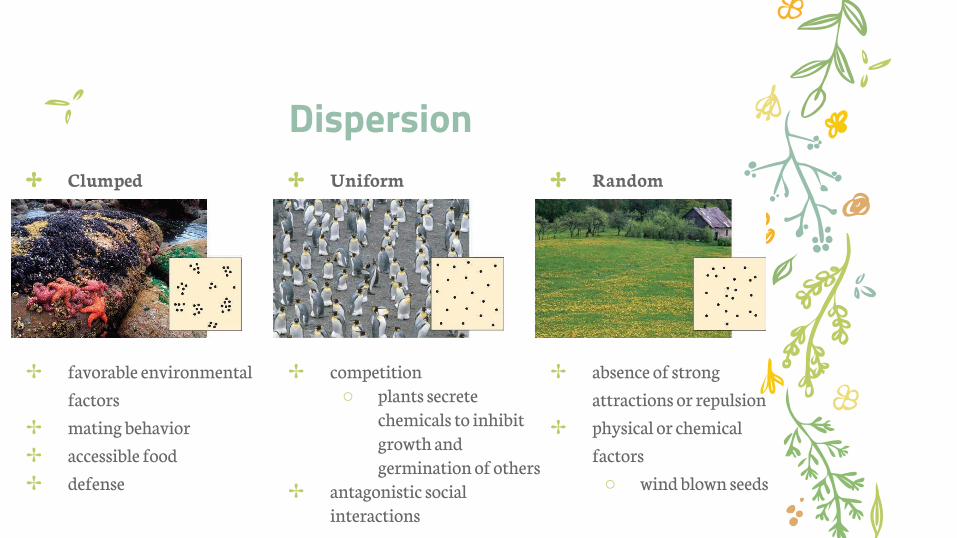
Dispersion ✢ Clumped
✢ favorable environmental
factors
✢ mating behavior
✢ accessible food
✢ defense
✢ Uniform
✢ competition○ plants secrete
chemicals to inhibit growth and germination of others
✢ antagonistic social interactions
✢ Random
✢ absence of strong
attractions or repulsion
✢ physical or chemical
factors
○ wind blown seeds
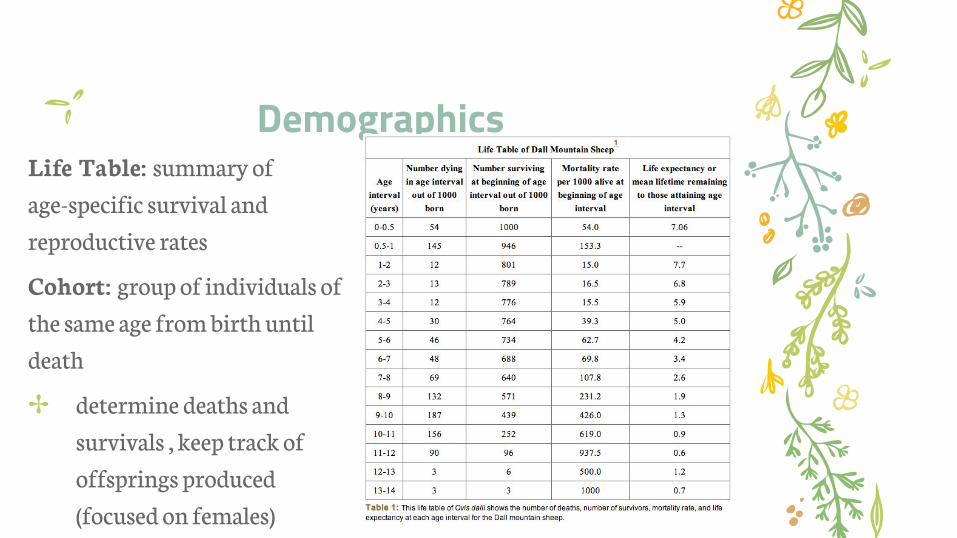
Demographics Life Table: summary of
age-specific survival and
reproductive rates
Cohort: group of individuals of
the same age from birth until
death
✢ determine deaths and
survivals , keep track of
offsprings produced
(focused on females)
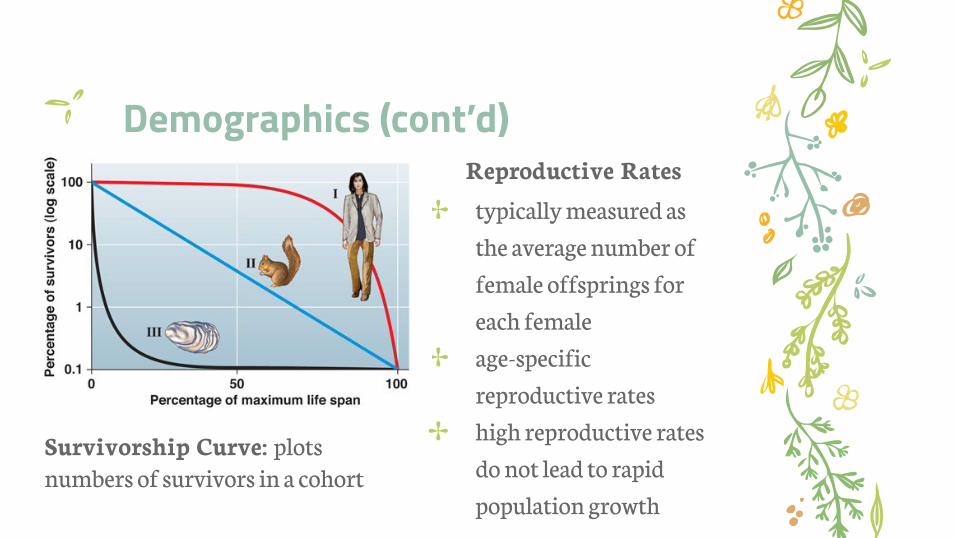
Demographics (cont’d)Reproductive Rates
✢ typically measured as
the average number of
female offsprings for
each female
✢ age-specific
reproductive rates
✢ high reproductive rates
do not lead to rapid
population growth
Survivorship Curve: plots numbers of survivors in a cohort
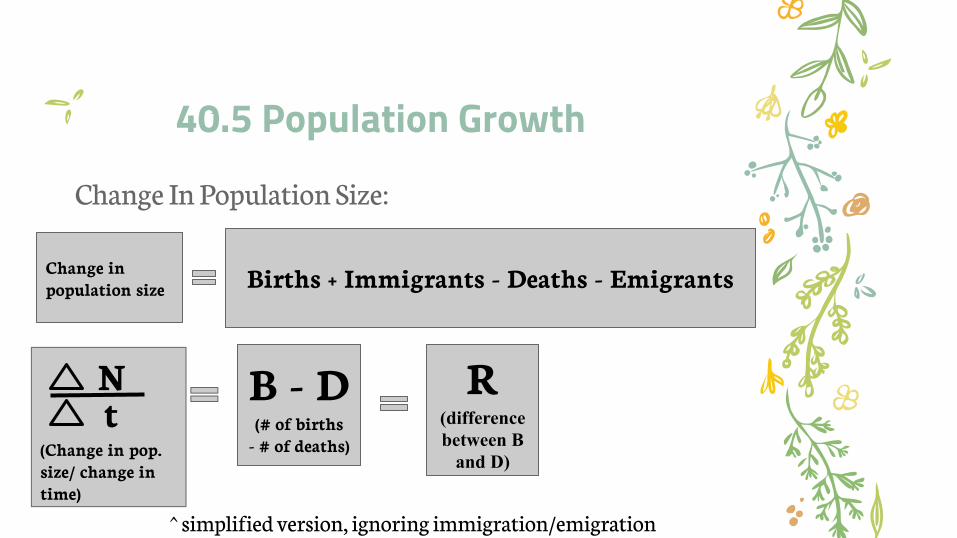
40.5 Population Growth
Change In Population Size:
Change in population size Births + Immigrants - Deaths - Emigrants
(Change in pop. size/ change in time)
Nt
B - D(# of births
- # of deaths)
R(difference between B
and D)
^ simplified version, ignoring immigration/emigration
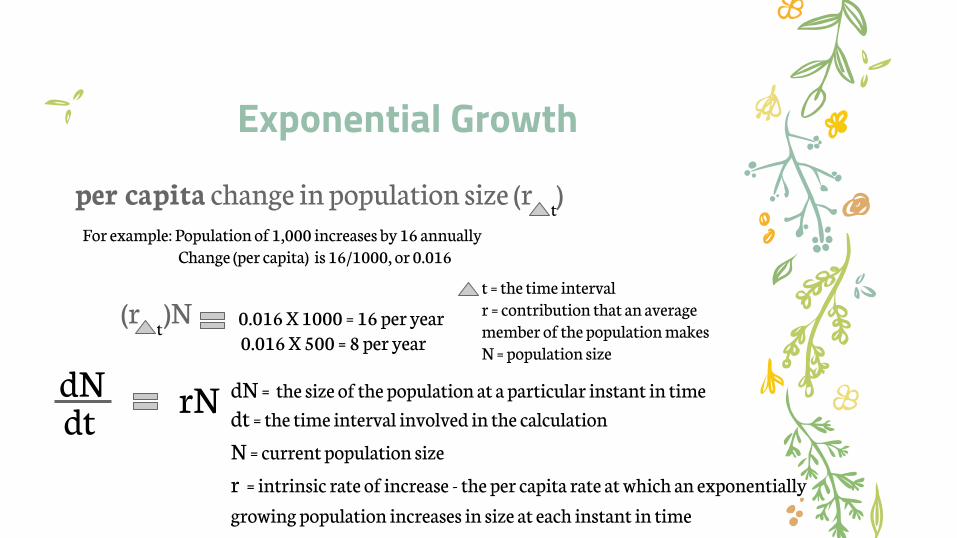
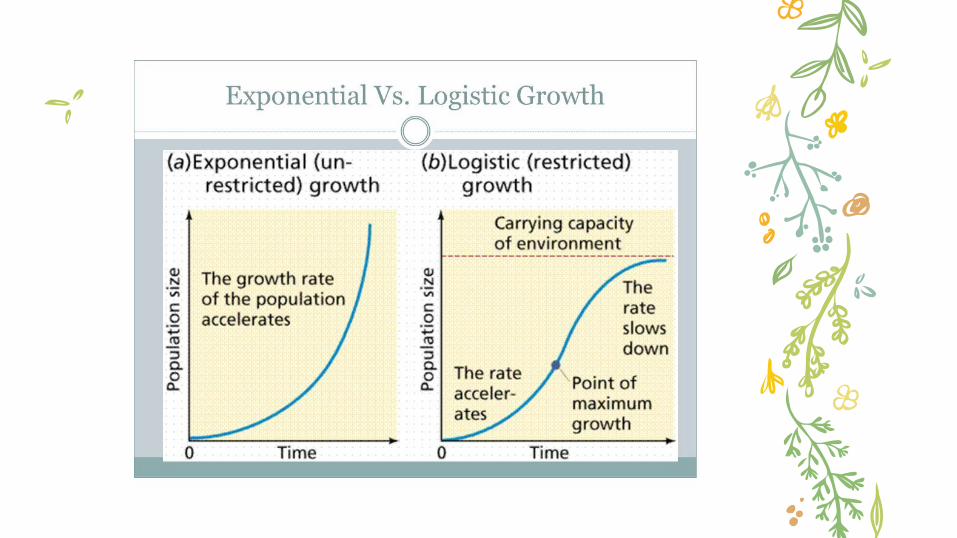
Exponential Growth
per capita change in population size (r )t
dNdt
rN dN = the size of the population at a particular instant in time
dt = the time interval involved in the calculation
N = current population size
r = intrinsic rate of increase - the per capita rate at which an exponentially
growing population increases in size at each instant in time
For example: Population of 1,000 increases by 16 annuallyChange (per capita) is 16/1000, or 0.016
(r )Nt
0.016 X 1000 = 16 per year
t = the time intervalr = contribution that an average member of the population makes N = population size0.016 X 500 = 8 per year
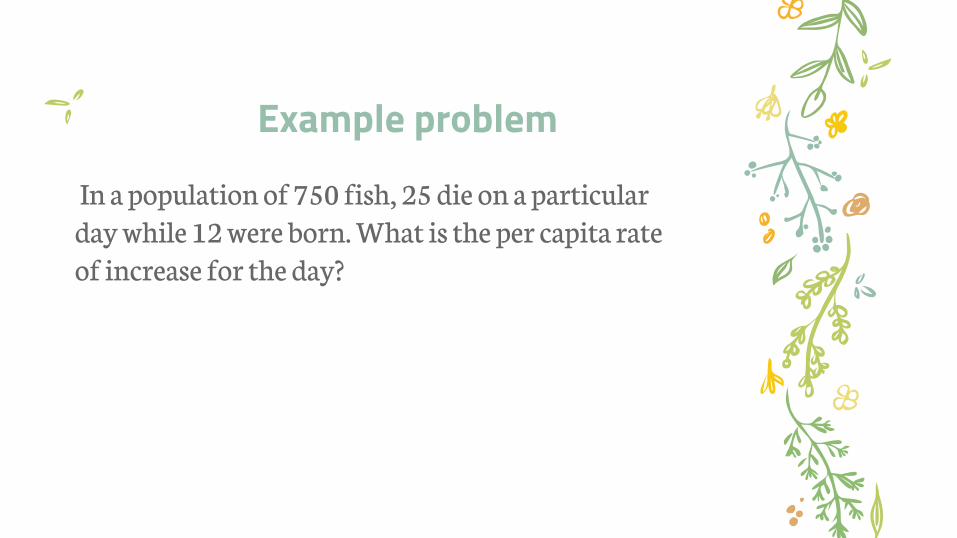
In a population of 750 fish, 25 die on a particular day while 12 were born. What is the per capita rate of increase for the day?
Example problem
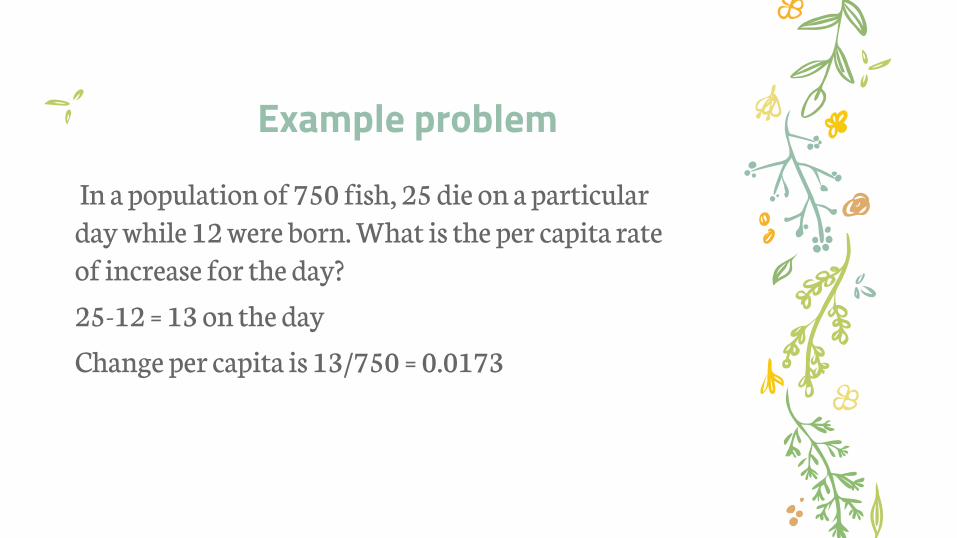
In a population of 750 fish, 25 die on a particular day while 12 were born. What is the per capita rate of increase for the day?
25-12 = 13 on the day
Change per capita is 13/750 = 0.0173
Example problem
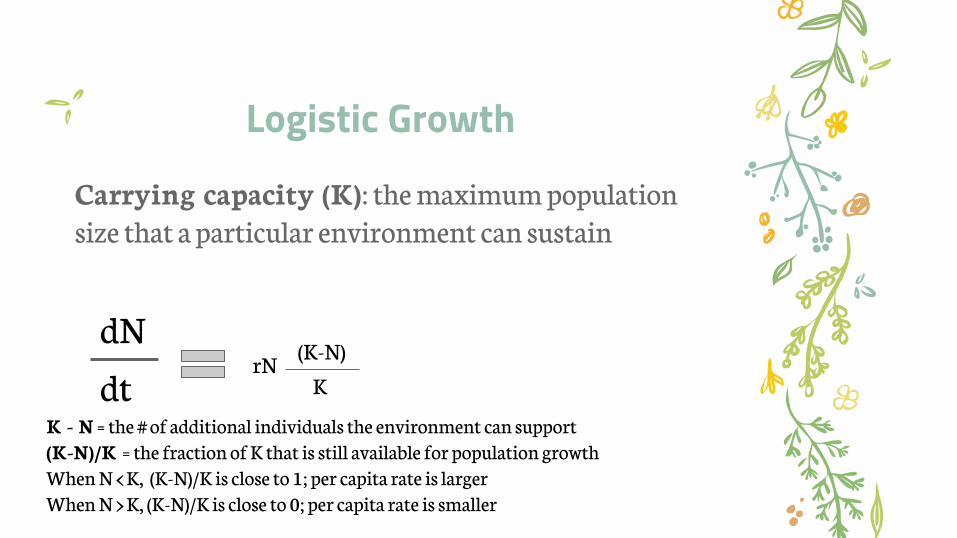
Logistic Growth
Carrying capacity (K): the maximum population size that a particular environment can sustain
dt
dNrN
(K-N)
K
K - N = the # of additional individuals the environment can support(K-N)/K = the fraction of K that is still available for population growthWhen N < K, (K-N)/K is close to 1; per capita rate is largerWhen N > K, (K-N)/K is close to 0; per capita rate is smaller
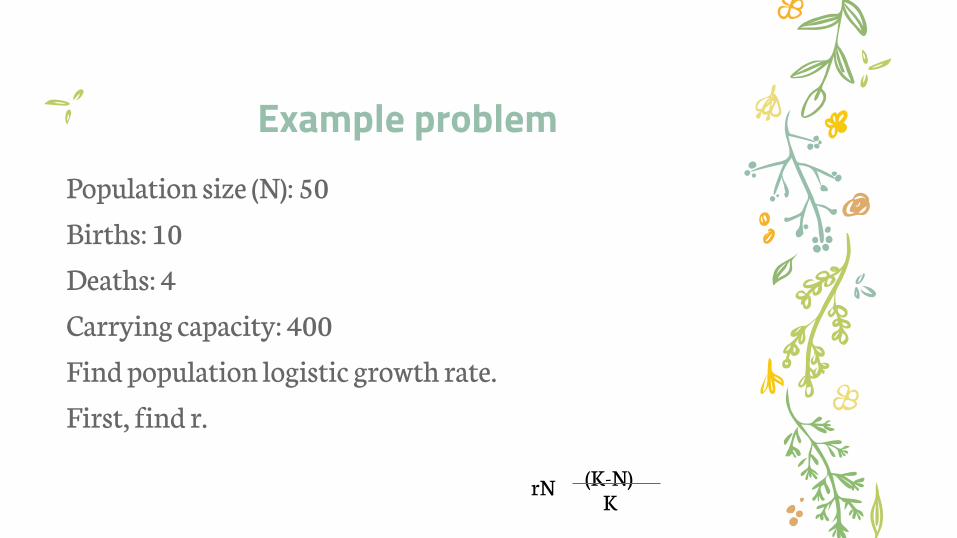
Population size (N): 50
Births: 10
Deaths: 4
Carrying capacity: 400
Find population logistic growth rate.
First, find r.
rN (K-N)
K
Example problem
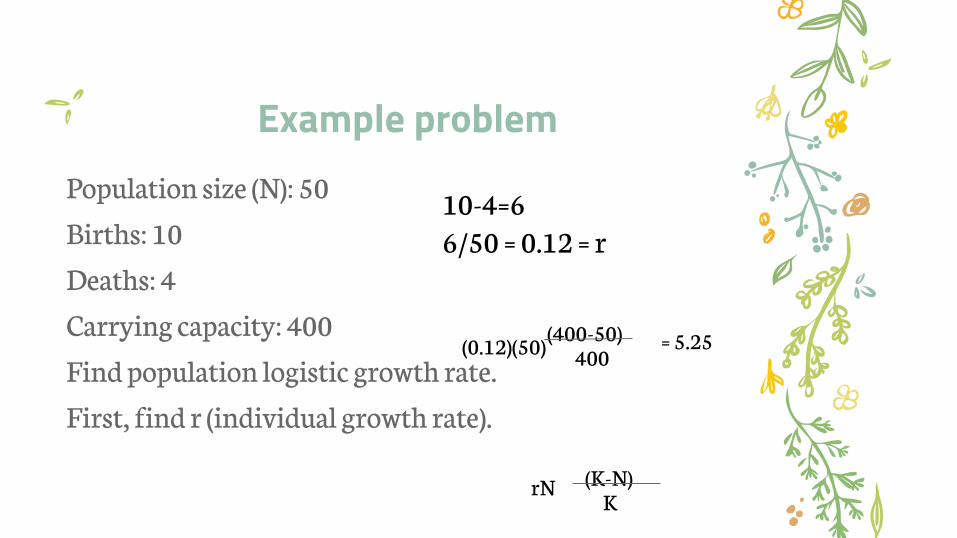
Population size (N): 50
Births: 10
Deaths: 4
Carrying capacity: 400
Find population logistic growth rate.
First, find r (individual growth rate).
rN (K-N)
K
Example problem
10-4=66/50 = 0.12 = r
(0.12)(50)(400-50)
400= 5.25
40.6 Population Dynamics
How does life history and population density influence population dynamics?
✢ Population dynamics
○ fluctuations in population sizes
○ interactions between biotic and abiotic factors
that cause variation in population size
Life History & Trade offs
✢ Life history- Traits that are evolutionary
outcomes that affect an organism’s schedule of
reproduction and survival
✢ Selective Pressure
○ Influence trade-offs between number and
size of offspring
○ More likely to die= more offspring
Density Dependent* A death rate that increases with population density
or a birth rate that decreases with rising density
✢ K-Selection
○ Selection for traits that are sensitive to population
density and favored at high densities
○ Parental care
○ Long life expectancy
○ Ex: Humans, Trees
Density Independent
* A birth rate or death rate that does not change with population density
✢ R-Selection
○ Selection for traits that maximize reproductive success
in low density environments (uncrowded)
○ Many offspring
○ Disturbed habitats (Ex: Freshly Burned Grassland)
Population Regulation
✢ Negative Feedback○ Density Dependant regulation○ Stops population growth (reducing birth
rates/increasing death rates)○ Ex. Toxic waste, Territoriality, Disease,
Competition for resources✢ Metapopulation helps ecologists understand
population dynamics and gene flow in patchy habitats

https://create.kahoot.it/share/population-ecology/82779b7f-0929-46f0-b4d2-17aa111fb113
Kahoot!