ECOLOGY Copyright © 2020 The fate of tropical forest fragments · Tropical forests play a...
10
Hansen et al., Sci. Adv. 2020; 6 : eaax8574 11 March 2020 SCIENCE ADVANCES | RESEARCH ARTICLE 1 of 9 ECOLOGY The fate of tropical forest fragments Matthew C. Hansen 1 *, Lei Wang 2 , Xiao-Peng Song 1,3 , Alexandra Tyukavina 1 , Svetlana Turubanova 1 , Peter V. Potapov 1 , Stephen V. Stehman 4 Tropical forest fragmentation results in habitat and biodiversity loss and increased carbon emissions. Here, we link an increased likelihood of tropical forest loss to decreasing fragment size, particularly in primary forests. The relationship holds for protected areas, albeit with half the rate of loss compared with all fragments. The fact that disturbance increases as primary forest fragment size decreases reflects higher land use pressures and improved access for resource extraction and/or conversion in smaller fragments. Large remaining forest fragments are found in the Amazon and Congo Basins and Insular Southeast Asia, with the majority of large extent/low loss fragments located in the Amazon. Tropical areas without large fragments, including Central America, West Africa, and mainland Southeast Asia, have higher loss within and outside of protected areas. Results illustrate the need for rigorous land use planning, management, and enforcement in maintaining large tropical forest fragments and restoring regions of advanced fragmentation. INTRODUCTION Tropical forests play a disproportionate role in global ecosystem ser- vices, including carbon sequestration, climate and water cycle regu- lation, and maintenance of biodiversity (1–3). However, increasing rates of tropical forest cover loss due to land use change threaten the continued functioning of many of these services (4, 5). Spatial patterns of forest loss could amplify the adverse effects on tropical ecosystems: Creation of new forest edges increases tree mortality and fire frequency (6); small and isolated forest fragments are more likely to disappear compared to larger fragments (7, 8). Selective logging has been shown to facilitate accessibility and risk of fire within previously intact for- ests (6, 9). Numerous studies have quantified increasing fragmentation of tropical forests over time, using spatial metrics such as fragment size distribution and distance to forest edge, with demonstrated deleterious effects for biodiversity, carbon cycle, and other ecosystem processes (8, 10–14). The evolution of tropical forest fragmentation has been found to be empirically predictable at large scales (15), which em- phasizes the importance of tropical forest conservation policies in- cluding fragmentation metrics (16). However, none of the studies incorporated fragmentation metrics with spatially explicit forest loss data. While official country reports focus on area, spatial arrange- ment of forest cover and changes therein are not part of typical forest monitoring protocols. For the purposes of land use planning and the competing goals of economic development and ecosystem service maintenance, forest fragmentation monitoring integrated with data on forest loss is required. Here, we used time series of forest cover and loss maps to quan- tify 18 years of pantropical forest fragmentation. For the purposes of this study, forest loss is defined as a “stand-replacement distur- bance or the complete removal of tree canopy cover” at the scale of observation—in this case, a Landsat pixel (17). These input maps are publically available, have global coverage, and are updated an- nually, which makes the presented method suitable for continued op- erational monitoring of forest fragmentation. We used tree cover for the year 2000 to delineate forest fragments of ≥10 km 2 within the tropical humid and moist deciduous forest ecozones and to calculate forest loss per fragment from 2001 to 2018. We ranked (ordered) all fragments from 10 km 2 to the maximum fragment size and con- structed fragment groups by accumulating fragments from the or- dered list (low to high) until the cumulative area of fragments in the group equaled 100,000 km 2 . This approach yielded 103 groups in which the fragments within each group were roughly equal size. For each fragment size group, we computed the percent of forest fragment loss (total area of forest loss per group/group area) and average distance to forest loss. We investigated the relationship between forest fragment loss and fragment size and performed similar analyses for primary forests and protected areas, both treated as subset areas of interest within mapped fragments. The findings were summarized by fragment size group pantropically, by continent, and by country. RESULTS The average proportion of forest fragment loss in 2001–2018 is re- lated nonlinearly to fragment size (Fig. 1A), with smaller fragments experiencing increasingly higher proportional loss (ln model r 2 = 0.85). For example, the 36,282 fragments under 675 km 2 in size ex- perienced an average areal loss of 11.5% from 2001 to 2018, 1314 frag- ments from 675 to 2000 km 2 with 9.1% loss, 430 fragments from 2000 to 8000 km 2 with 7.1% loss, 84 fragments from 8000 to 34,000 km 2 with 5.5% loss, 21 fragments from 34,000 to 75,000 km 2 with 4.0% loss, and the 22 largest forest blocks >75,000 km 2 with only 2.0% loss. Primary forests (18), taken as a subset of the modeled forest frag- ments, exhibit largely the same relationship as that of whole fragments (ln model r 2 = 0.77) (Figs. 1A and 2A), suggesting that the loss of primary forests drives the overall relationship. While primary forests constitute a larger proportion of per fragment tree cover as fragment size increases (Fig. 2B), there is no relationship between the area of primary forest loss and fragment size (ln model r 2 = 0.00, mean loss per fragment size group = 4833 ± 2042 km 2 ) (Fig. 2C). Nonprimary forest not only consisting mainly of forestry, agroforestry, and shift- ing cultivation land uses but also including natural moist deciduous tropical woodlands exhibits no relationship between the proportion 1 Department of Geographical Sciences, University of Maryland, College Park, MD 20740, USA. 2 State Key Laboratory of Remote Sensing Science, Institute of Remote Sensing and Digital Earth, Chinese Academy of Sciences, Beijing 100101, China. 3 Department of Geosciences, Texas Tech University, Lubbock, TX 79409, USA. 4 State University of New York College of Environmental Science and Forestry, Syracuse, NY 13210, USA. *Corresponding author. Email: [email protected] Copyright © 2020 The Authors, some rights reserved; exclusive licensee American Association for the Advancement of Science. No claim to original U.S. Government Works. Distributed under a Creative Commons Attribution NonCommercial License 4.0 (CC BY-NC). on June 5, 2020 http://advances.sciencemag.org/ Downloaded from
Transcript of ECOLOGY Copyright © 2020 The fate of tropical forest fragments · Tropical forests play a...
Hansen et al., Sci. Adv. 2020; 6 : eaax8574 11 March 2020
S C I E N C E A D V A N C E S | R E S E A R C H A R T I C L E
1 of 9
E C O L O G Y
The fate of tropical forest fragmentsMatthew C. Hansen1*, Lei Wang2, Xiao-Peng Song1,3, Alexandra Tyukavina1, Svetlana Turubanova1, Peter V. Potapov1, Stephen V. Stehman4
Tropical forest fragmentation results in habitat and biodiversity loss and increased carbon emissions. Here, we link an increased likelihood of tropical forest loss to decreasing fragment size, particularly in primary forests. The relationship holds for protected areas, albeit with half the rate of loss compared with all fragments. The fact that disturbance increases as primary forest fragment size decreases reflects higher land use pressures and improved access for resource extraction and/or conversion in smaller fragments. Large remaining forest fragments are found in the Amazon and Congo Basins and Insular Southeast Asia, with the majority of large extent/low loss fragments located in the Amazon. Tropical areas without large fragments, including Central America, West Africa, and mainland Southeast Asia, have higher loss within and outside of protected areas. Results illustrate the need for rigorous land use planning, management, and enforcement in maintaining large tropical forest fragments and restoring regions of advanced fragmentation.
INTRODUCTIONTropical forests play a disproportionate role in global ecosystem ser-vices, including carbon sequestration, climate and water cycle regu-lation, and maintenance of biodiversity (1–3). However, increasing rates of tropical forest cover loss due to land use change threaten the continued functioning of many of these services (4, 5). Spatial patterns of forest loss could amplify the adverse effects on tropical ecosystems: Creation of new forest edges increases tree mortality and fire frequency (6); small and isolated forest fragments are more likely to disappear compared to larger fragments (7, 8). Selective logging has been shown to facilitate accessibility and risk of fire within previously intact for-ests (6, 9).
Numerous studies have quantified increasing fragmentation of tropical forests over time, using spatial metrics such as fragment size distribution and distance to forest edge, with demonstrated deleterious effects for biodiversity, carbon cycle, and other ecosystem processes (8, 10–14). The evolution of tropical forest fragmentation has been found to be empirically predictable at large scales (15), which em-phasizes the importance of tropical forest conservation policies in-cluding fragmentation metrics (16). However, none of the studies incorporated fragmentation metrics with spatially explicit forest loss data. While official country reports focus on area, spatial arrange-ment of forest cover and changes therein are not part of typical forest monitoring protocols. For the purposes of land use planning and the competing goals of economic development and ecosystem service maintenance, forest fragmentation monitoring integrated with data on forest loss is required.
Here, we used time series of forest cover and loss maps to quan-tify 18 years of pantropical forest fragmentation. For the purposes of this study, forest loss is defined as a “stand-replacement distur-bance or the complete removal of tree canopy cover” at the scale of observation—in this case, a Landsat pixel (17). These input maps are publically available, have global coverage, and are updated an-
nually, which makes the presented method suitable for continued op-erational monitoring of forest fragmentation. We used tree cover for the year 2000 to delineate forest fragments of ≥10 km2 within the tropical humid and moist deciduous forest ecozones and to calculate forest loss per fragment from 2001 to 2018. We ranked (ordered) all fragments from 10 km2 to the maximum fragment size and con-structed fragment groups by accumulating fragments from the or-dered list (low to high) until the cumulative area of fragments in the group equaled 100,000 km2. This approach yielded 103 groups in which the fragments within each group were roughly equal size. For each fragment size group, we computed the percent of forest fragment loss (total area of forest loss per group/group area) and average distance to forest loss. We investigated the relationship between forest fragment loss and fragment size and performed similar analyses for primary forests and protected areas, both treated as subset areas of interest within mapped fragments. The findings were summarized by fragment size group pantropically, by continent, and by country.
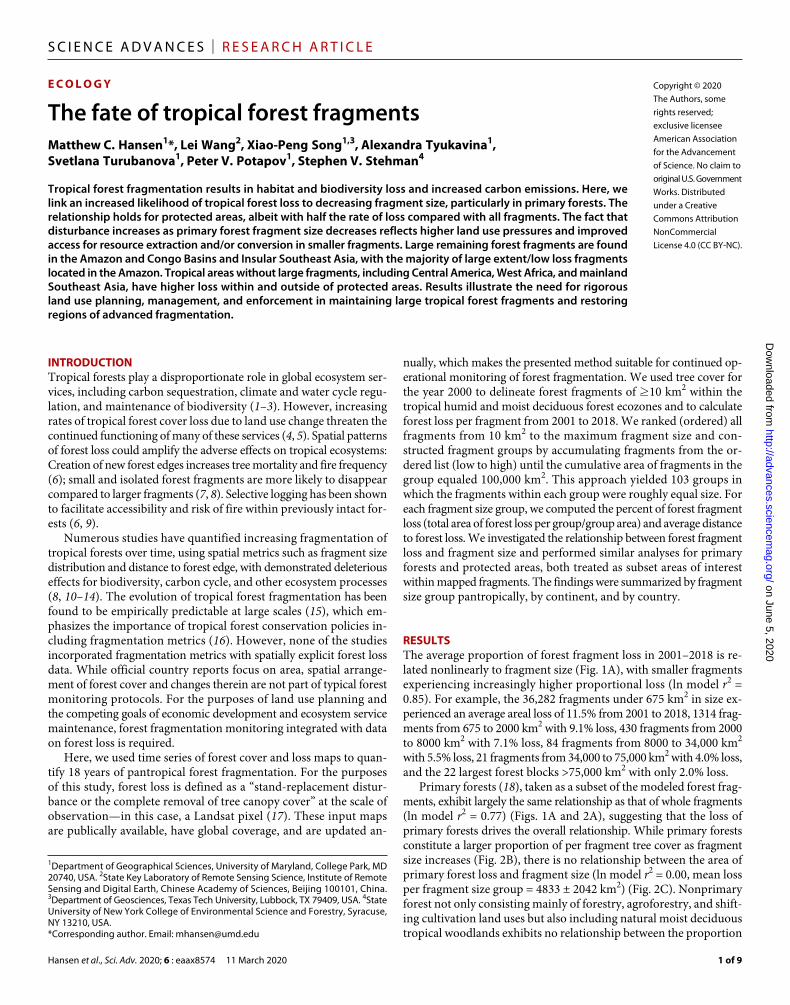
RESULTSThe average proportion of forest fragment loss in 2001–2018 is re-lated nonlinearly to fragment size (Fig. 1A), with smaller fragments experiencing increasingly higher proportional loss (ln model r2 = 0.85). For example, the 36,282 fragments under 675 km2 in size ex-perienced an average areal loss of 11.5% from 2001 to 2018, 1314 frag-ments from 675 to 2000 km2 with 9.1% loss, 430 fragments from 2000 to 8000 km2 with 7.1% loss, 84 fragments from 8000 to 34,000 km2 with 5.5% loss, 21 fragments from 34,000 to 75,000 km2 with 4.0% loss, and the 22 largest forest blocks >75,000 km2 with only 2.0% loss.
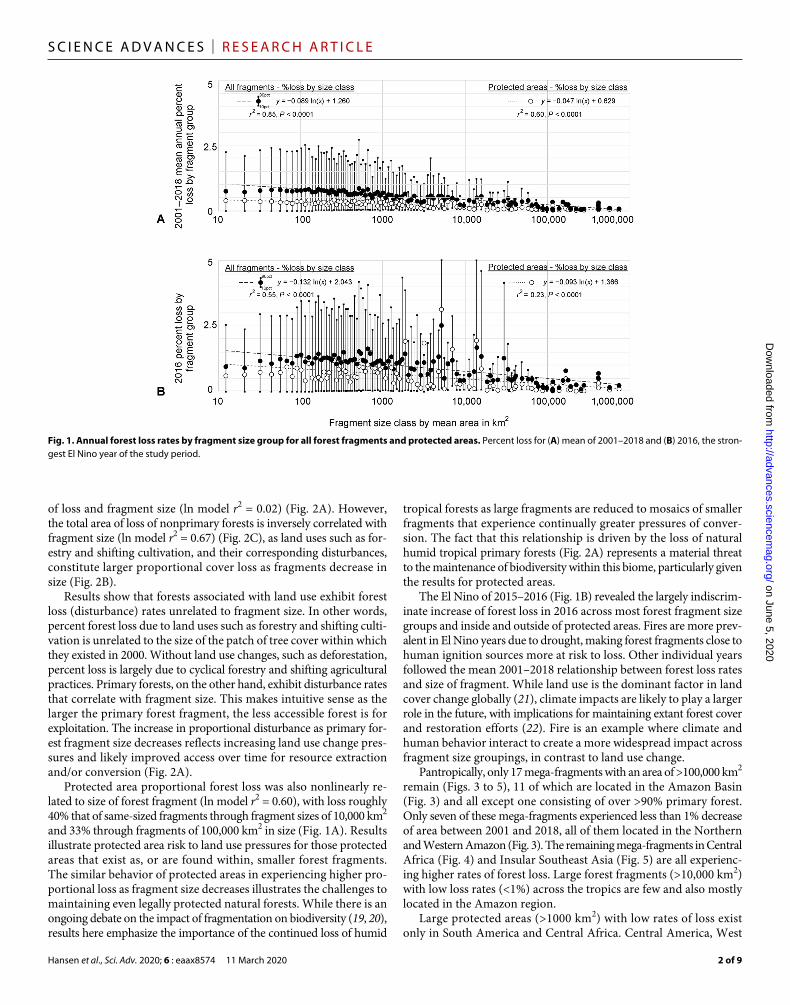
Primary forests (18), taken as a subset of the modeled forest frag-ments, exhibit largely the same relationship as that of whole fragments (ln model r2 = 0.77) (Figs. 1A and 2A), suggesting that the loss of primary forests drives the overall relationship. While primary forests constitute a larger proportion of per fragment tree cover as fragment size increases (Fig. 2B), there is no relationship between the area of primary forest loss and fragment size (ln model r2 = 0.00, mean loss per fragment size group = 4833 ± 2042 km2) (Fig. 2C). Nonprimary forest not only consisting mainly of forestry, agroforestry, and shift-ing cultivation land uses but also including natural moist deciduous tropical woodlands exhibits no relationship between the proportion
1Department of Geographical Sciences, University of Maryland, College Park, MD 20740, USA. 2State Key Laboratory of Remote Sensing Science, Institute of Remote Sensing and Digital Earth, Chinese Academy of Sciences, Beijing 100101, China. 3Department of Geosciences, Texas Tech University, Lubbock, TX 79409, USA. 4State University of New York College of Environmental Science and Forestry, Syracuse, NY 13210, USA.*Corresponding author. Email: [email protected]
Copyright © 2020 The Authors, some rights reserved; exclusive licensee American Association for the Advancement of Science. No claim to original U.S. Government Works. Distributed under a Creative Commons Attribution NonCommercial License 4.0 (CC BY-NC).
on June 5, 2020http://advances.sciencem
ag.org/D
ownloaded from
Hansen et al., Sci. Adv. 2020; 6 : eaax8574 11 March 2020
S C I E N C E A D V A N C E S | R E S E A R C H A R T I C L E
2 of 9
of loss and fragment size (ln model r2 = 0.02) (Fig. 2A). However, the total area of loss of nonprimary forests is inversely correlated with fragment size (ln model r2 = 0.67) (Fig. 2C), as land uses such as for-estry and shifting cultivation, and their corresponding disturbances, constitute larger proportional cover loss as fragments decrease in size (Fig. 2B).
Results show that forests associated with land use exhibit forest loss (disturbance) rates unrelated to fragment size. In other words, percent forest loss due to land uses such as forestry and shifting culti-vation is unrelated to the size of the patch of tree cover within which they existed in 2000. Without land use changes, such as deforestation, percent loss is largely due to cyclical forestry and shifting agricultural practices. Primary forests, on the other hand, exhibit disturbance rates that correlate with fragment size. This makes intuitive sense as the larger the primary forest fragment, the less accessible forest is for exploitation. The increase in proportional disturbance as primary for-est fragment size decreases reflects increasing land use change pres-sures and likely improved access over time for resource extraction and/or conversion (Fig. 2A).
Protected area proportional forest loss was also nonlinearly re-lated to size of forest fragment (ln model r2 = 0.60), with loss roughly 40% that of same-sized fragments through fragment sizes of 10,000 km2 and 33% through fragments of 100,000 km2 in size (Fig. 1A). Results illustrate protected area risk to land use pressures for those protected areas that exist as, or are found within, smaller forest fragments. The similar behavior of protected areas in experiencing higher pro-portional loss as fragment size decreases illustrates the challenges to maintaining even legally protected natural forests. While there is an ongoing debate on the impact of fragmentation on biodiversity (19, 20), results here emphasize the importance of the continued loss of humid
tropical forests as large fragments are reduced to mosaics of smaller fragments that experience continually greater pressures of conver-sion. The fact that this relationship is driven by the loss of natural humid tropical primary forests (Fig. 2A) represents a material threat to the maintenance of biodiversity within this biome, particularly given the results for protected areas.
The El Nino of 2015–2016 (Fig. 1B) revealed the largely indiscrim-inate increase of forest loss in 2016 across most forest fragment size groups and inside and outside of protected areas. Fires are more prev-alent in El Nino years due to drought, making forest fragments close to human ignition sources more at risk to loss. Other individual years followed the mean 2001–2018 relationship between forest loss rates and size of fragment. While land use is the dominant factor in land cover change globally (21), climate impacts are likely to play a larger role in the future, with implications for maintaining extant forest cover and restoration efforts (22). Fire is an example where climate and human behavior interact to create a more widespread impact across fragment size groupings, in contrast to land use change.
Pantropically, only 17 mega-fragments with an area of >100,000 km2 remain (Figs. 3 to 5), 11 of which are located in the Amazon Basin (Fig. 3) and all except one consisting of over >90% primary forest. Only seven of these mega-fragments experienced less than 1% decrease of area between 2001 and 2018, all of them located in the Northern and Western Amazon (Fig. 3). The remaining mega-fragments in Central Africa (Fig. 4) and Insular Southeast Asia (Fig. 5) are all experienc-ing higher rates of forest loss. Large forest fragments (>10,000 km2) with low loss rates (<1%) across the tropics are few and also mostly located in the Amazon region.
Large protected areas (>1000 km2) with low rates of loss exist only in South America and Central Africa. Central America, West
Fig. 1. Annual forest loss rates by fragment size group for all forest fragments and protected areas. Percent loss for (A) mean of 2001–2018 and (B) 2016, the stron-gest El Nino year of the study period.
on June 5, 2020http://advances.sciencem
ag.org/D
ownloaded from
Hansen et al., Sci. Adv. 2020; 6 : eaax8574 11 March 2020
S C I E N C E A D V A N C E S | R E S E A R C H A R T I C L E
3 of 9
Africa, Madagascar, and mainland Southeast Asia are examples of rapid loss of protected area fragments. This is due to both direct human impacts (e.g., illegal logging and encroachment of agricultural ac-tivities into protected areas) and extreme weather events (e.g., hur-ricanes). For example, smallholder clearings in Central American national parks are widespread, with marked loss in Sierra del Lancadon and Laguna del Tigre National Parks in Guatemala and Patuca National Park and Tawahka Biological Reserve in Honduras. Wars and political instability have also affected protected areas as their boundaries are not enforced in the periods of unrest, with the example
of Cote d’Ivoire particularly prominent. Cote d’Ivoire lost almost all forest cover in Mount Peko and Marahoue National Parks and several other protected areas in the period marked by the 2002–2004 and 2011 civil wars (23). In Cambodia, large areas within wildlife sanc-tuaries, conservation areas, and national parks have been replaced with commercial rubber plantations in recent years (24).
Distance of year 2000 forest cover to 2001–2018 forest loss is another way to quantify potential threats to forest fragments (18): Un-like direct decrease of fragment area, distance to loss captures within- patch distribution of disturbances and likely future fragmentation.
Fig. 2. Primary forest and nonprimary forest extent and loss as a function of fragment size. (A) Annual forest loss rates for primary forest and nonprimary forest. (B) Area of primary forest and nonprimary forest per fragment size grouping. (C) Mapped loss per fragment size grouping for primary forest and nonprimary forest.
on June 5, 2020http://advances.sciencem
ag.org/D
ownloaded from

Hansen et al., Sci. Adv. 2020; 6 : eaax8574 11 March 2020
S C I E N C E A D V A N C E S | R E S E A R C H A R T I C L E
4 of 9
South America is unique in having large fragments isolated from forest disturbance, with six mega-fragments having 25% of remain-ing forest more than 15 km from forest loss (Fig. 6). East Guiana Shield, the largest tropical forest fragment, is also the most isolated with 25% of extant forest more than 21 km from loss. The two largest mega- fragments in Africa (Congo/Ubangi/Uele/Great Lakes and Congo/Sankuru/Lomami), both located in the Democratic Republic of the Congo (DRC), have the shortest distance to loss (<7 km) among all pantropical fragments exceeding 100,000 km2 in extent (Fig. 6). This is due to rural populations in DRC settled along trunk roads that form a network cutting through remaining large forest fragments. Recent civil war has resulted in populations moving into more remote forests, further encroaching on existing forest mega-fragments (25). This dy-namic is different from the “arc of deforestation” observed in the Brazilian Amazon, where the wave of forest clearing advances from the edges of forest massifs into the inland areas largely facilitated by new infrastructure. The most isolated mega-fragment in Central Africa, Ogouee/Dja/Sangha/Likouala, is found mainly in Gabon but also includes parts of Equatorial Guinea, Cameroon, and Republic of Congo. This fragment has a distance to loss of 14 km for its farthest quartile and reflects the absence of the smallholder agricultural pres-sures present in DRC, as well as a relative lack of logging. In Tropical Asia, the remaining three mega-fragments have mean distances to loss for the farthest 25% forest pixels of between 5 and 10 km and are found in mountainous terrain in central Borneo and New Guinea (Fig. 6). Encroachment largely takes the form of logging operations.
Countries with high proportional loss (>10%) within forest frag-ments include Cambodia, Paraguay, Malaysia, Argentina, Guatemala,
Nicaragua, Madagascar, Indonesia, Sierra Leone, Cote d’Ivoire, Malawi, Honduras, and Belize (fig. S1A). Indonesia stands out among high forest cover (>106 km2 total forest area) countries as having the highest proportional forest loss. Two clusters of countries with high forest cover but low forest loss were identified, one cluster is the Northeastern Atlantic coast countries of South America (Suriname, Guyana, and French Guiana) and the other is the Gulf of the Guinea countries in Africa (Cameroon, Gabon, and Republic of Congo) together with Cen-tral African Republic (fig. S1A).
Countries with high forest loss within protected areas (>10%) include Haiti, Malawi, Cote d’Ivoire, Guatemala, Cambodia, Nicaragua and Honduras (fig. S1B). Peru has the lowest proportional loss among the countries with large extent of protected areas (>105 km2). Other countries with low proportional forest loss within protected areas (<1%) include Northern and Western Amazon (Guyana, Suriname, Ecuador, French Guiana, and Venezuela), Central America (Costa Rica), Central Africa (Cameroon, Gabon, Central African Republic, Republic of Congo, and Equatorial Guinea), India, and Australia.
DISCUSSIONOverall, the fate of tropical forest fragments is one of likely continued loss, with two priorities for mitigating further fragmentation and loss. First, for highly fragmented ecoregions, restoration of natural forest cover should be pursued with an emphasis on connectivity and the reestablishment of large blocks of natural forest cover. Such an ap-proach is needed for tropical forest regions lacking large contiguous blocks of natural forest, including Central America, West Africa, and
Fig. 3. Forest fragments of South America by fragment area, 2001–2018 total loss area, and percentage loss of year 2000 fragment area.
on June 5, 2020http://advances.sciencem
ag.org/D
ownloaded from

Hansen et al., Sci. Adv. 2020; 6 : eaax8574 11 March 2020
S C I E N C E A D V A N C E S | R E S E A R C H A R T I C L E
5 of 9
mainland Southeast Asia. Reforestation has been identified as having the highest climate mitigation potential among conservation, resto-ration, and improved land management pathways across global forests, wetlands, grasslands, and agricultural lands (26). Rehabilitating and expanding existing protected areas are integral to forest restoration efforts (27).
The second priority should be the conservation of extant large hu-mid tropical forest blocks with an emphasis on limiting future frag-mentation, including the forests of the Amazon Basin, Congo Basin,
Indonesian Borneo, and the island of New Guinea. Conservation with-in these large blocks should incorporate preservation of high carbon stock and biodiversity corridors (28). Certification of logging con-cessions has been found to have negligible effect on slowing intact forest loss in the Congo Basin (29), which suggests that even sustainably managed industrial logging operations have significant impacts on forest fragmentation.
Separating primary forests as a target of fragmentation monitor-ing is crucial to future conservation efforts. While forests associated
Fig. 4. Forest fragments of Africa by fragment area, 2001–2018 total loss area, and percentage loss of year 2000 fragment area.
on June 5, 2020http://advances.sciencem
ag.org/D
ownloaded from

Hansen et al., Sci. Adv. 2020; 6 : eaax8574 11 March 2020
S C I E N C E A D V A N C E S | R E S E A R C H A R T I C L E
6 of 9
with land use exhibit disturbance rates unrelated to fragment size (Fig. 2A), primary forests and protected areas have disturbance rates highly correlated with fragment size. Without robust mechanisms to conserve large blocks of extant natural forest, our results indicate a future of ever-increasing fragmentation and loss of primary for-ests outside of and within protected areas.
MATERIALS AND METHODSStudy areaThe study area consisted principally of the tropical rainforest and trop-ical moist deciduous forest ecozones of the United Nations Food and Agricultural Organization (FAO) (http://foris.fao.org/static/data/fra2010/ecozones2010.jpg). Montane forests within FAO’s tropical mountain system ecozone were manually added, and the aggregat-ed area of all three ecozones was buffered by 75 km. Enclosed rem-nant polygons, for example, areas of dry tropical forest in Southeast Asia, were subsumed into the study area.
Delineating forest fragmentsWe designed a locally adaptive procedure to derive forest fragments for the year 2000. On a continuous tree cover map, a forested land-scape is represented as a mosaic of spatially disconnected land patches that are separated by nonforest lands or linear barriers such as rivers and roads. A land patch may further consist of spatially contiguous forest fragments of varying tree cover density. A typical example is southern Ghana, where scattered conservation forests with high tree
cover are surrounded by agroforestry land use with low-to-moderate tree cover, a result of historical deforestation (fig. S2A). Our goal was to delineate homogeneous forest fragments with relatively high tree cover in any local region across the humid tropics. Our approach had the effect of selecting dense tree cover over sparse tree cover, ensuring the inclusion and often discrete delineation of contiguous patches of primary forest. However, older regrowth and plantations with dense tree cover were often included in the initial fragment delineation, re-sulting in a mix of primary forests and nonprimary forest land uses (Fig. 2B). The procedure included three major steps described as fol-lows. First, we applied a 30% threshold to convert percent tree cover to a forest/nonforest binary layer at the Landsat pixel scale (i.e., 0.09 ha) (fig. S2B) and delineated all contiguous forest patches using eight-way connectedness, which permits connections through all horizontally, vertically, and diagonally adjacent pixels (fig. S2C). Second, we ap-plied an algorithm initially developed for watershed segmentation to the percent tree cover layer within the forest binary mask to create initial forest fragments (fig. S2D). The algorithm simulates the im-mersion process over a topographic surface (30). Here, we apply the algorithm’s morphology gradient to the percent tree cover layer, sub-stituting tree cover in the place of elevation. High gradient values are used to identify edges of initial fragments. Last, to identify denser canopies, we computed the mean value of tree cover for each contig-uous forest patch and marked the pixels that were greater than the mean value as intermediate fragments (fig. S2E). We then computed the proportion of intermediate forest fragment pixels within each initial forest fragment and retained those that contained at least 50%
Fig. 5. Forest fragments of South and Southeast Asia by fragment area, 2001–2018 total loss area, and percentage loss of year 2000 fragment area.
on June 5, 2020http://advances.sciencem
ag.org/D
ownloaded from

Hansen et al., Sci. Adv. 2020; 6 : eaax8574 11 March 2020
S C I E N C E A D V A N C E S | R E S E A R C H A R T I C L E
7 of 9
intermediate pixels (intermediate/initial ≥ 0.5) (fig. S2F). We con-ducted two additional steps to remove small fragments and noise from the original tree cover map. First, we set a minimum patch size of 10 km2 to remove small fragments. Last, we applied a 3 × 3 moving window majority filter and resampled the forest segment map from 0.00025° × 0.00025° to 0.00075° × 0.00075° to remove isolated map errors within the delineated fragments. Given the final filtering steps, the final fragment population was created.
Statistical analysisFor the statistical analysis, we used the generated forest fragment layer and 2001–2018 annual tree cover loss product to compute the fragment size, 2001–2018 total loss area, and annual loss area (18 val-ues) for each fragment. We then created fragment groups by ranking
all fragments from smallest to largest and then proceeded to add fragments to a group until the cumulative area was 100,000 km2. Ex-ample forest fragments and time-series percent loss data are shown in fig. S3. Aggregating fragments of similar size into groups, regardless of location and specific drivers, allowed us to isolate the effect of frag-ment size on forest loss. A total of 87 100,000 km2 fragment groups were generated, with the first group consisting of 8414 fragments with a mean size of 12.4 km2. One fragment more than 100,000 km2 was paired with a fragment less than 100,000 km2 to form group num-ber 87. Sixteen remaining fragments exceeded 100,000 km2 and were appended as individual fragments, bringing the population of frag-ment groups to 103. We fitted linear regression lines using percent forest loss per fragment size group (100 × total loss area per group/total fragment area per group) as the dependent variable and the natural
Fig. 6. Distance of year 2000 forest to loss from 2001 to 2018. Plots depict fragment groups by mean size versus the distance to loss of the most distant (25%) quartile. The 17 largest pantropical fragments are highlighted for (A) Tropical America, (B) Tropical Africa, and (C) Tropical Asia. Data of distance to loss by 25, 50, and 75% quartiles may be found at https://glad.umd.edu/dataset/fate-tropical-forest-fragments.
on June 5, 2020http://advances.sciencem
ag.org/D
ownloaded from
Hansen et al., Sci. Adv. 2020; 6 : eaax8574 11 March 2020
S C I E N C E A D V A N C E S | R E S E A R C H A R T I C L E
8 of 9
logarithm of mean fragment size as the independent variable (Fig. 1). Regression relationships were also determined separately for primary forests and for protected areas using the original 103 fragment groups. The areal extent and loss of each theme was calculated per fragment, and percent loss for each fragment group was used as the dependent variable with the logarithm of mean fragment area for each group (based on the fragment area of the theme in 2000) used as the inde-pendent variable. The dependent variable percent loss was greater than 0% but less than 5% for all fragment groups, indicating that an approach such as beta regression to account for percent data con-strained to 0 to 100% was not required, and assessment of residual plots indicated that assumptions of ordinary least squares estimators were approximately satisfied.
Distance of forest to forest loss analysisOriginal year 2000 fragments were analyzed with respect to forest loss from 2001 to 2018. The distances of all land pixels from forest cover loss were calculated; each fragment was overlain, and the mean distance of all pixels from loss per fragment was calculated. In the calculation of distance, we sieved all loss using a 2-ha patch size thresh-old and resampled the sieved loss map to a 0.0025° by 0.0025° reso-lution to reduce the impacts of mapped loss commission errors. All remaining loss pixels were identified, and the distance of each remain-ing forest pixel to its nearest loss pixel was calculated. The mean distance per fragment group was calculated per year and for the en-tire study period.
Primary forest analysisHumid tropical primary forest data (18) were integrated with the orig-inal forest fragments to discriminate long-lived natural forests from tree cover associated with land uses. Primary forest pixels were sum-marized per fragment, and percent primary forest loss was tabulated and assigned to the respective 100,000 km2 fragment group within which the primary forest was located.
Protected area analysisWe investigated whether the deterministic impact of fragment size on forest loss held true for protected areas. We used the World Da-tabase on Protected Areas to determine the protected status of each forest fragment. Percent loss was calculated as a function of the forest extent and forest loss per protected area. However, each protected area was assigned a fragment size per the original fragment delinea-tion. In other words, if a protected area forest was itself a fragment, then it was assigned its own fragment size. However, most protected areas are located within larger fragments and were assigned the area of the larger fragment and its respective 100,000 km2 group.
SUPPLEMENTARY MATERIALSSupplementary material for this article is available at http://advances.sciencemag.org/cgi/content/full/6/11/eaax8574/DC1Fig. S1. Country data for total fragment area in 2000 and 2001–2018 forest loss area within fragments of >10 km2, lines reflect percentage of 2001–2018 loss from the year 2000 fragment area.Fig. S2. A locally adaptive procedure for delineating forest fragments in a heterogeneous forested landscape in southern Ghana.Fig. S3. A subset of Fig. 4 for Central Africa with example fragments from ~100, ~1000, 10,000, and 100,000 km2 and mega-fragment groupings.
REFERENCES AND NOTES 1. J. Barlow, T. A. Gardner, I. S. Araujo, T. C. Ávila-Pires, A. B. Bonaldo, J. E. Costa,
M. C. Esposito, L. V. Ferreira, J. Hawes, M. I. M. Hernandez, M. S. Hoogmoed, R. N. Leite,
N. F. Lo-Man-Hung, J. R. Malcolm, M. B. Martins, L. A. M. Mestre, R. Miranda-Santos, A. L. Nunes-Gutjahr, W. L. Overal, L. Parry, S. L. Peters, M. A. Ribeiro-Junior, M. N. F. da Silva, C. da Silva Motta, C. A. Peres, Quantifying the biodiversity value of tropical primary, secondary, and plantation forests. Proc. Natl. Acad. Sci. U.S.A. 104, 18555–18560 (2007).
2. G. C. Daily, Nature’s services: Societal, in Dependence on Natural Ecosystems, G.C. Daily, Ed. (Island Press, 1997).
3. L. Gibson, T. M. Lee, L. P. Koh, B. W. Brook, T. A. Gardner, J. Barlow, C. A. Peres, C. J. Bradshaw, W. F. Laurance, T. E. Lovejoy, N. S. Sodhi, Primary forests are irreplaceable for sustaining tropical biodiversity. Nature 478, 378–381 (2011).
4. F. Achard, R. Beuchle, P. Mayaux, H.-J. Stibig, C. Bodart, A. Brink, S. Carboni, B. Desclée, F. Donnay, H. D. Eva, A. Lupi, R. Raši, R. Seliger, D. Simonetti, Determination of tropical deforestation rates and related carbon losses from 1990 to 2010. Glob. Chang. Biol. 20, 2540–2554 (2014).
5. E. T. A. Mitchard, The tropical forest carbon cycle and climate change. Nature 559, 527–534 (2018).
6. E. N. Broadbent, G. P. Asner, M. Keller, D. E. Knapp, P. J. Oliveira, J. N. Silva, Forest fragmentation and edge effects from deforestation and selective logging in the brazilian amazon. Biol. Conserv. 141, 1745–1757 (2008).
7. C. Gascon, G. B. Williamson, G. A. da Fonseca, ECOLOGY. Receding forest edges and vanishing reserves. Science 288, 1356–1358 (2000).
8. N. M. Haddad, L. A. Brudvig, J. Clobert, K. F. Davies, A. Gonzalez, R. D. Holt, T. E. Lovejoy, J. O. Sexton, M. P. Austin, C. D. Collins, W. M. Cook, E. I. Damschen, R. M. Ewers, B. L. Foster, C. N. Jenkins, A. J. King, W. F. Laurance, D. J. Levey, C. R. Margules, B. A. Melbourne, A. O. Nicholls, J. L. Orrock, D.-X. Song, J. R. Townshend, Habitat fragmentation and its lasting impact on earth’s ecosystems. Sci. Adv. 1, e1500052 (2015).
9. G. P. Asner, D. E. Knapp, E. N. Broadbent, P. J. Oliveira, M. Keller, J. N. Silva, Selective logging in the brazilian amazon. Science 310, 480–482 (2005).
10. K. Brinck, R. Fischer, J. Groeneveld, S. Lehmann, M. D. De Paula, S. Pütz, J. O. Sexton, D. Song, A. Huth, High resolution analysis of tropical forest fragmentation and its impact on the global carbon cycle. Nat. Commun. 8, 14855 (2017).
11. R. Chaplin-Kramer, I. Ramler, R. Sharp, N. M. Haddad, J. S. Gerber, P. C. West, L. Mandle, P. Engstrom, A. Baccini, S. Sim, C. Mueller, H. King, Degradation in carbon stocks near tropical forest edges. Nat. Commun. 6, 10158 (2015).
12. W. F. Laurance, J. L. C. Camargo, R. C. C. Luizão, S. G. Laurance, S. L. Pimm, E. M. Bruna, P. C. Stouffer, G. B. Williamson, J. Benítez-Malvido, H. L. Vasconcelos, K. S. Van Houtan, C. E. Zartman, S. A. Boyle, R. K. Didham, A. Andrade, T. E. Lovejoyop, The fate of amazonian forest fragments: A 32-year investigation. Biol. Conserv. 144, 56–67 (2011).
13. S. Pütz, J. Groeneveld, K. Henle, C. Knogge, A. C. Martensen, M. Metz, J. P. Metzger, M. C. Ribeiro, M. D. de Paula, A. Huth, Long-term carbon loss in fragmented Neotropical forests. Nat. Commun. 5, 5037 (2014).
14. L. Qie, S. L. Lewis, M. J. P. Sullivan, G. Lopez-Gonzalez, G. C. Pickavance, T. Sunderland, P. Ashton, W. Hubau, K. A. Salim, S.-I. Aiba, L. F. Banin, N. Berry, F. Q. Brearley, D. F. R. P. Burslem, M. Dančák, S. J. Davies, G. Fredriksson, K. C. Hamer, R. Hédl, L. K. Kho, K. Kitayama, H. Krisnawati, S. Lhota, Y. Malhi, C. Maycock, F. Metali, E. Mirmanto, L. Nagy, R. Nilus, R. Ong, C. A. Pendry, A. D. Poulsen, R. B. Primack, E. Rutishauser, I. Samsoedin, B. Saragih, P. Sist, J. W. F. Slik, R. S. Sukri, M. Svátek, S. Tan, A. Tjoa, M. van Nieuwstadt, R. R. E. Vernimmen, I. Yassir, P. S. Kidd, M. Fitriadi, N. K. H. Ideris, R. M. Serudin, L. S. Abdullah Lim, M. S. Saparudin, O. L. Phillips, Long-term carbon sink in Borneo’s forests halted by drought and vulnerable to edge effects. Nat. Commun. 8, 1966 (2017).
15. F. Taubert, R. Fischer, J. Groeneveld, S. Lehmann, M. S. Müller, E. Rödig, T. Wiegand, A. Huth, Global patterns of tropical forest fragmentation. Nature 554, 519–522 (2018).
16. M. Tabarelli, C. Gascon, Lessons from fragmentation research: Improving management and policy guidelines for biodiversity conservation. Conserv. Biol. 19, 734–739 (2005).
17. M. C. Hansen, P. V. Potapov, R. Moore, M. Hancher, S. A. Turubanova, A. Tyukavina, D. Thau, S. V. Stehman, S. J. Goetz, T. R. Loveland, A. Kommareddy, A. Egorov, L. Chini, C. O. Justice, J. R. G. Townshend, High-resolution global maps of 21st-century forest cover change. Science 342, 850–853 (2013).
18. S. Turubanova, P. V. Potapov, A. Tyukavina, M. C. Hansen, Ongoing primary forest loss in Brazil, Democratic Republic of the Congo, and Indonesia. Environ. Res. Lett. 13, 074028 (2018).
19. L. Fahriga, V. Arroyo-Rodríguez, J. R. Bennett, V. Boucher-Lalonde, E. Cazetta, D. J. Currie, F. Eigenbrod, A. T. Ford, S. P. Harrison, J. A. G. Jaeger, N. Koper, A. E. Martin, J.-L. Martin, J. P. Metzger, P. Morrison, J. R. Rhodes, D. A. Saunders, D. Simberloff, A. C. Smith, L. Tischendorf, M. Vellend, J. I. Watling, Is habitat fragmentation bad for biodiversity? Biol. Conserv. 230, 179–186 (2019).
20. R. J. Fletcher Jr., R. K. Didham, C. Banks-Leite, J. Barlow, R. M. Ewers, J. Rosindell, R. D. Holt, A. Gonzalez, R. Pardini, E. I. Damschen, F. P. L. Melo, L. Ries, J. A. Prevedello, T. Tscharntke, W. F. Laurance, T. Lovejoy, N. M. Haddad, Is habitat fragmentation good for biodiversity? Biol. Conserv. 226, 9–15 (2018).
21. X.-P. Song, M. C. Hansen, S. V. Stehman, P. V. Potapov, A. Tyukavina, E. F. Vermote, J. R. Townshend, Global land change from 1982 to 2016. Nature 560, 639–643 (2018).
22. P. H. S. Brancalion, A. Niamir, E. Broadbent, R. Crouzeilles, F. S. M. Barros, A. M. Almeyda Zambrano, A. Baccini, J. Aronson, S. Goetz, J. L. Reid, B. B. N. Strassburg,
on June 5, 2020http://advances.sciencem
ag.org/D
ownloaded from
Hansen et al., Sci. Adv. 2020; 6 : eaax8574 11 March 2020
S C I E N C E A D V A N C E S | R E S E A R C H A R T I C L E
9 of 9
S. Wilson, R. L. Chazdon, Global restoration opportunities in tropical rainforest landscapes. Sci. Adv. 5, eaav3223 (2019).
23. K. Grogan, D. Pflugmacher, P. Hostert, O. Mertz, R. Fensholt, Unravelling the link between global rubber price and tropical deforestation in Cambodia. Nat. Plants 5, 47–53 (2019).
24. N. Grima, S. J. Singh, How the end of armed conflicts influence forest cover and subsequently ecosystem services provision? An analysis of four case studies in biodiversity hotspots. Land Use Policy 81, 267–275 (2019).
25. J. Nackoney, G. Molinario, P. Potapov, S. Turubanova, M. C. Hansen, T. Furuichi, Impacts of civil conflict on primary forest habitat in northern Democratic Republic of the Congo, 1990–2010. Biol. Conserv. 170, 321–328 (2014).
26. B. W. Griscom, J. Adams, P. W. Ellis, R. A. Houghton, G. Lomax, D. A. Miteva, W. H. Schlesinger, D. Shoch, J. V. Siikamäki, P. Smith, P. Woodbury, C. Zganjar, A. Blackman, J. Campari, R. T. Conant, C. Delgado, P. Elias, T. Gopalakrishna, M. R. Hamsik, M. Herrero, J. Kiesecker, E. Landis, L. Laestadius, S. M. Leavitt, S. Minnemeyer, S. Polasky, P. Potapov, F. E. Putz, J. Sanderman, M. Silvius, E. Wollenberg, J. Fargione, Natural climate solutions. Proc. Natl. Acad. Sci. U.S.A. 114, 11645–11650 (2017).
27. R. M. Pringle, Upgrading protected areas to conserve wild biodiversity. Nature 546, 91–99 (2017). 28. P. Jantz, S. Goetz, N. Laporte, Carbon stock corridors to mitigate climate change
and promote biodiversity in the tropics. Nat. Clim. Change 4, 138–142 (2014). 29. P. Potapov, M. C. Hansen, L. Laestadius, S. Turubanova, A. Yaroshenko, C. Thies, W. Smith,
I. Zhuravleva, A. Komarova, S. Minnemeyer, E. Esipova, The last frontiers of wilderness: Tracking loss of intact forest landscapes from 2000 to 2013. Sci. Adv. 3, e1600821 (2017).
30. L. Vincent, P. Soille, Watersheds in digital spaces: An efficient algorithm based on immersion simulations. IEEE Trans. Pattern Anal. Mach. Intell. 13, 583–598 (1991).
Acknowledgments Funding: This study was made possible through the Global Forest Watch project, supported by the government of Norway’s International Climate and Forest Initiative, and through support from the Gordon and Betty Moore Foundation. Author contributions: M.C.H. designed the research and wrote the manuscript. L.W. and X.-P.S. designed and implemented the research. A.T., S.T., and P.V.P. generated input datasets and evaluated the results. S.V.S. evaluated and implemented the statistical analyses. All authors edited the manuscript. Competing interests: The authors declare that they have no competing interests. Data and materials availability: Tropical forest fragment extent and loss data can be downloaded at https://glad.umd.edu/dataset/fate-tropical-forest-fragments. Percent tree cover and forest loss data can be downloaded at https://earthenginepartners.appspot.com/science-2013-global-forest/download_v1.5.html. Primary humid tropical data can be downloaded at https://glad.umd.edu/dataset/primary-forest-humid-tropics. World Database of Protected Areas data can be downloaded at www.unep-wcmc.org/resources-and-data/wdpa. All data needed to evaluate the conclusions in the paper are present in the paper and/or the Supplementary Materials. Additional data related to this paper may be requested from the authors.
Submitted 29 April 2019Accepted 3 December 2019Published 11 March 202010.1126/sciadv.aax8574
Citation: M. C. Hansen, L. Wang, X.-P. Song, A. Tyukavina, S. Turubanova, P. V. Potapov, S. V. Stehman, The fate of tropical forest fragments. Sci. Adv. 6, eaax8574 (2020).
on June 5, 2020http://advances.sciencem
ag.org/D
ownloaded from
The fate of tropical forest fragments
V. StehmanMatthew C. Hansen, Lei Wang, Xiao-Peng Song, Alexandra Tyukavina, Svetlana Turubanova, Peter V. Potapov and Stephen
DOI: 10.1126/sciadv.aax8574 (11), eaax8574.6Sci Adv
ARTICLE TOOLS http://advances.sciencemag.org/content/6/11/eaax8574
MATERIALSSUPPLEMENTARY http://advances.sciencemag.org/content/suppl/2020/03/09/6.11.eaax8574.DC1
REFERENCES
http://advances.sciencemag.org/content/6/11/eaax8574#BIBLThis article cites 29 articles, 8 of which you can access for free
PERMISSIONS http://www.sciencemag.org/help/reprints-and-permissions
Terms of ServiceUse of this article is subject to the
is a registered trademark of AAAS.Science AdvancesYork Avenue NW, Washington, DC 20005. The title (ISSN 2375-2548) is published by the American Association for the Advancement of Science, 1200 NewScience Advances
License 4.0 (CC BY-NC).Science. No claim to original U.S. Government Works. Distributed under a Creative Commons Attribution NonCommercial Copyright © 2020 The Authors, some rights reserved; exclusive licensee American Association for the Advancement of
on June 5, 2020http://advances.sciencem
ag.org/D
ownloaded from