ECOLOGICAL RISK ASSESSMENT GUIDANCE FOR … · Robert Davis Region VIII Gerry Henningsen,...
230
008889
Transcript of ECOLOGICAL RISK ASSESSMENT GUIDANCE FOR … · Robert Davis Region VIII Gerry Henningsen,...

008889

DISCLAIMER
The policies and procedures set forth here are intended as guidance to Agency and other governmentemployees. They do not constitute rule making by the Agency, and may not be relied on to create asubstantive or procedural right enforceable by any other person. The Government may take action that isat variance with the policies and procedures in this manual.
008890

iii
ACKNOWLEDGEMENTS
The authors wish to acknowledge all the reviewers that have assisted the authors with insightfulcomments and assistance. We also wish to acknowledge the assistance of the Response Engineering andAnalytic Contract Task Leader, Mark Huston and the editorial assistance of the ICF Consulting Group,primary editor Dr. Margaret McVey and Charles Chappell and Kimberly Osborn.
Mark D. Sprenger, Ph.D. David W. Charters, Ph.D.Environmental Response Team Center Environmental Response Team CenterOffice of Emergency & Remedial Response Office of Emergency & Remedial Response
Primary Reviewers:
Region I Susan Svirsky Region VI Susan RoddyPatti Tyler Jon Rauscher, Ph.D.
Region II Shari Stevens Region VII Steve WhartonRobert Koke
Region III Barbara O’Korn Root Robert Davis Region VIII Gerry Henningsen,
Ph.D.,D.V.M.Region IV Lynn Wellman Dale Hoff, Ph.D.
Region V Brenda JonesJames Chapman, Ph.D. Region IX Clarence Callahan, Ph.D.
Mark Wickstrom, D.V.M.
Ned Black, Ph.D.
Region X P. Bruce Duncan, Ph.D.Julius NwosuJoe Goulet, Ph.D.
Headquarters: . . . . . . . . . . . . . . . . . . . . . . . . . . . . . . . . . . . . . . . . . . . . . . . . Steve Ells
State of Texas: . . . . . . . . . . . . . . . . . . . . . . . . . . . . . . . . . . . . . . . . . . Larry Champagne
U.S. Fish & Wildlife Service: . . . . . . . . . . . . . . . . . . . . . . . . . . . . . . . . . . Nancy Finley
Peer Review Committee:David Anderson . . . . . . . . . . . . . . . . . . . . . Ecology & Environment, Taylor, MIJohn Bascietto . . . . . . . . . . . . . . . . . . . . . . . . . . . . . . . . . . . . . . . . . . . . . . DOETom Campbell . . . . . . . . . . . . . . . . . . . . . . . . . . Woodward Clyde, Denver, COCherri Bassinger-Daniel . . . . . . . . . . . . . . . State of MO, Department of HealthTom Dillon . . . . . . . . . . . . . . . . . . . . . . . . . . . . . . . . . . U.S. Corps of Engineers
008891

iv
Alyce Fritz . . . . . . . . . . . . . . . . . . . . . . . . . . . . . . . . . . . . . . . . . . . . . . . NOAADuncan Gilroy . . . . . . . . . . . . . . . . . . . . . . State of Oregon DEQ, Portland, ORJoe Greene . . . . . . . . . . . . . . . . . . . . . . . . . . . . . . . . . . . . . . . . . . . . . U.S. EPAMark Harkins . . . . . . . Science & Space Technical Committee, Washington, DCChris Ingersoll . . . . . . . . . . . . . . . . . . . . . . . . . . U.S. DOI/NBS, Columbia, MOMark Johnson . . . . . . . . . . . . . . . . . . . . . . . . . . . . . . U.S. Army, Aberdeen, MDLawrence Kapustka . . . . . . . . . . . . . . . . . . . . . . . . . . . . . . . . EPT, Seattle, WAAlan McIntosh . . . . . . . . . . . . . . . . . . . . . . . . . . . . . . . . University of VermontGary Mangels . . . . . . . . . . . . . . . . . . . . . . . . . . . . . . . . . . . American CyanamidMary Matta . . . . . . . . . . . . . . . . . . . . . . . . . . . . . . . . . . . . . . . . . . . . . . NOAAJennifer Roberts . . . . . . . . . . . . . . . . . . . . DOEC, State of Alaska, Department
of Environmental ConservationGlen W. Suter, II . . . . . . . . . . . . . . . . . . . Martin Marietta Energy Systems, Inc.
Oak Ridge National LaboratoryRandy Wentsel . . . . . . . . . . . . . . . . . . . . . . . . . . . . . . . . . . . . . . . . . U.S. ArmyJanet Whaley . . . . . . . . . . . . . . . . . . . . . . . . . . . . . . U.S. Army, Aberdeen, MD
Stakeholder Meeting Attendees:
Jeff Foran . . . . . . . . . . . . . . . . . . . . . . . . . . . . . . . . . . . . . . . Meeting FacilitatorJudith Bland . . . . . . . . . . . . . . . . . . . . . . . . . . . . . . . . . . . . . . . . . . . . . . . MerckJim Clark . . . . . . . . . . . . . . . . . . . . . . . . . . . . . . . . . Exxon Biomedical SciencesDavid Cragin . . . . . . . . . . . . . . . . . . . . . . . . . . . . . . . . . . . . . . . . . Elf AtochemSteve Geiger . . . . . . . . . . . . . . . . . . . . . . . . . . . . . . . . . Remediation TechnologySimeon Hahn . . . . . . . . . . . . . . . . . . . . . . . . . . . . . . . . . . . . . . . . . . . U.S. NavyDavid Hohreiter . . . . . . . . . . . . . . . . . . . . . . . . . . . . . Blasland, Bouck, and LeeKenneth Jenkins . . . . . . . . . . . . . . . consultant (Jenkins, Sanders, & Associates)
representing General ElectricLorraine Keller . . . . . . . . . . . . . . . . . . . . . . . . . . . . . . . . . . . . . . Rohm and HaasBryce Landenberger . . . . . . . . . . . . . . . . . . . . . . . . . . . . . . . . . . Dow ChemicalDale Marino . . . . . . . . . . . . . . . . . . . . . . . . . . . . . . . . . . . . . . . . Eastman KodakEllen Mihaich . . . . . . . . . . . . . . . . . . . . . . . . . . . . . . . . . . . . . . . Rhone-PoulencRon Porter . . . . . . . . . . . . . . . . . . . . . . . . . . . . . . . . . . . . . . . . . U.S. Air Force Mark Powell . . . . . . . . Center for Risk Management at Resources for the FutureLee Salamone . . . . . . . . . . . . . . . . . . . . . . . Chemical Manufacturers AssociationAnne Sergeant . . . . . . . . . . . . . . . . . . . . . . . . . . . . . . . . . . . . . . . . . . U.S. EPA Jean Snider . . . . . . . . . . . . . . . . . . . . . . . . . . . . . . . . . . . . . . . . . . . . . . . NOAARalph Stahl . . . . . . . . . . . . . . . . . . . . . . . . . . . . . . . . . . . . . . . . . . . . . . . DuPontRandy Wentsel . . . . . . . . . . . . . . . . . . . . . . . . . . . . . . . . . . . . . . . . . U.S. Army
008892

v
Observers at the Stakeholder Meeting:
Adam Ayers . . . . . . . . . . . . . . . . . . . . . . . . . . . . . . . . . . . . Geraghty and MillerSteve Ells . . . . . . . . . . . . . . . . . . . . . . . . . . . . . . . . . . . . . . . . . . . . . . U.S. EPAPaul Hirsh . . . . . . . . . . . . . . . . . . . . . . . . . . Chemical Manufacturers AssociationTeresa Larson . . . . . . . . . . . . . . . . . . . . . National Association of ManufacturersReo Menning . . . . . . . . . . . . . . . . . . . . . . . American Industrial Health Council Kevin Reinert . . . . . . . . . . . . . . . . . . . . . . . . . . . . . . . . . . . . . . . Rohm and HaasPhil Sandine . . . . . . . . . . . . . . . . . . . . . . . Environmental Liability ManagementWendy Sherman . . . . . . . . . . . . . . . . . . . . . Chemical Manufacturers AssociationTodd Slater . . . . . . . . . . . . . . . . . . . . . . . . . . . . . . . . . . . . . . . . . . Elf Atochem
008893

vi
CONTENTS
DISCLAIMER . . . . . . . . . . . . . . . . . . . . . . . . . . . . . . . . . . . . . . . . . . . . . . . . . . . . . . . . . . . . . iiACKNOWLEDGEMENTS . . . . . . . . . . . . . . . . . . . . . . . . . . . . . . . . . . . . . . . . . . . . . . . . . . . iiiLISTS OF EXHIBITS, EXAMPLES, AND HIGHLIGHTS . . . . . . . . . . . . . . . . . . . . . . . . . . ixLIST OF ACRONYMS AND ABBREVIATIONS . . . . . . . . . . . . . . . . . . . . . . . . . . . . . . . . . xiPREFACE . . . . . . . . . . . . . . . . . . . . . . . . . . . . . . . . . . . . . . . . . . . . . . . . . . . . . . . . . . . . . . . xiiiINTRODUCTION: ECOLOGICAL RISK ASSESSMENT FOR SUPERFUND . . . . . . . . . I-1
PURPOSE . . . . . . . . . . . . . . . . . . . . . . . . . . . . . . . . . . . . . . . . . . . . . . . . . . . . . . . . . . . . I-1SCOPE . . . . . . . . . . . . . . . . . . . . . . . . . . . . . . . . . . . . . . . . . . . . . . . . . . . . . . . . . . . . . . I-1BACKGROUND . . . . . . . . . . . . . . . . . . . . . . . . . . . . . . . . . . . . . . . . . . . . . . . . . . . . . . . I-1DEFINITION OF ECOLOGICAL RISK ASSESSMENT . . . . . . . . . . . . . . . . . . . . . . . . I-3THE ECOLOGICAL RISK ASSESSMENT PROCESS . . . . . . . . . . . . . . . . . . . . . . . . . I-3
STEP 1: SCREENING-LEVEL PROBLEM FORMULATION AND ECOLOGICALEFFECTS EVALUATION . . . . . . . . . . . . . . . . . . . . . . . . . . . . . . . . . . . . . . . . . 1-1
1.1 INTRODUCTION . . . . . . . . . . . . . . . . . . . . . . . . . . . . . . . . . . . . . . . . . . . . . . . . 1-11.2 SCREENING-LEVEL PROBLEM FORMULATION . . . . . . . . . . . . . . . . . . . . . 1-1
1.2.1 Environmental Setting and Contaminants at the Site . . . . . . . . . . . . . . . . . . 1-21.2.2 Contaminant Fate and Transport . . . . . . . . . . . . . . . . . . . . . . . . . . . . . . . . . 1-41.2.3 Ecotoxicity and Potential Receptors . . . . . . . . . . . . . . . . . . . . . . . . . . . . . . 1-41.2.4 Complete Exposure Pathways . . . . . . . . . . . . . . . . . . . . . . . . . . . . . . . . . . . 1-51.2.5 Assessment and Measurement Endpoints . . . . . . . . . . . . . . . . . . . . . . . . . . 1-6
1.3 SCREENING-LEVEL ECOLOGICAL EFFECTS EVALUATION . . . . . . . . . . . 1-81.3.1 Preferred Toxicity Data . . . . . . . . . . . . . . . . . . . . . . . . . . . . . . . . . . . . . . 1-91.3.2 Dose Conversions . . . . . . . . . . . . . . . . . . . . . . . . . . . . . . . . . . . . . . . . . . . 1-111.3.3 Uncertainty Assessment . . . . . . . . . . . . . . . . . . . . . . . . . . . . . . . . . . . . . . . 1-11
1.4 SUMMARY . . . . . . . . . . . . . . . . . . . . . . . . . . . . . . . . . . . . . . . . . . . . . . . . . . . . 1-12
STEP 2: SCREENING-LEVEL EXPOSURE ESTIMATEAND RISK CALCULATION . . . . . . . . . . . . . . . . . . . . . . . . . . . . . . . . . . . . . . . 2-1
2.1 INTRODUCTION . . . . . . . . . . . . . . . . . . . . . . . . . . . . . . . . . . . . . . . . . . . . . . . . 2-12.2 SCREENING-LEVEL EXPOSURE ESTIMATES . . . . . . . . . . . . . . . . . . . . . . . 2-1
2.2.1 Exposure Parameters . . . . . . . . . . . . . . . . . . . . . . . . . . . . . . . . . . . . . . . . . 2-22.2.2 Uncertainty Assessment . . . . . . . . . . . . . . . . . . . . . . . . . . . . . . . . . . . . . . . 2-3
2.3 SCREENING-LEVEL RISK CALCULATION . . . . . . . . . . . . . . . . . . . . . . . . . . 2-42.4 SCIENTIFIC/MANAGEMENT DECISION POINT (SMDP) . . . . . . . . . . . . . . 2-52.5 SUMMARY . . . . . . . . . . . . . . . . . . . . . . . . . . . . . . . . . . . . . . . . . . . . . . . . . . . . . 2-6
STEP 3: BASELINE RISK ASSESSMENT PROBLEM FORMULATION . . . . . . . . . . . 3-13.1 THE PROBLEM-FORMULATION PROCESS . . . . . . . . . . . . . . . . . . . . . . . . . 3-13.2 REFINEMENT OF PRELIMINARY CONTAMINANTS OF CONCERN. . . . . . 3-33.3 LITERATURE SEARCH ON KNOWN ECOLOGICAL EFFECTS . . . . . . . . . . 3-4
008894

vii
3.4 CONTAMINANT FATE AND TRANSPORT, ECOSYSTEMS POTENTIALLY AT RISK, AND COMPLETE EXPOSURE PATHWAYS . . . . . . . . . . . . . . . . . . 3-43.4.1 Contaminant Fate and Transport . . . . . . . . . . . . . . . . . . . . . . . . . . . . . . . . . 3-53.4.2 Ecosystems Potentially at Risk . . . . . . . . . . . . . . . . . . . . . . . . . . . . . . . . . . 3-63.4.3 Complete Exposure Pathways . . . . . . . . . . . . . . . . . . . . . . . . . . . . . . . . . . . 3-7
3.5 SELECTION OF ASSESSMENT ENDPOINTS . . . . . . . . . . . . . . . . . . . . . . . . 3-83.6 THE CONCEPTUAL MODEL AND RISK QUESTIONS . . . . . . . . . . . . . . . . 3-12
3.6.1 Conceptual Model . . . . . . . . . . . . . . . . . . . . . . . . . . . . . . . . . . . . . . . . . . 3-123.6.2 Risk Questions . . . . . . . . . . . . . . . . . . . . . . . . . . . . . . . . . . . . . . . . . . . . 3-13
3.7 SCIENTIFIC/MANAGEMENT DECISION POINT (SMDP) . . . . . . . . . . . . . . 3-143.8 SUMMARY . . . . . . . . . . . . . . . . . . . . . . . . . . . . . . . . . . . . . . . . . . . . . . . . . . . . 3-14
STEP 4: STUDY DESIGN AND DATA QUALITY OBJECTIVE PROCESS . . . . . . . . . 4-14.1 ESTABLISHING MEASUREMENT ENDPOINTS . . . . . . . . . . . . . . . . . . . . . . 4-2
4.1.1 Species/Community/Habitat Considerations . . . . . . . . . . . . . . . . . . . . . . 4-54.1.2 Relationship of the Measurement Endpoints to the Contaminant
of Concern . . . . . . . . . . . . . . . . . . . . . . . . . . . . . . . . . . . . . . . . . . . . . . . . 4-54.1.3 Mechanisms of Ecoxicity . . . . . . . . . . . . . . . . . . . . . . . . . . . . . . . . . . . . . 4-6
4.2 STUDY DESIGN . . . . . . . . . . . . . . . . . . . . . . . . . . . . . . . . . . . . . . . . . . . . . . . 4-64.2.1 Bioaccumulation and Field Tissue Residue Studies . . . . . . . . . . . . . . . . . . 4-74.2.2 Population/Community Evaluations . . . . . . . . . . . . . . . . . . . . . . . . . . . . 4-114.2.3 Toxicity Testing . . . . . . . . . . . . . . . . . . . . . . . . . . . . . . . . . . . . . . . . . . . 4-12
4.3 DATA QUALITY OBJECTIVES AND STATISTICAL CONSIDERATIONS . 4-134.3.1 Data Quality Objectives . . . . . . . . . . . . . . . . . . . . . . . . . . . . . . . . . . . . . 4-134.3.2 Statistical Considerations . . . . . . . . . . . . . . . . . . . . . . . . . . . . . . . . . . . . 4-14
4.4 CONTENTS OF WORK PLAN AND SAMPLING AND ANALYSIS PLAN . 4-144.4.1 Work Plan . . . . . . . . . . . . . . . . . . . . . . . . . . . . . . . . . . . . . . . . . . . . . . . 4-154.4.2 Sampling and Analysis Plan . . . . . . . . . . . . . . . . . . . . . . . . . . . . . . . . . . . 4-154.4.3 Field Verification of Sampling Plan and Contingency Plans . . . . . . . . . . . 4-16
4.5 SCIENTIFIC/MANAGEMENT DECISION POINT (SMDP) . . . . . . . . . . . . . . 4-174.6 SUMMARY . . . . . . . . . . . . . . . . . . . . . . . . . . . . . . . . . . . . . . . . . . . . . . . . . . . . 4-17
STEP 5: FIELD VERIFICATION OF SAMPLING DESIGN . . . . . . . . . . . . . . . . . . . . . . . 5-15.1 PURPOSE . . . . . . . . . . . . . . . . . . . . . . . . . . . . . . . . . . . . . . . . . . . . . . . . . . . . . . 5-15.2 DETERMINING SAMPLING FEASIBILITY . . . . . . . . . . . . . . . . . . . . . . . . . . 5-25.3 SCIENTIFIC/MANAGEMENT DECISION POINT (SMDP) . . . . . . . . . . . . . . . 5-35.4 SUMMARY . . . . . . . . . . . . . . . . . . . . . . . . . . . . . . . . . . . . . . . . . . . . . . . . . . . . . 5-4
STEP 6: SITE INVESTIGATION AND ANALYSIS PHASE . . . . . . . . . . . . . . . . . . . . . . . 6-16.1 INTRODUCTION . . . . . . . . . . . . . . . . . . . . . . . . . . . . . . . . . . . . . . . . . . . . . . . . 6-16.2 SITE INVESTIGATION . . . . . . . . . . . . . . . . . . . . . . . . . . . . . . . . . . . . . . . . . . 6-1
6.2.1 Changing Field Conditions . . . . . . . . . . . . . . . . . . . . . . . . . . . . . . . . . . . . 6-26.2.2 Unexpected Nature or Extent of Contamination . . . . . . . . . . . . . . . . . . . . 6-2
6.3 ANALYSIS OF ECOLOGICAL EXPOSURES AND EFFECTS . . . . . . . . . . . . . 6-3
008895

viii
6.3.1 Characterizing Exposures . . . . . . . . . . . . . . . . . . . . . . . . . . . . . . . . . . . . . 6-36.3.2 Characterizing Ecological Effects . . . . . . . . . . . . . . . . . . . . . . . . . . . . . . . 6-5
6.4 SCIENTIFIC/MANAGEMENT DECISION POINT (SMDP) . . . . . . . . . . . . . . . 6-66.5 SUMMARY . . . . . . . . . . . . . . . . . . . . . . . . . . . . . . . . . . . . . . . . . . . . . . . . . . . . . 6-7
STEP 7: RISK CHARACTERIZATION . . . . . . . . . . . . . . . . . . . . . . . . . . . . . . . . . . . . . . . 7-17.1 INTRODUCTION . . . . . . . . . . . . . . . . . . . . . . . . . . . . . . . . . . . . . . . . . . . . . . . . 7-17.2 RISK ESTIMATION . . . . . . . . . . . . . . . . . . . . . . . . . . . . . . . . . . . . . . . . . . . . . . 7-17.3 RISK DESCRIPTION . . . . . . . . . . . . . . . . . . . . . . . . . . . . . . . . . . . . . . . . . . . . 7-4
7.3.1 Threshold for Effects on Assessment Endpoints . . . . . . . . . . . . . . . . . . . . 7-47.3.2 Likelihood of Risk . . . . . . . . . . . . . . . . . . . . . . . . . . . . . . . . . . . . . . . . . . 7-57.3.3 Additional Risk Information . . . . . . . . . . . . . . . . . . . . . . . . . . . . . . . . . . . 7-5
7.4 UNCERTAINTY ANALYSIS . . . . . . . . . . . . . . . . . . . . . . . . . . . . . . . . . . . . . . . 7-57.4.1 Categories of Uncertainty . . . . . . . . . . . . . . . . . . . . . . . . . . . . . . . . . . . . 7-67.4.2 Tracking Uncertainties . . . . . . . . . . . . . . . . . . . . . . . . . . . . . . . . . . . . . . . 7-7
7.5 SUMMARY . . . . . . . . . . . . . . . . . . . . . . . . . . . . . . . . . . . . . . . . . . . . . . . . . . . . . 7-7
STEP 8: RISK MANAGEMENT . . . . . . . . . . . . . . . . . . . . . . . . . . . . . . . . . . . . . . . . . . . . . 8-18.1 INTRODUCTION . . . . . . . . . . . . . . . . . . . . . . . . . . . . . . . . . . . . . . . . . . . . . . . . 8-18.2 ECOLOGICAL RISK MANAGEMENT IN SUPERFUND . . . . . . . . . . . . . . . . . 8-1
8.2.1 Other Risk Management Considerations . . . . . . . . . . . . . . . . . . . . . . . . . . 8-28.2.2 Ecological Impacts of Remedial Options . . . . . . . . . . . . . . . . . . . . . . . . . . 8-38.2.3 Monitoring . . . . . . . . . . . . . . . . . . . . . . . . . . . . . . . . . . . . . . . . . . . . . . . 8-3
8.3 SCIENTIFIC/MANAGEMENT DECISION POINT (SMDP) . . . . . . . . . . . . . . . 8-48.4 SUMMARY . . . . . . . . . . . . . . . . . . . . . . . . . . . . . . . . . . . . . . . . . . . . . . . . . . . . . 8-4
BIBLIOGRAPHY . . . . . . . . . . . . . . . . . . . . . . . . . . . . . . . . . . . . . . . . . . . . . Bibliography-1GLOSSARY . . . . . . . . . . . . . . . . . . . . . . . . . . . . . . . . . . . . . . . . . . . . . . . . . . . . Glossary-1
APPENDIX A: EXAMPLE ECOLOGICAL RISK ASSESSMENTS FOR HYPOTHETICAL SITES
Example 1: Copper Site . . . . . . . . . . . . . . . . . . . . . . . . . . . . . . . . . . . . . . . . . . . . . . . A-1Example 2: Stream DDT Site . . . . . . . . . . . . . . . . . . . . . . . . . . . . . . . . . . . . . . . . . . . A-8Example 3: PCB Site . . . . . . . . . . . . . . . . . . . . . . . . . . . . . . . . . . . . . . . . . . . . . . . . . A-14
APPENDIX B: REPRESENTATIVE SAMPLING GUIDANCE DOCUMENT, VOLUME 3:BIOLOGICAL, DRAFT
U.S. Environmental Protection Agency (U.S. EPA). 1997. Representative Sampling Guidance Document,Volume 3: Ecological, Draft. Edison, NJ: Environmental Response Team, Office of Emergency and RemedialResponse.
APPENDIX C: SUPPLEMENTAL GUIDANCE ON LITERATURE SEARCHAPPENDIX D: STATISTICAL CONSIDERATIONS
008896
ix
LISTS OF EXHIBITS, EXAMPLES, AND HIGHLIGHTS
List of Exhibits
EXHIBIT I-1: Ecological Risk Assessment Framework . . . . . . . . . . . . . . . . . . . . . . . . I-5EXHIBIT I-2: Eight-step Ecological Risk Assessment Process for Superfund . . . . . . . I-9EXHIBIT I-3: Steps in the Ecological Risk AssessmentProcess and Corresponding
Decision Points in the Superfund Process . . . . . . . . . . . . . . . . . . . . . . . I-10EXHIBIT I-4: Ecological Risk Assessment Deliverables for the Risk Manager . . . . . I.11EXHIBIT I-5: Ecological Risk Assessment in the Remedial Investigation/Feasibility
Study (RI/FS) Process . . . . . . . . . . . . . . . . . . . . . . . . . . . . . . . . . . . . . I-13EXHIBIT 1-1: List of Sensitive Environments in the Hazard Ranking System . . . . . . . . 1-6EXHIBIT 6-1: Analysis Phase . . . . . . . . . . . . . . . . . . . . . . . . . . . . . . . . . . . . . . . . . . . . 6-4EXHIBIT 7-1: Risk Characterization . . . . . . . . . . . . . . . . . . . . . . . . . . . . . . . . . . . . . . 7-2EXHIBIT A-1: Conceptual Model for the Copper Site . . . . . . . . . . . . . . . . . . . . . . . . . A-5EXHIBIT A-2: Conceptual Model for the Stream DDT Site . . . . . . . . . . . . . . . . . . . A-11EXHIBIT A-3: Conceptual Model for the Terrestrial PCB Site . . . . . . . . . . . . . . . . . . A-17
List of Examples
EXAMPLE 1-1: Ecotoxicity!PCB Site . . . . . . . . . . . . . . . . . . . . . . . . . . . . . . . . . . . . . . 1-5EXAMPLE 1-2: Complete Exposure Pathways for Mammals!PCB Site . . . . . . . . . . . . . 1-8EXAMPLE 3-1: Exposure Pathway Model!DDT Site . . . . . . . . . . . . . . . . . . . . . . . . . . . 3-7EXAMPLE 3-2: Potential for Food Chain Transfer!Copper and DDT Sites . . . . . . . . . . . 3-8EXAMPLE 3-3: Assessment Endpoint Selection!DDT, Copper, and PCB Sites . . . . . . 3-11EXAMPLE 3-4: Description of the Conceptual Model!DDT Site . . . . . . . . . . . . . . . . . 3-12EXAMPLE 3-5: Conceptual Model Diagram!DDT Site . . . . . . . . . . . . . . . . . . . . . . . . 3-13EXAMPLE 4-1: Lines of Evidence!Copper Site . . . . . . . . . . . . . . . . . . . . . . . . . . . . . . . 4-4EXAMPLE 4-2: Selecting Measurement Endpoints!DDT Site . . . . . . . . . . . . . . . . . . . . 4-6EXAMPLE 4-3: Tissue Residue Studies!DDT Site . . . . . . . . . . . . . . . . . . . . . . . . . . . . . 4-9EXAMPLE 5-1: Field Verification of Sampling Design!Copper Site . . . . . . . . . . . . . . . . 5-4EXAMPLE 5-2: Field Verification of Sampling Design!DDT Site . . . . . . . . . . . . . . . . . . 5-5EXAMPLE 6-1: Fish Sampling Contingency Plan!DDT Site . . . . . . . . . . . . . . . . . . . . . . 6-2
008897

x
List of Highlights
HIGHLIGHT I-1: The RI/FS Process . . . . . . . . . . . . . . . . . . . . . . . . . . . . . . . . . . . . . . . . . I-2HIGHLIGHT I-2: Example Assessment Endpoints . . . . . . . . . . . . . . . . . . . . . . . . . . . . . . . I-6HIGHLIGHT I-3: Example Measurement Endpoints . . . . . . . . . . . . . . . . . . . . . . . . . . . . . I-6HIGHLIGHT I-4: Ecological Impact and Risk Assessment . . . . . . . . . . . . . . . . . . . . . . . . . I-8HIGHLIGHT 1-1: Screening-level Risk Assessments . . . . . . . . . . . . . . . . . . . . . . . . . . . . . 1-2HIGHLIGHT 1-2: Industrial or Urban Settings . . . . . . . . . . . . . . . . . . . . . . . . . . . . . . . . . . 1-4HIGHLIGHT 1-3: Exposure Pathway and Exposure Route . . . . . . . . . . . . . . . . . . . . . . . . . 1-7HIGHLIGHT 1-4: Non-Chemical Stressors . . . . . . . . . . . . . . . . . . . . . . . . . . . . . . . . . . . . . 1-9HIGHLIGHT 1-5: Data Hierarchy for Deriving Screening Ecotoxicity Values . . . . . . . . . . 1-10HIGHLIGHT 1-6: NOAEL Preferred to LOAEL . . . . . . . . . . . . . . . . . . . . . . . . . . . . . . . 1-11HIGHLIGHT 2-1: Area Use Factor . . . . . . . . . . . . . . . . . . . . . . . . . . . . . . . . . . . . . . . . . . . 2-2HIGHLIGHT 2-2: Hazard Index (HI) Calculation . . . . . . . . . . . . . . . . . . . . . . . . . . . . . . . . 2-5HIGHLIGHT 3-1: Tiering an Ecological Risk Assessment . . . . . . . . . . . . . . . . . . . . . . . . . 3-3HIGHLIGHT 3-2: Environmental Fate and Exposure . . . . . . . . . . . . . . . . . . . . . . . . . . . . . 3-5HIGHLIGHT 3-3: Definitions: Null and Test Hypotheses . . . . . . . . . . . . . . . . . . . . . . . . . 3-14HIGHLIGHT 4-1: Importance of Distinguishing Measurement from Assessment
Endpoints . . . . . . . . . . . . . . . . . . . . . . . . . . . . . . . . . . . . . . . . . . . . . . . 4-3HIGHLIGHT 4-2: Terminology and Definitions . . . . . . . . . . . . . . . . . . . . . . . . . . . . . . . . . 4-6HIGHLIGHT 4-3: Elements of a QAPP . . . . . . . . . . . . . . . . . . . . . . . . . . . . . . . . . . . . . . 4-17HIGHLIGHT 6-1: Uncertainty in Exposure Models . . . . . . . . . . . . . . . . . . . . . . . . . . . . . . 6-5
008898

xi
LIST OF ACRONYMS AND ABBREVIATIONS
AQUIRE: U.S. EPA's AQUatic Information REtrieval databaseARAR: Applicable or Relevant and Appropriate RequirementsASTM: American Society of Testing and MaterialsBAF: Bioaccumulation FactorBCF: Bioconcentration FactorBIOSIS: Biosciences Information ServicesBTAG: Biological Technical Assistance GroupCERCLA: Comprehensive Environmental Response, Compensation, and Liability ActCLP: Contract Laboratory ProgramDDT: DichlorodiphenyltrichloroethaneDQO: Data Quality ObjectiveEC : Effective Concentration for producing a specified effect in 50 percent of the test50
organismsEEC: Estimated Environmental ConcentrationEPA: Environmental Protection AgencyFS: Feasibility StudyFSP: Field Sampling PlanFWS: Fish and Wildlife ServiceHEAST: National Center for Environmental Assessment's Health Effects Assessment Summary TablesHI: Hazard IndexHQ: Hazard QuotientHSDB: National Library of Medicine's Hazardous Substances Data BankIRIS: EPA's Integrated Risk Information SystemLC : Concentration Lethal to 50 percent of the test organisms50
Li LiterLOAEL: Lowest-Observed-Adverse-Effect LevelNCP: National Oil and Hazardous Substances Pollution Contingency PlanNOAA: National Oceanic and Atmospheric AdministrationNOAEL: No-Observed-Adverse-Effect LevelNRC: National Research CouncilNRDA: Natural Resource Damage AssessmentOERR: U.S. EPA Office of Emergency and Remedial ResponseOSC: On-Scene CoordinatorOSWER: U.S. EPA Office of Solid Waste and Emergency ResponsePA Preliminary AssessmentPAH: Polycyclic Aromatic HydrocarbonsPCB: Polychlorinated Biphenyl compoundPRP: Potentially Responsible PartyQAPP: Quality Assurance Project PlanQA/QC: Quality Assurance and Quality ControlRBP: Rapid Bioassessment ProtocolRI: Remedial Investigation
008899

xii
ROD: Record of DecisionRPM: Remedial Project ManagerSAP: Sampling and Analysis PlanSARA: Superfund Amendments and Reauthorization Act of 1986SI: Site InvestigationSMDP: Scientific/Management Decision PointTOC: Total Organic CarbonWP: Work Plan
008900

xiii
PREFACE
This document provides guidance on the process of designing and conducting technically defensibleecological risk assessments for the Superfund Program. It is intended to promote consistency and ascience-based approach within the Program and is based on the Proposed Guidelines for Ecological RiskAssessment (1996a) and the Framework for Ecological Risk Assessment (1992a) developed by the RiskAssessment Forum of the U.S. Environmental Protection Agency. When the Agency publishes its finalGuidelines for Ecological Risk Assessment, this guidance will be reviewed and revised if necessary toensure consistency with the Agency guidelines.
This document is directed to the site managers (i.e., On-Scene Coordinators [OSCs] and RemedialProject Managers [RPMs]) who are legally responsible for the management of a site. However, it isanticipated that ecological risk assessors, as well as other individuals with input to the ecological riskassessment, will use this document.
Ecological risk assessment is an integral part of the Remedial Investigation and Feasibility Study(RI/FS) process, which is designed to support risk management decision-making for Superfund sites. TheRI component of the process characterizes the nature and extent of contamination at a hazardous waste siteand estimates risks to human health and the environment posed by contaminants at the site. The FScomponent of the process develops and evaluates remedial options. Thus, ecological risk assessment isfundamental to the RI and ecological considerations are also part of the FS process.
This document is intended to facilitate defensible site-specific ecological risk assessments. It isnot intended to determine the appropriate scale or complexity of an ecological risk assessment or todirect the user in the selection of specific protocols or investigation methods. Professional judgmentis essential in designing and determining the data needs for any ecological risk assessment. However,when the process outlined in this document is followed, a technically defensible and appropriately scaledsite-specific ecological risk assessment should result.
Ecological risk assessment is an interdisciplinary field drawing upon environmental toxicology,ecology, and environmental chemistry, as well as other areas of science and mathematics. It is importantthat users of this document understand that ecological risk assessment is a complex, non-linear process,with many parallel activities. The user should have a basic understanding of ecotoxicology and ecologicalrisk assessment and read through this document in its entirety prior to engaging in the ecological riskassessment process. Without the basic understanding of the field and of this guidance, the reader mightnot recognize the relationships among different components of the risk assessment process.
To assist the user in interpreting this guidance document, three illustrations of planning anecological risk assessment for a hazardous waste site are provided in Appendix A. These are simplified,hypothetical examples that demonstrate and highlight specific points in the ecological risk assessmentprocess. These examples are incomplete and not intended to present a thorough discussion of theecological or ecotoxicological issues that would exist at an actual site. Instead, they are intended toillustrate the first five steps of the process, which precede a full ecological field investigation.
008901

xiv
Excerpts from the three examples are included in the guidance document as "Example" boxes to illustratespecific points. The user is encouraged to read the three examples in Appendix A in addition to theExample boxes within the guidance document itself.
Ecological risk assessment is a dynamic field, and this document represents a process framework intowhich changes in ecological risk assessment approaches can readily be incorporated. Four appendices areincluded with this document; additional appendices may be developed to address specific issues.
This document supersedes the U.S. EPA's (1989b) Risk Assessment Guidance for Superfund, Volume 2:Environmental Evaluation Manual as guidance on how to design and conduct an ecological risk assessmentfor the Superfund Program. The Environmental Evaluation Manual contains useful information on thestatutory and regulatory basis of ecological assessment, basic ecological concepts, and other backgroundinformation that is not repeated in this document.
008902

I-1
INTRODUCTION:ECOLOGICAL RISK ASSESSMENT FOR SUPERFUND
PURPOSE
This document provides guidance on how to design and conduct consistent and technically defensibleecological risk assessments for the Superfund Program. It is based on the Proposed Guidelines forEcological Risk Assessment (1996a) and the Framework for Ecological Risk Assessment (1992a) developed bythe Risk Assessment Forum of the U.S. Environmental Protection Agency (U.S. EPA or the Agency). When theAgency finalizes its (1996a) Proposed Guidelines for Ecological Risk Assessment, this guidance will bereviewed and revised if necessary to ensure consistency with the Agency guidelines.
This document is directed to the site managers (i.e., On-Scene Coordinators [OSCs] and RemedialProject Managers [RPMs]) who are legally responsible for managing site activities. However, it isanticipated that the ecological risk assessors, as well as all other individuals involved with ecologicalrisk assessments, will use this document.
SCOPE
This document is intended to facilitate defensible and appropriately-scaled site-specific ecologicalrisk assessments. It is not intended to dictate the scale, complexity, protocols, data needs, orinvestigation methods for such assessments. Professional judgment is required to apply the processoutlined in this document to ecological risk assessments at specific sites.
BACKGROUND
Superfund Program
The Comprehensive Environmental Response, Compensation, and Liability Act of 1980 (CERCLA orSuperfund), as amended by the Superfund Amendments and Reauthorization Act of 1986 (SARA), authorizes theU.S. EPA to protect public health and welfare and the environment from the release or potential releaseof any hazardous substance, pollutant, or contaminant. U.S. EPA's Superfund Program carries out theAgency's mandate under CERCLA/SARA.
The primary regulation issued by U.S. EPA's Superfund Program is the National Oil and HazardousSubstances Pollution Contingency Plan (NCP). The NCP calls for the identification and mitigation ofenvironmental impacts (such as toxicity, bioaccumulation, death, reproductive impairment, growthimpairment, and loss of critical habitat) at hazardous waste sites, and for the selection of remedialactions to protect the environment. In addition, numerous other federal and state laws and regulationsconcerning environmental protection can be designated under Superfund as "applicable" or "relevant andappropriate" requirements (ARARs) for particular sites. Compliance with these other laws and regulationsgenerally requires an evaluation of site-related ecological effects and the measures necessary tomitigate those effects.
008903

I-2
HIGHLIGHT I-1The RI/FS Process
Risk assessment is an integral part of theRI/FS. The three parts of the RI are: (1)characterization of the nature and extent ofcontamination; (2) ecological risk assessment; and(3) human health risk assessment. Theinvestigation of the nature and extent ofcontamination determines the chemicals present onsite as well as their distribution andconcentrations. The ecological risk and humanhealth risk assessments determine the potential foradverse effects to the environment and humanhealth, respectively.
Risk Assessment in Superfund
An important part of the NCP is the requirementfor a Remedial Investigation and Feasibility Study(RI/FS) (see Highlight I-1). The RI/FS is ananalytical process designed to support riskmanagement decision-making for Superfund sites.The RI component of the process characterizes thenature and extent of contamination at a hazardouswaste site and estimates risks to human health andthe environment posed by contaminants at the site.The FS component of the process develops andevaluates remedial options.
Although U.S. EPA has established detailedguidelines for human health risk assessment in theSuperfund program (U.S. EPA, 1989a, 1991a,b),similarly detailed guidelines for site-specificecological risk assessment do not exist for theSuperfund program. Risk Assessment Guidance forSuperfund, Volume 2: Environmental EvaluationManual (U.S. EPA, 1989b) provides conceptual guidance in planning studies to evaluate a hazardous wastesite's "environmental resources" (as used in the manual, the phrase "environmental resources" is largelysynonymous with "ecological resources"). U.S. EPA also is publishing supplemental information onspecific ecological risk assessment topics for Superfund in the ECO Update series (U.S. EPA, 1995b,1994b,c,d,e, 1992b,c,d, 1991c,d). However, those documents do not describe an overall, step-by-stepprocess by which an ecological risk assessment is designed and executed. The Agency's Framework forEcological Risk Assessment (U.S. EPA, 1992a) provides a basic structure and a consistent approach forconducting ecological risk assessments, but is not intended to provide program-specific guidance. TheGuidelines for Ecological Risk Assessment, currently being developed by the Agency's Risk AssessmentForum (1996a), will expand on the Framework, but again, will not provide program-specific guidance.
This document outlines a step-by-step ecological risk assessment process that is both specific to theSuperfund Program and consistent with the more general U.S. EPA Framework and guidelines underdevelopment. While the Agency's Framework and future Agency-wide ecological risk assessment guidelinesare not enforceable regulations, the concepts in those documents are appropriate to Superfund. Theconcepts in the published Framework have been incorporated into this document with minimal modification.The definitions of terms used in this ecological risk assessment guidance for Superfund (and listed in theGlossary) are consistent with the definitions in the U.S. EPA Framework document unless noted otherwise.
008904

I-3
DEFINITION OF ECOLOGICAL RISK ASSESSMENT
U.S. EPA "Framework" Document
Ecological risk assessment is defined in the Framework as a process that evaluates the likelihood thatadverse ecological effects are occurring or may occur as a result of exposure to one or more stressors(U.S. EPA, 1992a). The Framework defines a stressor as any physical, chemical, or biological entity thatcan induce an adverse ecological response. Adverse responses can range from sublethal chronic effectsin individual organisms to a loss of ecosystem function. Although stressors can be biological (e.g.,introduced species), only chemical or physical stressors will be addressed in this document, because theseare the stressors subject to risk management decisions at Superfund sites.
Superfund Program
The phrase "ecological risk assessment," as used specifically for the Superfund Program in thisdocument, refers to a qualitative and/or quantitative appraisal of the actual or potential impacts ofcontaminants from a hazardous waste site on plants and animals other than humans and domesticated species.A risk does not exist unless: (1) the stressor has the ability to cause one or more adverse effects, and(2) it co-occurs with or contacts an ecological component long enough and at a sufficient intensity toelicit the identified adverse effect.
THE ECOLOGICAL RISK ASSESSMENT PROCESS
U.S. EPA "Framework" Document
The Framework describes the basic elements of a process for scientifically evaluating the adverseeffects of stressors on ecosystems and components of ecosystems. The document describes the basic processand principles to be used in ecological risk assessments conducted for the U.S. EPA, provides operationaldefinitions for terms used in ecological risk assessments, and outlines basic principles around whichprogram-specific guidelines for ecological risk assessment should be organized.
The Framework is similar to the National Research Council's (NRC) paradigm for human health riskassessments (NRC, 1983) and the more recent NRC ecological risk paradigm (NRC, 1993). The 1983 NRCparadigm consists of four fundamental phases: hazard identification, dose-response assessment, exposureassessment, and risk characterization. The Framework differs from the 1983 NRC paradigm in a few ways:
C Problem formulation is incorporated into the beginning of the process to determine the focusand scope of the assessment;
C Hazard identification and dose-response assessment are combined in an ecological effectsassessment phase; and
008905

I-4
C The phrase "dose-response" is replaced by "stressor-response" to emphasize the possibilitythat physical changes (which are not measured in "doses") as well as chemical contaminationcan stress ecosystems.
Moreover, the Framework emphasizes the parallel nature of the ecological effects and exposure assessmentsby joining the two assessments in an analysis phase between problem formulation and risk characterization,as shown in Exhibit I-1.
During problem formulation, the risk assessor establishes the goals, breadth, and focus of theassessment (U.S. EPA, 1992a). As indicated in the Framework, problem formulation is a systematic planningstep that identifies the major factors to be considered and is linked to the regulatory and policy contextsof the assessment. Problem formulation includes discussions between the risk assessor and risk manager,and other involved parties, to identify the stressor characteristics, ecosystems potentially at risk, andecological effects to be evaluated. During problem formulation, assessment and measurement endpoints forthe ecological risk assessment are identified, as described below.
The Agency defines assessment endpoints as explicit expressions of the actual environmental values(e.g., ecological resources) that are to be protected (U.S. EPA, 1992a). Valuable ecological resourcesinclude those without which ecosystem function would be significantly impaired, those providing criticalresources (e.g., habitat, fisheries), and those perceived as valuable by humans (e.g., endangered speciesand other issues addressed by legislation). Because assessment endpoints focus the risk assessment designand analysis, appropriate selection and definition of these endpoints are critical to the utility of arisk assessment.
Assessment endpoints should relate to statutory mandates (e.g., protection of the environment), butmust be specific enough to guide the development of the risk assessment study design at a particular site.Useful assessment endpoints define both the valued ecological entity at the site (e.g., a species,ecological resource, or habitat type) and a characteristic(s) of the entity to protect (e.g., reproductivesuccess, production per unit area, areal extent). Highlight I-2 provides some examples of specificassessment endpoints related to the general goal of protecting aquatic ecosystems.
A measurement endpoint is a measurable biological response to a stressor that can berelated to thevalued characteristic chosen as the assessment endpoint (U.S. EPA, 1992a; although this definition maychange—see U.S. EPA, 1996a). Sometimes, the assessment endpoint can be measured directly; usually,however, an assessment endpoint encompasses too many species or species that are difficult to evaluate(e.g., top-level predators). In these cases, the measurement endpoints are different from the assessmentendpoint, but can be used to make inferences about risks to the assessment endpoints. For example,measures of responses in particularly sensitive species and life stages might be used to infer responsesin the remaining species and life stages in a specific community. Such inferences must be clearlydescribed to demonstrate the link between measurement and assessment endpoints. Highlight I-3 providesexamples of measurement endpoints.
008906

I-5
008907

I-6
HIGHLIGHT I-2Example Assessment Endpoints
C Sustained aquatic community structure,including species composition andrelative abundance and trophicstructure.
C Sufficient rates of survival, growth,and reproduction to sustain populationsof carnivores typical for the area.
C Sustained fishery diversity andabundance.
HIGHLIGHT I-3Example Measurement Endpoints
C Communy anayss of benthicmacroinvertebrates.
C Survival and growth of fish fry in responseto exposure to copper.
C Community structure of fishery inproximity to the site.
Measures of exposure also can be used to make inferences about risks to assessment endpoints atSuperfund sites. For example, measures of water concentrations of a contaminant can be compared withconcentrations known from the literature to belethal to sensitive aquatic organisms to infersomething about risks to aquatic communitystructure. As a consequence, for purposes of thisguidance, measurement endpoints include bothmeasures of effect and measures of exposure.
A product of problem formulation is aconceptual model for the ecological riskassessment that describes how a given stressormight affect ecological components of theenvironment. The conceptual model also describesquestions about how stressors affect theassessment endpoints, the relationships among theassessment and measurement endpoints, the datarequired to answer the questions, and the methodsthat will be used to analyze the data (U.S. EPA,1992a).
Superfund Program
The goal of the ecological risk assessment process in the Superfund Program is to provide the riskinformation necessary to assist risk managers at Superfund sites (OSCs and RPMs) in making informeddecisions regarding substances designated ashazardous under CERCLA (see 40 CFR 302.4). Thespecific objectives of the process, as stated inOSWER Directive 9285.7-17, are: (1) to identifyand characterize the current and potential threatsto the environment from a hazardous substancerelease; and (2) to identify cleanup levels thatwould protect those natural resources from risk.Threats to the environment include existingadverse ecological impacts and the risk of suchimpacts in the future. Highlight I-4 provides anoverview of ecological risk assessment in theSuperfund Program.
008908

I-7
HIGHLIGHT I-4 Ecological Impact and Risk Assessment
Ecological risk assessment within the Superfund Program can be a risk evaluation (potentiallypredictive), impact evaluation, or a combination of those approaches. The functions of theecological risk assessment are to:
(1) Document whether actual or potential ecological risks exist at a site;
(2) Identify which contaminants present at a site pose an ecological risk; and
(3) Generate data to be used in evaluating cleanup options.
Ecological risk assessments can have their greatest influence on risk management at a site in theevaluation and selection of site remedies. The ecological risk assessment should identifycontamination levels that bound a threshold for adverse effects on the assessment endpoint. Thethreshold values provide a yardstick for evaluating the effectiveness of remedial options and can beused to set cleanup goals if appropriate.
To justify a site action based upon ecological concerns, the ecological risk assessment mustestablish that an actual or potential ecological threat exists at a site. The potential for (i.e.,risk of) impacts can be the threat of impacts from a future release or redistribution of contaminants,which could be avoided by taking actions on "hot spots" or source areas. Risk also can be viewed asthe likelihood that current impacts are occurring (e.g., diminished population size), although thiscan be difficult to demonstrate. For example, it may not be practical or technically possible todocument existing ecological impacts, either due to limited technique resolution, the localizednature of the actual impact, or limitations resulting from the biological or ecological constraintsof the field measurements (e.g., measurement endpoints, exposure point evaluation). Actuallydemonstrating existing impacts confirms that a "risk" exists. Evaluating a gradient of existingimpacts along a gradient of contamination can provide an stressor-response assessment that helps toidentify cleanup levels.
As noted above, the ecological risk assessment should provide the information needed to make riskmanagement decisions (e.g., to select the appropriate site remedy). A management option should notbe selected first, and then the risk assessment tailored to justify the option.
Problem formulation is the most critical step of an ecological risk assessment and must precede anyattempt to design a site investigation and analysis plan. To ensure that the risk manager can use theresults of an ecological risk assessment to inform risk management decisions for a Superfund site, it isimportant that all involved parties contribute to the problem formulation phase and that the risk manageris clearly identified to all parties. These parties include the remedial project manager (RPM), who isthe risk manager with ultimate responsibility for the site, the ecological risk assessment team, theRegional Superfund Biological Technical Assistance Group (BTAG), potentially responsible parties (PRPs),Natural Resource Trustees, and stakeholders in the natural resources at issue (e.g., local communities,state agencies) (U.S. EPA, 1994a, 1995b). The U.S. EPA's (1994a) Edgewater Consensus on an EPA Strategyfor Ecosystem Protection in particular calls for the Agency to develop a "place-driven" orientation, that
008909
I-8
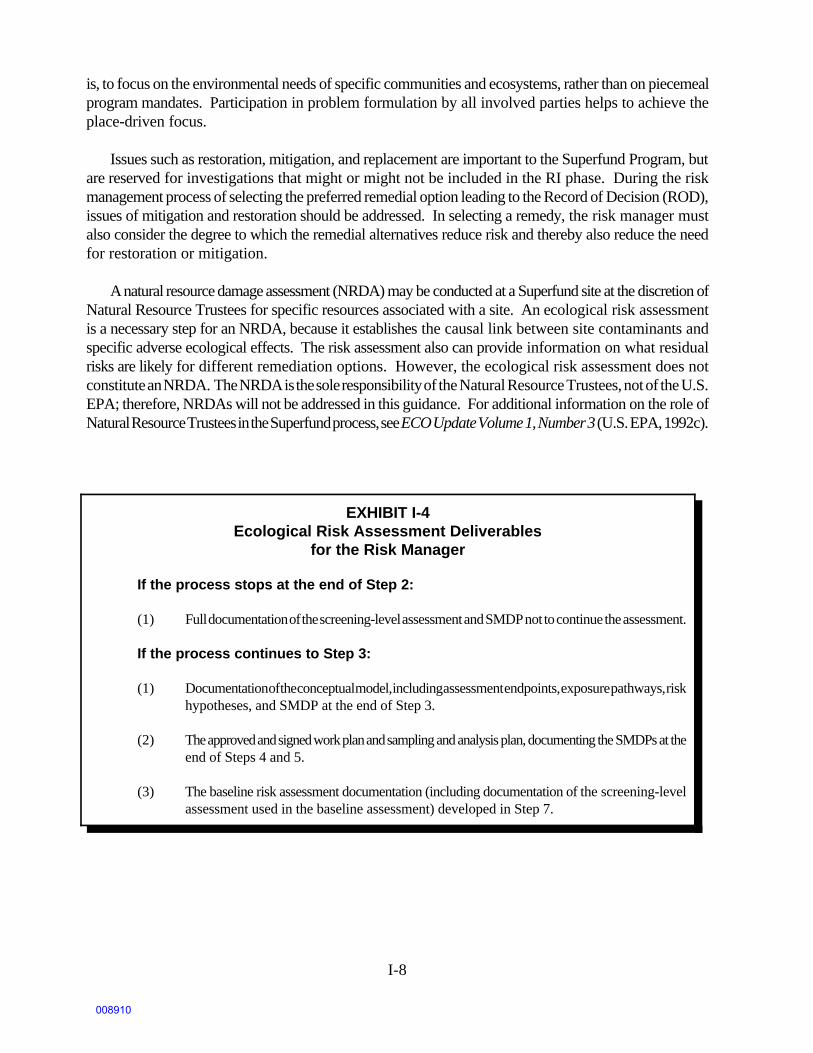
EXHIBIT I-4Ecological Risk Assessment Deliverables
for the Risk Manager
If the process stops at the end of Step 2:
(1) Full documentation of the screening-level assessment and SMDP not to continue the assessment.
If the process continues to Step 3:
(1) Documentation of the conceptual model, including assessment endpoints, exposure pathways, riskhypotheses, and SMDP at the end of Step 3.
(2) The approved and signed work plan and sampling and analysis plan, documenting the SMDPs at theend of Steps 4 and 5.
(3) The baseline risk assessment documentation (including documentation of the screening-levelassessment used in the baseline assessment) developed in Step 7.
is, to focus on the environmental needs of specific communities and ecosystems, rather than on piecemealprogram mandates. Participation in problem formulation by all involved parties helps to achieve theplace-driven focus.
Issues such as restoration, mitigation, and replacement are important to the Superfund Program, butare reserved for investigations that might or might not be included in the RI phase. During the riskmanagement process of selecting the preferred remedial option leading to the Record of Decision (ROD),issues of mitigation and restoration should be addressed. In selecting a remedy, the risk manager mustalso consider the degree to which the remedial alternatives reduce risk and thereby also reduce the needfor restoration or mitigation.
A natural resource damage assessment (NRDA) may be conducted at a Superfund site at the discretion ofNatural Resource Trustees for specific resources associated with a site. An ecological risk assessmentis a necessary step for an NRDA, because it establishes the causal link between site contaminants andspecific adverse ecological effects. The risk assessment also can provide information on what residualrisks are likely for different remediation options. However, the ecological risk assessment does notconstitute an NRDA. The NRDA is the sole responsibility of the Natural Resource Trustees, not of the U.S.EPA; therefore, NRDAs will not be addressed in this guidance. For additional information on the role ofNatural Resource Trustees in the Superfund process, see ECO Update Volume 1, Number 3 (U.S. EPA, 1992c).
008910

STEP 1: SCREENING-LEVEL:• Site Visit• Problem Formulation• Toxicity Evaluation
STEP 2: SCREENING-LEVEL:• Exposure Estimate• Risk Calculation
STEP 3: PROBLEM FORMULATION
Toxicity Evaluation
AssessmentEndpoints
Conceptual ModelExposure Pathways
Questions/Hypotheses
STEP 4: STUDY DESIGN AND DQO PROCESS• Lines of Evidence• Measurement Endpoints
Work Plan and Sampling and Analysis Plan
STEP 5: VERIFICATION OF FIELDSAMPLING DESIGN
STEP 6: SITE INVESTIGATION ANDDATA ANALYSIS
STEP 7: RISK CHARACTERIZATION
STEP 8: RISK MANAGEMENT
Com
pile
Exi
stin
gIn
form
atio
n
Risk Assessorand Risk Manager
Agreement
SMDP
SMDP
SMDP
SMDP
[SMDP]
SMDP
Dat
a C
olle
ctio
n
EXHIBIT I-2Eight-step Ecological Risk Assessment Process for Superfund
I-9
008911

I-10
EXHIBIT I-3Steps in the Ecological Risk Assessment Process
and Corresponding Decision Points in the Superfund Process
Steps and Scientific/Management Decision Points (SMDPs):
1. Screening-Level Problem Formulation and Ecological Effects Evaluation
2. Screening-Level Preliminary Exposure Estimate and Risk Calculation SMDP (a)
3. Baseline Risk Assessment Problem Formulation SMDP (b)
4. Study Design and Data Quality Objectives SMDP (c)
5. Field Verification of Sampling Design SMDP (d)
6. Site Investigation and Analysis of Exposureand Effects [SMDP]
7. Risk Characterization
8. Risk Management SMDP (e)
Corresponding Decision Points in the Superfund Process:
(a) Decision about whether a full ecological risk assessment is necessary.
(b) Agreement among the risk assessors, risk manager, and other involved parties on theconceptual model,including assessment endpoints, exposure pathways, and questions or risk hypotheses.
(c) Agreement among the risk assessors and risk manager on the measurement endpoints, study design, and data interpretation and analysis.
(d) Signing approval of the work plan and sampling and analysis plan for the ecological risk assessment.
(e) Signing the Record of Decision.
[SMDP] only if change to the sampling and analysis plan is necessary.
008912

I-11
This Guidance Document
This ecological risk assessment guidance for Superfund is composed of eight steps (see Exhibit I-2)and several scientific/management decision points (SMDPs) (see Exhibit I-3). An SMDP requires a meetingbetween the risk manager and risk assessment team to evaluate and approve or redirect the work up to thatpoint. (Consultation with the Regional BTAG is recommended for SMDPs (a) through (d) in Exhibit I-3.)The group decides whether or not the risk assessment is proceeding in a direction that is acceptable tothe risk assessors and manager. The SMDPs include a discussion of the uncertainty associated with the riskassessment, that might be reduced, if necessary, with increased effort. SMDPs are significantcommunication points which should be passed with the consensus of all involved parties. The risk managershould expect deliverables that document specific SMDPs as outlined in Exhibit I-4. This approach isintended to minimize both the cost of and time required for the Superfund risk assessment process.
This guidance provides a technically valid approach for ecological risk assessments at hazardous wastesites, although other approaches also can be valid. The discipline of ecological risk assessment isdynamic and continually evolving; the assessments rely on data that are complex and sometimes ambiguous.Thus, if an approach other than the one described in this guidance document is used, there must be cleardocumentation of the process, including process design and interpretation of the results, to ensure atechnically defensible assessment. Clear documentation, consistency, and objectivity in the assessmentprocess are necessary for the Superfund Program.
An interdisciplinary team including, but not limited to, biologists, ecologists, and environmentaltoxicologists, is needed to design and implement a successful risk assessment and to evaluate the weightof the evidence obtained to reach conclusions about ecological risks. Some of the many points at whichthe Superfund ecological risk assessment process requires professional judgment include:
C Determining the level of effort needed to assess ecological risk at a particular site;
C Determining the relevance of available data to the risk assessment;
C Designing a conceptual model of the ecological threats at a site and measures to assess thosethreats;
C Selecting methods and models to be used in the various components of the risk assessment;
C Developing assumptions to fill data gaps for toxicity and exposure assessments based on logic andscientific principles; and
C Interpreting the ecological significance of observed or predicted effects.
008913

I-12
The lead risk assessor should coordinate with appropriate professionals to make many of these decisions.Specialists are needed for the more technical questions concerning the risk assessment (e.g., which model,which assumptions).
This guidance document focuses on the risk assessment process in Superfund and does not address all ofthe issues that a risk manager will need to consider. After the risk assessment is complete, the riskmanager might require additional professional assistance in interpreting the implications of the baselineecological risk assessment and selecting a remedial option.
The risk assessment process must be structured to ensure that site management decisions can be madewithout the need for repeated studies or delays. The first two steps in the assessment process are astreamlined version of the complete Framework process and are intended to allow a rapid determination bythe risk assessment team and risk manager that the site poses no or negligible ecological risk, or toidentify which contaminants and exposure pathways require further evaluation. Steps 3 through 7 are amore detailed version of the complete Framework process.
The ecological risk assessment process should be coordinated with the overall RI/FS process to theextent possible. Overall site-assessment costs are minimized when the needs of the ecological and humanhealth risk assessments are incorporated into the chemical sampling program to determine the nature andextent of contamination during the RI. For sites at which an RI has not yet been planned or conducted,Exhibit I-5 illustrates the relationship between the eight ecological risk assessment steps and theoverall Superfund process and decision points. For older sites at which an RI was conducted before anecological risk assessment was considered, the ecological risk assessment process should build on theinformation already developed for the site.
It is important to realize that this eight-step approach is not a simple linear or sequential process.The order of actions taken will depend upon the stage of the RI/FS atwhich the site is currently, theamount and types of site information available, as well as other factors. The process can be iterative,and in some iterations, certain individual steps might not be needed. In many cases, it might beappropriate and desirable to conduct several steps concurrently.
Tasks that should be accomplished in each of the eight steps in Exhibits I-2 and I-3 are described inthe eight following sections. The eight sections include example boxes based on the three hypotheticalSuperfund sites in Appendix A as well as exhibits and highlight boxes.
008914

EXHIBIT I-5Ecological Assessment in the RI/FS Process
SREENINGECOLOGICAL RISK
ASSESSMENT
(STEPS 1 & 2)
ANALYSIS OFEXPOSURE AND EFFECTSRISK CHARACTERIZATION
(STEPS 6 & 7)
Conduct riskevaluation of
remedialalternatives
Refine remedialgoals based onrisk assessment
FROM:• Preliminary Assessment• Site Inspection• NPL Listing
RI/FSScoring
WPandSAP
SiteInvestigation
EstablishRemedialObjectives
Developmentand Analysis
of Alternatives
TO:• Remedy Selection• Record of Decision• Remedial Design• Remedial Action
Remedial Investigation Feasibility Study
PROBLEMFORMULATION AND
STUDY DESIGN
(STEPS 3 & 4)
FIELDVERIFICATION
(STEP 5)
EcologicalMonitoring
I-13
008915

I-14
008916

1-1
OVERVIEW
The screening-level problem formulation and ecological effects evaluation is part of theinitial ecological risk screening assessment. For this initial step, it is likely that site-specific information for determining the nature and extent of contamination and for characterizingecological receptors at the site is limited. This step includes all the functions of problemformulation (more fully described in Steps 3 and 4) and ecological effects analysis, but on ascreening level. The results of this step will be used in conjunction with exposure estimates inthe preliminary risk calculation in Step 2.
STEP 1: SCREENING-LEVEL PROBLEM FORMULATIONAND ECOLOGICAL EFFECTS EVALUATION
1.1 INTRODUCTION
Step 1 is the screening-level problem formulation process and ecological effects evaluation(Highlight 1-1 defines screening-level risk assessments). Consultation with the BTAG is recommended atthis stage. How to brief the BTAG on the setting, history, and ecology of a site is described in ECO UpdateVolume 1, Number 5 (U.S. EPA, 1992d). Section 1.2 describes the screening-level problem formulation, andSection 1.3 describes the screening-level ecological effects evaluation. Section 1.4 summarizes thisstep.
1.2 SCREENING-LEVEL PROBLEM FORMULATION
For the screening-level problem formulation, the risk assessor develops a conceptual model for thesite that addresses five issues:
(1) Environmental setting and contaminants known or suspected to exist at the site (Section1.2.1);
(2) Contaminant fate and transport mechanisms that might exist at the site (Section 1.2.2);
(3) The mechanisms of ecotoxicity associated with contaminants and likely categories of receptorsthat could be affected (Section 1.2.3);
008917

1-2
HIGHLIGHT 1-1Screening-level Risk Assessments
Screening-level risk assessments are simplified riskassessments that can be conducted with limited data byassuming values for parameters for which data are lacking.At the screening level, it is important to minimize thechances of concluding that there is no risk when in fact arisk exists. Thus, for exposure and toxicity parametersfor which site-specific information is lacking, assumedvalues should consistently be biased in the direction ofoverestimating risk. This ensures that sites that mightpose an ecological risk are studied further. Without thisbias, a screening evaluation could not provide a defensibleconclusion that negligible ecological risk exists or thatcertain contaminants and exposure pathways can beeliminated from consideration.
(4) What complete exposure pathways mightexist at the site (a complete exposurepathway is one in which the chemical canbe traced or expected to travel from thesource to a receptor that can beaffected by the chemical) (Section1.2.4); and
(5) Selection of endpoints to screen forecological risk (Section 1.2.5).
1.2.1 Environmental Setting andContaminants at the Site
To begin the screening-level problemformulation, there must be at least a rudimentaryknowledge of the potential environmental setting andchemical contamination at the site. The first stepis to compile information from the site history and from reports related to the site, including thePreliminary Assessment (PA) or Site Investigation (SI). The second step is to use the environmentalchecklist presented in Representative Sampling Guidance Document, Volume 3: Ecological (U.S. EPA, 1997;see Appendix B) to begin characterizing the site for problem formulation. Key questions addressed by thechecklist include:
C What are the on- and off-site land uses (e.g., industrial, residential, or undeveloped; currentand future)?
C What type of facility existed or exists at the site?
C What are the suspected contaminants at the site?
C What is the environmental setting, including natural areas (e.g., upland forest, on-site stream,nearby wildlife refuge) as well as disturbed/man-made areas (e.g., waste lagoons)?
C Which habitats present on site are potentially contaminated or otherwise disturbed?
C Has contamination migrated from source areas and resulted in "off-site" impacts or the threatof impacts in addition to on-site threats or impacts?
These questions should be answered using the site reports, maps (e.g, U.S. Geological Survey, NationalWetlands Inventory), available aerial photographs, communication with appropriate agencies (e.g., U.S.Fish and Wildlife Service, National Oceanic and Atmospheric Administration, State Natural HeritagePrograms), and a site visit. Activities that should be conducted during the site visit include:
008918

1-3
C Note the layout and topography of the site;
C Note and describe any water bodies and wetlands;
C Identify and map evidence indicating contamination or potential contamination (e.g., areas of no vegetation, runoff gullies to surface waters);
C Describe existing aquatic, terrestrial, and wetland ecological habitat types (e.g., forest, oldfield), and estimate the area covered by those habitats;
C Note any potentially sensitive environments (see Section 1.2.3 for examples of sensitive environments);
C Describe and, if possible, map soil and water types, land uses, and the dominant vegetationspecies present; and
C Record any observations of animal species or sign of a species.
Mapping can be useful in establishing a "picture" of the site to assist in problem formulation. Thecompleted checklist (U.S. EPA, 1997) will provide information regarding habitats and species potentiallyor actually present on site, potential contaminant migration pathways, exposure pathways, and thepotential for non-chemical stresses at the site.
After finishing the checklist, it might be possible to determine that present or future ecologicalimpacts are negligible because complete exposure pathways do not exist and could not exist in the future.Many Superfund sites are located in highly industrialized areas where there could be few if any ecologicalreceptors or where site-related impacts might be indistinguishable from non-site-related impacts (seeHighlight 1-2). For such sites, remediation to reduce ecological risks might not be needed. However, allsites should be evaluated by qualified personnel to determine whether this conclusion is appropriate.
Other Superfund sites are located in less disturbed areas with protected or sensitive environmentsthat could be at risk of adverse effects from contaminants from the site. State and federal laws (e.g.,the Clean Water Act, the Endangered Species Act) designate certain types of environments as requiringprotection. Other types of habitats unique to certain areas also could need special consideration in therisk assessment (see Section 1.2.3).
008919

1-4
HIGHLIGHT 1-2Industrial or Urban Settings
Many hazardous waste sites exist incurrently or historically industrialized orurbanized areas. In these instances, it can bedifficult to distinguish between impactsrelated to contaminants from a particular siteand impacts related to non-contaminantstressors or to contaminants from other sites.However, even in these cases, it could beappropriate to take some remedial actionsbased on ecological risks. These actions mightbe limited to source removal or might be moreextensive. An ecological risk assessment canassist the risk manager in determining whataction, if any, is appropriate.
1.2.2 Contaminant Fate and Transport
During problem formulation, pathways for migrationof a contaminant (e.g., windblown dust, surface waterrunoff, erosion) should be identified. These pathwayscan exhibit a decreasing gradient of contamination withincreasing distance from a site. There are exceptions,however, because physical and chemical characteristicsof the media also influence contaminant distribution(e.g., the pattern of sediment deposition in streamsvaries depending on stream flow and bottomcharacteristics). For the screening-level riskassessment, the highest contaminant concentrationsmeasured on the site should be documented for eachmedium.
1.2.3 Ecotoxicity and Potential Receptors
Understanding the toxic mechanism of a contaminanthelps to evaluate the importance of potential exposure pathways (see Section 1.2.4) and to focus theselection of assessment endpoints (see Section 1.2.5). Some contaminants, for example, affect primarilyvertebrate animals by interfering with organ systems not found in invertebrates or plants (e.g., distaltubules of vertebrate kidneys, vertebrate hormone systems). Other substances might affect primarilycertain insect groups (e.g., by interfering with hormones needed for metamorphosis), plants (e.g.,herbicides), or other groups of organisms. For substances that affect, for example, reproduction ofmammals at much lower environmental exposure levels than they affect other groups of organisms, thescreening-level risk assessment can initially focus on exposure pathways and risks to mammals. Example1-1 illustrates this point using the PCB site example provided in Appendix A. A review of some of the morerecent ecological risk and toxicity assessment literature can help identify likely effects of the morecommon contaminants at Superfund sites.
An experienced biologist or ecologist can determine what plants, animals, and habitats exist or canbe expected to exist in the area of the Superfund site. Exhibit 1-1, adapted from the Superfund HazardRanking System, is a partial list of types of sensitive environments that could require protection orspecial consideration. Information obtained for the environmental checklist (Section 1.2.1), existinginformation and maps, and aerial photographs should be used to identify the presence of sensitiveenvironments on or near a site that might be threatened by contaminants from the site.
008920

1-5
EXAMPLE 1-1Ecotoxicity!!PCB Site
Some PCBs are reproductive toxins in mammals (Ringer et al., 1972; Aulerich et al., 1985; Wren et al., 1991;Kamrin and Ringer, 1996). When ingested, they induce (i.e., increase concentrations and activity of) enzymes inthe liver, which might affect the metabolism of some steroid hormones (Rice and O'Keefe, 1995). Whatever themechanism of action, several physiological functions that are controlled by steroid hormones can be altered bythe exposure of mammals to certain PCBs, and reproduction appears to be the most sensitive endpoint for PCBtoxicity in mammals (Rice and O'Keefe, 1995). Given this information, the screening ecological risk assessmentshould include potential exposure pathways for mammals to PCBs that are reproductive toxins (see Example 1-2).
HIGHLIGHT 1-3Exposure Pathway and
Exposure Route
Exposure Pathway: The pathway by which acontaminant travels from a source (e.g., drums,contaminated soils) to receptors. A pathway caninvolve multiple media (e.g., soil runoff tosurface waters and sedimentation, orvolatilization to the atmosphere).
Exposure Route: A point of contact/entry of acontaminant from the environment into an organism(e.g., inhalation, ingestion, dermal absorption).
1.2.4 Complete Exposure Pathways
Evaluating potential exposure pathways is one of the primary tasks of the screening-level ecologicalcharacterization of the site. For an exposure pathway to be complete, a contaminant must be able to travelfrom the source to ecological receptors and to be taken up by the receptors via one or more exposureroutes. (Highlight 1-3 defines exposure pathway and exposure route.) Identifying complete exposurepathways prior to a quantitative evaluation of toxicity allows the assessment to focus on only thosecontaminants that can reach ecological receptors.
Different exposure routes are important fordifferent groups of organisms. For terrestrialanimals, three basic exposure routes need to beevaluated: inhalation, ingestion, and dermalabsorption. For terrestrial plants, rootabsorption of contaminants in soils and leafabsorption of contaminantsevaporating from thesoil or deposited on the leaves are of concern atSuperfund sites. For aquatic animals, directcontact (of water or sediment with the gills orintegument) and ingestion of food (and sometimessediments) should be considered. For aquaticplants, direct contact with water, and sometimeswith air or sediments, is of primary concern.
The most likely exposure pathways and exposureroutes also are related to the physical andchemical properties of the contaminant (e.g., whether or not the contaminant is bound to a matrix, suchas organic carbon). Of the basic exposure routes identified above, more information generally isavailable to quantify exposure levels for ingestion by terrestrial animals and for direct contact withwater or sediments by aquatic organisms than for other exposure routes and receptors. Although other
008921

1-6
exposure routes can be important, moreassumptions are needed to estimate exposure levels for those routes,and the results are less certain. Professional judgment is needed to determine if evaluating those routessufficiently improves a risk assessment to warrant the effort.
If an exposure pathway is not complete for a specific contaminant (i.e., ecological receptors cannotbe exposed to the contaminant), that exposure pathway does not need to be evaluated further. For example,suppose a contaminant that impairs reproduction in mammals occurs only in soils that are well below theroot zone of plants that occur or are expected to occur on a site. Herbivorous mammals would not be exposedto the contaminant through their diets because plants would not be contaminated. Assuming that most soilmacroinvertebrates available for ingestion live in the root zone, insectivorous mammals also would beunlikely to be exposed. In this case, a complete exposure pathway for this contaminant for ground-dwelling mammals would not exist, and the contaminant would not pose a significant risk to this group oforganisms. Secondary questions might include whether the contaminant is leaching from the soil to groundwater that discharges to surface water, thereby posing a risk to the aquatic environment or to terrestrialmammals that drink the water or consume aquatic prey. Example 1-2 illustrates the process of identifyingcomplete exposure pathways based on the hypothetical PCB site described in Appendix A.
1.2.5 Assessment and Measurement Endpoints
For the screening-level ecological risk assessment, assessment endpoints are any adverse effects onecological receptors, where receptors are plant and animal populations and communities, habitats, andsensitive environments. Adverse effects on populations can be inferred from measures related to impairedreproduction, growth, and survival. Adverse effects on communities can be inferred from changes incommunity structure or function. Adverse effects on habitats can be inferred from changes in compositionand characteristics that reduce the habitats' ability to support plant and animal populations andcommunities.
Many of the screening ecotoxicity values now available or likely to be available in the future for theSuperfund program (see Section 1.3) are based on generic assessment endpoints (e.g., protection of aquaticcommunities from changes in structure or function) and are assumed to be widely applicable to sites aroundthe United States.
008922

1-7
EXHIBIT 1-1List of Sensitive Environments in the Hazard Ranking Systema
Critical habitat for Federal designated endangered or threatened speciesMarine SanctuaryNational ParkDesignated Federal Wilderness AreaAreas identified under the Coastal Zone Management ActSensitive areas identified under the National Estuary Program or Near Coastal Waters ProgramCritical areas identified under the Clean Lakes ProgramNational MonumentNational Seashore Recreational AreaNational Lakeshore Recreational AreaHabitat known to be used by Federal designated or proposed endangered or threatened speciesNational PreserveNational or State Wildlife RefugeUnit of Coastal Barrier Resources SystemCoastal Barrier (undeveloped)Federal land designated for protection of natural ecosystemsAdministratively Proposed Federal Wilderness AreaSpawning areas critical for the maintenance of fish/shellfish species within river, lake, or
coastal tidal watersMigratory pathways and feeding areas critical for maintenance of anadromous fish species within river
reaches or areas in lakes or coastal tidal waters in which the fish spend extended periods of timeTerrestrial areas utilized for breeding by large or dense aggregations of animalsNational river reach designated as RecreationalHabitat known to be used by state designated endangered or threatened speciesHabitat known to be used by species under review as to its Federal endangered or threatened statusCoastal Barrier (partially developed)Federally-designated Scenic or Wild RiverState land designated for wildlife or game managementState-designated Scenic or Wild RiverState-designated Natural AreasParticular areas, relatively small in size, important to maintenance of unique biotic communitiesState-designated areas for protection or maintenance of aquatic lifeWetlandsb
The categories are listed in groups from those assigned higher factor values to those assigned lower factor valuesa
in the Hazard Ranking System (HRS) for listing hazardous waste sites on the National Priorities List (U.S. EPA, 1990b).See Federal Register, Vol. 55, pp. 51624 and 51648 for additional information regardingdefinitions.
Under the HRS, wetlands are rated on the basis of size. See Federal Register, Vol. 55, pp. 51625 and 51662 forb
additional information.
008923

1-8
EXAMPLE 1-2Complete Exposure Pathways for Mammals!!PCB Site
Three possible exposure pathways for mammals were evaluated at the PCB Site: inhalation, ingestion throughthe food chain, and incidental soil/sediment ingestion.
Inhalation. PCBs are not highly volatile, so the inhalation of PCB vapors by mammals would be an essentiallyincomplete exposure pathway. Inhalation of PCBs adsorbed to soil particles might need consideration in areas withexposed soils, but this site is well vegetated.
Ingestion through the food chain. PCBs tend to bioaccumulate and biomagnify in food chains. PCBsin soils are not taken up by most plants, but are accumulated by soil macroinvertebrates. Thus, in areas withoutsignificant soil deposition on the surfaces of plants, mammalian herbivores would not be exposed to PCBs in mostof their diet. In contrast, mammalian insectivores, such as shrews, could be exposed to PCBs in most of theirdiet. For PCBs, the ingestion route for mammals would be essentially incomplete for herbivores but complete forinsectivores. For the PCB site, therefore, the ingestion exposure route for a mammalian insectivore (e.g., shrew)would be a complete exposure pathway that should be evaluated.
Incidental soil/sediment ingestion. Mammals can ingest some quantity of soils or sedimentsincidentally, as they groom their fur or consume plants or animals from the soil. Burrowing mammals are likelyto ingest greater quantities of soils during grooming than non-burrowing mammals, and mammals that consume plantroots or soil-dwelling macroinvertebrates are likely to ingest greater quantities of soils attached to thesurface of their foods than mammals that consume other foods. The intake of PCBs from incidental ingestion of PCB-contaminated soils is difficult to estimate, but for insectivores that forage at ground level, it is likely tobe far less than the intake of PCBs in the diet. For herbivores, the incidental intake of PCBs in soils might behigher than the intake of PCBs in their diet, but still less than the intake of PCBs by mammals feeding on soilmacroinvertebrates. Thus, the exposure pathway for ground-dwelling mammalian insectivores remains the exposurepathway that should be evaluated.
1.3 SCREENING-LEVEL ECOLOGICAL EFFECTS EVALUATION
The next step in the screening-level risk assessment is the preliminary ecological effects evaluationand the establishment of contaminant exposure levels that represent conservative thresholds for adverseecological effects. In this guidance, those conservative thresholds are called screening ecotoxicityvalues. Physical stresses unrelated to contaminants at the site are not the focus of the risk assessment(see Highlight 1-4), although they can be considered later when evaluating effects of remedialalternatives. A literature search for studies that quantify toxicity (i.e., exposure-response) is necessary to evaluatethe likelihood of toxic effects in different groups of organisms. Appendix C provides a basicintroduction to conducting a literature search, but an expert should be consulted to minimize time andcosts. The toxicity profile should describe the toxic mechanisms of action for the exposure routes beingevaluated and the dose or environmental concentration that causes a specified adverse effect.
008924

It is possible to conduct a screening risk assessment with limited information and conservative assumptions. If site-specific1
information is too limited, however, the risk assessment is almost certain to move into Steps 3 through 7, which require field-collected data. The more complete the initial information, the better the decision that can be made at this preliminary stage.
1-9
HIGHLIGHT 1-4Non-Chemical Stressors
Ecosystems can be stressed by physical, as wellas by chemical, alterations of their environment.For this reason, EPA's (1992a) Framework forEcological Risk Assessment addresses "stressor-response" evaluation to include all types of stressinstead of "dose-response" or "exposure-response"evaluation, which implies that the stressor must bea toxic substance.
For Superfund sites, however, the baseline riskassessment addresses risks from hazardoussubstances released to the environment, not risksfrom physical alterations of the environment,unless caused indirectly by a hazardous substances(e.g., loss of vegetation from a chemical releaseleading to serious erosion). This guidancedocument, therefore, focuses on exposure-responseevaluations for toxic substances. Physicaldestruction of habitat that might be associatedwith a particular remedy is considered in theFeasibility Study.
For each complete exposure pathway, route, andcontaminant, a screening ecotoxicity value shouldbe developed. The U.S. EPA Office of Emergency and1
Remedial Response has developed screeningecotoxicity values [called ecotox threshold values(U.S. EPA, 1996c)]. The values are for surfacewaters and sediments, and are based on directexposures routes only; bioaccumulation andbiomagnification in food chains have not beenaccounted for. The following subsections describepreferred data (Section 1.3.1), dose conversions(Section 1.3.2), and analyzing uncertainty in thevalues (Section 1.3.3).
1.3.1 Preferred Toxicity Data
Screening ecotoxicity values should represent ano-observed-adverse-effect-level (NOAEL) for long-term (chronic) exposures to a contaminant.Ecological effects of most concern are those thatcan impact populations (or higher levels ofbiological organization). Those include adverseeffects on development, reproduction, andsurvivorship. Community-level effects also can beof concern, but toxicity data on community-levelendpoints are limited and might be difficult toextrapolate from one community to another.
When reviewing the literature, one should be aware of the limitations of published information incharacterizing actual or probable hazards at a specific site. U.S. EPA discourages reliance on secondaryreferences because study details relevant for determining the applicability of findings to a given siteusually are not reported in secondary sources. Only primary literature that has been carefully reviewedby an ecotoxicologist should be used to support a decision. Several considerations and data preferencesare summarized in Highlight 1-5 and described more fully below.
NOAELS and LOAELS. For each contaminant for which a complete exposure pathway/route exists,the literature should be reviewed for the lowest exposure level (e.g., concentration in water or in thediet, ingested dose) shown to produce adverse effects (e.g.,reduced growth, impaired reproduction,increased mortality) in a potential receptor species. This value is called a lowest-observed-adverse-
008925

The literature reviews of McNamara (1976) and Weil and McCollister (1963) included both rodent and non-rodent species. The2
duration of the subchronic exposure usually was 90 days, but ranged from 30 to 210 days. A wide variety of endpoints and criteriafor adverse effects were included in these reviews. Despite this variation in the original studies, their findings provide ageneral indication of the ratio between subchronic to chronic NOAELs for effects other than cancer and reproductive effects. Forsome chemicals, chronic dosing resulted in increased chemical tolerance. For over 50 percent of the compounds tested, thechronic NOAEL was less than the 90-day NOAEL by a factor of 2 or less. However, in a few cases, the chronic NOAEL was up to afactor of 10 less than the subchronic NOAEL (U.S. EPA, 1993e).
1-10
HIGHLIGHT 1-5Data Hierarchy for Deriving
Screening Ecotoxicity Values
To develop a chronic NOAEL for a screeningecotoxicity value from existing literature, thefollowing data hierarchy minimizes extrapolationsand uncertainties in the value:
C A NOAEL is preferred to a LOAEL, which ispreferred to an LC or an EC .50 50
C Long-term (chronic) studies are preferred tomedium-term (subchronic) studies, which arepreferred to short-term (acute) studies.
C If exposure at the site is by ingestion,dietary studies are preferred to gavagestudies, which are preferred to non-ingestionroutes of exposure. Similarly, if exposure atthe site is dermal, dermal studies arepreferred to studies using other exposureroutes.
effect-level or LOAEL. For those contaminants withdocumented adverse effects, one also should identifythe highest exposure level that is a NOAEL. A NOAEL ismore appropriate than a LOAEL to use as an screeningecotoxicity value to ensure that risk is notunderestimated (see Highlight 1-6). However, NOAELscurrently are not available for many groups oforganisms and many chemicals. When a LOAEL value, butnot a NOAEL value, is available from the literature, astandard practice is to multiply the LOAEL by 0.1 andto use the product as the screening ecotoxicity value.Support for this practice comes from a data reviewindicating that 96 percent of chemicals included in thereview had LOAEL/NOAEL ratios of five or less, and thatall were ten or less (Dourson and Stara, 1983).
Exposure duration. Data from studies ofchronic exposure are preferable to data from medium-term (subchronic), short-term (acute), or single-exposure studies because exposures at Superfundremedial sites usually are long-term. Literaturereviews by McNamara (1976) and Weil and McCollister(1963) indicate that chronic NOAELs can be lower than2
subchronic (90-day duration for rats) NOAELs by up toa factor of ten .2
Exposure route. The exposure route and mediumused in the toxicity study should be comparable to theexposure route in the risk assessment. For example, data from studies where exposure is by gavagegenerally are not preferred for estimating dietary concentrations that could produce adverse effects,because the rate at which the substance is absorbed from the gastrointestinal tract usually is greaterfollowing gavage than following dietary administration. Similarly, intravenous injection of a substanceresults in "instantaneous absorption" and does not allow the substance to first pass through the liver,as it would following dietary exposure. If it is necessary to attempt to extrapolate toxicity test resultsfrom one route of exposure to another, the extrapolation should be performed or reviewed by a toxicologistexperienced in route-to-route extrapolations for the class of animals at issue.
008926

1-11
HIGHLIGHT 1-6NOAEL Preferred to LOAEL
Because the NOAEL and LOAEL are estimated byhypothesis testing (i.e., by comparing the responselevel of a test group to the response level of acontrol group for a statistically significantdifference), the actual proportion of the testanimals showing the adverse response at anidentified LOAEL depends on sample size,variability of the response, and the dose interval.LOAELs, and even NOAELs, can represent a 30 percentor higher effect level for the minimum sample sizesrecommended for standard test protocols. For thisreason, U.S. EPA recommends that the moreconservative NOAELs, instead of LOAELs, are used todetermine a screening exposure level that isunlikely to adversely impact populations. If dose-response data are available, a site-specific low-effect level may be determined.
Field versus laboratory. Most toxicity studies evaluate effects of a single contaminant on asingle species under controlled laboratory conditions. Results from these studies might not be directlyapplicable to the field, where organisms typically are exposed to more than one contaminant inenvironmental situations that are not comparable to a laboratory setting and where genetic compositionof the population can be more heterogeneous than that of organisms bred for laboratory use. In addition,the bioavailability of a contaminant might be different at a site than in a laboratory toxicity test. Ina field situation, organisms also will be subject to other environmental variables, such as unusualweather conditions, infectious diseases, and food shortages. These variables can have either positiveor negative effects on the organism's response to a toxic contaminant that only a site-specific fieldstudy would be able to evaluate. Moreover, single-species toxicity tests seldom provide informationregarding toxicant-related changes in community interactions (e.g., behavioral changes in prey speciesthat make them more susceptible to predation).
1.3.2 Dose Conversions
For some data reported in the literature,conversions are necessary to allow the data to beused for species other than those tested or formeasures of exposure other than those reported.Many doses in laboratory studies are reported interms of concentration in the diet (e.g., mgcontaminant/kg diet or ppm in the diet). Dietaryconcentrations can be converted to dose (e.g., mgcontaminant/kg body weight/day) for comparison withestimated contaminant intake levels in the receptorspecies.
When converting doses, it is important to identifywhether weights are measured as wet or dry weights.Usually, body weights are reported on a wet-weight,not dry-weight basis. Concentration of thecontaminant in the diet might be reported on a wet-or dry-weight basis.
Ingestion rates and body weights for a testspecies often are reported in a toxicity study or can be obtained from other literature sources (e.g., U.S.EPA, 1993a,b). For extrapolations between animal species with different metabolic rates as well asdietary composition, consult U.S. EPA 1992e and 1996b.
1.3.3 Uncertainty Assessment
Professional judgment is needed to determine the uncertainty associated with information taken from theliterature and any extrapolations used in developing a screening ecotoxicity value. The risk assessor
008927

1-12
should be consistently conservative in selecting literature values and describe the limitations of usingthose values in the context of a particular site. Consideration of the study design, endpoints, and otherfactors are important in determining the utility of toxicity data in the screening-level risk assessment.All of those factors should be addressed in a brief evaluation of uncertainties prior to the screening-level risk calculation.
1.4 SUMMARY
At the conclusion of the screening-level problem formulation and ecological effects evaluation, thefollowing information should have been compiled:
C Environmental setting and contaminants known or suspected to exist at the site and the maximumconcentrations present (for each medium);
C Contaminant fate and transport mechanisms that might exist at the site;The mechanisms of ecotoxicity associated with contaminants and likely categories of receptors that could be affected;
C The complete exposure pathways that might exist at the site from contaminant sources to receptorsthat could be affected; and
C Screening ecotoxicity values equivalent to chronic NOAELs based on conservative assumptions.
For the screening-level ecological risk assessment, assessment endpoints will include any likelyadverse ecological effects on receptors for which exposure pathways are complete, as determined from theinformation listed above. Measurement endpoints will be based on the available literature regardingmechanisms of toxicity and will be used to establish the screening ecotoxicity values. Those values willbe used with estimated exposure levels to screen for ecological risks, as described in Step 2.
008928

2-1
OVERVIEW
The screening-level exposure estimate and risk calculation comprise the second step in theecological risk screening for a site. Risk is estimated by comparing maximum documented exposureconcentrations with the ecotoxicity screening values from Step 1. At the conclusion of Step 2, therisk manager and risk assessment team will decide that either the screening-level ecological riskassessment is adequate to determine that ecological threats are negligible, or the process shouldcontinue to a more detailed ecological risk assessment (Steps 3 through 7). If the processcontinues, the screening-level assessment serves to identify exposure pathways and preliminarycontaminants of concern for the baseline risk assessment by eliminating those contaminants andexposure pathways that pose negligible risks.
STEP 2: SCREENING-LEVEL EXPOSURE ESTIMATEAND RISK CALCULATION
2.1 INTRODUCTION
This step includes estimating exposure levels and screening for ecological risks as the last two phasesof the screening-level ecological risk assessment. The process concludes with a SMDP at which it isdetermined that: (1) ecological threats are negligible; (2) the ecological risk assessment shouldcontinue to determine whether a risk exists; or (3) there is a potential for adverse ecological effects,and a more detailed ecological risk assessment, incorporating more site-specific information, is needed.
Section 2.2 describes the screening-level exposure assessment, focusing on the complete exposurepathways identified in Step 1. Section 2.3 describes the risk calculation process, including estimatinga hazard quotient, documenting the uncertainties in the quotient, and summarizing the overall confidencein the screening-level ecological risk assessment. Section 2.4 describes the SMDP that concludes Step2.
2.2 SCREENING-LEVEL EXPOSURE ESTIMATES
To estimate exposures for the screening-level ecological risk calculation, on-site contaminant levelsand general information on the types of biological receptors that might be exposed should be known fromStep 1. Only complete exposure pathways should be evaluated. For these, the highest measured or estimatedon-site contaminant concentration for each environmental medium should be used to estimate exposures.This should ensure that potential ecological threats are not missed.
008929

2-2
HIGHLIGHT 2-1Area-use Factor
An animal's area-use factor can be defined asthe ratio of the area of contamination (or the sitearea under investigation) to the area used by theanimal, e.g., its home range, breeding range, orfeeding/foraging range. To ensure that ecologicalrisks are not underestimated, the highest densityand smallest area used by each animal should beassumed. This allows the maximum number of animalsto be exposed to site contaminants and makes it morelikely that "hot spots" (i.e., areas of unusuallyhigh contamination levels) will be significantproportions of an individual animal's home range.
2.2.1 Exposure Parameters
For parameters needed to estimate exposures for which sound site-specific information is lacking ordifficult to develop, conservative assumptions should be used at this screening level. Examples ofconservative assumptions are listed below and described in the following paragraphs:
C Area-use factor ! 100 percent (factor related to home range and population density; see Highlight2-1);
C Bioavailability ! 100 percent;
C Life stage ! most sensitive life stage;
C Body weight and food ingestion rate! minimum body weight to maximum ingestionrate; and
C Dietary composition ! 100 percent of dietconsists of the most contaminated dietarycomponent.
Area-use factor. For the screening level exposure estimate for terrestrial animals, assume that thehome range of one or more animals is entirely within the contaminated area, and thus the animals areexposed 100 percent of the time. This is a conservative assumption and, as an assumption, is onlyapplicable to the screening-level phase of the risk assessment. Species- and site-specific home rangeinformation would be needed later, in Step 6, to estimate more accurately the percentage of time an animalwould use a contaminated area. Also evaluate the possibility that some species might actually focus theiractivities in contaminated areas of the site. For example, if contamination has reduced emergentvegetation in a pond, the pond might be more heavily used for feeding by waterfowl than uncontaminatedponds with little open water.
Bioavailability. For the screening-level exposure estimate, in the absence of site-specificinformation, assume that the bioavailability of contaminants at the site is 100 percent. For example, atthe screening-level, lead would be assumed to be 100 percent bioavailable to mammals. While someliterature indicates that mammals absorb approximately 10 percent of ingested lead, absorption efficiencycan be higher, up to about 60 percent, because dietary factors such as fasting, and calcium and phosphatecontent of the diet, can affect the absorption rate (Kenzaburo, 1986). Because few species have beentested for bioavailability, and because Steps 3 through 6 provide an opportunity for this issue to beaddressed specifically, the most conservative assumption is appropriate for this step.
008930

2-3
Life stage. For the screening-level assessment, assume that the most sensitive life stages arepresent. If an early life stage is the most sensitive, the population should be assumed to include or tobe in that life stage. For vertebrate populations, it is likely that most of the population is not in themost sensitive life stage most of the time. However, for many invertebrate species, the entire populationcan be at an early stage of development during certain seasons.
Body weight and food ingestion rates. Estimates of body weight and food ingestion rates ofthe receptor animals also should be made conservatively to maximize the dose (intake of contaminants) ona body-weight basis and to avoid understating risk, although uncertainties in these factors are far lessthan the uncertainties associated with the environmental contaminant concentrations. U.S. EPA's WildlifeExposure Factors Handbook (U.S. EPA, 1993a,b) is a good source or reference to sources of thisinformation.
Bioaccumulation. Bioaccumulation values obtained from a literature search can be used to estimatecontaminant accumulation and food-chain transfer at a Superfund site at the screening stage. Because manyenvironmental factors influence the degree of bioaccumulation, sometimes by several orders of magnitude,the most conservative (i.e., highest) bioaccumulation factor (BAF) reported in the literature should beused in the absence of site-specific information.
Dietary composition. For species that feed on more than one type of food, the screening-levelassumption should be that the diet is composed entirely of whichever type of food is most contaminated.For example, if some foods (e.g., insects) are likely to be more contaminated than other foods (e.g., seedsand fruits) typical in the diet of a receptor species, assume that the receptor species feeds exclusivelyon the more contaminated type of food. Again, EPA's Wildlife Exposure Factors Handbook (U.S. EPA,1993a,b) is a good source or reference to sources of this information.
2.2.2 Uncertainty Assessment
Professional judgment is needed to determine the uncertainty associated with information taken from theliterature and any extrapolations used in developing a parameter to estimate exposures. All assumptionsused to estimate exposures should be stated, including some description of the degree of bias possible ineach. Where literature values are used, an indication of the range of values that could be consideredappropriate also should be indicated.
008931

HQ'DoseNOAEL
or HQ'EEC
NOAEL
2-4
HIGHLIGHT 2-2Hazard Index (HI) Calculation
For contaminants that produce adverse effects by thesame toxic mechanism:
Hazard Index = EEC /NOAEL +1 1
EEC /NOAEL + 2 2
+ EEC /NOAELi i
where:
EEC = estimated environmental concentration fori
the i contaminant; andth
NOAELi = NOAEL for the i contaminant (expressedth
either as a dose or environmental concentration).
The EEC and the NOAEL are expressed in the same units andrepresent the same exposure period (e.g., chronic). Dosecould be substituted for EEC throughout provided the NOAELis expressed as a dose.
2.3 SCREENING-LEVEL RISK CALCULATION
A quantitative screening-level risk can be estimated using the exposure estimates developed accordingto Section 2.2 and the screening ecotoxicity values developed according to Section 1.3. For thescreening-level risk calculation, the hazard quotient approach, which compares point estimates ofscreening ecotoxicity values and exposure values, is adequate to estimate risk. As described in Section1.3, a screening ecotoxicity value should be equivalent to a documented and/or best conservativelyestimated chronic NOAEL. Thus, for each contaminant and environmental medium, the hazard quotient canbe expressedas the ratio of a potential exposure level to the NOAEL:where:
HQ = hazard quotient;
Dose = estimated contaminant intake at the site (e.g., mg contaminant/kg body weight per day);
EEC = estimated environmental concentration at the site (e.g., mg contaminant/L water, mgcontaminant/kg soil, mg contaminant/kg food); and
NOAEL = no-observed-adverse-effects-level (inunits that match the dose or EEC).
An HQ less than one (unity) indicates that thecontaminant alone is unlikely to cause adverseecological effects. If multiple contaminants ofpotential ecological concern exist at the site, itmight be appropriate to sum the HQs for receptors thatcould be simultaneously exposed to the contaminantsthat produce effects by the same toxic mechanism (U.S.EPA, 1986a). The sum of the HQs is called a hazard index(HI); (see Highlight 2-2). An HI less than oneindicates that the group of contaminants is unlikely tocause adverse ecological effects. An HQ or HI less thanone does not indicate the absence of ecological risk;rather, it should be interpreted based on the severityof the effect reported and the magnitude of thecalculated quotient. As certainty in the exposureconcentrations and the NOAEL increase, there is greaterconfidence in the predictive value of the hazardquotient model, and unity (HQ = 1) becomes a morecertain pass/fail decision point.
008932

2-5
The screening-level risk calculation is a conservative estimate to ensure that potential ecologicalthreats are not overlooked. The calculation is used to document a decision about whether or not there isa negligible potential for ecological impacts, based on the information available at this stage. If thepotential for ecological impacts exists, this calculation can be used to eliminate the negligible-riskcombinations of contaminants and exposure pathways from further consideration.
If the screening-level risk assessment indicates that adverse ecological effects arepossible at environmental concentrations below standard quantitation limits, a "non detect" based onthose limits cannot be used to support a "no risk" decision. Instead, the risk assessment team and riskmanager should request appropriate detection limits or agree to continue to Steps 3 through 7, whereexposure concentrations will be estimated from other information (e.g., fate-and-transport modeling,assumed or 0 estimated values for non-detects).
2.4 SCIENTIFIC/MANAGEMENT DECISION POINT (SMDP)
At the end of Step 2, the lead risk assessor communicates the results of the preliminary ecological riskassessment to the risk manager. The risk manager needs to decide whether the information available isadequate to make a risk management decision and might require technical advice from the ecological riskassessment team to reach a decision. There are only three possible decisions at this point:
(1) There is adequate information to conclude that ecological risks are negligible and therefore noneed for remediation on the basis of ecological risk;
(2) The information is not adequate to make a decision at this point, and the ecological riskassessment process will continue to Step 3; or
(3) The information indicates a potential for adverse ecological effects, and a more thoroughassessment is warranted.
Note that the SMDP made at the end of the screening-level risk calculation will not set a preliminarycleanup goal. Screening ecotoxicity values are derived to avoid underestimating risk. Requiring acleanup based solely on those values would not be technically defensible.
The risk manager should document both the decision and the basis for it. If the risk characterizationsupports the first decision (i.e., negligible risk), the ecological risk assessment process ends here withappropriate documentation to support the decision. The documentation should include all analyses andreferences used in the assessment, including a discussion of the uncertainties associated with the HQ andHI estimates.
For assessments that proceed to Step 3, the screening-level analysis in Step 2 can indicate and justifywhich contaminants and exposure pathways can be eliminated from further assessment because they areunlikely to pose a substantive risk. (If new contaminants are discovered or contaminants are found athigher concentrations later in the site investigation, those contaminants might need to be added to theecological risk assessment at that time.)
008933

2-6
U.S. EPA must be confident that the SMDP made after completion of this calculation will protect theecological components of the environment. The decision to continue beyond the screening-level riskcalculation does not indicate whether remediation is necessary at the site. That decision will be madein Step 8 of the process.
2.5 SUMMARY
At the conclusion of the exposure estimate and screening-level risk calculation step, the followinginformation should have been compiled:
(1) Exposure estimates based on conservative assumptions and maximum concentrationspresent; and
(2) Hazard quotients (or hazard indices) indicating which, if any, contaminants and exposure pathwaysmight pose ecological threats.
Based on the results of the screening-level ecological risk calculation, the risk manager and lead riskassessor will determine whether or not contaminants from the site pose an ecological threat. If there aresufficient data to determine that ecological threats are negligible, the ecological risk assessment willbe complete at this step with a finding of negligible ecological risk. If the data indicate that there is(or might be) a risk of adverse ecological effects, the ecological risk assessment process will continue.
Conservative assumptions have been used for each step of the screening-level ecological riskassessment. Therefore, requiring a cleanup based solely on this information would not be technicallydefensible. To end the assessment at this stage, the conclusion of negligible ecological risk must beadequately documented and technically defensible. A lack of information on the toxicity of a contaminantor on complete exposure pathways will result in a decision to continue with the ecological risk assessmentprocess (Steps 3 through 7) not a decision to delay the ecological risk assessment until a later date whenmore information might be available.
008934

3-1
OVERVIEW
Step 3 of the eight-step process initiates the problem-formulation phase of the baselineecological risk assessment. Step 3 refines the screening-level problem formulation and, with inputfrom stakeholders and other involved parties, expands on the ecological issues that are of concernat the particular site. In the screening-level assessment, conservative assumptions were usedwhere site-specific information was lacking. In Step 3, the results of the screening assessmentand additional site-specific information are used to determine the scope and goals of the baselineecological risk assessment. Steps 3 through 7 are required only for sites for which the screening-level assessment indicated a need for further ecological risk evaluation.
Problem formulation at Step 3 includes several activities:
C Refining preliminary contaminants of ecological concern;C Further characterizing ecological effects of contaminants;C Reviewing and refining information on contaminant fate and transport, complete
exposure pathways, and ecosystems potentially at risk;C Selecting assessment endpoints; andC Developing a conceptual model with working hypotheses or questions that the site
investigation will address.
At the conclusion of Step 3, there is a SMDP, which consists of agreement on four items: theassessment endpoints, the exposure pathways, the risk questions, and conceptual model integratingthese components. The products of Step 3 are used to select measurement endpoints and to developthe ecological risk assessment work plan (WP) and sampling and analysis plan (SAP) for the site inStep 4. Steps 3 and 4 are, effectively, the data quality objective (DQO) process for the baselineecological risk assessment.
STEP 3: BASELINE RISK ASSESSMENT PROBLEM FORMULATION
3.1 THE PROBLEM-FORMULATION PROCESS
In Step 3, problem formulation establishes the goals, breadth, and focus of the baseline ecological riskassessment. It also establishes the assessment endpoints, or specific ecological values to be protected(U.S. EPA, 1992a). Through Step 3, the questions and issues that need to be addressed in the baselineecological risk assessment are defined based on potentially complete exposure pathways and ecologicaleffects. A conceptual model of the site is developed that includes questions about the assessmentendpoints and the relationship between exposure and effects. Step 3 culminates in an SMDP, which isagreement between the risk manager and risk assessor on the assessment endpoints, exposure pathways, andquestions as portrayed in the conceptual model of the site.
008935

3-2
The conceptual model, which is completed in Step 4, also will describe the approach, types of data, andanalytical tools to be used for the analysis phase of the ecological risk assessment (Step 6). Thosecomponents of the conceptual model are formally described in the ecological risk WP and SAP in Step 4 ofthis eight-step process. If there is not agreement among the risk manager, lead risk assessor, and theother professionals involved with the ecological risk assessment on the initial conceptual modeldeveloped in Step 3, the final conceptual model and field study design developed in Step 4 might notresolve the issues that must be considered to manage risks effectively.
The complexity of questions developed during problem formulation does not depend on the size of a siteor the magnitude of its contamination. Large areas of contamination can provoke simple questions and,conversely, small sites with numerous contaminants can require a complex series of questions andassessment endpoints. There is no rule that can be applied to gauge the effort needed for an ecologicalrisk assessment based on site size or number of contaminants; each site should be evaluated individually.
At the beginning of Step 3, some basic information should exist for the site. At a minimum, informationshould be available from the site history, PA, SI, and Steps 1 and 2 of this eight-step process. For largeor complex sites, information might be available from earlier site investigations.
It is important to be as complete as possible early in the process so that Steps 3 through 8 need not berepeated. Repeating the selection of assessment endpoints and/or the questions and hypotheses concerningthose endpoints is appropriate only if new information indicating new threats becomes available. The SMDPprocess should prevent having to return to the problem formulation step because of changing opinions onthe questions being asked. Repetition of Step 3 should not be confused with the intentional tiering (orphasing) of ecological site investigations at large or complex sites (see Highlight 3-1). The process ofproblem formulation at complex sites is the same as at more simple sites, but the number, complexity,and/or level of resolution of the questions and hypotheses can be greater at complex sites.
While problem formulation is conceptually simple, in practice it can be a complex and interactiveprocess. Defining the ecological problems to be addressed during the baseline risk assessment involvesidentifying toxic mechanisms of the contaminants, characterizing potential receptors, and estimatingexposure and potential ecological effects. Problem formulation also constitutes the DQO process for thebaseline ecological risk assessment (U.S. EPA, 1993c,d).
The remainder of this section describes six activities to be conducted prior to the SMDP for this step:refining preliminary contaminants of ecological concern (Section 3.2); a literature search on thepotential ecological effects of the contaminants (Section 3.3); qualitative evaluation of completeexposure pathways and ecosystems potentially at risk (Section 3.4); selecting assessment endpoints(Section 3.5); and developing the conceptual model and establishing risk questions (Section 3.6).
008936

3-3
HIGHLIGHT 3-1Tiering an Ecological Risk
Assessment
Most ecological risk assessments at Superfund sitesare at least a two-tier process. Steps 1 and 2 of thisguidance serve as a first, or screening, tier prior toexpending a larger effort for a detailed, site-specificecological risk assessment. The baseline riskassessment may serve as the second tier. Additionaltiers could be needed in the baseline risk assessmentfor large or complex sites where there is a need tosequentially test interdependent hypotheses developedduring problem formulation (i.e., evaluating theresults of one field assessment before designing asubsequent field study).
While tiering can be an effective way to managesite investigations, multiple sampling phasestypically require some resampling of matrices sampledduring earlier tiers and increased field-mobilizationcosts. Thus, in some cases, a multi-tiered ecologicalrisk assessment might cost more than a two-tieredassessment. The benefits of tiering should be weighedagainst the costs.
3.2 REFINEMENT OF PRELIMINARY CONTAMINANTS OF CONCERN
The results of the screening-level riskassessment (Steps 1 and 2) should haveindicated which contaminants found at the sitecan be eliminated from further considerationand which should be evaluated further. It isimportant to realize that contaminants thatmight pose an ecological risk can be differentfrom those that might pose a human health riskbecause of differing exposure pathways,sensitivities, and responses to contaminants.
The initial list of contaminantsinvestigated in Steps 1 and 2 included allcontaminants identified or suspected to be atthe site. During Steps 1 and 2, it is likelythat several of the contaminants found at thesite were eliminated from further assessmentbecause the risk screen indicated that theyposed a negligible ecological risk. Because ofthe conservative assumptions used during therisk screen, some of the contaminants retainedfor Step 3 might also pose negligible risk. Atthis stage, the risk assessor should review theassumptions used (e.g., 100 percentbioavailability) against values reported inthe literature (e.g., only up to 60 percent fora particular contaminant), and consider howthe HQs would change if more realistic conservative assumptions were used instead (see Section 3.4.1).For those contaminants for which the HQs drop to near or below unity, the lead risk assessor and riskmanager should discuss and agree on which can be eliminated from further consideration at this time. Thereasons for dropping any contaminants from consideration at this step must be documented in the baselinerisk assessment.
Sometimes, new information becomes available that indicates the initial assumptions that screened somecontaminants out in Step 2 are no longer valid (e.g., site contaminant levels are higher than originallyreported). In this case, contaminants can be placed back on the list of contaminants to be investigatedwith that justification.
008937

3-4
Note that a contaminant should not be eliminated from the list of contaminants to be investigated onlybecause toxicity information is lacking; instead, limited or missing toxicity information must beaddressed using best professional judgment and discussed as an uncertainty.
3.3 LITERATURE SEARCH ON KNOWN ECOLOGICAL EFFECTS
The literature search conducted in Step 1 for the screening-level risk assessment might need to beexpanded to obtain the information needed for the more detailed problem formulation phase of the baselineecological risk assessment. The literature search should identify NOAELs, LOAELs, exposure-responsefunctions, and the mechanisms of toxic responses for contaminants for which those data were not collectedin Step 1. Appendix C presents a discussion of some of the factors important in conducting a literaturesearch. Several U.S. EPA publications (e.g., U.S. EPA, 1995a,e,g,h) provide a window to original toxicityliterature for contaminants often found at Superfund sites. For all retained contaminants, it isimportant to obtain and review the primary literature.
3.4 CONTAMINANT FATE AND TRANSPORT, ECOSYSTEMS POTENTIALLY ATRISK, AND COMPLETE EXPOSURE PATHWAYS
A preliminary identification of contaminant fate and transport, ecosystems potentially at risk, andcomplete exposure pathways was conducted in the screening ecological risk assessment. In Step 3, theexposure pathways and the ecosystems associated with the assessment endpoints that were retained by thescreening risk assessment are evaluated in more detail. This effort typically involves compilingadditional information on:
(1) The environmental fate and transport of the contaminants;
(2) The ecological setting and general flora and fauna of the site (including habitat, potentialreceptors, etc.); and
(3) The magnitude and extent of contamination, including its spatial and temporal variabilityrelative to the assessment endpoints.
For individual contaminants, it is frequently possible to reduce the number of exposure pathways thatneed to be evaluated to one or a few "critical exposure pathways" which (1) reflect maximum exposures ofreceptors within the ecosystem, or (2) constitute exposure pathways to ecological receptors sensitive tothe contaminant. The critical exposure pathways influence the selection of assessment endpoints for aparticular site. If multiple critical exposure pathways exist, they each should be evaluated, becauseit is often difficult to predict which pathways could be responsible for the greatest ecological risk.
008938

The product might be more or less toxic than the parent compound.3
The product might be more or less toxic than the parent compound.4
3-5
HIGHLIGHT 3-2Environmental Fate and
Exposure
If a contaminant in an aquatic ecosystem ishighly lipophilic (i.e., essentially insolublein water), it is likely to partition primarilyinto sediments and not into the water column.Factors such as sediment particle size andorganic carbon influence contaminantpartitioning; therefore, these attributesshould be characterized when sampling sediments.Similar considerations regarding partitioningshould be applied to contaminants in soils.
3.4.1 Contaminant Fate and Transport
Information on how the contaminants will or could betransported or transformed in the environmentphysically, chemically, and biologically is used toidentify the exposure pathways that might lead tosignificant ecological effects (see Highlight 3-2).Chemically, contaminants can undergo several processesin the environment: C Degradation,3
C Complexation,C Ionization,C Precipitation, and/orC Adsorption.
Physically, contaminants might move through theenvironment by one or more means:
C Volatilization,C Erosion,C Deposition (contaminant sinks),C Weathering of parent material with subsequent transport, and/orC Water transport:
- in solution,- as suspended material in the water, and- bulk transport of solid material.
Several biological processes also affect contaminant fate and transport in the environment:
C Bioaccumulation,C Biodegradation,C Biological transformation,4
C Food chain transfers, and/orC Excretion.
008939

3-6
Additional information should be gathered on past as well as current mechanisms of contaminant releasefrom source areas at the site. The mechanisms of release along with the chemical and physical form of acontaminant can affect its fate, transport, and potential for reaching ecological receptors.
A contaminant flow diagram (or exposure pathway diagram) comprises a large part of the conceptualmodel, as illustrated in Section 3.6. A contaminant flow diagram originates at the primary contaminantsource(s) and identifies primary release mechanisms and contaminant transport pathways. The release andmovement of the contaminants can create secondary sources (e.g., contaminated sediments in a river; seeExample 3-1), and even tertiary sources.
The above information is used to evaluate where the contaminants are likely to partition in theenvironment, and the bioavailability of the contaminant (historically, currently, or in the future). Asindicated in Section 3.2, it might be possible for the risk assessment team and the risk manager to usethis information to replace some of the conservative assumptions used in the screening-level riskassessment and to eliminate additional chemicals from further evaluation at this point. Any suchnegotiations must be documented in the baseline risk assessment.
3.4.2 Ecosystems Potentially at Risk
The ecosystems or habitats potentially at risk depend on the ecological setting of a site. An initialsource of information on the ecological setting of a site is the data collected during the preliminary sitevisit and characterization (Step 1), including the site ecological checklist (Appendix B). The sitedescription should provide answers to several questions including:
C What habitats (e.g., maple-beech hardwood forest, early-successional fields) are present?C What types of water bodies are present, if any?C Do any other habitats listed in Exhibit 1-1 exist on or adjacent to the site?
While adequately documented information should be used, it is not critical that complete site settinginformation be collected during this phase of the risk assessment. However, it is important that habitatsat the site are not overlooked; hence, a site visit might be needed to supplement the one conducted duringthe screening risk assessment. If a habitat actually present on the site is omitted during the problemformulation phase, this step might need to be repeated later when the habitat is found, resulting in delaysand additional costs for the risk assessment.
008940

3-7
EXAMPLE 3-1Exposure Pathway Model!!DDT Site
An abandoned pesticide production facility had released DDT to soils through poor handling practices during itsoperation. Due to erosion of contaminated soils, DDT migrated to stream sediments. The contaminated sedimentsrepresent a secondary source that might affect benthic organisms through direct contact or ingestion. Benthicorganisms that have accumulated DDT can be consumed by fish, and fish that have accumulated DDT can be consumed bypiscivorous birds, which are considered a valuable component of the local ecosystem. This example illustrates howcontaminant transport is traced from a primary source to a secondary source and from there through a food chain to anexposure point that can affect an assessment endpoint.
Available information on ecological effects of contaminants (see Section 3.3) can help focus theassessment on specific ecological resources that should be evaluated more thoroughly, because some groupsof organisms can be more sensitive than others to a particular contaminant. For example, a species orgroup of species could be physiologically sensitive to a particular contaminant (e.g., the contaminantmight interfere with its vascular system); or, the species might not be able to metabolize and detoxifythe particular contaminant(s) (e.g., honey bees and grass shrimp cannot effectively biodegrade PAHs,whereas fish generally can). Alternatively, an already-stressed population (e.g., due to habitatdegradation) could be particularly sensitive to any added stresses.
Variation in sensitivity should not be confused with variation in exposure, which can result frombehavioral and dietary differences among species. For example, predators can be exposed to higher levelsof contaminants that biomagnify in food chains than herbivores. A specialist predator could feedprimarily on one prey type that is a primary receptor of the contaminant. Some species mightpreferentially feed in a habitat where the contaminant tends to accumulate. On the other hand, a speciesmight change its behavior to avoid contaminated areas. Both sensitivity to toxic effects of a contaminantand behaviors that affect exposure levels can influence risks for particular groups of organisms.
3.4.3 Complete Exposure Pathways
The potentially complete exposure pathways identified in Steps 1 and 2 are described in more detailin Step 3 on the basis of the refined contaminant fate and transport evaluations (Section 3.4.1) andevaluation of potential ecological receptors (Section 3.4.2).
Some of the potentially complete exposure pathways identified in Steps 1 and 2 might be ruled out fromfurther consideration at this time. Sometimes, additional exposure pathways might be identified,particularly those originating from secondary sources. Any data gaps that result in questions aboutwhether an exposure pathway is complete should be identified, and the type of data needed to answer thosequestions should be described to assist in developing the WP and SAP in Step 4.
008941

3-8
EXAMPLE 3-2Potential for Food Chain Transfer!!Copper and DDT Sites
Copper can be toxic in aquatic ecosystems and to terrestrial plants. However, it is an essential nutrient forboth plants and animals, and organisms can regulate internal copper concentrations within limits. For this reason,copper tends not to accumulate in most organisms or to biomagnify in food chains, and thus tends not to reach levelshigh enough to cause adverse responses through food chain transfer to upper-trophic-level organisms. (Copper isknown to accumulate by several orders of magnitude in phytoplankton and in filter-feeding mollusks, however, andthus can pose a threat to organisms that feed on those components of aquatic ecosystems; U.S. EPA, 1985a.) Incontrast, DDT, a contaminant that accumulates in fatty tissues, can biomagnify in many different types of foodchains. Upper-trophic-level species (such as predatory birds), therefore, are likely to be exposed to higher levelsof DDT through their prey than are lower-trophic-level species in the ecosystem.
During Step 3, the potential for food-chain exposures deserves particular attention. Somecontaminants are effectively transferred through food chains, while others are not. To illustrate thispoint, copper and DDT are compared in Example 3-2.
3.5 SELECTION OF ASSESSMENT ENDPOINTS
As noted in the introduction to this guidance, an assessment endpoint is "an explicit expression ofthe environmental value that is to be protected" (U.S. EPA, 1992a). In human health risk assessment, onlyone species is evaluated, and cancer and noncancer effects are the usual assessment endpoints. Ecologicalrisk assessment, on the other hand, involves multiple species that are likely to be exposed to differingdegrees and to respond differently to the same contaminant. Nonetheless, it is not practical or possibleto directly evaluate risks to all of the individual components of the ecosystem at a site. Instead,assessment endpoints focus the risk assessment on particular components of the ecosystem that could beadversely affected by contaminants from the site.
The selection of assessment endpoints includes discussion between the lead risk assessor and the riskmanager concerning management policy goals and ecological values. The lead risk assessor and risk managershould seek input from the regional BTAG, PRPs, and other stakeholders associated with a site whenidentifying assessment endpoints for a site. Stakeholder input at this stage will help ensure that therisk manager can readily defend the assessment endpoints when making decisions for the site. ECO UpdateVolume 3, Number 1, briefly summarizes the process of selecting assessment endpoints (U.S. EPA, 1995b).
Individual assessment endpoints usually encompass a group of species or populations with some commoncharacteristics, such as a specific exposure route or contaminant sensitivity. Sometimes, individualassessment endpoints are limited to one species (e.g., a species known to be particularly sensitive to asite contaminant). Assessment endpoints can also encompass the typical structure and function ofbiological communities or ecosystems associated with a site.
008942

3-9
Assessment endpoints for the baseline ecological risk assessment must be selected based on theecosystems, communities, and/or species potentially present at the site. The selection of assessmentendpoints depends on:
(1) The contaminants present and their concentrations;(2) Mechanisms of toxicity of the contaminants to different groups of organisms;(3) Ecologically relevant receptor groups that are potentially sensitive or highly exposed to the
contaminant and attributes of their natural history; and(4) Potentially complete exposure pathways.
Thus, the process of selecting assessment endpoints can be intertwined with other phases of problemformulation. The risk assessment team must think through the contaminant mechanism(s) of ecotoxicity todetermine what receptors will or could be at risk. This understanding must include how the adverse effectsof the contaminants might be expressed (e.g., eggshell thinning in birds), as well as how the chemical andphysical form of the contaminants influence bioavailability and the type and magnitude of adverse response(e.g., inorganic versus organic mercury).
The risk assessment team also should determine if the contaminants can adversely affect organisms indirect contact with the contaminated media (e.g., direct exposure to water, sediment, soil) or if thecontaminants accumulate in food chains, resulting in adverse effects in organisms that are not directlyexposed or are minimally exposed to the original contaminated media (indirect exposure). The team shoulddecide if the risk assessment should focus on toxicity resulting from direct or indirect exposures, or ifboth must be evaluated.
Broad assessment endpoints (e.g., protecting aquatic communities) are generally of less value inproblem formulation than specific assessment endpoints (e.g., maintaining aquatic community compositionand structure downstream of a site similar to that upstream of the site). Specific assessment endpointsdefine the ecological value in sufficient detail to identify the measures needed to answer specificquestions or to test specific hypotheses. Example 3-3 provides three examples of assessment endpointselection based on the hypothetical sites in Appendix A.
The formal identification of assessment endpoints is part of the SMDP for this step. Regardless ofthe level of effort to be expended on the subsequent phases of the risk assessment, the assessmentendpoints identified are critical elements in the design of the ecological risk assessment and must beagreed upon as the focus of the risk assessment. Once assessment endpoints have been selected, testablehypotheses and measurement endpoints can be developed to determine whether or not a potential threat tothe assessment endpoints exists. Testable hypotheses and measurement endpoints cannot be developedwithout agreement on the assessment endpoints among the risk manager, risk assessors, and other involvedprofessionals.
008943

3-10
EXAMPLE 3-3Assessment Endpoint Selection!!DDT, Copper, and PCB Sites
DDT Site
An assessment endpoint such as "protection of the ecosystem from the effects of DDT" would give littledirection to the risk assessment. However, "protection of piscivorous birds from eggshell thinning due to DDTexposure" directs the risk assessment toward the food-chain transfer of DDT that results in eggshell thinningin a specific group of birds. This assessment endpoint provides the foundation for identifying appropriatemeasures of effect and exposure and ultimately the design of the site investigation. It is not necessary thata specific species of bird be identified on site. It is necessary that the exposure pathway exists and that thepresence of a piscivorous bird could be expected.
Copper Site
Copper can be acutely or chronically toxic to organisms in an aquatic community through direct exposure ofthe organisms to copper in the water and sediments. Threats of copper toxicity to higher-trophic-levelorganisms are unlikely to exceed threats to organisms at the base of the food chain, because copper is anessential nutrient which is effectively regulated by most organisms if the exposure is below immediately toxiclevels. Aquatic plants (particularly phytoplankton) and mollusks, however, are poor at regulating copper andmight be sensitive receptors or effective in transferring copper to the next trophic level. In addition, fishfry can be very sensitive to copper in water. Based on these receptors and the potential for both acute andchronic toxicity, an appropriate general assessment endpoint for the system could be the maintenance of aquaticcommunity composition. An operational definition of the assessment endpoint for this site would be pond fishand invertebrate community composition similar to that of other ponds of similar size and characteristics inthe area.
PCB Site
The primary ecological threat of PCBs in ecosystems is not through direct exposure and acute toxicity.Instead, PCBs bioaccumulate in food chains and can diminish reproductive success in some vertebrate species.PCBs have been implicated as a cause of reduced reproductive success of piscivorous birds (e.g., cormorants,terns) in the Great Lakes (Kubiak et al., 1989; Fox et al., 1991) and of mink along several waterways (Aulerichand Ringer, 1977; Foley et al., 1988). Therefore, reduced reproductive success in high-trophic-level speciesexposed via their diet is a more appropriate assessment endpoint than either toxicity to organisms via directexposure to PCBs in water, sediments, or soils, or reproductive impairment in lower-trophic-level species.
008944

3-11
008945

3-12
3.6 THE CONCEPTUAL MODEL AND RISK QUESTIONS
The site conceptual model establishes the complete exposure pathways that will be evaluated in theecological risk assessment and the relationship of the measurement endpoints to the assessment endpoints.In the conceptual model, the possible exposure pathways are depicted in an exposure pathway diagram andmust be linked directly to the assessment endpoints identified in Section 3.5. Developing the conceptualmodel and risk questions are described in Sections 3.6.1 and 3.6.2, respectively. Selection ofmeasurement endpoints, completing the conceptual model, is described in Step 4.
3.6.1 Conceptual Model
Based on the information obtained from Steps 1 and 2, knowledge of the contaminants present, theexposure pathway diagram, and the assessment endpoints, an integrated conceptual model is developed (seeExample 3-4). The conceptual model includes a contaminant fate-and-transport diagram that traces thecontaminants' movement from sources through the ecosystem to receptors that include the assessmentendpoints (see Example 3-5). Contaminant exposure pathways that do not lead to a species or group ofspecies associated with the proposed assessment endpoint indicate that either:
(1) There is an incomplete exposure pathway to the receptor(s) associated with theproposed assessment endpoint; or
(2) There are missing components or data necessary to demonstrate a complete exposure pathway.
If case (1) is true, the proposed assessment endpoint should be reevaluated to determine if it is anappropriate endpoint for the site. If case (2) is true, then additional field data could be needed toevaluate contaminant fate and transport at the site. Failure to identify a complete exposure pathwaythat does exist at the site can result in incorrect conclusions or in extra time and effort being expendedon a supplementary investigation.
As indicated in Section 3.5, appropriate assessment endpoints differ from site to site, and can beat one or more levels of biological organization. At any particular site, the appropriate assessmentendpoints might involve local populations of a particular species, community-level integrity, and/orhabitat preservation. The site conceptual model must encompass the level of biological organizationappropriate for the assessment endpoints for the site. The conceptual model can use assumptions thatgenerally represent a group of organisms or ecosystem components.
The intent of the conceptual model is not to describe a particular species or site exactly as much asit is to be systematic, representative, and conservative where information is lacking (with assumptionsbiased to be more likely to overestimate than to underestimate risk). For example, it is not necessaryor even recommended to develop new test protocols to use species that exist a site to test the toxicityof site media (See Step 4). Species used in standardized laboratory toxicity tests (e.g., fatheadminnows, Hyallela amphipods) usually are adequate surrogates for species in their general taxa andhabitat at the site.
008946

3-13
EXAMPLE 3-4Description of the Conceptual Model!!DDT Site
One of the assessment endpoints selected for the DDT site (Appendix A) is the protection of piscivorousbirds. The site conceptual model includes the release of DDT from the spill areas to the adjacent stream,followed by food chain accumulation of DDT from the sediments and water through the lower trophic levels toforage fish in the stream. The forage fish are the exposure point for piscivorous birds. Eggshell thinning wasselected as the measure of effect. During the literature review of the ecological effects of DDT, toxicitystudies were found that reported reduced reproductive success (i.e., number of young fledged) in birds thatexperienced eggshell thinning of 20 percent or more (Anderson and Hickey, 1972; Dilworth et al., 1972). Basedon those data, the lead risk assessor and risk manager agreed that eggshell thinning of 20 percent or more wouldbe considered an adverse effect for piscivorous birds.
Chronic DDT exposure can also reduce some animals' ability to escape predation. Thus, DDT canindirectly increase the mortality rate of these organisms by making them more susceptible to predators (Cooke,1971; Krebs et al., 1974). That effect of DDT on prey also can have an indirect consequence for the predators.If predators are more likely to capture the more contaminated prey, the predators could be exposed to DDT atlevels higher than represented in the average prey population.
3.6.2 Risk Questions
Ecological risk questions for the baseline risk assessment at Superfund sites are basically questionsabout the relationships among assessment endpoints and their predicted responses when exposedtocontaminants. The risk questions should be based on the assessment endpoints and provide a basis fordeveloping the study design (Step 4) and for evaluating the results of the site investigation in theanalysis phase (Step 6) and during risk characterization (Step 7).
The most basic question applicable to virtually all Superfund sites is whether site-relatedcontaminants are causing or have the potential to cause adverse effects on the assessment endpoint(s).To use the baseline ecological risk assessment in the FS to evaluate remedial alternatives, it is helpfulif the specific contaminant(s) responsible can be identified. Thus refined, the question becomes "does(or could) chemical X cause adverse effects on the assessment endpoint?" In general, there are four linesof evidence that can be used to answer this question:
(1) Comparing estimated or measured exposure levels to chemical X with levels that are known fromthe literature to be toxic to receptors associated with the assessment endpoints;
(2) Comparing laboratory bioassays with media from the site and bioassays with media from areference site;
(3) Comparing in situ toxicity tests at the site with in situ toxicity tests in a reference bodyof water; and
(4) Comparing observed effects in the receptors associated with the site with similar receptorsat a reference site.
008947
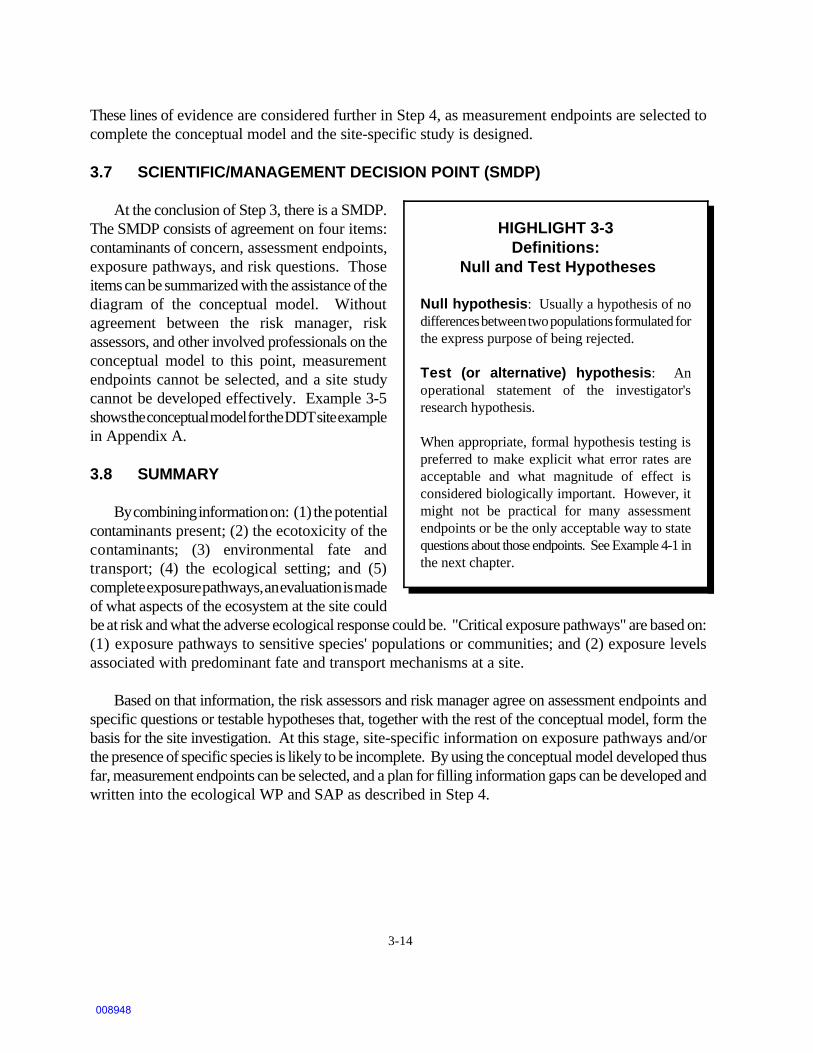
3-14
HIGHLIGHT 3-3Definitions:
Null and Test Hypotheses
Null hypothesis: Usually a hypothesis of nodifferences between two populations formulated forthe express purpose of being rejected.
Test (or alternative) hypothesis: Anoperational statement of the investigator'sresearch hypothesis.
When appropriate, formal hypothesis testing ispreferred to make explicit what error rates areacceptable and what magnitude of effect isconsidered biologically important. However, itmight not be practical for many assessmentendpoints or be the only acceptable way to statequestions about those endpoints. See Example 4-1 inthe next chapter.
These lines of evidence are considered further in Step 4, as measurement endpoints are selected tocomplete the conceptual model and the site-specific study is designed.
3.7 SCIENTIFIC/MANAGEMENT DECISION POINT (SMDP)
At the conclusion of Step 3, there is a SMDP.The SMDP consists of agreement on four items:contaminants of concern, assessment endpoints,exposure pathways, and risk questions. Thoseitems can be summarized with the assistance of thediagram of the conceptual model. Withoutagreement between the risk manager, riskassessors, and other involved professionals on theconceptual model to this point, measurementendpoints cannot be selected, and a site studycannot be developed effectively. Example 3-5shows the conceptual model for the DDT site examplein Appendix A.
3.8 SUMMARY
By combining information on: (1) the potentialcontaminants present; (2) the ecotoxicity of thecontaminants; (3) environmental fate andtransport; (4) the ecological setting; and (5)complete exposure pathways, an evaluation is madeof what aspects of the ecosystem at the site couldbe at risk and what the adverse ecological response could be. "Critical exposure pathways" are based on:(1) exposure pathways to sensitive species' populations or communities; and (2) exposure levelsassociated with predominant fate and transport mechanisms at a site.
Based on that information, the risk assessors and risk manager agree on assessment endpoints andspecific questions or testable hypotheses that, together with the rest of the conceptual model, form thebasis for the site investigation. At this stage, site-specific information on exposure pathways and/orthe presence of specific species is likely to be incomplete. By using the conceptual model developed thusfar, measurement endpoints can be selected, and a plan for filling information gaps can be developed andwritten into the ecological WP and SAP as described in Step 4.
008948

4-1
OVERVIEW
The site conceptual model begun in Step 3, which includes assessment endpoints, exposurepathways, and risk questions or hypotheses, is completed in Step 4 with the development ofmeasurement endpoints. The conceptual model then is used to develop the study design and dataquality objectives. The products of Step 4 are the ecological risk assessment WP and SAP, whichdescribe the details of the site investigation as well as the data analysis methods and data qualityobjectives (DQOs). As part of the DQO process, the SAP specifies acceptable levels of decisionerrors that will be used as the basis for establishing the quantity and quality of data needed tosupport ecological risk management decisions.
The lead risk assessor and the risk manager should agree that the WP and SAP describe a study thatwill provide the risk manager with the information needed to fulfill the requirements of the baselinerisk assessment and to incorporate ecological considerations into the site remedial process. Oncethis step is completed, most of the professional judgment needed for the ecological risk assessmentwill have been incorporated into the design and details of the WP and SAP. This does not limit theneed for qualified professionals in the implementation of the investigation, data acquisition, ordata interpretation. However, there should be no fundamental changes in goals or approach to theecological risk assessment once the WP and SAP are finalized.
STEP 4: STUDY DESIGN AND DATA QUALITY OBJECTIVE PROCESS
Step 4 of the ecological risk assessment establishes the measurement endpoints (Section 4.1),completing the conceptual model begun in Step 3. Step 4 also establishes the study design (Section 4.2)and data quality objectives based on statistical considerations (Section 4.3) for the site assessmentthat will accompany site-specific studies for the remedial investigation. The site conceptual model isused to identify which points or assumptions in the risk assessment include the greatest degree ofconservatism or uncertainty. The field sampling then can be designed to address the risk modelparameters that have important effects on the risk estimates (e.g., bioavailability and toxicity ofcontaminants in the field, contaminant concentrations at exposure points).
The products of Step 4 are the WP and SAP for the ecological component of the field investigations(Section 4.4). Involvement of the BTAG in the preparation, review, and approval of WPs and SAPs can helpensure that the ecological risk assessment is well focused, performed efficiently, and technicallycorrect. The WP and SAP should specify the site conceptual model developed in Step 3, and the measurementendpoints developed in the beginning of Step 4. The WP describes:
C Assessment endpoints;
008949

4-2
HIGHLIGHT 4-1 Importance of Distinguishing
Measurement from AssessmentEndpoints
If a measurement endpoint is mistaken for anassessment endpoint, the misperception can arisethat Superfund is basing a remediation on anarbitrary or esoteric justification. For example,protection of a few invertebrate and algal speciescould be mistaken as the basis for a remedialdecision, when the actual basis for the decision isthe protection of the aquatic community as a whole(including higher-trophic-level game fish thatdepend on lower trophic levels in the community), asindicated by a few sensitive invertebrate and algalspecies.
C Exposure pathways;C Questions and testable hypotheses;C Measurement endpoints and their relation to assessment endpoints; andC Uncertainties and assumptions.
The SAP should describe:
C Data needs;C Scientifically valid and sufficient study design and data analysis procedures;C Study methodology and protocols, including sampling techniques; C Data reduction and interpretation techniques, including statistical analyses; andC Quality assurance procedures and quality control techniques.
The SAP must include the data reduction and interpretation techniques, because it is necessary to knownhow the data will be interpreted to specify the number of samples needed. Prior to formal agreement onthe WP and SAP, the proposed field sampling plan is verified in Step 5.
4.1 ESTABLISHING MEASUREMENT ENDPOINTS
As indicated in the Introduction, a measurement endpoint is defined as "a measurable ecologicalcharacteristic that is related to the valued characteristic chosen as the assessment endpoint" and isa measure of biological effects (e.g., mortality, reproduction, growth) (U.S. EPA, 1992a; although thisdefinition may change—see U.S. EPA 1996a). Measurement endpoints are frequently numerical expressionsof observations (e.g., toxicity test results, community diversity measures) that can be comparedstatistically to a control or reference site todetect adverse responses to a site contaminant.As used in this guidance, measurement endpointscan include measures of exposure (e.g.,contaminant concentrations in water) as well asmeasures of effect. The relationship betweenmeasurement and assessment endpoints must beclearly described within the conceptual model andmust be based on scientific evidence. This iscritical because the assessment and measurementendpoints usually are different endpoints (seethe Introduction and Highlight 4-1)
Typically, the number of measurementendpoints that are potentially appropriate forany given assessment endpoint and circumstance islimited. The most appropriate measurementendpoints for an assessment endpoint depend onseveral considerations, a primary one being howmany and which lines of evidence are needed to
008950

4-3
support risk-management decisions at the site (see Section 3.6.2). Given the potential ramificationsof site actions, the site risk manager might want to use more than one line of evidence to identify site-specific thresholds for effects. The risk manager and risk assessors must consider the utility of eachtype of data given the cost of collecting those data and the likely sensitivity of the risk estimates tothe data.
There are some situations in which it might only be necessary or possible to compare estimated ormeasured contaminant exposure levels at a site to ecotoxicity values derived from the literature. Forexample, for contaminants in surface waters for which there are state water-quality standards,exceedance of the standards indicates that remediation to reduce contaminant concentrations in surfacewaters to below these levels could be needed whether impacts are occurring or not. For assessmentendpoints for which impacts are difficult to demonstrate in the field (e.g., because of high naturalvariability), and toxicity tests are not possible (e.g., food-chain accumulation is involved), comparingenvironmental concentrations with a well-supported ecotoxicity value might have to suffice.
A bioassay using contaminated media from the site can suffice if the risk manager and risk assessoragree that laboratory tests with surrogate species will be taken as indicative of likely effects on theassessment endpoint. For sites with complex mixtures of contaminants without robust ecotoxicity valuesand high natural variability in potential measures for the assessment endpoint, either laboratory or insitu toxicity testing might be the best technique for evaluating risks to the assessment endpoint. Forinorganic substances in soils or sediments, bioassays often are needed to determine the degree to whicha contaminant is bioavailable at a particular site. Laboratory toxicity tests can indicate the potentialfor adverse impacts in the field, while in situ toxicity testing with resident organisms can provideevidence of actual impacts occurring in the field.
Sometimes more than one line of evidence is needed to reasonably demonstrate that contaminants froma site are likely to cause adverse effects on the assessment endpoint. For example, total recoverablecopper in a surface water body to which a water quality standard did not apply could exceed aquaticecotoxicity values, but not cause adverse effects because the copper is only partially bioavailable orbecause the ecotoxicity value is too conservative for the particular ecosystem. Additional evidence frombioassays or community surveys could help resolve whether the copper is actually causing adverse effects(See Example 4-1). Alternatively, if stream community surveys indicate impairment of communitystructure downstream of a site, comparing contaminant concentrations with aquatic toxicity values canhelp identify which contaminants are most likely to be causing the effect. When some lines of evidenceconflict with others, professional judgment is needed to determine which data should be considered morereliable or relevant to the questions.
Once there is agreement on which lines of evidence are required to answer questions concerning theassessment endpoint, the measurement endpoints by which the questions or test hypotheses will be examinedcan be selected.
Each measurement endpoint should represent the same exposure pathway and toxic mechanism of actionas the assessment endpoint it represents; otherwise, irrelevant exposure pathways or toxic mechanismsmight be evaluated. For example, if a contaminant primarily causes damage to vertebrate kidneys, the useof daphnids (which do not have kidneys) would be inappropriate.
008951

4-4
EXAMPLE 4-1Lines of Evidence!!Copper Site
Primary question: Are ambient copper levels in sediments causing adverse effects in benthic organisms in thepond?
Possible lines of evidence phrased as test hypotheses:
(1) Mortality in early life stages of benthic aquatic insects in contact with sediments from thesite significantly exceeds mortality in the same kinds of organisms in contact with sedimentsfrom a reference site (e.g., p < 0.1).
(2) Mortality in in situ toxicity tests in sediments at the pond significantly exceeds mortalityin in situ toxicity tests in sediments at a reference pond (e.g., p < 0.1).
(3) There are significantly fewer numbers of benthic aquatic insect species present per m of2
sediment at the pond near the seep than at the opposite side of the pond (e.g., p < 0.1).
Statistical and biological significance: Differences in the incidence of adverse effects between groupsof organisms exposed to contaminants from the site and groups not exposed might be statistically significant,but not biologically important, depending on the endpoint and the power of the statistical test. Natural systemscan sustain some level of perturbation without changing in structure or function. The risk assessor needs toevaluate what level of effect will be considered biologically important. Given the limited power of small samplesizes to detect an effect, the risk assessor might decide that any difference that is statistically detectableat a p level of 0.1 or less is important biologically.
Potential measurement endpoints in toxicity tests or in field studies should be evaluated accordingto how well they can answer questions about the assessment endpoint or support or refute the hypothesesdeveloped for the conceptual model. Statistical considerations, including sample size and statisticalpower described in Section 4.3, also must be considered in selecting the measurement endpoints. Thefollowing subsections describe additional considerations for selecting measurement endpoints, includingspecies/community/habitat (Section 4.1.1), relationship to the contaminant(s) of concern (Section4.1.2), and mechanisms of ecotoxicity (Section 4.1.3).
4.1.1 Species/Community/Habitat Considerations
The function of a measurement endpoint is to represent an assessment endpoint for the site. Themeasurement endpoint must allow clear inferences about potential changes in the assessment endpoint.Whenever assessment and measurement endpoints are not the same (which usually is the case), measurementendpoints should be selected to be inclusive of risks to all of the species, populations, or groupsincluded in the assessment endpoint that are not directly measured. In other words, the measurementendpoint should be representative of the assessment endpoint for the site and not lead to anunderestimate of risk to the assessment endpoint. Example 4-2 illustrates this point for the DDT sitein Appendix A.
008952

4-5
HIGHLIGHT 4-2Terminology and Definitions
In the field of ecotoxicology, there historicallyhave been multiple definitions for some terms, includingdefinitions for direct effects, indirect effects, acuteeffects, chronic effects, acute tests, and chronic tests.This multiplicity of definitions has resulted inmisunderstandings and inaccurate communication of studydesigns. Definitions of these and other terms, as theyare used in this document, are provided in the glossary.When consulting other reference materials, the usershould evaluate how the authors defined terms.
In selecting a measurement endpoint, the species and life stage, population, or community chosenshould be the one(s) most susceptible to the contaminant for the assessment endpoint in question. Forspecies and populations, this selection is based on a review of the species: (1) life history; (2)habitat utilization; (3) behavioral characteristics; and (4) physiological parameters. Selection ofmeasurement endpoints also should be based on which routes of exposure are likely. For communities,careful evaluation of the contaminant fate and transport in the environment is essential.
4.1.2 Relationship of the Measurement Endpoints to the Contaminant of Concern
Additional criteria to consider when selecting measurement endpoints are inherent properties (suchas the physiology or behavioral characteristics of the species) or life history parameters that make aspecies useful in evaluating the effects of site-specific contaminants.
For example, Chironomus tentans (a speciesof midge that is used as a standard sedimenttoxicity testing species in the larvalstage) is considered more tolerant ofmetals contamination than is C. riparius, asimilar species (Klemm et al., 1990;Nebeker et al., 1984; Pascoe et al., 1989).To assess the effects of exposure ofbenthic communities to metal-contaminatedsediment, C. riparius might be the betterspecies to use as a test organism for manyaquatic systems to ensure that risks arenot underestimated. In general, the mostsensitive of the measurement endpointsappropriate for inferring risks to theassessment endpoint should be used. If all
else is equal, however, species that are commonly used in the laboratory are preferred over non-standardlaboratory species to improve test precision.
Some species have been identified as being particularly sensitive to certain contaminants. Forexample, numerous studies have demonstrated that mink are among the most sensitive of the testedmammalian species to the toxic effects of PCBs (U.S. EPA, 1995a). Species that rely on quick reactionsor behavioral responses to avoid predators can be particularly sensitive to contaminants affecting thecentral nervous system, such as mercury. Thus, the sensitivity of the measurement endpoint relative tothe assessment endpoint should be considered for each contaminant of concern.
4.1.3 Mechanisms of Ecoxicity
A contaminant can exert adverse ecological effects in many ways. First, a contaminant might affectan organism after exposure for a short period of time (acute) or after exposure over an extended periodof time (chronic). Second, the effect of a contaminant could be lethal (killing the organism) orsublethal (causing adverse effects other than death, such as reduced growth, behavioral changes, etc.).Sublethal effects can reduce an organism's lifespan or reproductive success. For example, if acontaminant reduces the reaction speed of a prey species, the prey can become more susceptible to
008953

4-6
predation. Third, a contaminant might act directly or indirectly on an organism. Direct effects includelethal or sublethal effects of the chemical on the organism. Indirect effects occur when the contaminantdamages the food, habitat, predator-prey relationships, or competition of the organism in its community.
Mechanisms of ecotoxicity and exposure pathways have already been considered during problemformulation and identification of the assessment endpoints. However, toxicity issues are revisited whenselecting appropriate measurement endpoints to ensure that they measure the assessment endpoint's toxicresponse of concern.
4.2 STUDY DESIGN
In Section 4.1, one or more lines of evidence that could be used to answer questions or to testhypotheses concerning the assessment endpoint(s) were identified. This section provides recommendationson how to design a field study for: bioaccumulation and field tissue residue studies (Section 4.2.1);population/community evaluations (Section 4.2.2); and toxicity testing (Section 4.2.3). A thoroughunderstanding of the strengths and limitations of these types of field studies is necessary to properlydesign any investigation.
Typically, no one line of evidence can stand on its own. Analytic chemistry on co-located samplesand other lines of evidence are needed to support a conclusion. When population/community evaluationsare coupled with toxicity testing and media chemistry, the procedure often is referred to as a triadapproach (Chapman et al., 1992; Long and Chapman, 1985). This method has proven effective in definingthe area affected by contaminants in sediments of several large bays and estuaries.
The development of exposure-response relationships is critical for evaluating risk managementoptions; thus, for all three types of studies, sampling is applied to a contamination gradient whenpossible as well as compared to reference data. Reference data are baseline values or characteristicsthat should represent the site in the absence of contaminants released from the site. Reference datamight be data collected from the site before contamination occurred or new data collected from areference site.
The reference site can be the least impacted (or unimpacted) area of the Superfund site or a nearbysite that is ecologically similar, but not affected by the site's contaminants. For additionalinformation on selecting and using reference information in Superfund ecological risk assessments, seeECO Update Volume 2, Number 1 (U.S. EPA, 1994e).
The following subsections present a starting point for selecting an appropriate study design for thedifferent types of biological sampling that might apply to the site investigation.
008954

4-7
EXAMPLE 4-2Selecting Measurement Endpoints!!DDT Site
As described in Example 3-1, one of the assessment endpoints selected for the DDT site is the protection ofpiscivorous birds from egg-shell thinning due to DDT exposure. The belted kingfisher was selected as apiscivorous bird with the smallest home range that could utilize the area of the site, thereby maximizing thecalculated dose to a receptor. In this illustration, the kingfishers are used as the most highly exposed of thepiscivorous birds potentially present. Thus, one can conclude that, if the risk assessment shows no threat ofeggshell thinning to the kingfisher, there should be minimal or no threat to other piscivorous birds that mightutilize the site. Thus, eggshell thinning in belted kingfishers is an appropriate measurement endpoint for thissite.
4.2.1 Bioaccumulation and Field Tissue Residue Studies
Bioaccumulation and field tissue residue studies typically are conducted at sites where contaminantsare likely to accumulate in food chains. The studies help to evaluate contaminant exposure levelsassociated with measures of effect for assessment endpoint species.
The degree to which a contaminant is transferred through a food chain can be evaluated in severalways. The most common type of study reported in the literature is a contaminant bioaccumulation (uptake)study. As indicated in Section 2.2.1, the most conservative BAF values identified in the literaturegenerally are used to estimate bioaccumulation in Step 2 of the screening-level risk assessment. Wherethe potential for overestimating bioaccumulation by using conservative literature values to representthe site is substantial, additional evaluation of the literature for values more likely to apply to thesite or a site-specific tissue residue study might be advisable.
A tissue residue study generally is conducted on organisms that are in the exposure pathway (i.e.,food chain) associated with the assessment endpoint. Data seldom are available to link tissue residuelevels in the sampled organisms to adverse effects in those organisms. Literature toxicity studiesusually associate effects with an administered dose (or data that can be converted to an administereddose), not a tissue residue level. Thus, the purpose of a field tissue residue study usually is tomeasure contaminant concentrations in foods consumed by the species associated with the assessmentendpoint. This measurement minimizes the uncertainty associated with estimating a dose (or intake) tothatspecies,particularly in situations in which several media and trophic levels are in the exposurepathway.
The concentration of a contaminant in the primary prey/food also should be linked to an exposureconcentration from a contaminated medium (e.g., soil, sediment, water), because it is the medium, notthe food chain, that will be remediated. Thus, contaminant concentrations must be measured inenvironmental media at the same locations at which the organisms are collected along contaminantgradients and at reference locations. Co-located samples of the contaminated medium and organisms areneeded to establish a correlation between the tissue residue levels and contamination levels in the
008955

4-8
EXAMPLE 4-3Tissue Residue Studies!!DDT Site
In the DDT site example, a forage fish (e.g., creek chub) will be collected at several locationswith known DDT concentrations in sediments. The forage fish will be analyzed for body burdens of DDT,and the relationship between the DDT levels in the sediments and the levels in the forage fish will beestablished. The forage fish DDT concentrations can be used to evaluate the DDT threat to piscivorousbirds feeding on the forage fish at each location. Using the DDT concentrations measured in fish thatcorrespond to a LOAEL and NOAEL for adverse effects in birds and the relationship between the DDT levelsin the sediments and in the forage fish, the corresponding sediment contamination levels can beestimated. Those sediment DDT concentrations can then be used to estimate a cleanup level that wouldreduce threats of eggshell thinning to piscivorous birds.
medium under evaluation; these studies are most effective if conducted over a gradient of contaminantconcentrations. In addition, tissue residues from sessile organisms (e.g., rooted plants, clams) areeasier to attribute to specific contaminated areas than are tissue residues from mobile organisms (e.g.,large fish). Example 4-3 illustrates these concepts using the DDT site example in Appendix A
Although it might seem obvious, it is important to confirm that the organisms examined for tissueresidue levels are in the exposure pathways of concern established by the conceptual model. Food itemstargeted for collection should be those that are likely to constitute a large portion of the diet of thespecies of concern (e.g., new growth on maple trees, rather than cattails, as a food source for deer)and/or represent pathways of maximum exposure. If not, erroneous conclusions or study delays and addedcosts can result. Because specific organisms often can only be captured in one season, the timing of thestudy can be critical, and failure to plan accordingly can result in serious site managementdifficulties.
There are numerous factors that must be considered when selecting a species in which to measurecontaminant residue levels. Several investigators have discussed the "ideal" characteristics of thespecies to be collected and analyzed. The recommendations of Phillips (1977, 1978) include that thespecies selected should be:
(1) Able to accumulate the chemical of concern without being adversely affected by the levels encountered at the site;
(2) Sedentary (small home range) in order to be representative of the area of collection;
(3) Abundant in the study area; and(4) Of reasonable size to give adequate tissue for analysis (e.g., 10 grams for organic
analysis and 0.5 gram for metal analysis for many laboratories (Roy F. Weston, Inc.,1994).
008956

4-9
Additional considerations for some situations would be that the species is:
(5) Sufficiently long-lived to allow for sampling more than one age class; and
(6) Easy to sample and hardy enough to survive in the laboratory (allowing for the organisms toeliminate contaminants from their gastrointestinal tract prior to analysis, if desired, andallowing for laboratory studies on the uptake of the contaminant).
It is usually not possible or necessary to find an organism that fulfills all of the aboverequirements. The selection of an organism for tissue analysis should balance these characteristics withthe hypotheses being tested, knowledge of the contaminants' fate and transport, and the practicality ofusing the particular species. In the following sections, several of the factors mentioned above aredescribed in greater detail.
Ability to accumulate the contaminant. The objectives of a tissue residue study are (1)to measure bioavailability directly; (2) to provide site-specific estimates of exposure to higher-trophic-level organisms; and (3) to relate tissue residue levels to concentrations in environmentalmedia (e.g., in soil, sediment, or water). Sometimes these studies also can be used to link tissueresidue levels with observed effects in the organisms sampled. However, in a "pure" accumulation study,the species selected for collection and tissue analysis should be ones that can accumulate acontaminant(s) without being adversely affected by the levels encountered in the environment. While itis difficult to evaluate whether or not a population in the field is affected by accumulation of acontaminant, it is important to try. Exposure that results in adverse responses might alter the animal'sfeeding rates or efficiency, diet, degree of activity, or metabolic rate, and thereby influence theanimal's daily intake or accumulation of the contaminant and the estimated BAF. For example, if the rateof bioaccumulation of a contaminant in an organism decreases with increasing environmentalconcentrations (e.g., its toxic effects reduce food consumption rates), using a BAF determined at lowenvironmental concentrations to estimate bioaccumulation at high environmental concentrations wouldoverestimate risk. Conversely, if bioaccumulation increased with increasing environmentalconcentrations (e.g., its toxic effects impair the organisms' ability to excrete the contaminant), usinga BAF determined at low environmental concentrations would underestimate risks at higher environmentalconcentrations.
Consideration of the physiology and biochemistry of the species selected for residue analysis alsois important. Some species can metabolize certain organic contaminant(s) (e.g., fish can metabolizePAHs). If several different types of prey are consumed by a species of concern, it would be moreappropriate to analyze prey species that do not metabolize the contaminant.
Home range. When selecting species for residue analyses, one should be confident that thecontaminant levels found in the organism depend on the contaminant levels in the environmental mediaunder evaluation. Otherwise, valid conclusions cannot be drawn about ecological risks posed bycontaminants at the site. The home range, particularly the foraging areas within the home range, andmovement patterns of a species are important in making this determination. Organisms do not utilize theenvironment uniformly. For species that have large home ranges or are migratory, it can be difficult toevaluate potential exposure to contaminants at the site. Attribution of contaminant levels in anorganism to contaminant levels in the surrounding environment is easiest for animals with small home and
008957

4-10
foraging ranges and limited movement patterns. Examples of organisms with small home ranges includeyoung-of-the-year fish, burrowing crustacea (such as fiddler crabs or some crayfish), and small mammals.
Species also should be selected for residue analysis to maximize the overlap between the area ofcontamination and the species' home range or feeding range. This provides a conservative evaluation ofpotential exposure levels. The possibility that a species' preferred foraging areas within a home rangeoverlap the areas of maximum contamination also should be considered.
Population size. A species selected for tissue residue analysis should be sufficiently abundantat the site that adequate numbers (and sizes) of individuals can be collected to support the tissue massrequirements for chemical analysis and to achieve the sample size needed for statistical comparisons.The organisms actually collected should be not only of the same species, but also of similar age or sizeto reduce data variability when BAFs are being evaluated. The practicality of using a particular speciesis evaluated in Step 5.
Size/composites. When selecting species in which to measure tissue residue levels, it is bestto have individual animals large enough for chemical analysis, without having to pool (combine)individuals prior to chemical analysis. However, composite samples will be needed if individuals fromthe species selected cannot yield sufficient tissue for the required analytical methods. Linkingcontaminant levels in organisms to concentrations in environmental media is easier if composites are madeup of members of the same species, sex, size, and age, and therefore exhibit similar accumulationcharacteristics. When deciding whether or not to pool samples, it is important to consider what impactthe loss of information on variability of contaminant levels along these dimensions will have on datainterpretation. The size, age, and sex of the species collected should be representative of the rangeof prey consumed by the species of concern.
Summary. Although it can be difficult to meet all of the suggested criteria for selecting aspecies for tissue residue studies, an attempt should be made to meet as many criteria as possible. Noformula is available for ranking the factors in order of importance within a particular siteinvestigation because the ranking depends on the study objectives. However, a key criterion is that theorganism be sedentary or have a limited home range. It is difficult to connect site contamination toorganisms that migrate over great distances or that have extremely large home ranges. Furtherinformation on factors that can influence bioaccumulation is available from the literature (e.g.,Phillips, 1977, 1978; U.S. EPA, 1995d).
4.2.2 Population/Community Evaluations
Population/community evaluations, or biological field surveys, are potentially useful for bothcontaminants that are toxic to organisms through direct exposure to the contaminated medium andcontaminants that bioaccumulate in food chains. In either case, careful consideration must be given tothe mechanism of contaminant effects. Since population/community evaluations are "impact" evaluations,they typically are not predictive. The release of the contaminant must already have occurred and exertedan effect in order for the population/community evaluation to be. an effective tool for a riskassessment.
008958

4-11
Population and community surveys evaluate the current status of an ecosystem, often using severalmeasures of population or community structure (e.g., standing biomass, species richness) or function(e.g., feeding group analysis). The most commonly used measures include number of species and abundanceof organisms in an ecosystem, although some species are difficult to evaluate. It is difficult to detectchanges in top predator populations affected by bioaccumulation of substances in their food chain dueto the mobility of top predators. Some species, most notably insects, can develop a tolerance tocontaminants (particularly pesticides); in these cases, a population/community survey would beineffective for evaluating existing impacts. While population/community evaluations can be useful, therisk assessors should consider the level of effort required as well as the difficulty in accounting fornatural variability.
A variety of population/community evaluations have been used at Superfund sites. Benthicmacroinvertebrate surveys are the most commonly conducted population/community evaluations. There aremethods manuals (e.g., U.S. EPA 1989c, 1990a) and publications that describe the technical proceduresfor conducting these studies. In certain instances, fish community evaluations have proven useful atSuperfund sites. However, these investigations typically are more labor-intensive and costly than acomparable macroinvertebrate study. In addition, fish generally are not sensitive measures of theeffects of sediment contamination, because they usually are more mobile than benthic macroinvertebrates.Terrestrial plant community evaluations have been used to a limited extent at Superfund sites. For thosesurveys, it is important to include information about historical land use and physical habitat disruptionin the uncertainty analysis.
Additional information on designing field studies and on field study methods can be found in ECOUpdate Volume 2, Number 3 (U.S. EPA, 1994d).
Although population- and community-level studies can be valuable, several factors can confound theinterpretation of the results. For example, many fish and small mammal populations normally cycle inrelation to population density, food availability, and other factors. Vole populations have been knownto reach thousands of individuals per acre and then to decline to as low as tens of individuals per acrethe following years without an identifiable external stressor (Geller, 1979). It is important that the"noise of the system" be evaluated so that the impacts attributed to chemical contamination at the siteare not actually the result of different, "natural" factors. Populations located relatively close toeach other can be affected independently: one might undergo a crash, while another is peaking. Physicalcharacteristics of a site can isolate populations so that one population level is not a good indicatorof another; for example, a paved highway can be as effective a barrier as a river, and populations oneither side can fluctuate independently. Failure to evaluate such issues can result in erroneousconclusions. The level of effort required to resolve some of these issues can make population/communityevaluations impractical in some circumstances.
4.2.3 Toxicity Testing
The bioavailability and toxicity of site contaminants can be tested directly with toxicity tests.As with other methods, it is critical that the media tested are in exposure pathways relevant to theassessment endpoint. If the site conceptual model involves exposure of benthic invertebrates tocontaminated sediments, then a solid-phase toxicity test using contaminated sediments (as opposed to awater-column exposure test) and an infaunal species would be appropriate. As indicated earlier, the
008959

4-12
species tested and the responses measured must be compatible with the mechanism of toxicity. Some commonsite contaminants are not toxic to most organisms at the same environmental concentrations that threatentop predators because the contaminant biomagnifies in food chains (e.g., PCBs); toxicity tests usingcontaminated media from the site would not be appropriate for evaluating this type of ecological threat.
There are numerous U.S. EPA methods manuals and ASTM guides and procedures for conducting toxicitytests (see references in the Bibliography). While documented methods exist for a wide variety oftoxicity tests, particularly laboratory tests, the risk assessor must evaluate what a particulartoxicity test measures and, just as importantly, what it does not measure. Questions to consider whenselecting an appropriate toxicity test include:
(1) What is the mechanism of toxicity of the contaminant(s)?
(2) What contaminated media are being evaluated (water, soil, sediment)?
(3) What toxicity test species are available to test the media being evaluated?
(4) What life stage of the species should be tested?
(5) What should the duration of the toxicity test be?
(6) Should the test organisms be fed during the test?
(7) What endpoints should be measured?
There are a limited number of toxicity tests that are readily available for testing environmentalmedia. Many of the aquatic toxicity tests were developed for the regulation of aqueous discharges tosurface waters. These tests are useful, but one must consider the original purpose of the test.
New toxicity tests are being developed continually and can be of value in designing a Superfund siteecological risk assessment. However, when non-standard tests are used, complete documentation of thespecific test procedures is necessary to support use of the data.
In situ toxicity tests involve placing organisms in locations that might be affected by sitecontaminants and in reference locations. Non-native species should not be used, because of the risk oftheir release into the environment in which they could adversely affect (e.g., prey on or outcompete)resident species. In situ tests might provide more realistic evidence of existing adverse effects thanlaboratory toxicity tests; however, the investigator has little control over many environmentalparameters and the experimental organisms can be lost to adverse weather or other events (e.g., humaninterference) at the site or reference location.
For additional information on using toxicity tests in ecological risk assessments, see ECO UpdateVolume 2, Numbers 1 and 2 (U.S. EPA, 1994b,c).
008960

4-13
4.3 DATA QUALITY OBJECTIVES AND STATISTICAL CONSIDERATIONS
The SAP indicates the number and location of samples to be taken, the number of replicates for eachsampling location, and the method for determining sampling locations. In specifying those parameters,the investigator needs to consider, among other things, the DQOs and statistical methods that will beused to analyze the data.
4.3.1 Data Quality Objectives
The DQO process represents a series of planning steps that can be employed throughout the developmentof the WP and SAP to ensure that the type, quantity, and quality of environmental data to be collectedduring the ecological investigation are adequate to support the intended application. Problemformulation in Steps 3 and 4 is essentially the DQO process. By employing problem formulation and theDQO process, the investigator is able to define data requirements and error levels that are acceptablefor the investigation prior to the collection of data. This approach helps ensure that results areappropriate and defensible for decision making. The specific goals of the general DQO processare to:
C Clarify the study objective and define the most appropriate types of data to collect;
C Determine the most appropriate field conditions under which to collect the data; and
C Specify acceptable levels of decision errors that will be used as the basis for establishing the quantity and quality of data needed to support risk management decisions.
008961

4-14
As the discussion of Steps 3 and 4 indicates, those goals are subsumed in the problem formulation phaseof an ecological risk assessment. Several U.S. EPA publications provide detailed descriptions of theDQO process (U.S. EPA, 1993c,d,f, 1994f). Because many of the steps of the DQO process are alreadycovered during problem formulation, the DQO process should be reviewed by the investigator and appliedas needed.
4.3.2 Statistical Considerations
Sampling locations can be selected "randomly" to characterize an area or non-randomly, as along acontaminant concentration gradient. The way in which sampling locations are selected determines whichstatistical tests, if any, are appropriate for evaluating test hypotheses.
If a toxicity test is to be used to identify contaminant concentrations in the environment associatedwith a threshold for adverse effects, the statistical power of the test is important. The threshold foreffects is assumed to be between the NOAEL and LOAEL of a toxicity test (see Section 7.3.1). For toxicitytests that use a small number of test and control organisms or for which the toxic response is highlyvariable, the increase in response rate of the test animals compared with controls often must berelatively high (e.g., 30 to 50 percent increase) for the response to be considered a LOAEL (i.e.,statistically increased level of an adverse response compared with control levels). If a NOAEL-to-LOAELrange that might represent a 20 to 50 percent increase in adverse effect is unacceptable (e.g., apopulation is unlikely to sustain itself with an additional 40 percent mortality), then the power of thestudy design must be increased, usually by increasing sample size, but sometimes by taking full advantageof all available information to improve the power of the design (e.g., stratified sampling, special testsfor trends, etc.). A limitation on the use of toxicity values from the literature is that often, theinvestigator does not discuss the statistical power of the study design, and hence does not indicate theminimum statistically detectable effect level. Appendix D describes additional statisticalconsiderations, including a description of Type I and Type II error, statistical power, statisticalmodels, and power efficiency.
In evaluating the results of statistical analyses, one should remember that a statisticallysignificant difference relative to a control or reference population does not necessarily imply abiologically important or ecologically significant difference (see Example 4-1).
4.4 CONTENTS OF WORK PLAN AND SAMPLING AND ANALYSIS PLAN
The WP and SAP for the ecological investigation should be developed as part of the initial RI samplingevent if possible. If not, the WP and SAP can be developed as an additional phase of the siteinvestigation. In either case, the format of the WP and SAP should be similar to that described by U.S.EPA (1988a, 1989b). Accordingly, those documents should be consulted when developing the ecologicalinvestigation WP and SAP.
The WP and SAP are typically written as separate documents. In that case, the WP can be submitted forthe risk manager's review so that any concerns with the approach can be resolved prior to the developmentof the SAP. For some smaller sites, it might be more practical to combine the two documents, in whichcase, the investigators should discuss the overall objectives and approach with the risk manager toensure that all parties agree.
008962
4-15
The WP and SAP are briefly described in Sections 4.4.1 and 4.4.2, respectively. A plan for testingthe SAP before the site WP and SAP are signed and the investigation begins is described in Section 4.4.3.
4.4.1 Work Plan
The purpose of the WP is to document the decisions and evaluations made during problem formulationand to identify additional investigative tasks needed to complete the evaluation of risks to ecologicalresources. As presented in U.S. EPA (1988a), the WP generally includes the following:
C A general overview and background of the site including the site's physical setting, ecology, andprevious uses;
C A summary and analysis of previous site investigations and conclusions;
C A site conceptual model, including an identification of the potential exposure pathways selectedfor analysis, the assessment endpoints and questions or testable hypotheses, and the measurementendpoints selected for analysis;
C The identification of additional site investigations needed to conduct the ecological riskassessment; and
C A description of assumptions used and the major sources of uncertainty in the site conceptual modeland existing information.
The general scope of the additional sampling activities also is presented in the WP. A detaileddescription of the additional sampling activities is presented in the SAP along with an anticipatedschedule of the site activities.
4.4.2 Sampling and Analysis Plan
The SAP typically consists of two components: a field sampling plan (FSP) and a quality assuranceproject plan (QAPP). The FSP provides guidance for all field work by providing a detailed description of the sampling and data-gathering procedures to be used for theproject. The QAPP provides a description of the steps required to achieve the objectives dictated by theintended use of the data.
Field sampling plan. The FSP provides a detailed description of the samples needed to meet theobjectives and scope of the investigation outlined in the WP. The FSP for the ecological assessmentshould be detailed enough that a sampling team unfamiliar with the site would be able to gather all thesamples and/or required field data based on the guidelines presented in the document. The FSP for theecological investigation should include a description of the following elements:
C Sampling type and objectives;C Sampling location, timing, and frequency;C Sample designation;
008963

4-16
HIGHLIGHT 4-3Elements of a QAPP
(1) Project description (2) Designation of QA/QC responsibilities (3) Statistical tests and data quality objectives (4) Sample collection and chain of custody (5) Sample analysis (6) System controls and preventive maintenance (7) Record keeping (8) Audits (9) Corrective actions (10) Quality control reports
C Sampling equipment and procedures; andC Sample handling and analysis.
A detailed description of those elements for chemical analyses is provided in Appendix B of U.S. EPA(1988a). Similar specifications should be developed for the biological sampling.
Quality assurance project plan. The objective of the QAPP is to provide a description of thepolicy, organization, functional activities, and quality control protocols necessary for achieving thestudy objectives. Highlight 4-3 presents the elements typically contained in a QAPP.
U.S. EPA has prepared guidance on the contents of a QAPP (U.S. EPA, 1987a, 1988a, 1989a). Formalquality assurance and quality control (QA/QC) procedures exist for some types of ecological assessments,for example, for laboratory toxicity tests on aquatic species. For standardized laboratory tests, thereare formal QA/QC procedures that specify (1) sampling and handling of hazardous wastes; (2) sources andculturing of test organisms; (3) use of reference toxicants, controls, and exposure replicates; (4)instrument calibration; (5) record keeping; and (6) data evaluation. For other types of ecologicalassessments, however, QA/QC procedures are less well defined (e.g., for biosurveys of vegetation,terrestrial vertebrates). BTAG members can provide input on appropriate QA/QC procedures based on theirexperience with Superfund sites.
4.4.3 Field Verification of Sampling Plan and Contingency Plans
For biological sampling, uncontrolledvariables can influence the availability ofspecies to be sampled, the efficiency ofdifferent types of sampling techniques, andthe level of effort required to achieve thesample sizes specified in the SAP. As aconsequence, the risk assessor should developa plan to test the sampling design before theWP and SAP are signed and the siteinvestigationbegins. Otherwise, fieldsampling during the site investigation couldfail to meet the DQOs specified in the SAP, andthe study could fail to meet its objectives.Step 5 provides a description of the fieldverification of the sampling design.
To the extent that potential field problems can be anticipated, contingency plans also should bespecified in the SAP. An example of a contingency plan is provided in Steps 5 and 6 (Examples 5-2 and 6-1).
008964

4-17
4.5 SCIENTIFIC/MANAGEMENT DECISION POINT (SMDP)
The completion of the ecological risk assessment WP and SAP should coincide with an SMDP. Within thisSMDP, the ecological risk assessor and the ecological risk manager agree on: (1) selection ofmeasurement endpoints; (2) selection of the site investigation methods; and (3) selection of datareduction and interpretation techniques. The WP or SAP also should specify how inferences will be drawnfrom the measurement to the assessment endpoints.
4.6 SUMMARY
At the conclusion of Step 4, there will be an agreement on the contents of the WP and SAP. As notedearlier, these plans can be parts of a larger WP and SAP that are developed to meet other remedialinvestigation needs, or they can be separate documents. When possible, any field sampling efforts forthe ecological risk assessment should overlap with other site data collection efforts to reduce samplingcosts and to prevent redundant sampling.
The WP and/or the SAP should specify the methods by which the collected data will be analyzed. Theplan(s) should include all food-chain-exposure-model parameters, data reduction techniques,datainterpretation methods, and statistical analyses that will be used.
008965
5-1
OVERVIEW
Before the WP and SAP are signed, it is important to verify that the field sampling plan theyspecify is appropriate and implementable at the site. If this has not already been done, it shouldbe done now. During field verification of the sampling design, the testable hypotheses, exposurepathway models, and measurement endpoints are evaluated for their appropriateness andimplementability. The assessment endpoint(s), however, should not be under evaluation in thisstep; the appropriateness of the assessment endpoint should have been resolved in Step 3. If anassessment endpoint is changed at this step, the risk assessor must return to Step 3, because theentire process leading to the actual site investigation in Step 6 assumes the selection ofappropriate assessment endpoints.
STEP 5: FIELD VERIFICATION OF SAMPLING DESIGN
5.1 PURPOSE
The primary purpose of field verification of the sampling plan is to ensure that the samplesspecified by the SAP actually can be collected. A species that will be associated with a measurementendpoint and/or exposure point concentration should have been observed at the preliminary sitecharacterization or noted during previous site visits. During this step, previously obtainedinformation should be verified and the feasibility of sampling will need to be checked by a site visit.Preliminary sampling will determine if the targeted species is present and—equallyimportant—collectable in sufficient numbers or total biomass to meet data quality objectives. Thispreliminary field assessment also allows for final confirmation of the habitats that exist on or near thesite. Habitat maps are verified a final time, and interpretations of aerial photographs can be checked.
Final decisions on reference areas also should be made in this step. The reference areas shouldbe chosen to be as similar as possible to the site in all aspects except contamination. Parameters tobe evaluated for similarity include, but are not limited to: slope, habitat, species potentially present,soil and sediment characteristics, and for surface waters, flow rates, substrate type, water depth,temperature, turbidity, oxygen levels, water hardness, pH, and other standard water qualityparameters. If several on-site habitats or habitat variables are being investigated, then severalreference areas could be required. Reference areas should be as free of site-related contaminantsabove background levels as practical.
008966
5-2
5.2 DETERMINING SAMPLING FEASIBILITY
When sampling biota, it is difficult to predict what level of effort will be necessary to obtain anadequate number of individuals of the required size. Some preliminary field measurements often canhelp determine adequate sampling efforts to attain the sample sizes specified in the SAP for statisticalanalyses. The WP and SAP should be signed and the site investigation should be implementedimmediately after verification of the sampling design to limit effects of uncontrolled field variables.For example, evaluation of current small mammal population density might indicate to the investigatorthat 400 trap-nights instead of 50 are necessary to collect the required number of small mammals.If there is a time lag between the field sampling verification and the actual site investigation, it couldbe necessary to reverify the field sampling to determine if conditions have changed.
Sampling methods for abiotic media also should be tested. There is a wide variety of samplingdevices and methods, and it is important to use the most appropriate, as the following examplesillustrate:
C When sampling a stream's surface water, if the stream is only three inches deep, collecting the water directly into 32-ounce bottles would not be practical.
C Sampling the substrate in a stream might be desirable, but if the substrate is bedrock, it might not be feasible or the intent of the sampling design.
An exposure-response relationship between contamination and biological effects is a keycomponent of establishing causality during the analysis phase of the baseline risk assessment (Step6). If extent-of-contamination sampling is conducted in phases, abiotic exposure media and bioticsamples must be collected simultaneously because the interactions (both temporal and spatial)between the matrix to be remediated and the biota are crucial to the development of a field exposure-response relationship. Failure to collect one sample properly or to coordinate samples temporally cansignificantly impact the interpretation of the data.
Sampling locations need to be checked to make sure that they are appropriately described andplaced within the context of the sampling plan. Directions for a sediment sample "to be taken 5 feetfrom the north side of stream A," could cause confusion if the stream is only 4 feet wide, or if thesampler doesn't know if the sample should be taken in the stream, or 5 feet away from the edge ofthe stream. All samples should be checked against the intended use of the data to be obtained.
All pathways for the migration of contaminants off site should be evaluated, such as windblowndust, surface water runoff, and erosion. Along these pathways, a gradient of decreasingcontamination with increasing distance from the site might exist. Site-specific ecological evaluationsand risk assessments can be more useful to risk managers if gradients of contamination can be locatedand evaluated.
008967

5-3
Contaminant migration pathways might have changed, either due to natural causes (e.g., storms)or site remediation activities (e.g., erosion channels might have been filled or dug up to preventfurther migration of contaminants). Channels of small or large streams, brooks, or rivers might havemoved; sites might have been flooded. All of the assumptions of the migration and exposurepathways need to be verified prior to the full site investigation. If a contaminant gradient is necessaryfor the sampling plan, it is important to verify that the gradient exists and that the range ofcontaminant concentrations is appropriate. A gradient of contamination that causes no impacts at thehighest concentration measured has as little value as a gradient that kills everything at the lowestconcentration measured; in either case, the gradient would not provide useful exposure-responseinformation. A gradient verification requires chemical sampling, but field screening-level analysesmight be effective.
These and other problems associated with the practical implementation of sampling should beresolved prior to finalizing the SAP to the extent practicable. Assessing the feasibility of the samplingplan before the site investigation begins saves costs in the long term because it minimizes the chancesof failing to meet DQOs during the site investigation.
Examples 5-1 and 5-2 describe the field verification of the sampling plan for the hypotheticalcopper and DDT sites illustrated in Appendix A. Note that the scope of the field verification differsfor the copper and DDT sites. For the DDT site, a modification to the study design was necessary.For both sites, the issues were resolved and a sign-off was obtained at the SMDP for this step.
Any change in measurement endpoints will require that exposure pathways to the newmeasurement endpoint be checked. The new measurement endpoint must fit into the establishedconceptual model. Changes to measurement endpoints might require revision of the conceptualmodel and agreement to the changes at the SMDP. It is highly desirable that the agreed-uponconceptual model should be modified and approved by the same basic group of individuals whodeveloped it.
5.3 SCIENTIFIC/MANAGEMENT DECISION POINT (SMDP)
The SMDP for the field verification of the sampling design is the signing of the finalized WP andSAP. Any changes to the investigation proposed in Step 4 must be made with agreement from therisk manager and risk assessment team. The risk manager must understand what changes have beenmade and why, and must ensure that the risk management decisions can be made from the informationthat the new study design can provide. The risk assessors must be involved to ensure that theassessment endpoints and testablehypotheses are still being addressed.In the worst cases, changes inthe measurement endpoints could be necessary, with corresponding changes to the risk hypothesesand sampling design. Any new measurement endpoints must be evaluated according to their utilityfor inferring changes in the assessmentendpoints and their compatibility with the site conceptualmodel (from Steps 3 and 4). Loss of the relationship between measurement endpoints and theassessment endpoints, the risk questions or testable hypothesis, and the site conceptual model willresult in a failure to meet study objectives.
008968

5-4
EXAMPLE 5-1Field Verification of Sampling Design!!Copper Site
Copper was released from a seep area of a landfill adjacent to a small pond; the release and resultingelevated copper levels in the pond are of concern. The problem fo rmulation and conceptual model stated thatthe assessment endpoint was the maintenance of a typical pond co mmunity for the area, including the benthicinvertebrates and fish. Toxicity testing was selected to evaluate the potential toxicity of copper to aquaticorganisms. Three toxicity tests were selected: a 10-day solid-phase sediment toxicity test (with th eamphipod Hyalella azteca), and two water column tests (i.e., the 7-day growth test with the green alg aSelenastrum capricornutum and the fathead minnow, Pimephales promelas, 7-day larval growth test). Thestudy design specified that sedime nt and water for the toxicity tests would be collected at the leachate seepsknown to be at the pond edge, and at three additional equidistant locations transecting the pond (includingthe point of maximum pond depth). The pond contains water year-round; however, the seep flow dependson rainfall. Therefore, it is only necessary to verify that the leachate seep is active at the time of sampling.
Despite one's best efforts to conduct a sound site assessment, unexpected circumstances mightstill make it necessary for the sampling plan to be changed in the field. Any changes should be agreedto and documented by the lead risk assessor in consultation with the risk manager.Once the finalized WP and SAP are approved and signed, Step 6 should begin.
5.4 SUMMARY
In summary, field verification of the sampling plan is very important to ensuring that the DQOsof the site investigation can be met. This step verifies that the selected assessment endpoints, testablehypotheses, exposure pathway model, measurement endpoints, and study design from Steps 3 and4 are appropriate and implementable at the site. By verifying the field sampling plan prior toconducting the full site investigation, well-considered alterations can be made to the study designand/or implementation if necessary. These changes will ensure that the ecological risk assessmentmeets the study objectives.
If changing conditions force changes to the sampling plan in the field (e.g., selection of a differentreference site), the changes should be agreed to and documented by the lead risk assessor inconsultation with the risk manager.
008969

5-5
EXAMPLE 5-2Field Verification of Sampling Design!!DDT Site
For the stream DDT site, the assessment endpoint was protection of piscivorous birds fromadverse reproductive effects. The conceptual model included the exposure pathway of sedimentto forage fish to the kingfisher. The measurement endpoint selected was tissue residue levels increek chub (Semotilus atromaculatus), which could be associated with contaminant levels insediments. Existing information on the stream contamination indicates that a gradient ofcontamination exists and that five specific sampling locations should be sufficient to characterizethe gradient to the point where concentrations are unlikely to have adverse effects. The studydesign specified that 10 creek chub of the same size and sex be collected at each location. Eachchub should be approximately 20 grams, so that minimum sample mass requirements could bemet without using composite samples for analysis. In addition, QA/QC protocol requires that10 more fish be collected at one of the locations.
In this example, a site assessment was necessary to verify that a sufficient number of creekchub of the specified size would be present to meet the sampling requirements. Streamconditions were evaluated to determine what fish sampling technique would work at the targetedlocations. A field assessment was conducted, and several fish collection techniques were usedto determine which was the most effective for the site. Collected creek chub and other fish wereexamined to determine the size range available and whether the sex of the individuals could bedetermined.
The site assessment indicated that the creek chub might not be present in sufficient numbersto provide the necessary biomass for chemical analyses. Based upon those findings, acontingency plan was agreed to, which stated that both the creek chub and the longnosed dace(Rhinichthys cataractae) would be collected. If the creek chub were collected at all locationsin sufficient numbers, then those samples would be analyzed and the dace would be released. Ifsufficient creek chub could not be collected but sufficient longnosed dace could, the longnoseddace would be analyzed and the creek chub released. If neither species could be collected at alllocations in sufficient numbers, then a mix of the two species would be used; however, for anygiven sampling location only one species would be used to make the sample. In addition, at onelocation, which preferably had high DDT levels in the sediment, sufficient numbers (20 grams)of both species would be collected to allow comparison (and calibration) of the accumulationbetween the two species.
008970

6-1
OVERVIEW
Information collected during the site investigation is used to characterize exposures andecological effects. The site investigation includes all of the field sampling and surveys that areconducted as part of the ecological risk assessment. The site investigation and analysis ofexposure and effects should be straightforward, following the WP and SAP developed in Step4 and tested in Step 5.
Exposure characterization relies heavily on data from the site investigation and can involvefate-and-transport modeling. Much of the information for characterizing potential ecologicaleffects was gathered from the literature review during problem formulation, but the siteinvestigation might provide evidence of existing ecological impacts and additional exposure-response information.
STEP 6: SITE INVESTIGATION AND ANALYSIS PHASE
6.1 INTRODUCTION
The site investigation (Section 6.2) and analysis phase (Section 6.3) of the ecological riskassessment should be straightforward. In Step 4, all issues related to the study design, samplecollection, DQOs, and procedures for data reduction and interpretation should have been identifiedand resolved. However, as described in Step 5, there are circumstances that can arise during a siteinvestigation that could require modifications to the original study design. If any unforeseen eventsdo require a change to the WP or SAP, all changes must be agreed upon at the SMDP (Section 6.4).The results of Step 6 are used to characterize ecological risks in Step 7.
6.2 SITE INVESTIGATION
The WP for the site investigation is based on the site conceptual model and should specify theassessment endpoints, risk questions, and testable hypotheses. The SAP for the site investigationshould specify the relationship between measurement and assessment endpoints, the necessarynumber, volume, and types of samples to be collected, and the sampling techniques to be used. TheSAP also should specify the data reduction and interpretation techniques and the DQOs. Thefeasibility of the sampling design was tested in Step 5. Therefore, the site investigation should be adirect implementation of the previously designed study.
During the site investigation, it is important to adhere to the DQOs and to any requirements forco-located sampling. Failure to collect one sample properly or to coordinate samples temporally cansignificantly affect interpretation of the data. Changing field conditions (Section 6.2.1) and newinformation on the nature and extent of contamination (Section 6.2.2) can require a change in theSAP.
008971
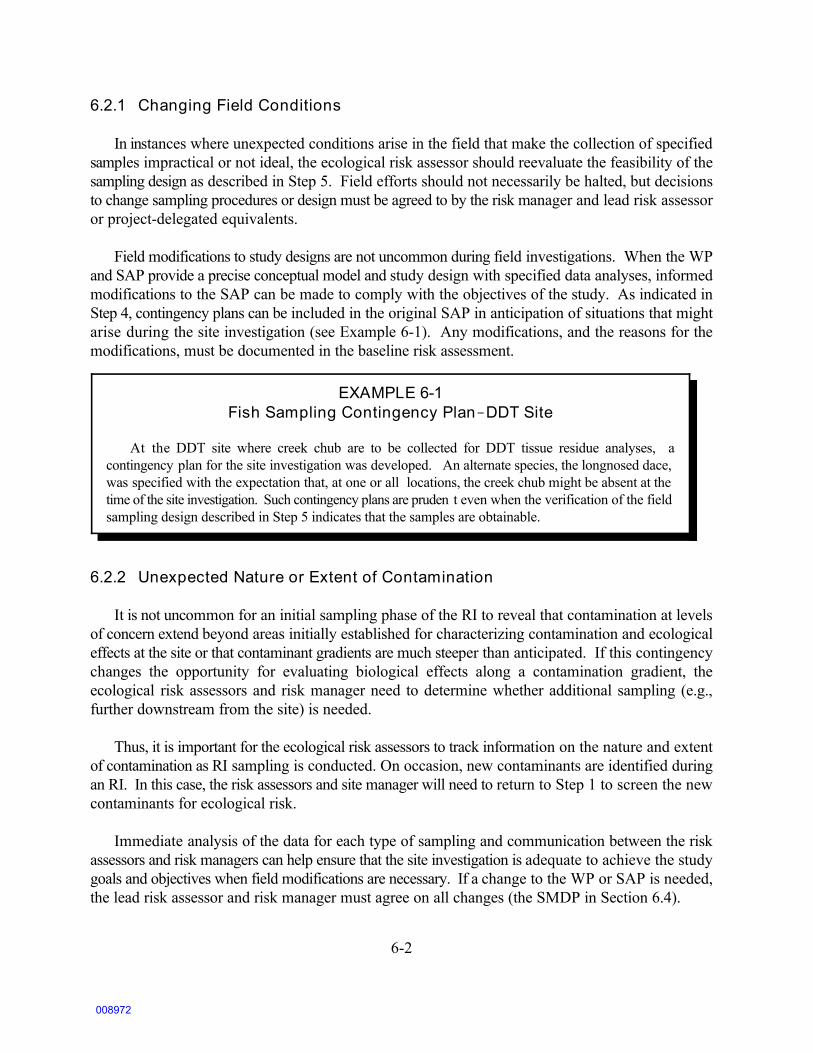
6-2
EXAMPLE 6-1Fish Sampling Contingency Plan!!DDT Site
At the DDT site where creek chub are to be collected for DDT tissue residue analyses, acontingency plan for the site investigation was developed. An alternate species, the longnosed dace,was specified with the expectation that, at one or all locations, the creek chub might be absent at thetime of the site investigation. Such contingency plans are pruden t even when the verification of the fieldsampling design described in Step 5 indicates that the samples are obtainable.
6.2.1 Changing Field Conditions
In instances where unexpected conditions arise in the field that make the collection of specifiedsamples impractical or not ideal, the ecological risk assessor should reevaluate the feasibility of thesampling design as described in Step 5. Field efforts should not necessarily be halted, but decisionsto change sampling procedures or design must be agreed to by the risk manager and lead risk assessoror project-delegated equivalents.
Field modifications to study designs are not uncommon during field investigations. When the WPand SAP provide a precise conceptual model and study design with specified data analyses, informedmodifications to the SAP can be made to comply with the objectives of the study. As indicated inStep 4, contingency plans can be included in the original SAP in anticipation of situations that mightarise during the site investigation (see Example 6-1). Any modifications, and the reasons for themodifications, must be documented in the baseline risk assessment.
6.2.2 Unexpected Nature or Extent of Contamination
It is not uncommon for an initial sampling phase of the RI to reveal that contamination at levelsof concern extend beyond areas initially established for characterizing contamination and ecologicaleffects at the site or that contaminant gradients are much steeper than anticipated. If this contingencychanges the opportunity for evaluating biological effects along a contamination gradient, theecological risk assessors and risk manager need to determine whether additional sampling (e.g.,further downstream from the site) is needed.
Thus, it is important for the ecological risk assessors to track information on the nature and extentof contamination as RI sampling is conducted. On occasion, new contaminants are identified duringan RI. In this case, the risk assessors and site manager will need to return to Step 1 to screen the newcontaminants for ecological risk.
Immediate analysis of the data for each type of sampling and communication between the riskassessors and risk managers can help ensure that the site investigation is adequate to achieve the studygoals and objectives when field modifications are necessary. If a change to the WP or SAP is needed,the lead risk assessor and risk manager must agree on all changes (the SMDP in Section 6.4).
008972

6-3
HIGHLIGHT 6-1Uncertainty in Exposure Models
The accuracy of an exposure modeldepends on the accuracy of the inputparameter values and the validity of themodel's structure (i.e., the degree to whichit represents the actual relationships amongparameters at the site). Field measurementscan be used to calibrate model outputs orintermediate calculations. Such fieldmeasurements should be specified in the WPand SAP. For example, studies of tissueresidue levels often are used to calibrateexposure and food-chain models.
6.3 ANALYSIS OF ECOLOGICAL EXPOSURES AND EFFECTS
The analysis phase of the ecological risk assessment consists of the technical evaluation of dataon existing and potential exposures (Section 6.3.1) and ecological effects (Section 6.3.2) at the site.The analysis is based on the information collected during Steps 1 through 5 and often includesadditional assumptions or models to interpret the data in the context of the site conceptual model.As illustrated in Exhibit 6-1, analysis of exposure and effects is performed interactively, with theanalysis of one informing the analysis of the other. This step follows the data interpretation andanalysis methods specified in the WP and SAP, and therefore should be a straightforward process.
In the analysis phase, the site-specific data obtained during the site investigation replace many ofthe assumptions that were made for the screening-level analysis in Steps 1 and 2. For the exposureand ecological effects characterizations, the uncertainties associated with the field measurements andwith assumptions where site-specific data are not available must be documented.
6.3.1 Characterizing Exposures
Exposure can be expressed as the co-occurrence or contact of the stressor with the ecologicalcomponents, both in time and space (U.S. EPA, 1992a). Thus, both the stressor and the ecosystemmust be characterized on similar temporal and spatial scales. The result of the exposure analysis isan exposure profile that quantifies the magnitude and spatial and temporal patterns of exposure asthey relate to the assessment endpoints and risk questions developed during problem formulation.The exposure profile and a description of associated uncertainties and assumptions serve as input tothe risk characterization in Step 7.
Stressor characterization involvesdetermining the stressor's distribution andpattern of change. The analytic approach forcharacterizing ecological exposures should havebeen established in the WP and SAP on thebasis of the site conceptual model. For chemicalstressorsat Superfund sites, usually acombination of fate-and-transport modeling andsampling data from the site are used to predictthe current and likely future nature and extent ofcontamination at a site.
When characterizing exposures, theecological context of the site established duringproblemformulation is analyzed further, both tounderstand potential effects of the ecosystem onfate and transport of chemicals in theenvironment and to evaluate site-specificcharacteristics of species or communities of concern. Any site-specific information that can be used
008973
6-4
to replace assumptions based on information from the literature or from other sites is incorporatedinto the description of the ecological components of the site. Remaining assumptions anduncertainties in the exposure model (Highlight 6-1) should be documented.
6.3.2 Characterizing Ecological Effects
At this point, all evidence for existing and potential adverse effects on the assessment endpointsis analyzed. The information from the literature review on ecological effects is integrated with anyevidence of existing impacts based on the site investigation (e.g., toxicity testing). The methods foranalyzing site-specific data should have been specified in the WP and SAP, and thus should bestraightforward. Both exposure-response information and evidence that site contaminants are causingor can cause adverse effects are evaluated.
Exposure-response analysis. The exposure-response analysis for a Superfund site describesthe relationship between the magnitude, frequency, or duration of a contaminant stressor in anexperimental or observational setting and the magnitude of response. In this phase of the analysis,measurement endpoints are related to the assessment endpoints using the logical structure providedby the conceptual model. Any extrapolations that are required to relate measurement to assessmentendpoints (e.g., between species, between response levels, from laboratory to field) are explained.Finally, an exposure-response relationship is described to the extent possible (e.g., by a regressionequation), including the confidence limits (quantitative or qualitative) associated with the relationship.
Under some circumstances, site-specific exposure-response information can be obtained byevaluating existing ecological impacts along a contamination gradient at the site. Statisticaltechniques to identify or describe the relationship between exposure and response from the field datashould have been specified in the WP and SAP. The potential for confounding stressors that mightcorrelate with the contamination gradient should be documented (e.g., decreasing water temperaturedownstream of a site; reduced soil erosion further from a site).
An exposure-response analysis is of particular importance to risk managers who must balancehuman health and ecological concerns against the feasibility and effectiveness of remedial options.An exposure-response function can help a risk manager to specify the trade-off between the degreeof cleanup and likely benefits of the cleanup and to balance ecological and financial costs and benefitsof different remedial options, as discussed in Step 8.
When exposure-response data are not available or cannot be developed, a threshold for adverseeffects can be developed instead, as in Step 2. For the baseline risk assessment, however, site-specificinformation should be used instead of conservative assumptions whenever possible.
Evidence of causality. At Superfund sites, evidence of causality is key to the risk assessment.Thus, it is important to evaluate the strength of the causal association between site-relatedcontaminants and effects on the measurement and assessment endpoints. Demonstrating a
008974

EXHIBIT 6-1 Analysis Phase (U.S. EPA, 1992a)
PROBLEM FORMULATION
ANALYSIS
PROBLEM FORMULATION
RISK CHARACTERIZATION
Characterization of Exposure Characterization of Ecological Effects
Evaluationof RelevantEffects Data
EcosystemCharacterization:
BioticAbiotic
StressorCharacterization:
Distribution orPattern of Change
ExposureAnalysis
EcologicalResponseAnalysis
Stressor-ResponseProfile
ExposureProfile
RISK CHARACTERIZATION
6-5
008975

6-6
correlation between a contaminant gradient and ecological impacts at a site is a key component ofestablishing causality, but other evidence can be used in the absence of such a demonstration.Moreover, an exposure-response correlation at a site is not sufficient to demonstrate causality, butrequires one or more types of supporting evidence and analysis of potential confounding factors.Hill's (1965) criteria for evaluating causal associations are outlined in the Framework (U.S. EPA,1992a).
6.4 SCIENTIFIC/MANAGEMENT DECISION POINT (SMDP)
An SMDP during the site investigation and analysis phase is needed only if alterations to the WPor SAP become necessary. In the worst case, changes in measurement endpoints could be required,with corresponding changes to the testable hypotheses and sampling design. Any new measurementendpoints must be evaluated according to their utility for inferring changes in the assessmentendpoints and their compatibility with the site conceptual model; otherwise, the study could fail tomeet its objectives.
Proposed changes to the SAP must be made in consultation with the risk manager and the riskassessors. The risk manager must understand what changes have been made and why, and mustensure that the risk management decisions can be made from the information that the new studydesign can provide. The risk assessors must be involved to ensure that the assessment endpoints andstudy questions or testable hypotheses are still being addressed.
6.5 SUMMARY
The site investigation step of the ecological risk assessment should be a straightforwardimplementation of the study designed in Step 4 and verified in Step 5. In instances where unexpectedconditions arise in the field that indicate a need to change the study design, the ecological riskassessors should reevaluate the feasibility or adequacy of the sampling design. Any proposed changesto the WP or SAP must be agreed upon by both the risk assessment team and the risk manager andmust be documented in the baseline risk assessment.
The analysis phase of the ecological risk assessment consists of the technical evaluation of dataon existing and potential exposures and ecological effects and is based on the information collectedduring Steps 1 through 5 and the site investigation in Step 6. Analyses of exposure and effects areperformed interactively, and follow the data interpretation and analysis methods specified in the WPand SAP. Site-specific data obtained during Step 6 replace many of the assumptions that were madefor the screening-level analysis in Steps 1 and 2. Evidence of an exposure-response relationshipbetween contamination and ecological responses at a site helps to establish causality. The results ofStep 6 are used to characterize ecological risks in Step 7.
008976

7-1
OVERVIEW
In risk characterization, data on exposure and effects are integrated into a statement aboutrisk to the assessment endpoints established during problem formulation. A weight-of-evidenceapproach is used to interpret the implications of different studies or tests for the assessmentendpoints. In a well-designed study, risk characterization should be straightforward, because theprocedures were established in the WP and SAP. The risk characterization section of the baselineecological risk assessment should include a qualitative and quantitative presentation of the riskresults and associated uncertainties.
STEP 7: RISK CHARACTERIZATION
7.1 INTRODUCTION
Risk characterization is the final phase of the risk assessment process and includes two majorcomponents: risk estimation and risk description (U.S. EPA, 1992a; Exhibit 7-1). Risk estimation(Section 7.2) consists of integrating the exposure profiles with the exposure-effects information andsummarizing the associated uncertainties. The risk description (Section 7.3) provides informationimportant for interpreting the risk results and, in the Superfund Program, identifies a threshold foradverse effects on the assessment endpoints (Section 7.4).
It is U.S. EPA policy that risk characterization should be consistent with the values of"transparency, clarity, consistency, and reasonableness" (U.S. EPA, 1995f). "Well-balanced riskcharacterizations present risk conclusions and information regarding the strengths and limitations ofthe assessment for other risk assessors, EPA decision-makers, and the public" (U.S. EPA, 1995f).Thus, when preparing the risk characterization, the risk assessment team should make sure that thedocumentation of risks is easy to follow and understand, with all assumptions, defaults, uncertainties,professional judgments, and any other inputs to the risk estimate clearly identified and easy to find.
7.2 RISK ESTIMATION
Documentation of the risk estimates should describe how inferences are made from themeasurement endpoints to the assessment endpoints established in problem formulation. As statedearlier, it is not the purpose of this document to provide a detailed guidance on the selection andutilization of risk models. The risk assessment team should have developed and the risk managershould have agreed upon the conceptual model used to characterize risk, its assumptions,uncertainties, and interpretation in Steps 3 through 5. This agreement is specified in The site WPand SAP and is the purpose of the SMDPs in Steps 3 through 5.
008977

7-2
Unless the site investigation during Step 6 discovers unexpected information, the risk assessmentshould move smoothly through the risk characterization phase, because the data interpretationprocedures were specified in the WP and SAP. While it might be informative to investigate a dataset for trends, outliers, or other statistical indicators, these investigations should be secondary to thedata interpretations specified in the SAP. Analysis of the data beyond the purposes for which it wascollected might be informative, but could lead to biased, conflicting, or superfluous conclusions.Those outcomes can divert or confound the risk characterization process.
For ecological risk assessments that entail more than one type of study (or line of evidence), astrength-of-evidence approach is used to integrate different types of data to support a conclusion.The data might include toxicity test results, assessments of existing impacts at a site, or riskcalculations comparing exposures estimated for the site with toxicity values from the literature.Balancing and interpreting the different types of data can be a major task and require professionaljudgment. As indicated above, the strength of evidence provided by different types of tests and theprecedence that one type of study might have over another should already have been establishedduring Step 4. Taking this approach will ensure that data interpretation is objective and not biasedto support a preconceived answer. Additional strength-of-evidence considerations at this stageinclude the degree to which DQOs were met and whether confounding factors became evident duringthe site investigation and analysis phase.
For some biological tests (e.g., toxicity tests, benthic macroinvertebrate studies), all or some ofthe data interpretation process is outlined in existing documents, such as in toxicity testing manuals.However, in most cases, the SAP must provide the details on how the data are to be interpreted fora site. The data interpretation methods also should be presented in the risk characterizationdocumentation. For example, if the triad approach was used to evaluate contaminated sediments, therisk estimation section should describe how the three types of studies (i.e., toxicity test, benthicinvertebrate survey, and sediment chemistry) are integrated to draw conclusions about risk.
Where exposure-response functions are not available or developed, the quotient method ofcomparing an estimated exposure concentration to a threshold for response can be used, as in Step2. Whenever possible, however, presentation of full exposure-response functions provides the riskmanager with more information on which to base site decisions. This guidance has recommended theuse of on-site contamination gradients to demonstrate on-site exposure-response functions. Wheresuch data have been collected, they should be presented along with the risk estimates. Hazardquotients, hazard indices (for contaminants with the same mechanism of toxicity), the results of insitu toxicity testing, or community survey data can be mapped along with analytic chemistry data toprovide a clear picture of the relationship between areas of contamination and effects.
In addition to developing point estimates of exposure concentrations, as for the hazard quotientapproach, it might be possible to develop a distribution of exposure levels based on the potentialvariability in various exposure parameters (see Section 7.3.2). Probabilities of exceeding a thresholdfor adverse effects might then be estimated. Again, the risk assessment team and risk manager shouldhave already agreed to what analyses will be used to characterize risks.
008978

EXHIBIT 7-1Risk Characterization (U.S. EPA, 1992a)
PROBLEM FORMULATION
ANALYSIS
RISK CHARACTERIZATION
Risk Estimation
Integration Uncertainty Analysis
Risk Description
EcologicalRisk
Summary
Interpretation ofEcological
Significance
Discussion Between theRisk Assessor and Risk Manager
(Results)
ANALYSIS
Risk Management
Data A
cquisition; Verification and M
onitoring
7-3
008979

7-4
7.3 RISK DESCRIPTION
A key to risk description for Superfund sites is documentation of environmental contaminationlevels that bound the threshold for adverse effects on the assessment endpoints (Section 7.3.1). Therisk description can also provide information to help the risk manager judge the likelihood andecological significance of the estimated risks (Sections 7.3.2 and 7.3.3, respectively).
7.3.1 Threshold for Effects on Assessment Endpoints
Key outputs of the risk characterization step are contaminant concentrations in eachenvironmental medium that bound the threshold for estimated adverse ecological effects given theuncertainty inherent in the data and models used. The lower bound of the threshold would be basedon consistent conservative assumptions and NOAEL toxicity values. The upper bound would bebased on observed impacts or predictions that ecological impacts could occur. This upper boundwould be developed using consistent assumptions, site-specific data, LOAEL toxicity values, or animpact evaluation.
The approach to estimating environmental contaminant concentrations that represent thresholdsfor adverse ecological effects should have been specified in the study design (Step 4). When higher-trophic-level organisms are associated with assessment endpoints, the study design should havedescribed how monitoring data and contaminant-transfer models would be used to back-calculate anenvironmental concentration representing a threshold for effect. If the site investigation demonstrateda gradient of ecological effects along a contamination gradient, the risk assessment team can identifyand document the levels of contamination below which no further improvements in the assessmentendpoints are discernable or expected. If departures from the original analysis plan are necessarybased on information obtained during the site investigation or data analysis phase, the reasons forchange should be documented.
When assessment endpoints include populations of animals that can travel moderate distances,different ways of presenting a threshold for adverse effects are possible. Various combinations oflevel of contamination and areal extent of contamination relative to the foraging range of the animalscan result in similar contaminant intake levels by the animals. In that case, a point of departure foridentifying a threshold for effect would be to identify that level of contamination, which if uniformlydistributed both at the site and beyond, would not pose a threat. The assumption of uniformcontamination has been used to back-calculate water-quality criteria to protect piscivorous wildlifein the Great Lakes (U.S. EPA, 1995a). Again, use of this approach should have been specified in thestudy design.
7.3.2 Likelihood of Risk
In addition to identifying one or more thresholds for effects, the risk assessment team mightdevelop estimates of the probability that exposure levels would exceed the ecotoxicity thresholdsgiven the distribution of values likely for various exposure parameters (e.g., home range size,population density). A distributional analysis might be used to estimate the range of likely exposurelevels associated with a given exposure model based on ranges for the input variables.
008980

7-5
7.3.3 Additional Risk Information
In addition to developing numerical estimates of existing impacts, risks, and thresholds for effect,the risk assessor should put the estimates in context with a description of their extent, magnitude, andpotential ecological significance. Additional ecological risk descriptors are listed below:
C The location and areal extent of existing contamination above a threshold for adverse effects;
C The degree to which the threshold for contamination is exceeded or is likely to be exceededin the future, particularly if exposure-response functions are available; and
C The expected half-life (qualitative or quantitative) of contaminants in the environment (e.g.,sediments, food chain) and the potential for naturalrecovery once the sources of contamination are removed.
To interpret the information in light of remedial options, the risk manager might need to solicit inputfrom specific experts.
At this stage, it is important for the risk assessors to consider carefully several principles of riskcommunication, as described in U.S. EPA's (1996a) Proposed Guidelines for Ecological RiskAssessment.
7.4 UNCERTAINTY ANALYSIS
There are several sources of uncertainties associated with Superfund ecological risk estimates.One is the initial selection of substances of concern based on the sampling data and available toxicityinformation. Other sources of uncertainty include estimates of toxicity to ecological receptors at thesite based on limited data from the laboratory (usually on other species), from other ecosystems, orfrom the site over a limited period of time. Additional uncertainties result from the exposureassessment, as a consequence of the uncertainty in chemical monitoring data and models used toestimate exposure concentrations or doses. Finally, further uncertainties are included in risk estimateswhen simultaneous exposures to multiple substances occur.
Uncertainty should be distinguished from variability, which arises from true heterogeneity orvariation in characteristics of the environment and receptors. Uncertainty, on the other hand,represents lack of knowledge about certain factors which can sometimes be reduced by additionalstudy.
This section briefly notes several categories of uncertainty (Section 7.4.1) and techniques fortracking uncertainty through a risk assessment (Section 7.4.2). Additional guidance on discussinguncertainty and variability in risk characterization is provided in U.S. EPA's (1992f) Guidance onRisk Characterization for Risk Managers and Risk Assessors.
008981

7-6
7.4.1 Categories of Uncertainty
There are three basic categories of uncertainties that apply to Superfund site risk assessments: (1)conceptual model uncertainties; (2) natural variation and parameter error; and (3) model error. Eachof these is described below.
There will be uncertainties associated with the conceptual model used as the basis to investigatethe site. The initial characterization of the ecological problems at a Superfund site, likely exposurepathways, chemicals of concern, and exposed ecological components, requires professional judgmentsand assumptions. To the extent possible, the risk assessment team should describe what judgmentsand assumptions were included in the conceptual model that formed the basis of the WP and SAP.
Parameter values (e.g., water concentrations, tissue residue levels, food ingestion rates) usuallycan be characterized as a distribution of values, described by central tendencies, ranges, andpercentiles, among other descriptors. When evaluating uncertainty in parameter values, it isimportant to distinguish uncertainty from variability. Ecosystems include highly variable abiotic (e.g.,weather, soils) and biotic (e.g., population density) components. If all instances of a parameter (e.g.,all members of a population) could be sampled, the "true" parameter value distribution could bedescribed. In practical terms, however, only a fraction of the instances (e.g., a few of the membersof the population) can be sampled, leaving uncertainty concerning the true parameter valuedistribution. The risk assessor should provide either quantitative or qualitative descriptions ofuncertainties in parameter value distributions.
Finally, there is uncertainty associated with how well a model (e.g., fate and transport model)approximates true relationships between site-specific environmental conditions. Models available atpresent tend to be fairly simple and at best, only partially validated with field tests. As a consequence,it is important to identify key model assumptions and their potential impacts on the risk estimates.
7.4.2 Tracking Uncertainties
In general, there are two approaches to tracking uncertainties through a risk assessment: (1) usingvarious point estimates of exposure and response to develop one or more point estimates of risk; and(2) conducting a distributional analysis to predict a distribution of risks based on a distribution ofexposure levels and exposure-response information. Whether one or the other or both approachesare taken should have been agreed to during Step 4, and the specific type of analyses to be conductedshould have been specified in the SAP.
008982

7-7
7.5 SUMMARY
Risk characterization integrates the results of the exposure profile and exposure-response analyses,and is the final phase of the risk assessment process. It consists of risk estimation and riskdescription, which together provide information to help judge the ecological significance of riskestimates in the absence of remedial activities. The risk description also identifies a threshold foreffects on the assessment endpoint as a range between contamination levels identified as posing noecological risk and the lowest contamination levels identified as likely to produce adverse ecologicaleffects. To ensure that the risk characterization is transparent, clear, and reasonable, informationregarding the strengths and limitations of the assessment must be identified and described.
008983

8-1
OVERVIEW
Risk management at a Superfund site is ultimately the responsibility of the site risk manager,who must balance risk reductions associated with cleanup of contaminants with potential impactsof the remedial actions themselves. The risk manager considers inputs from the risk assessors,BTAGs, stakeholders, and other involved parties. In Step 7, the risk assessment team identifieda threshold for effects on the assessment endpoint as a range between contamination levelsidentified as posing no ecological risk and the lowest contamination levels identified as likely toproduce adverse ecological effects. In Step 8, the risk manager evaluates several factors indeciding whether or not to clean up to within that range.
STEP 8: RISK MANAGEMENT
8.1 INTRODUCTION
Risk management is a distinctly different process from risk assessment (NRC, 1983, 1994; U.S.EPA, 1984a, 1995f). The risk assessment establishes whether a risk is present and defines a rangeor magnitude of the risk. In risk management, the results of the risk assessment are integrated withother considerations to make and justify risk management decisions. Additional risk managementconsiderations can include the implications of existing background levels of contamination, availabletechnologies, tradeoffs between human and ecological concerns, costs of alternative actions, andremedy selection. For further information on management of ecological risks Agency-wide, see U.S.EPA 1994h. Some Superfund-specific considerations are described below.
8.2 ECOLOGICAL RISK MANAGEMENT IN SUPERFUND
According to section 300.40 of the NCP, the purpose of the remedy selection process is toeliminate, reduce, or control risks to human health and the environment. The NCP indicates furtherthat the results of the baseline risk assessment will help to establish acceptable exposure levels for usein developing remedial alternatives during the FS. Based on the criteria for selecting the preferredremedy and, using information from the human health and ecological risk assessments and theevaluation of remedial options in the FS, the risk manager then selects a preferred remedy.
The risk manager must consider several types of information in addition to the baseline ecologicalrisk assessment when evaluating remedial options (Section 8.2.1). Of particular concern forecological risk management at Superfund sites is the potential for remedial actions themselves tocause adverse ecological impacts (Section 8.2.2). There also exists the opportunity to monitorecological components at the site to gauge the effectiveness (or impacts) of the selected remedy(Section 8.2.3).
008984

8-2
8.2.1 Other Risk Management Considerations
The baseline ecological risk assessment is not the only set of information that the risk managermust consider when evaluating remedial options during the FS phase of the Superfund process. TheNCP (40 CFR 300.430(f)(1)(i)) specifies that each remedial alternative should be evaluated accordingto nine criteria. Two are considered threshold criteria, and take precedence over the others:
(1) Overall protection of human health and the environment; and
(2) Compliance with applicable or relevant and appropriate requirements (ARARs) (unless waiver applicable).
As described in Section 8.2.2 below, a particularly important consideration for the first criterion arethe ecological impacts of the remedial options.
Five of the nine criteria are considered primary balancing criteria to be considered after thethreshold criteria:
(3) Long-term effectiveness and permanence;
(4) Reduction of toxicity, mobility, or volume of hazardous wastes through the use of treatment;
(5) Short-term effectiveness;
(6) Implementability; and
(7) Cost.
Finally, two additional criteria are referred to as modifying criteria that must be considered:
(8)State acceptance, and
(9)Community acceptance.
Effective risk communication is particularly important to help ensure that a remedial option that bestsatisfies the other criteria can be implemented at a site. U.S. EPA's (1996a) Proposed Guidelines forEcological Risk Assessment provides an overview of this topic and identifies some of the relevantliterature.
Additional factors that the site risk manager takes into consideration include existing backgroundlevels (see U.S. EPA, 1994g); current and likely future land uses (see U.S. EPA, 1995c); current andlikely future resource uses in the area; and local, regional, and national ecological significance of thesite. Consideration of the ecological impacts of remedial options and residual risks associated withleaving contaminants in place are very important considerations, as described in the next section.
008985

8-3
8.2.2 Ecological Impacts of Remedial Options
Management of ecological risks must take into account the potential for impacts to the ecologicalassessment endpoints from implementation of various remedial options. The risk manager mustbalance: (1) residual risks posed by site contaminants before and after implementation of the selectedremedy with (2) the potential impacts of the selected remedy on the environment independent ofcontaminant effects. The selection of a remedial alternative could require tradeoffs between long-term and short-term risk.
The ecological risks posed by the "no action" alternative are the risks estimated by the baselineecological risk assessment. In addition, each remedial option is likely to have its own ecologicalimpact. This impact could be anything from a short-term loss to complete and permanent loss of thepresent habitat and ecological communities. In instances where substantial ecological impacts willresult from the remedy (e.g., dredging a wetland), the risk manager will need to consider ways tomitigate the impacts of the remedy and compare the mitigated impacts to the threats posed by the sitecontamination.
During the FS, the boundaries of potential risk under the no-action alternative (i.e., baselineconditions) can be compared with the evaluation of potential impacts of the remedial options to helpjustify the preferred remedy. As indicated above, the preferred remedy should minimize the risk oflong-term impacts that could result from the remedy and any residual contamination. When theselected remedial option leaves some site contaminants presumed to pose an ecological risk in place,the justification for the selected remedy must be clearly documented.
In short, consideration of the environmental effects of the remedy itself might result in a decisionto allow contaminants to remain on site at levels higher than the threshold for effects on theassessment endpoint. Thus, selection of the most appropriate ecologically based remedy can resultin residual contamination that presents some risk.
8.2.3 Monitoring
Ecological risk assessment is a relatively new field with limited data available to validate itspredictions. At sites where remedial actions are taken to reduce ecological impacts and risks, theresults of the remediation efforts should be compared with the predictions made during the ecologicalrisk assessment.
While it often is difficult to demonstrate the effectiveness of remedial actions in reducing humanhealth risks, it often is possible to demonstrate the effectiveness of remediations to reduce ecologicalrisks, particularly if a several-year monitoring program is established. The site conceptual modelprovides the conceptual basis for monitoring options, and the site investigation should have indicatedwhich options might be most practical for the site. Monitoring also is important to assess theeffectiveness of a no-action alternative. For example, monitoring sediment contamination and benthiccommunities at intervals following removal of a contaminant source allows one to test predictionsof the potential for the ecosystem to recover naturally over time.
008986
8-4
8.3 SCIENTIFIC/MANAGEMENT DECISION POINT (SMDP)
The risk management decision is finalized in the Record of Decision (ROD). The decision shouldminimize the risk of long-term impacts that could result from the remedy and any residualcontamination. When the selected remedy leaves residual contamination at levels higher than theupper-bound estimate of the threshold for adverse effects on the assessment endpoint, the riskmanager should justify the decision (e.g., describe how a more complete physical remedy couldjeopardize an ecological community more than the residual contamination).
8.4 SUMMARY
Risk-management decisions are the responsibility of the risk manager (the site manager), not therisk assessor. The risk manager should have been involved in planning the risk assessment; knowingthe options available for reducing risks, the risk manager can help to frame questions during theproblem-formulation phase of the risk assessment.
The risk manager must understand the risk assessment, including its uncertainties, assumptions,and level of resolution. With an understanding of potential adverse effects posed by residual levelsof site contaminants and posed by the remedial actions themselves, the risk manager can balance theecological costs and benefits of the available remedial options. Understanding the uncertaintiesassociated with the risk assessment also is critical to evaluating the overall protectiveness of anyremedy.
008987

Bibliography-1
This combined reference list and bibliography is intended to provide a broad, but not allinclusive, list of other materials that may provide useful information for ecological riskassessments at Superfund sites. These documents include other Superfund Program guidancedocuments, standard guides for toxicity testing, other EPA program office references withpotential applications at Superfund sites, and other ecological risk assessment reference materials.References cited in the text are marked with an asterisk (*).
BIBLIOGRAPHY
American Public Health Association (APHA). 1989. Standard Methods for Examination of Waterand Wastewater. 17th edition. Washington, DC: APHA.
American Society for Testing and Materials (ASTM). 1994a. Annual Book of ASTM Standards.Philadelphia, PA: ASTM.
American Society for Testing and Materials (ASTM). 1994b. Standard guide for conductingsediment toxicity tests with freshwater invertebrates: ASTM Standard E 1383-94.
American Society for Testing and Materials (ASTM). 1993a. Standard terminology relating tobiological effects and environmental fate: ASTM Standard E 943-93.
American Society for Testing and Materials (ASTM). 1993b. Standard guide for designingbiological tests with sediments: ASTM Standard E 1525-93.
American Society for Testing and Materials (ASTM). 1993. ASTM Standards of AquaticToxicology and Hazard Evaluation. Philadelphia, PA: ASTM.
American Society for Testing and Materials (ASTM). 1992. Standard guide for conducting sedimenttoxicity tests with freshwater invertebrates: ASTM Standard E 1383-92.
American Society for Testing and Materials (ASTM). 1992. Standard guide for conducting 10-daystatic sediment toxicity tests with marine and estuarine amphipods: ASTM Standard E 1367-92.
American Society for Testing and Materials (ASTM). 1990. Standard guide for collection, storage,characterization, and manipulation of sediments for toxicological testing: ASTM Standard E1391-90.
American Society for Testing and Materials (ASTM). 1988. Standard guide for conducting earlylife-stage toxicity tests with fishes: ASTM Standard E 1241-88.
008988

Bibliography-4
American Society for Testing and Materials (ASTM). 1984. Standard Practice for conductingbioconcentration tests with fishes and saltwater bivalve mollusks: ASTM Standard E 1022-84.
American Society for Testing and Materials (ASTM). 1980. Practice for conducting acute toxicitytests with fishes, macroinvertebrates, and amphibians: ASTM Standard E 729-80.
American Society for Testing and Materials (ASTM). 1980. Practice for conducting static acutetoxicity tests with larvae of four species of bivalve mollusks: ASTM Standard E 724-80.
*Anderson and Hickey. 1972. Eggshell changes in certain North American birds. Proc. Int.Ornithol. Congr. 15: 514-540.
Ankley, G.T.; Thomas, N.A.; Di Toro, D.M.; et al. 1994. Assessing potential bioavailability ofmetals in sediments: a proposed approach. Environ. Manage. 18: 331-337.
*Aulerich, R.J.; Ringer, R.K. 1977. Current status of PCB toxicity to mink and effect on theiryoung. Arch. Environ. Contam. Toxicol. 6: 279-292.
*Aulerich, R.J.; Bursian, S.J.; Breslin, W.J.; et al. 1985. Toxicological manifestations of 2,4,5-,2',4',5'-, 2,3,6,2',3',6'-, and 3,4,5,3',4',5'-hexachlorobiphenyl and Aroclor 1254 in mink. J.Toxicol. Environ. Health 15: 63-79.
Barnhouse, L.W.; Suter, G.W.; Bartell, S.M.; et al. 1986. User's Manual for Ecological RiskAssessment. Oak Ridge, TN: Oak Ridge National Laboratory, Environmental Sciences DivisionPublication No. 2679.
Bartell, S.M.; Gardner, R.H.; O'Neill, R.V. 1992. Ecological Risk Estimation. New York, NY:Lewis Publishers.
Baudo, R.; Giesy, J.P.; Muntau, H. 1990. Sediments: Chemistry and Toxicity of In-place Pollutants.Ann Arbor, MI: Lewis Publishers.
Burton, G.A., Jr. (ed.). 1992. Sediment Toxicity Assessment. Ann Arbor, MI: Lewis Publishers.
Cairns, J. Jr.; Niederlehner, B.R. 1995. Ecological Toxicity Testing: Scale, Complexity, andRelevance. Boca Raton, FL: CRC Press, Inc., Lewis Publishers.
Calabrese, E.J.; Baldwin, L.A. 1993. Performing Ecological Risk Assessments. New York, NY:Lewis Publishers.
Carter, M.R. (ed.). 1993. Soil Sampling and Methods of Analysis. Boca Raton, FL: CRC Press,Inc., Lewis Publishers.
008989

Bibliography-5
*Chapman, P.M.; Power, E.A.; Burton, G.A., Jr. 1992. Integrative assessments in aquaticecosystems. In: Burton, G.A., Jr., (ed.) Sediment Toxicity Assessment. Boca Raton, FL: LewisPublishers.
Calow, P. (ed.). 1993. Handbook of Ecotoxicology, Volume 1. Boston, MA: Blackwell Publishers.
Cochran, W.G. 1977. Sampling Techniques. Third edition. New York, NY: John Wiley and Sons,Inc.
Cochran, W.G.; Cox, G.M. 1957. Experimental Design. New York, NY: Wiley.
Cockerham, L.G.; Shane, B.S. (eds.). 1994. Basic Environmental Toxicology. Boca Raton, FL:CRC Press, Inc., Lewis Publishers.
*Cooke, A.S. 1971. Selective predation by newts on frog tadpoles treated with DDT. Nature 229:275-276.
Cowardin, L.M.; Carter, V.; Golet, F.C.; LaRoe, E.T. 1979. Classification of Wetlands andDeepwater Habitats of the United States. Washington, DC: U.S. Fish and Wildlife Service;FWS/OBS-79/31.
Crawley, M.J. 1993. GLIM for Ecologists. Oxford, UK: Blackwell Scientific Publications.
Curtis, H. 1983. Biology. Fourth Edition. New York, NY: Worth.
Daniel, W.W. 1990. Applied Nonparametric Statistics. Boston, MA: PWS-KENT PublishingCompany.
Davis, W.S.; Simon, T.P. 1995. Biological Assessment and Criteria: Tools for Water ResourcePlanning and Decision Making. Boca Raton, FL: CRC Press, Inc., Lewis Publishers.
Diggle, P.J. 1990. Time Series: A Biosatistical Introduction. Oxford Statistical Science Series No.5. Oxford, UK: Clarendon Press.
*Dilworth, T.G., Keith, J.A.; Pearce, P.A.; Reynolds, L.M. 1972. DDE and eggshell thickness inNew Brunswick woodcock. J. Wildl. Manage. 36: 1186-1193.
*Dourson, M.L.; Stara, J.F. 1983. Regulatory history and experimental support of uncertainty(safety) factors. Reg. Toxicol. Pharmacol. 3: 224-238.
Finney, D.J. 1964. Statistical Method in Biological Assay. London, UK: Charles Griffin andCompany.
Finney, D.J. 1970. Probit Analysis: A Statistical Treatment of the Sigmoid Response Curve.Cambridge, UK: Cambridge University Press.
008990

Bibliography-6
*Foley, R.E.; Jackling, S.J.; Sloan, R.J. et al. 1988. Organochlorine and mercury residues in wildmink and otter: comparison with fish. Environ. Toxicol. Chem. 7: 363-374.
*Fox, G.A.; Collins, B.; Hayaskawa, E.; et al. 1991. Reproductive outcomes in colonial fish-eatingbirds: a biomarker for developmental toxicants in Great Lakes food chains. II. Spatial variationin the occurrence and prevalence of bill defects in young double-crested cormorants in the GreatLakes. J. Great Lakes Res. 17:158-167.
Freedman, B. 1989. Environmental Ecology. The Impacts of Pollution and Other Stresses onEcosystem Structure and Function. New York, NY: Academic Press.
*Geller, M.D. 1979. Dynamics of three populations of Microtus pennsylvanicus in the NorthwesternUnited States. PhD Thesis. Binghamton, NY: State University of New York.
Gilbert, R.O. 1987. Statistical Methods for Environmental Pollution Monitoring. New York, NY:Reinhold.
Green, R.H. 1979. Sampling Design and Statistical Methods for Environmental Biologists. NewYork, NY: Wiley.
Hamelink, J.L.; Landrum, P.F.; Bergman, H.L.; Benson, W.H. (eds). 1994. Bioavailability:Physical, Chemical, and Biological Interactions. Boca Raton, FL: CRC Press, Inc., LewisPublishers.
Hill, I.R.; Matthiessen, P.; Heimbach, F. (eds.). 1993. Guidance Document on Sediment ToxicityTests and Bioassays for Freshwater and Marine Environments. From the Workshop onSediment Toxicity Assessment, Renesse, The Netherlands, November 8-10, 1993. Amsterdam,The Netherlands: Society of Environmental Toxicology and Chemistry - Europe.
*Hill, A.B. 1965. The environment and disease: Association or causation? Proceed. Royal Soc.Med. 58: 285-300.
*Hoffman, D.J.; Rice, C.P.; Kubiak, T.J. 1996. PCBs and dioxins in birds. In: Beyer, W.N.; Heinz,G.H.; Redmon-Norwood, A.R. (eds.). Environmental Contaminants in Wildlife: InterpretingTissue Concentrations. A Special Publication of the Society of Environmental Toxicology andChemistry (SETAC), La Point, T.W. (series ed.). Boca Raton, FL: CRC Press, Inc., LewisPublishers. pp. 165-208.
Howard, P.H.; Jarvis, W.F.; Meyland, W.M.; Michalenko, E.M. 1991. Handbook of EnvironmentalDegradation Rates. Boca Raton, FL: CRC Press, Inc., Lewis Publishers.
Hugget, R.J.; Kimerle, R.A.; Mehrle, P.M., Jr.; Bergman, H.L. 1992. Biomarkers: Biochemical,Physiological, and Histological Markers of Anthropogenic Stress. A Special Publication of theSociety of Environmental Toxicology and Chemistry (SETAC), Ward, C.H.; Walton, B.T; LaPoint, T.W. (series eds.). Boca Raton, FL: CRC Press, Inc., Lewis Publishers.
008991

Bibliography-7
Kabata-Pendias, A.; Pendias, H. 1984. Trace Elements in Soils and Plants. Boca Raton, FL: CRC
Press, Inc.
*Kamrin, M.A.; Ringer, R.K. 1996. Toxicological implicatations of PCB residues in mammals. In:Beyer, W.N.; Heinz, G.H.; Redmon-Norwood, A.R. (eds.). Environmental Contaminants inWildlife: Interpreting Tissue Concentrations. A Special Publication of the Society ofEnvironmental Toxicology and Chemistry (SETAC), La Point, T.W. (series ed.). Boca Raton,FL: CRC Press, Inc., Lewis Publishers. pp 153-164.
Keith, L.H. (ed.). 1996. EPA's Sampling and Analysis Methods Database; Version 2.0. BocaRaton, FL: CRC Press, Inc., Lewis Publishers.
Keith, L.H. (ed.). 1988. Principles of Environmental Sampling. American Chemical Society.
Kendall, R.J.; Lacher, T.E. (eds.). 1994. Wildlife Toxicology and Population Modeling: IntegratedStudies of Agroecosystems. A Special Publication of the Society of Environmental Toxicologyand Chemistry (SETAC), La Point, T.W. (series ed.). Boca Raton, FL: CRC Press, Inc., LewisPublishers.
*Kenzaburo, T. 1986. Lead. In: Friberg, L.; Norberg, G.F.; Vouk, V.B (eds.). Handbook on theToxicology of Metals. New York, NY: Elsevier.
*Klemm, D.J.; Lewis, P.A.; Fulk, F.; Lazorchak, J.M. 1990. Macroinvertebrate Field andLaboratory Methods for Evaluating the Biological Integrity of Surface Waters. Washington,DC: U.S. Environmental Protection Agency. EPA/600/4-90/030.
Kraus, M.L. 1989. Bioaccumulation of heavy metals in pre-fledgling tree swallows, Tachycimetabicolor. Environ. Contam. Toxicol. 43: 407-414.
Krebs, C.J. 1978. Ecology: The Experimental Analysis of Distribution and Abundance; SecondEdition. New York, NY: Harper & Row.
*Krebs, C.J.; Valiela, I.; Harvey, G.R.; Teal, J.M. 1974. Reduction of field populations of fiddlercrabs by uptake of chlorinated hydrocarbons. Mar. Pollut. Bull. 5: 140-142.
*Kubiak, T.J.; Harris, H.J.; Smith, L.M.; et al. 1989. Microcontaminants and reproductiveimpairment of the Forster's tern on Green Bay, Lake Michigan—1983. Arch. Environ. Contam.Toxicol. 18: 706-727.
Landis, W.G.; Yu, M. 1995. Introduction to Environmental Toxicology: Impacts of Chemicalsupon Ecological Systems. Boca Raton, FL: CRC Press, Inc., Lewis Publishers.
Landis, W.G.; Hughes, J.S.; Lewis, M.A. (eds.). 1993. Environmental Toxicity and RiskAssessment. Philadelphia, PA: American Society for Testing and Materials.
008992

Bibliography-8
*Long, E.R.; Chapman, P.M. 1985. A sediment quality triad: measures of sediment contamination,toxicity, and infaunal community composition in Puget Sound. Mar. Pollut. Bull. 16: 405-415.
Lyon, J.G. 1993. Practical Handbook for Wetland Identification and Delineation. Boca Raton,FL: CRC Press, Inc., Lewis Publishers.
Manahan, S. 1994. Environmental Chemistry; Sixth Edition. Boca Raton, FL: CRC Press, Inc.,Lewis Publishers.
Maughan, J.T. 1993. Ecological Assessment of Hazardous Waste Sites. New York, NY: VanNostrand Reinhold.
*McNamara, B.P. 1976. Concepts in health evaluation of commercial and industrial chemicals. In:Mehlman, M.A.; Shapiro, R.E., and Blumenthal, H. (eds.), Advances in Modern Toxicology,Volume 1, Part 1: New Concepts in Safety Evaluation. pp. 61-140. Washington, DC:Hemisphere Publishing Corporation.
Mead, R. 1988. The Design of Experiments. Cambridge, UK: Cambridge University Press.
Moltmann, J.F.; Römbke, J. 1996. Applied Ecotoxicology. Boca Raton, FL: CRC Press, Inc.,Lewis Publishers.
Morgan, B.J. 1993. Analysis of Quantal Response Data. London, UK: Chapman and Hall.
Mudroch, A.; Azcue, J.M. 1995. Manual of Aquatic Sediment Sampling. Boca Raton, FL: CRCPress, Inc., Lewis Publishers.
Mudroch, A; MacKnight, S.D. (eds.). 1994. Handbook of Techniques for Aquatic SedimentSampling; Second Edition. Boca Raton, FL: CRC Press, Inc., Lewis Publishers.
Murdoch, A.; MacKnight, S.D. (eds.). 1991. CRC Handbook of Techniques for Aquatic SedimentsSampling. Boca Raton, FL: CRC Press.
National Oceanic and Atmospheric Administration (NOAA). 1987. Guidelines andRecommendations for Using Bioassessment in the Superfund Remedial Process. Seattle, WA:Ocean Assessments Division. Prepared by Christopherson, S., and Field, L.J., National Oceanicand Atmospheric Administration, and Dexter, R.N., E.V.S. Consultants.
*National Research Council (NRC). 1994. Science and Judgment in Risk Assessment. Washington,DC: National Academy Press.
**National Research Council (NRC). 1993. Issues in Risk Assessment. Washington, DC: NationalAcademy Press.
008993

Bibliography-9
*National Research Council (NRC). 1983. Risk Assessment in the Federal Government: Managingthe Process. Washington, DC: National Academy Press.
*Nebeker, A.V.; Cairns, M.A.; Wise, C.M. 1984. Relative sensitivity of Chironomus tetans lifestages to copper. Environ. Toxicology and Chemistry 3: 151-158.
Neilson, A.H. 1994. Organic Chemicals in the Aquatic Environment: Distribution, Persistence,and Toxicity. Boca Raton, FL: CRC Press, Inc., Lewis Publishers.
Newman, M.C. 1995. Quantitative Methods in Aquatic Ecotoxicology. Boca Raton, FL: CRCPress, Inc., Lewis Publishers.
Newman, M.C.; McIntosh, A.W. (eds.). 1991. Metal Ecotoxicology: Concepts and Applications.
Boca Raton, FL: CRC Press, Inc., Lewis Publishers.
Oak Ridge National Laboratory (ORNL). 1994. Manual for PC-Data Base Screening Benchmarksfor Ecological Risk Assessment. Environmental Sciences Division, Health Sciences ResearchDivision. Prepared by Martin Marietta Energy Systems, Inc., for the U.S. Department of Energy.ORNL/TM-12898.
Oak Ridge National Laboratory (ORNL). 1994. Toxicological Benchmarks for ScreeningContaminants of Potential Concern for Effects on Sediment-Associated Biota: 1994 Revision.Prepared by Hull, R.N.; Suter, G.W., II; Energy Systems Environmental Restoration Program,ORNL Environmental Restoration Program (managed by Martin Marietta Energy Systems, Inc.,for the U.S. Department of Energy). ES/ER/TM-95/R1.
Oak Ridge National Laboratory (ORNL). 1994. Toxicological Benchmarks for Screening PotentialContaminants of Concern for Effects on Aquatic Biota: 1994 Revision. Prepared by Suter,G.W., II; Mabrey, J.B.; ORNL Environmental Sciences Division, for the U.S. Department ofEnergy. ES/ER/TM-96/R1.
Oak Ridge National Laboratory (ORNL). 1994. Toxicological Benchmarks for Wildlife: 1994Revision. Prepared by Opresko, D. M., Sample, B., E., and Suter, G. W. II, ORNLEnvironmental Sciences Division, for the U.S. Department of Energy. ES/ER/TM-86/R1.
Oak Ridge National Laboratory (ORNL). 1994. Toxicological Benchmarks for Screening PotentialContaminants of Concern for Effects on Terrestrial Plants: 1994 Revision. Prepared by Will,M. E., and Suter, G. W. II, ORNL Environmental Sciences Division, for the U.S. Department ofEnergy. ES/ER/TM-85/R1.
Ostrander, G. (ed.). 1996. Handbook of Aquatic Toxicology Methods. Boca Raton, FL: CRCPress, Inc., Lewis Publishers.
Ott, W.R. 1995. Environmental Statistics and Data Analysis. Boca Raton, FL: CRC Press, Inc.,Lewis Publishers.
008994

Bibliography-10
Pacific Northwest National Laboratory (PNNL). 1997. Using the Data Quality Objectives ProcessDuring the Design and Conduct of Ecological Risk Assessments. Prepared by Bilyard, G.R.;Beckert, H.; Bascietto, J.J.; Abrams, C.W.; Dyer, S.A.; Haselow, L.A.; PNNL for the U.S.Department of Energy, Office of Environmental Policy and Health. DOE/EH-0544.
Pain, D.J. 1995. Lead in the environment. In: Handbook of Ecotoxicology. pp 356-391.
Parker, S.P. (ed.). 1994. Dictionary of Scientific and Technical Terms; Fifth Edition. New York,NY: McGraw-Hill.
*Pascoe, D.; Williams, K.A.; Green, D.W.J. 1989. Chronic toxicity of cadmium to Chironomusriparious Meigen - effects upon larval development and adult emergence. Hydrobiologia 175:109-115.
*Phillips, D.H. 1978. The use of biological indicator organisms to quantitate organochlorinepollutants in aquatic environments ! a review. Environ. Pollut. 16: 167-227.
*Phillips, D.H. 1977. The use of biological indicator organisms to monitor trace metal pollution inmarine and estuarine environments ! a review. Environ. Pollut. 13: 281-317.
Ramamoorthy, S.; Baddaloo, E.G. 1995. Handbook of Chemical Toxicity Profiles of BiologicalSpecies; Volume 1: Aquatic Species. Boca Raton, FL: CRC Press, Inc., Lewis Publishers.
Rand, G.M.; Petrocelli, S.R. 1985. Fundamentals of Aquatic Toxicology. Methods andApplications. New York, NY: McGraw Hill.
Renzoni, A.; Fossi, M.C.; Lari, L.; Mattei, N. (eds.). 1994. Contaminants in the Environment. AMultidisciplinary Assessment of Risks to Man and Other Organisms. Boca Raton, FL: CRCPress, Inc., Lewis Publishers.
*Rice, C.P; O'Keefe, P. 1995. Sources, pathways, and effects of PCBs, dioxins, and dibenzofurans.In: Hoffman, D.J.; Rattner, B.A.; Burton, G.A. Jr.; Cairns, J., Jr. (eds.). Handbook ofEcotoxicology. Ann Arbor, MI: CRC Press, Inc., Lewis Publishers.
Ricklefs, R.E. 1990. Ecology. Second Edition. New York, NY: W.H. Freeman.
*Ringer, R.K.; Aulerich, R.J.; Zabik, M. 1972. Effect of dietary polychlorinated biphenyls ongrowth and reproduction of mink. Extended abstract. ACS (American Chemical Society) 164thAnnu. Meet. 12: 149-154.
*Roy F. Weston, Inc. 1994. Analytical methods/standard operating procedures for tissue analysis.Prepared for U.S. EPA Environmental Response Team, Edison, NJ.
Siegel, S. 1956. Non-parametric Statistics. New York, NY: McGraw-Hill.
008995

Bibliography-11
Sokal, R.R.; Rohlf, F.J. 1981. Biometry. Second Edition. New York, NY: W.H. Freeman.
Sullivan, T.F. 1993. Environmental Regulatory Glossary. Government Institutes, Inc.
Suter, G.W., II. 1993. Ecological Risk Assessment. Ann Arbor, MI: Lewis Publishers.
Talmage, S.S.; Walton, B.T. 1991. Small mammals as monitors of environmentalcontaminants. Reviews of Environmental Contamination and Toxicology 119: 95.
Trapp, S.; McFarlane, J.C. (eds.). 1995. Plant Contamination: Modeling and Simulation ofOrganic Chemical Processes. Boca Raton, FL: CRC Press, Inc., Lewis Publishers.
U.S. Department of the Interior (U.S. DOI). 1991. Plant toxicity testing with sediment and marshsoils. Technical Report NPS/NRWRD/NRTR-91/03.
U.S. Department of the Interior (U.S. DOI). 1987. Guidance on Use of Habitat EvaluationProcedures and Suitability Index Models for CERCLA Application. Washington, DC: U.S. Fishand Wildlife Service, National Ecology Center; PB86-100151.
*U.S. Environmental Protection Agency (U.S. EPA). 1997. Representative Sampling GuidanceDocument, Volume 3: Ecological, Draft. Edison, NJ: Environmental Response Team Center,Office of Emergency and Remedial Response.
*U.S. Environmental Protection Agency (U.S. EPA). 1996a. Proposed Guidelines for EcologicalRisk Assessment. Cincinnati, OH: Office of Research and Development Publications,Technology Transfer and Support Division, August. EPA/630/R-95/002B.
*U.S. Environmental Protection Agency (U.S. EPA). 1996b. Proposed Guidelines for CarcinogenRisk Assessment. Washington, DC: Office of Research and Development, April. EPA/600/P-92/003C.
*U.S. Environmental Protection Agency (U.S. EPA). 1996c. Ecotox Thresholds. ECO Update,Interim Bulletin, Volume 3, Number 2. Washington, DC: Office of Emergency and RemedialResponse, Hazardous Site Evaluation Division; Publication 9345.0-12FSI; EPA/540/F-95/038;NTIS PB95-963324.
*U.S. Environmental Protection Agency (U.S. EPA). 1995a. Great Lakes Water Quality InitiativeCriteria Documents for the Protection of Wildlife. Washington, DC: Office of Water.EPA/820/B-95/008.
*U.S. Environmental Protection Agency (U.S. EPA). 1995b. Ecological Significance and Selectionof Candidate Assessment Endpoints. ECO Update, Intermittent Bulletin, Volume 3, Number 1.Washington, DC: Office of Emergency and Remedial Response, Hazardous Site EvaluationDivision; Publication 9345.0-11FSI; EPA/540/F-95/037; NTIS PB95-963323.
008996

Bibliography-12
*U.S. Environmental Protection Agency (U.S. EPA). 1995c. Land Use in the CERCLA RemedySelection Process. May 25 Memorandum from Elliot P. Laws, Assistant Administrator, to EPARegional staff. OSWER Directive No. 9355:7-04.
*U.S. Environmental Protection Agency (U.S. EPA). 1995d. Great Lakes Water Quality InitiativeTechnical Support Document for the Procedure to Determine Bioaccumulation Factors.Washington, DC: Office of Water; EPA/820/B-95/005.
*U.S. Environmental Protection Agency (U.S. EPA). 1995e. Great Lakes Water Quality InitiativeCriteria Documents for the Protection of Aquatic Life in Ambient Water. Washington, DC:Office of Water; EPA/820/B-95/004.
*U.S. Environmental Protection Agency (U.S. EPA). 1995f. EPA Risk Characterization Policy.March 21 Memorandum from Carol Browner, Administrator, to EPA staff. Washington, DC:Office of the Administrator.
*U.S. Environmental Protection Agency (U.S. EPA). 1995g. Technical Support Document for theHazardous Waste Identification Rule: Risk Assessment for Human and Ecological Receptors,Volume I. Washington, DC: Prepared for the Office of Sold Waste under Contract No. 68-D2-0065, 68-W3-0028; August.
*U.S. Environmental Protection Agency (U.S. EPA). 1995h. Technical Support Document for theHazardous Waste Identification Rule: Risk Assessment for Human and Ecological Receptors,Volume II. Washington, DC: Prepared for the Office of Sold Waste under Contract No. 68-D2-0065, 68-W3-0028; August.
U.S. Environmental Protection Agency (U.S. EPA). 1995. Ecological Risk: A Primer for RiskManagers. Washington, DC: EPA/734/R-95/001.
U.S. Environmental Protection Agency (U.S. EPA). 1995. Draft Science Policy Council Statementon EPA Policy: Cumulative Risk Framework, With a Focus on Improved Characterization ofRisks for Multiple Endpoints, Pathways, Sources, and Stressors. Washington, DC: SciencePolicy Council.
*U.S. Environmental Protection Agency (U.S. EPA). 1994a. Memorandum from Carol Browner,Administrator, to Assistant Administrators concerning "Toward a Place-Driven Approach: TheEdgewater Concensus on an EPA Stategy for Ecosystem Protection. May 24.
*U.S. Environmental Protection Agency (U.S. EPA). 1994b. Using Toxicity Tests in EcologicalRisk Assessment. ECO Update, Intermittent Bulletin, Volume 2, Number 1. Washington, DC:Office of Emergency and Remedial Response, Hazardous Site Evaluation Division; Publication9345.0-05I; EPA/540/F-94/012; NTIS PB94-963303.
*U.S. Environmental Protection Agency (U.S. EPA). 1994c. Catalogue of Standard Toxicity Testsfor Ecological Risk Assessment. ECO Update, Intermittent Bulletin, Volume 2, Number 2.
008997

Bibliography-13
Washington, DC: Office of Emergency and Remedial Response, Hazardous Site EvaluationDivision; Publication 8345.0-05I; EPA/540/F-94/013; NTIS PB94-963304.
*U.S. Environmental Protection Agency (U.S. EPA). 1994d. Field Studies for Ecological RiskAssessment. ECO Update, Intermittent Bulletin, Volume 2, Number 3. Washington, DC: Officeof Emergency and Remedial Response, Hazardous Site Evaluation Division; Publ. 9345.0-05I;EPA/540/F-94/014; NTIS PB94-963305.
*U.S. Environmental Protection Agency (U.S. EPA). 1994e. Selecting and Using ReferenceInformation in Superfund Ecological Risk Assessments. ECO Update, Intermittent Bulletin,Volume 2, Number 4. Washington, DC: Office of Emergency and Remedial Response,Hazardous Site Evaluation Division; Publication 9345.10I; EPA/540/F-94/050; NTIS PB94-963319.
**U.S. Environmental Protection Agency (U.S. EPA). 1994f. Guidance for the Data QualityObjectives Process; EPA QA/G-4. Washington, DC: Quality Assurance Management Staff;Final, September.
*U.S. Environmental Protection Agency (U.S. EPA). 1994g. Establishing Background Levels.Quick Reference Fact Sheet. Washington, DC: Office of Solid Waste and Emergency Response.OSWER Directive 9285.7-19FS. Publication PB94-963313; EPA/540/F-94/030.
*U.S. Environmental Protection Agency (U.S. EPA). 1994h. Methods for Measuring the Toxicityand Bioaccumulation of Sediment-associated Contaminants with Freshwater Invertebrates.Washington, DC: Office of Research and Development. EPA 600/R-94/024.
U.S. Environmental Protection Agency (U.S. EPA). 1994. Peer Review Workshop Report onEcological Risk Assessment Issue Papers. Washington, DC: Office of Research andDevelopment, Risk Assessment Forum; EPA/630/R-94/008.
U.S. Environmental Protection Agency (U.S. EPA). 1994. A Review of Ecological Assessment CaseStudies from a Risk Assessment Perspective, Volume II. Washington, DC: Office of Researchand Development, Risk Assessment Forum; EPA/630/R-94/003.
U.S. Environmental Protection Agency (U.S. EPA). 1994. Ecological Risk Assessment IssuePapers. Washington, DC: Office of Research and Development, Risk Assessment Forum;EPA/630/R-94/009.
U.S. Environmental Protection Agency (U.S. EPA). 1994. Managing Ecological Risks at EPA:Issues and Recommendations for Progress. Washington, DC: Office of Research andDevelopment, Office of Policy, Planning, and Evalaution; EPA/600/R-94/183.
U.S. Environmental Protection Agency (U.S. EPA). 1994. Methods for Measuring the Toxicity ofSediment Toxicity of Sediment-associated Contaminants with Estuarine and Marine Amphipods.Washington, DC: Office of Research and Development. EPA 600/R-94/025.
008998

Bibliography-14
*U.S. Environmental Protection Agency (U.S. EPA). 1993a. Wildlife Exposure Factors HandbookVolume I. Washington, DC: Office of Research and Development; EPA/600/R-93/187a.
*U.S. Environmental Protection Agency (U.S. EPA). 1993b. Wildlife Exposure Factors HandbookVolume II: Appendix. Washington, DC: Office of Research and Development; EPA/600/R-93/187b.
*U.S. Environmental Protection Agency (U.S. EPA). 1993c. Data Quality Objectives Process forSuperfund. Washington, DC: Office of Emergency and Remedial Response; Interim FinalGuidance; EPA/540/G-93/071.
*U.S. Environmental Protection Agency (U.S. EPA). 1993d. Data Quality Objectives Process forSuperfund. Workbook. Washington, DC: Office of Emergency and Remedial Response;EPA/540/R-93/078.
*U.S. Environmental Protection Agency (U.S. EPA). 1993e. Wildlife Criteria Portions of theProposed Water Quality Guidance for the Great Lakes System. Washington, DC: Office ofWater; EPA/822/R-93/006.
*U.S. Environmental Protection Agency (U.S. EPA). 1993f. Guidance for Planning for DataCollection in Support of Environmental Decision Making Using the Data Quality ObjectivesProcess. Interim Final. Quality Assurance Management Staff; EPA QA/G-4.
U.S. Environmental Protection Agency (U.S. EPA). 1993. A Review of Ecological Assessment CaseStudies from a Risk Assessment Perspective. Washington, DC: Risk Assessment Forum;EPA/630/R-92/005.
U.S. Environmental Protection Agency (U.S. EPA). 1993. Technical Basis for Deriving SedimentQuality Criteria for Nonionic Organic Contaminants for the Protection of Benthic Organismsby Using Equilibrium Partitioning. Washington, DC: Office of Water; EPA/822/R-93/011.
U.S. Environmental Protection Agency (U.S. EPA). 1993. Guidelines for Deriving Site-SpecificSediment Quality Criteria for the Protection of Benthic Organisms. Washington, DC: Officeof Water; EPA/822/R-93/017.
*U.S. Environmental Protection Agency (U.S. EPA). 1992a. Framework for Ecological RiskAssessment. Washington, DC: Risk Assessment Forum; EPA/630/R-92/001.
*U.S. Environmental Protection Agency (U.S. EPA). 1992b. Developing a Work Scope forEcological Assessments. ECO Update, Intermittent Bulletin, Volume 1, Number 4. Washington,DC: Office of Emergency and Remedial Response, Hazardous Site Evaluation Division; Publ.9345.0-05I.
*U.S. Environmental Protection Agency (U.S. EPA). 1992c. The Role of Natural ResourceTrustees in the Superfund Process. ECO Update, Intermittent Bulletin, Volume 1, Number 3.
008999

Bibliography-15
Washington, DC: Office of Emergency and Remedial Response, Hazardous Site EvaluationDivision; Publ. 9345.0-05I.
*U.S. Environmental Protection Agency (U.S. EPA). 1992d. Briefing the BTAG: IntitialDescription of Setting, History, and Ecology of a Site. ECO Update, Intermittent Bulletin,Volume 1, Number 5. Washington, DC: Office of Emergency and Remedial Response,Hazardous Site Evaluation Division; Publ. 9345.0-05I.
*U.S. Environmental Protection Agency (U.S. EPA). 1992e. Draft Report: A Cross-speciesScaling Factor for Carcinogen Risk Assessment Based on Equivalence of mg/kg^3/4 per day;Notice. Federal Register. 57(109): 24152-24173 (June 5).
*U.S. Environmental Protection Agency (U.S. EPA). 1992f. Guidance on Risk Characterizationfor Risk Managers and Risk Assessors. February 26 Memorandum from F. Henry Habicht II,Deputy Administrator, to EPA Assistant Administrators and Regional Administrators.Washington, DC: Office of the Deputy Administrator.
U.S. Environmental Protection Agency (U.S. EPA). 1992. Sediment Classification MethodsCompendium. Washington, DC: Office of Water; EPA/823/R-092/006.
U.S. Environmental Protection Agency (U.S. EPA). 1992. Superfund Ecological AssessmentProcess Case Studies. Washington, DC: Office of Emergency and Remedial Response,Hazardous Site Evaluation Division, Toxics Integration Branch. Prepared by The CadmusGroup, Incorporated.
U.S. Environmental Protection Agency (U.S. EPA). 1992. Peer Review Workshop Report on aFramework for Ecological Risk Assessment. Washington, DC: Risk Assessment Forum;EPA/625/3-91/022.
U.S. Environmental Protection Agency (U.S. EPA). 1992. Report on the Ecological RiskAssessment Guidelines Strategic Planning Workshop. Washington, DC: Risk AssessmentForum; EPA/630/R-92/002.
U.S. Environmental Protection Agency (U.S. EPA). 1992. Guidelines for Exposure Assessment.Federal Register. 57: 22888-22938 (May 29).
U.S. Environmental Protection Agency (U.S. EPA). 1992. Dermal Exposure - Principles andApplications; Final; Washington, DC: Office of Health and Environmental Assessment;EPA/600/8-91/011B.
U.S. Environmental Protection Agency (U.S. EPA). 1992. Science Advisory Board's Review of theDraft Final Exposure Assessment Guidelines (SAB Final Review Draft, August 1991).Washington, DC: Science Advisory Board; EPA/SAB/IAQC-92/015.
009000

Bibliography-16
U.S. Environmental Protection Agency (U.S. EPA). 1992. Interim Guidance on the Interpretationand Implementation of Aquatic Life Criteria for Metals. Washington, DC: Office of Water,Office of Science and Technology, Health and Ecological Criteria Division.
*U.S. Environmental Protection Agency (U.S. EPA). 1991a. Risk Assessment Guidance forSuperfund: Volume I - Human Health Evaluation Manual (Part B, Development of Risk-BasedPreliminary Remediation Goals), Interim. Washington, DC: Office of Emergency and RemedialResponse; 9285.7-01B.
*U.S. Environmental Protection Agency (U.S. EPA). 1991b. Risk Assessment Guidance forSuperfund: Volume I - Human Health Evaluation Manual (Part C, Risk Evaluation of RemedialAlternatives), Interim. Washington, DC: Office of Emergency and Remedial Response; 9285.7-01C.
*U.S. Environmental Protection Agency (U.S. EPA). 1991c. Ecological Assessment of SuperfundSites: An Overview. ECO Update, Intermittent Bulletin, Volume 1, Number 2. Washington,DC: Office of Emergency and Remedial Response, Hazardous Site Evaluation Division; Publ.9345.0-05I.
*U.S. Environmental Protection Agency (U.S. EPA). 1991d. The Role of BTAGs in EcologicalAssessment. ECO Update, Intermittent Bulletin, Volume 1, Number 1. Washington, DC: Officeof Emergency and Remedial Response, Hazardous Site Evaluation Division; Publ. 9345.0-05I.
U.S. Environmental Protection Agency (U.S. EPA). 1991. Guidance on Oversight of PotentiallyResponsible Party Remedial Investigations and Feasibility Studies, Volume 1. Office of SolidWaste and Emergency Response, Washington, DC. OSWER Directive 9835.1(c). EPA/540/G-91/010a.
U.S. Environmental Protection Agency (U.S. EPA). 1991. Guidance on Oversight of PotentiallyResponsible Party Remedial Investigations and Feasibility Studies, Volume 2, Appendices.Office of Solid Waste and Emergency Response, Washington, DC. OSWER Directive 9835.1(c).EPA/540/G-91/010b.
U.S. Environmental Protection Agency (U.S. EPA). 1991. Methods for Measuring the AcuteToxicity of Effluents and Receiving Waters to Freshwater and Marine Organisms; FourthEdition; Washington, DC: Office of Research and Development; EPA/600/4-90/027.
U.S. Environmental Protection Agency (U.S. EPA). 1991. Technical Support Document for WaterQuality-based Toxics Control. Washington, DC: Office of Water; EPA/505/2-90/001.
U.S. Environmental Protection Agency (U.S. EPA). 1991. Short-term Methods for Estimating theChronic Toxicity of Effluents and Receiving Waters to Freshwater Organisms; Third Edition.Washington, DC: Office of Research and Development; EPA/600/4-91/002.
009001

Bibliography-17
U.S. Environmental Protection Agency (U.S. EPA). 1991. Short-term Methods for Estimating theChronic Toxicity of Effluents and Receiving Waters to Marine and Estuarine Organisms; SecondEdition. Washington, DC: Office of Research and Development; EPA/600/4-91/003.
U.S. Environmental Protection Agency (U.S. EPA). 1991. Methods for Aquatic ToxicityIdentification Evaluations: Phase I, Toxicity Characterization Procedures. Duluth, MN: Officeof Research and Development: Environmental Research Laboratory; EPA/600/6-91/003.
U.S. Environmental Protection Agency (U.S. EPA). 1991. Supplemental Methods and StatusReports for Short-term Saltwater Toxicity Tests. G. Morrison and G. Chapman. ERL contributionNo. 1199. Narragansett, RI: Environmental Research Laboratory.
U.S. Environmental Protection Agency (U.S. EPA). 1991. Assessment and Control ofBioconcentratable Contaminants in Surface Waters. June 1989 Draft prepared by EPA'sNational Effluent Toxicity Assessment Center, Environmental Research Laboratory - Duluth,MN. Washington, DC: Office of Water Regulations and Standards; and Cincinnati, OH: Officeof Health Effects Assessment.
U.S. Environmental Protection Agency (U.S. EPA). 1991. Role of the Baseline Risk Assessmentin Superfund Remedy Selection Decisions. Don R. Clay, Assistant Administrator, Office of SolidWaste and Emergency Response. Washington, DC: Office of Solid Waste and EmergencyResponse Directive 9355.0-30.
U.S. Environmental Protection Agency (U.S. EPA). 1991. Summary Report on Issues in EcologicalRisk Assessment. Washington, DC: Risk Assessment Forum; EPA/625/3-91/018.
U.S. Environmental Protection Agency (U.S. EPA). 1991. Ecological Exposure and Effects ofAirborne Toxic Chemicals: An Overview. Corvallis, OR: Office of Research and Development,Environmental Research Laboratory; EPA/600/3-91/001.
U.S. Environmental Protection Agency (U.S. EPA). 1991. Technical Support Document for WaterQuality-based Toxics Control. Washington, DC: Office of Water Regulations and Standards;EPA/440/4-85/032.
*U.S. Environmental Protection Agency (U.S. EPA). 1990a. Macroinvertebrate Field andLaboratory Methods for Evaluating the Biological Integrity of Surface Waters. Washington,DC: Office of Water; EPA/600/4-90/030.
*U.S. Environmental Protection Agency (U.S. EPA). 1990b. Hazard Ranking System; Final Rule.Federal Register. 55: 51532-51662 (December 14).
U.S. Environmental Protection Agency (U.S. EPA). 1990. Guidance for Data Useability in RiskAssessment. Washington, DC: Office of Solid Waste and Emergency Response; EPA/540/G-90/008.
009002

Bibliography-18
U.S. Environmental Protection Agency (U.S. EPA). 1990. EPA Oversight of Remedial Designs andRemedial Actions Performed by PRPs. Quick Reference Fact Sheet. Washington, DC: Officeof Emergency and Remedial Response, Hazardous Site Control Division; Publication 9355.5-01/FS.
U.S. Environmental Protection Agency (U.S. EPA). 1990. Guidance Manual for Evaluation ofLaboratories Performing Aquatic Toxicity Tests. Washington, DC: Office of Research andDevelopment; EPA/600/4-90/031.
U.S. Environmental Protection Agency (U.S. EPA). 1990. Biological Criteria, National ProgramGuidance for Surface Waters. Washington, DC: Office of Water Regulations and Standards;EPA/440/5-90/004.
U.S. Environmental Protection Agency (U.S. EPA). 1990. Managing Contaminated Sediments:EPA Decision-Making Processes. Washington, DC: Sediment Oversight Technical Committee;EPA/506/6-90/002.
U.S. Environmental Protection Agency (U.S. EPA). 1990. National guidance: wetlands andnonpoint source control programs. Memorandum from Martha G. Prothro, Director, Office ofWater Regulations and Standards; Washington, DC: Office of Water (June 18).
U.S. Environmental Protection Agency (U.S. EPA). 1990. Water Quality Standards for Wetlands--National Guidance. Washington, DC: Office of Water Regulations and Standards; EPA/440/S-90/011.
*U.S. Environmental Protection Agency (U.S. EPA). 1989a. Risk Assessment Guidance forSuperfund: Volume 1 - Human Health Evaluation Manual, Interim Final. Washington, DC:Office of Solid Waste, Office of Emergency and Remedial Response; EPA/540/1-89/002.
*U.S. Environmental Protection Agency (U.S. EPA). 1989b. Risk Assessment Guidance forSuperfund: Volume 2 - Environmental Evaluation Manual, Interim Final. Washington, DC:Office of Solid Waste and Emergency Response; EPA/540/1-89/001A.
*U.S. Environmental Protection Agency (U.S. EPA). 1989c. Rapid Bioassessment Protocols forUse in Streams and Rivers: Benthic Macroinvertebrates and Fish. Washington, DC: Office ofWater; EPA/444/4-89/001 (Prepared by Plafkin, J.L.; Barbour, M.T.; Porter, K.D.; Gross, S.K.;Hughes, R.M.).
U.S. Environmental Protection Agency (U.S. EPA). 1989. Exposure Factors Handbook.Washington, DC: Office of Research and Development, Office of Health and EnvironmentalAssessment. EPA/600/8-89/049.
U.S. Environmental Protection Agency (U.S. EPA). 1989. Briefing Report to the EPA ScienceAdvisory Board on the Equilibrium Partitioning Approach to Generating Sediment QualityCriteria. Washington, DC: Office of Water Regulations and Standards; EPA/440/5-89/002.
009003

Bibliography-19
U.S. Environmental Protection Agency (U.S. EPA). 1989. Survey of State Water Quality Standardsfor Wetlands. Washington, DC: Office of Wetlands Protection.
U.S. Environmental Protection Agency (U.S. EPA). 1989. Report to the Sediment CriteriaSubcommittee: Evaluation of the Apparent Effects Threshold (AET) Approach for AssessingSediment Quality. Washington, DC: Office of the Administrator, Science Advisory Board; SAB-EETFC-89-027.
U.S. Environmental Protection Agency (U.S. EPA). 1989. Sediment Classification MethodsCompendium; Final Draft. Washington, DC: Office of Water, Watershed Protection Division(June).
U.S. Environmental Protection Agency (U.S. EPA). 1989. Water Quality Criteria to ProtectWildlife Resources. Corvallis, OR: Office of Research and Development, EnvironmentalResearch Laboratory; EPA/600/3-89/067.
U.S. Environmental Protection Agency (U.S. EPA). 1989. Ecological Assessment of HazardousWaste Sites: A Field and Laboratory Reference. Corvallis, OR: Office of Research andDevelopment, Environmental Research Laboratory; EPA/600/3-89/013.
U.S. Environmental Protection Agency (U.S. EPA). 1989. Superfund Exposure AssessmentManual—Technical Appendix: Exposure Analysis of Ecological Receptors. Athens, GA: Officeof Research and Development, Environmental Research Laboratory (December).
U.S. Environmental Protection Agency (U.S. EPA). 1989. Protocols for Short-Term ToxicityScreening of Hazardous Waste Sites. Office of Research and Development, EnvironmentalResearch Laboratory; EPA/600/3-88/029.
U.S. Environmental Protection Agency (U.S. EPA). 1989. Scoping Study of the Effects of SoilContamination on Terrestrial Biota. Washington, DC: Office of Toxic Substances.
*U.S. Environmental Protection Agency (U.S. EPA). 1988a. Guidance for Conducting RemedialInvestigations and Feasibility Studies Under CERCLA. Washington, DC: Office of Emergencyand Remedial Response; OSWER Directive No. 9355.3-01.
U.S. Environmental Protection Agency (U.S. EPA). 1988. Estimating Toxicity of IndustrialChemicals to Aquatic Organisms Using Structure Activity Relationships. Office of ToxicSubstances, Washington, DC: EPA/560/6-88/001.
U.S. Environmental Protection Agency (U.S. EPA). 1988. CERCLA Compliance with Other LawsManual, Part 1. Washington, DC: Office of Emergency and Remedial Response; OSWERDirective 9234.1-01.
U.S. Environmental Protection Agency (U.S. EPA). 1988. Short-term Methods for Estimating theChronic Toxicity of Effluents in Receiving Waters to Marine and Estuarine Organisms.
009004

Bibliography-20
Cincinnati, OH: Office of Research and Development, Office of Environmental Monitoring andSupport Laboratory; EPA/600/4-87/0928.
U.S. Environmental Protection Agency (U.S. EPA). 1988. Estimating Toxicity of IndustrialChemicals to Aquatic Organisms Using Structure Activity Relationships. Washington, DC:Office of Toxic Substances; EPA/560/6-88/001.
U.S. Environmental Protection Agency (U.S. EPA). 1988. Short-term Methods for Estimating theChronic Toxicity of Effluents in Receiving Waters to Marine and Estuarine Organisms.Cincinnati, OH: Office of Research and Development, Environmental Monitoring and SupportLaboratory; EPA/600/4-87/0928.
U.S. Environmental Protection Agency (U.S. EPA). 1988. Methods for Aquatic ToxicityIdentification Evaluations: Phase II, Toxicity Identification Procedures. Duluth, MN:Environmental Research Laboratory; EPA/600/3-88/035.
U.S. Environmental Protection Agency (U.S. EPA). 1988. Methods for Aquatic ToxicityIdentification Evaluations: Phase III, Toxicity Confirmation Procedures. Duluth, MN: Officeof Research and Development, Environmental Research Laboratory; EPA/600/3-88/036.
U.S. Environmental Protection Agency (U.S. EPA). 1988. Superfund Exposure AssessmentManual. Washington, DC: Office of Solid Waste and Emergency Response Directive 9285.5-1;EPA/540/1-88/001.
*U.S. Environmental Protection Agency (U.S. EPA). 1987a. Data Quality Objectives for RemedialResponse Activities: Development Process. Washington, DC: Office of Solid Waste andEmergency Response, Office of Emergency and Remedial Response and Office of WastePrograms Enforcement, OSWER Directive 9355.0-7B; EPA/540/G-87/003.
U.S. Environmental Protection Agency (U.S. EPA). 1987. Data Quality Objectives for RemedialResponse Activities: Example Scenario: RI/FS Activities at a Site with Contaminated Soils andGround Water. Washington, DC: Office of Solid Waste and Emergency Response, Office ofEmergency and Remedial Response and Office of Waste Programs Enforcement, OSWERDirective 9355.0-7B; EPA/540/G-87/004.
U.S. Environmental Protection Agency (U.S. EPA). 1987. Permit Writer's Guide to Water Quality-Based Permitting for Toxic Pollutants. Washington, DC: Office of Water Regulations andStandards; EPA/440/4-87/005.
U.S. Environmental Protection Agency (U.S. EPA). 1987. Guidelines for Deriving AmbientAquatic Life Advisory Concentrations. Washington, DC: Office of Water Regulations andStandards (unpublished).
009005

Bibliography-21
U.S. Environmental Protection Agency (U.S. EPA). 1987. A Compendium of Superfund FieldOperations Methods. Washington DC: Office of Solid Waste and Emergency Response, Officeof Environmental and Remedial Response; EPA/540/P-87/001.
U.S. Environmental Protection Agency (U.S. EPA). 1987. Role of Acute Toxicity Bioassays in theRemedial Action Process at Hazardous Waste Sites. Corvallis, OR: Office of Research andDevelopment, Environmental Research Laboratory; EPA/600/8-87/044.
U.S. Environmental Protection Agency (U.S. EPA). 1987. Ecological Risk Assessment in the Officeof Toxic Substances: Problems and Progress 1984-1987. Washington, DC: Office of ToxicSubstances, Health and Environmental Review Division (Author: Rodier, D.)
*U.S. Environmental Protection Agency (U.S. EPA). 1986a. Guidelines for the Health RiskAssessment of Chemical Mixtures. Washington, DC: Office of Health and EnvironmentalAssessment; EPA/600/8-87/045.
U.S. Environmental Protection Agency (U.S. EPA). 1986. Engineering Support Branch, StandardOperating Procedures and Quality Assurance Manual. Region IV, Environmental ServicesDivision.
U.S. Environmental Protection Agency (U.S. EPA). 1986. Guidelines for Deriving NumericalCriteria for the Protection of Aquatic Organisms and Their Uses. Washington, DC: Office ofWater Regulations and Standards.
U.S. Environmental Protection Agency (U.S. EPA). 1986. Quality Criteria for Water 1986.Washington, DC: Office of Water Regulations and Standards; EPA/440/5-86/001.
*U.S. Environmental Protection Agency (U.S. EPA). 1985a. Ambient Water Quality Criteria forCopper-1984. Washington, DC: Office of Water, Regulations and Standards, Criteria andStandards Division. EPA/440/5-84-031. PB85-227023.
U.S. Environmental Protection Agency (U.S. EPA). 1985. Development of Statistical Distributionsof Ranges of Standard Factors Used in Exposure Assessments. Washington, DC: Office ofHealth and Environmental Assessment, OHEA-E-161; EPA/600/8-85/010.
U.S. Environmental Protection Agency (U.S. EPA). 1985. Guide for Identifying CleanupAlternatives at Hazardous Waste Sites and Spills. Washington, DC: Office of Solid Waste andEmergency Response; EPA/600/3-83/063, NTIS PB86-144664.
U.S. Environmental Protection Agency (U.S. EPA). 1985. Methods for Measuring the AcuteToxicity of Effluents to Freshwater and Marine Organisms. Cincinnati, OH: Office of Researchand Development, Environmental Monitoring and Support Laboratory; EPA/600/4-85/013.
U.S. Environmental Protection Agency (U.S. EPA). 1985. Short-term Methods for Estimating theChronic Toxicity of Effluents in Receiving Waters to Freshwater Organisms. Cincinnati, OH:
009006

Bibliography-22
Office of Research and Development, Environmental Monitoring and Support Laboratory;EPA/600/4-85/014.
*U.S. Environmental Protection Agency (U.S. EPA). 1984a. Risk Assessment and Management:Framework for Decision Making. Washington, DC: Office of Policy, Planning, and Evaluation;EPA/600/9-85/002.
U.S. Environmental Protection Agency (U.S. EPA). 1984. Estimating "Concern Levels" forConcentrations of Chemical Substances in the Environment. Washington, DC: Office of ToxicSubstances, Environmental Effects Branch.
U.S. Environmental Protection Agency (U.S. EPA). 1984. Technical Support Manual: WaterbodySurveys and Assessments for Conducting Use Attainability Analyses: Volume II: EstuarineSystems. Washington, DC: Office of Water Regulations and Standards.
U.S. Environmental Protection Agency (U.S. EPA). 1984. Technical Support Manual: WaterbodySurveys and Assessments for Conducting Use Attainability Analyses: Volume III: Lake Systems.Washington, DC: Office of Water Regulations and Standards.
U.S. Environmental Protection Agency (U.S. EPA). 1983. Technical Support Manual: WaterbodySurveys and Assessments for Conducting Use Attainability Analyses. Washington, DC: Officeof Water Regulations and Standards (November).
U.S. Environmental Protection Agency (U.S. EPA). 1983. Environmental Effects of RegulatoryConcern Under TSCA: A Position Paper. Washington, DC: Office of Toxic Substances, Healthand Environmental Review Division (Author: Clements, R.G.)
U.S. Environmental Protection Agency (U.S. EPA) and Department of the Army, U.S. Army Corpsof Engineers (USACE). 1994. Evaluation of Dredged Material Proposed for Discharge inWaters of the U.S.—Testing Manual (Draft); Inland Testing Manual. Washington, DC: EPAOffice of Water. EPA/823/B-94/002.
Watras, C.J.; Huckabee, J.W. (eds.). 1995. Mercury Pollution: Integration and Synthesis. BocaRaton, FL: CRC Press, Inc., Lewis Publishers.
*Weil, C.S.; McCollister, D.D. 1963. Relationship between short- and long-term feeding studies indesigning an effective toxicity test. Agr. Food Chem. 11: 486-491.
Wentsel, R.S.; LaPoint, T.W.; Simini, M.; Checkai, R.T.; Ludwig, D.; Brewer, L. 1994. ProceduralGuidelines for Ecological Risk Assessments at U.S. Army Sites, Volume I. Aberdeen ProvingGround, MD: Edgewood Research, Development, and Engineering Center, U.S. Army Chemicaland Biological Defense Command. Rept. No. ERDEC-TR-221.
009007

Bibliography-23
*Wren, C.D. 1991. Cause-effect linkages between chemicals and populations of mink (Mustalavison) and otter (Lutra canadensis) in the Great Lakes basin. J. Toxicol. Environ. Health 33:549-585.
009008

Glossary-1
This glossary includes definitions from several sources. A superscript number next toa word identifies the reference from which the definition was adapted (listed at the end of theGlossary).
GLOSSARY
Abiotic. Characterized by absence of life; abiotic materials include non-living environmental media1
(e.g., water, soils, sediments); abiotic characteristics include such factors as light, temperature, pH,humidity, and other physical and chemical influences.
Absorption Efficiency. A measure of the proportion of a substance that a living organism absorbsacross exchange boundaries (e.g., gastrointestinal tract).
Absorbed Dose. The amount of a substance penetrating the exchange boundaries of an organism2
after contact. Absorbed dose for the inhalation and ingestion routes of exposure is calculated fromthe intake and the absorption efficiency. Absorbed dose for dermal contact depends on the surfacearea exposed and absorption efficiency.
Accuracy. The degree to which a measurement reflects the true value of a variable.4
Acute. Having a sudden onset or lasting a short time. An acute stimulus is severe enough to induce5
a response rapidly. The word acute can be used to define either the exposure or the response to anexposure (effect). The duration of an acute aquatic toxicity test is generally 4 days or less andmortality is the response usually measured.
Acute Response. The response of (effect on) an organisms which has a rapid onset. A commonlymeasured rapid-onset response in toxicity tests is mortality.
Acute Tests. A toxicity test of short duration, typically 4 days or less (i.e., of short duration relativeto the lifespan of the test organism).
Administered Dose. The mass of a substance given to an organism and in contact with an exchange2
boundary (i.e., gastrointestinal tract) per unit wet body weight (BW) per unit time (e.g.,mg/kgBW/day).
Adsorption. Surface retention of molecules, atoms, or ions by a solid or liquid, as opposed to14
absorption, which is penetration of substances into the bulk of a solid or liquid.
Area Use Factor. The ratio of an organism's home range, breeding range, or feeding/foraging rangeto the area of contamination of the site under investigation.
Assessment Endpoint. An explicit expression of the environmental value that is to be protected.6
009009

Glossary-2
Benthic Community. The community of organisms dwelling at the bottom of a pond, river, lake, or7
ocean.
Bioaccumulation. General term describing a process by which chemicals are taken up by an5
organism either directly from exposure to a contaminated medium or by consumption of foodcontaining the chemical. Bioccumulation Factor (BAF). The ratio of the concentration of a contaminant in an organism to3
the concentration in the ambient environment at steady state, where the organism can take in thecontaminant through ingestion with its food as well as through direct contact.
Bioassay. Test used to evaluate the relative potency of a chemical by comparing its effect on living5
organisms with the effect of a standard preparation on the same type of organism. Bioassay andtoxicity tests are not the same—see toxicity test. Bioassays often are run on a series of dilutions ofwhole effluents.
Bioassessment. A general term referring to environmental evaluations involving living organisms;can include bioassays, community analyses, etc.
Bioavailability. The degree to which a material in environmental media can be assimilated by an4
organism.
Bioconcentration. A process by which there is a net accumulation of a chemical directly from an5
exposure medium into an organism.
Biodegrade. Decompose into more elementary compounds by the action of living organisms,15
usually referring to microorganisms such as bacteria.
Biomagnification. Result of the process of bioaccumulation and biotransfer by which tissue5
concentrations of chemicals in organisms at one trophic level exceed tissue concentrations inorganisms at the next lower trophic level in a food chain.
Biomarker. Biochemical, physiological, and histological changes in organisms that can be used to21
estimate either exposure to chemicals or the effects of exposure to chemicals.
Biomonitoring. Use of living organisms as "sensors" in environmental quality surveillance to detect5
changes in environmental conditions that might threaten living organisms in the environment.
Body Burden. The concentration or total amount of a substance in a living organism; impliesaccumulation of a substance above background levels in exposed organisms.
Breeding Range. The area utilized by an organism during the reproductive phase of its life cycle andduring the time that young are reared.
009010

Glossary-3
Bulk Sediment. Field collected sediments used to conduct toxicity tests; can contain multiple8
contaminants and/or unknown concentrations of contaminants.
Characterization of Ecological Effects. A portion of the analysis phase of ecological risk6
assessment that evaluates the ability of a stressor to cause adverse effects under a particular set ofcircumstances.
Characterization of Exposure. A portion of the analysis phase of ecological risk assessment that6
evaluates the interaction of the stressor with one or more ecological components. Exposure can beexpressed as co-occurrence, or contact depending on the stressor and ecological component involved.
Chemicals of Potential Concern. Chemicals that are potentially site-related and whose data are of2
sufficient quality for use in a quantitative risk assessment.
Chronic. Involving a stimulus that is lingering or continues for a long time; often signifies periods5
from several weeks to years, depending on the reproductive life cycle of the species. Can be used todefine either the exposure or the response to an exposure (effect). Chronic exposures typically inducea biological response of relatively slow progress and long duration.
Chronic Response. The response of (or effect on) an organism to a chemical that is not immediatelyor directly lethal to the organism.
Chronic Tests. A toxicity test used to study the effects of continuous, long-term exposure of a9
chemical or other potentially toxic material on an organism.
Community. An assemblage of populations of different species within a specified location and time.6
Complexation. Formation of a group of compounds in which a part of the molecular bonding14
between compounds is of the coordinate type.
Concentration. The relative amount of a substance in an environmental medium, expressed byrelative mass (e.g., mg/kg), volume (ml/L), or number of units (e.g., parts per million).
Concentration-Response Curve. A curve describing the relationship between exposure5
concentration and percent of the test population responding.
Conceptual Model. Describes a series of working hypotheses of how the stressor might affect6
ecological components. Describes ecosystem or ecosystem components potentially at risk, and therelationships between measurement and assessment endpoints and exposure scenarios.
Contaminant of (Ecological) Concern. A substance detected at a hazardous waste site that has thepotential to affect ecological receptors adversely due to its concentration, distribution, and mode oftoxicity.
009011

Glossary-4
Control. A treatment in a toxicity test that duplicates all the conditions of the exposure treatments5
but contains no test material. The control is used to determine the response rate expected in the testorganisms in the absence of the test material.
Coordinate Bond. A chemical bond between two atoms in which a shared pair of electrons forms14
the bond and the pair of electrons has been supplied by one of the two atoms. Also known as acoordinate valence.
Correlation. An estimate of the degree to which two sets of variables vary together, with no10
distinction between dependent and independent variables.
Critical Exposure Pathway. An exposure pathway which either provides the highest exposure levelsor is the primary pathway of exposure to an identified receptor of concern.
Degradation. Conversion of an organic compound to one containing a smaller number of carbon14
atoms.
Deposition. The lying, placing, or throwing down of any material.14
Depuration. A process that results in elimination of toxic substances from an organism.5
Depuration Rate. The rate at which a substance is depurated from an organism.
Dietary Accumulation. The net accumulation of a substance by an organism as a result of ingestion9
in the diet.
Direct Effect (toxin). An effect where the stressor itself acts directly on the ecological component6
of interest, not through other components of the ecosystem.
Dose. A measure of exposure. Examples include (1) the amount of a chemical ingested, (2) the11
amount of a chemical absorbed, and (3) the product of ambient exposure concentration and theduration of exposure.
Dose-Response Curve. Similar to concentration-response curve except that the dose (i.e. the5
quantity) of the chemical administered to the organism is known. The curve is plotted as Dose versusResponse.
Duplicate. A sample taken from and representative of the same population as another sample. Both8
samples are carried through the steps of sampling, storage, and analysis in an identical manner.
Ecological Component. Any part of an ecosystem, including individuals, populations, communities,6
and the ecosystem itself.
Ecological Risk Assessment. The process that evaluates the likelihood that adverse ecological6
effects may occur or are occurring as a result of exposure to one or more stressors.
009012

Glossary-5
Ecosystem. The biotic community and abiotic environment within a specified location and time,6
including the chemical, physical, and biological relationships among the biotic and abioticcomponents.
Ecotoxicity. The study of toxic effects on nonhuman organisms, populations, or communities.11
Estimated or Expected Environmental Concentration. The concentration of a material estimated5
as being likely to occur in environmental media to which organisms are exposed.
Exposure. Co-occurrence of or contact between a stressor and an ecological component. The contact6
reaction between a chemical and a biological system, or organism.
Exposure Assessment. The determination or estimation (qualitative or quantitative) of the2
magnitude, frequency, duration, and route of exposure.
Exposure Pathway. The course a chemical or physical agent takes from a source to an exposed2
organism. Each exposure pathway incudes a source or release from a source, an exposure point, andan exposure route. If the exposure point differs from the source, transport/exposure media (i.e., air,water) also are included.
Exposure Pathway Model. A model in which potential pathways of exposure are identified for theselected receptor species.
Exposure Point. A location of potential contact between an organism and a chemical or physical2
agent.
Exposure Point Concentration. The concentration of a contaminant occurring at an exposure point.
Exposure Profile. The product of characterizing exposure in the analysis phase of ecological risk6
assessment. The exposure profile summarizes the magnitude and spatial and temporal patterns ofexposure for the scenarios described in the conceptual model.
Exposure Route. The way a chemical or physical agent comes in contact with an organism (i.e., by2
ingestion, inhalation, or dermal contact).
Exposure Scenario. A set of assumptions concerning how an exposure takes place, including6
assumptions about the exposure setting, stressor characteristics, and activities of an organism that canlead to exposure.
False Negative. The conclusion that an event (e.g., response to a chemical) is negative when it is infact positive (see Appendix D).
False Positive. The conclusion that an event is positive when it is in fact negative (see Appendix D).
009013

Glossary-6
Fate. Disposition of a material in various environmental compartments (e.g. soil or sediment, water,5
air, biota) as a result of transport, transformation, and degradation.
Food-Chain Transfer. A process by which substances in the tissues of lower-trophic-level organismsare transferred to the higher-trophic-level organisms that feed on them.
Forage (feeding) Area. The area utilized by an organism for hunting or gathering food.
Habitat. Place where a plant or animal lives, often characterized by a dominant plant form and1
physical characteristics.
Hazard. The likelihood that a substance will cause an injury or adverse effect under specifiedconditions.
Hazard Identification. The process of determining whether exposure to a stressor can cause an2
increase in the incidence of a particular adverse effect, and whether an adverse effect is likely to occur.
Hazard Index. The sum of more than one hazard quotient for multiple substances and/or multiple3
exposure pathways. The HI is calculated separately for chronic, subchronic, and shorter-durationexposures.
Hazard Quotient. The ratio of an exposure level to a substance to a toxicity value selected for the2
risk assessment for that substance (e.g., LOAEL or NOAEL).
Home Range. The area to which an animal confines its activities.12
Hydrophilic. Denoting the property of attracting or associating with water molecules; characteristic22
of polar or charged molecules.
Hydrophobic. With regard to a molecule or side group, tending to dissolve readily in organic12
solvents, but not in water, resisting wetting, not containing polar groups or sub-groups.
Hypothesis. A proposition set forth as an explanation for a specified phenomenon or group of12
phenomena.
Indirect Effect. An effect where the stressor acts on supporting components of the ecosystem, which6
in turn have an effect on the ecological component of interest.
Ingestion Rate. The rate at which an organism consumes food, water, or other materials (e.g., soil,sediment). Ingestion rate usually is expressed in terms of unit of mass or volume per unit of time (e.g.,kg/day, L/day).
Ionization. The process by which a neutral atom loses or gains electrons, thereby acquiring a net14
charge and becoming an ion.
009014

Glossary-7
Lethal. Causing death by direct action.5
Lipid. One of a variety of organic substances that are insoluble in polar solvents, such as water, but13
that dissolve readily in non-polar organic solvents. Includes fats, oils, waxes, steroids, phospholipids,and carotenes.
Lowest-Observable-Adverse-Effect Level (LOAEL). The lowest level of a stressor evaluated in atoxicity test or biological field survey that has a statistically significant adverse effect on the exposedorganisms compared with unexposed organisms in a control or reference site.
Matrix. The substance in which an analyte is embedded or contained; the properties of a matrix14
depend on its constituents and form.
Measurement Endpoint. A measurable ecological characteristic that is related to the valued6
characteristic chosen as the assessment endpoint. Measurement endpoints often are expressed as thestatistical or arithmetic summaries of the observations that make up the measurement. As used in thisguidance document, measurement endpoints can include measures of effect and measures of exposure,which is a departure from U.S. EPA's (1992a) definition which includes only measures of effect.
Media. Specific environmental compartments—air, water, soil—which are the subject of regulatory15
concern and activities.
Median Effective Concentration (EC ). The concentration of a substance to which test organisms505
are exposed that is estimated to be effective in producing some sublethal response in 50 percent of thetest population. The EC usually is expressed as a time-dependent value (e.g., 24-hour EC ). The50 50
sublethal response elicited from the test organisms as a result of exposure must be clearly defined.
Median Lethal Concentration (LC ). A statistically or graphically estimated concentration that is505
expected to be lethal to 50 percent of a group of organisms under specified conditions.
Metric. Relating to measurement; a type of measurement—for example a measurement of one of16
various components of community structure (e.g., species richness, % similarity).
Mortality. Death rate or proportion of deaths in a population.
No-Observed-Adverse-Effect Level (NOAEL). The highest level of a stressor evaluated in a5
toxicity test or biological field survey that causes no statistically significant difference in effectcompared with the controls or a reference site.
Nonparametric. Statistical methods that make no assumptions regarding the distribution of the data.17
Parameter. Constants applied to a model that are obtained by theoretical calculation or18
measurements taken at another time and/or place, and are assumed to be appropriate for the place andtime being studied.
009015

Glossary-8
Parametric. Statistical methods used when the distribution of the data is known.14
Population. An aggregate of individuals of a species within a specified location in space and time.6
Power. The power of a statistical test indicates the probability of rejecting the null hypothesis when10
it should be rejected (i.e., the null hypothesis is false). Can be considered the sensitivity of a statisticaltest. (See also Appendix D.)
Precipitation. In analytic chemistry, the process of producing a separable solid phase within a liquid14
medium.
Precision. A measure of the closeness of agreement among individual measurements.19
Reference Site. A relatively uncontaminated site used for comparison to contaminated sites in11
environmental monitoring studies, often incorrectly referred to as a control.
Regression Analysis. Analysis of the functional relationship between two variables; the independent10
variable is described on the X axis and the dependent variable is described on the Y axis (i.e. thechange in Y is a function of a change in X).
Replicate. Duplicate analysis of an individual sample. Replicate analyses are used for quality control.
Representative Samples. Serving as a typical or characteristic sample; should provide analytical18
results that correspond with actual environmental quality or the condition experienced by thecontaminant receptor.
Risk. The expected frequency or probability of undesirable effects resulting from exposure to known5
or expected stressors.
Risk Characterization. A phase of ecological risk assessment that integrates the results of the6
exposure and ecological effects analyses to evaluate the likelihood of adverse ecological effectsassociated with exposure to the stressor. The ecological significance of the adverse effects isdiscussed, including consideration of the types and magnitudes of the effects, their spatial andtemporal patterns, and the likelihood of recovery.
Sample. Fraction of a material tested or analyzed; a selection or collection from a larger collection.14
Scientific/Management Decision Point (SMDP). A point during the risk assessment process whenthe risk assessor communicates results of the assessment at that stage to a risk manager. At this pointthe risk manager determines whether the information is sufficient to arrive at a decision regarding riskmanagement strategies and/or the need for additional information to characterize risk.
Sediment. Particulate material lying below water.20
009016

Glossary-9
Sensitivity. In relation to toxic substances, organisms that are more sensitive exhibit adverse (toxic)effects at lower exposure levels than organisms that are less sensitive.
Sensitive Life Stage. The life stage (i.e., juvenile, adult, etc.) that exhibits the highest degree ofsensitivity (i.e., effects are evident at a lower exposure concentration) to a contaminant in toxicitytests.
Species. A group of organisms that actually or potentially interbreed and are reproductively isolated13
from all other such groups; a taxonomic grouping of morphologically similar individuals; the categorybelow genus.
Statistic. A computed or estimated statistical quantity such as the mean, the standard deviation, or10
the correlation coefficient.
Stressor. Any physical, chemical, or biological entity that can induce an adverse response.6
Sublethal. Below the concentration that directly causes death. Exposure to sublethal concentrations5
of a substance can produce less obvious effects on behavior, biochemical and/or physiologicalfunctions, and the structure of cells and tissues in organisms.
Threshold Concentration. A concentration above which some effect (or response) will be produced5
and below which it will not.
Toxic Mechanism of Action. The mechanism by which chemicals produce their toxic effects, i.e.,23
the mechanism by which a chemical alters normal cellular biochemistry and physiology. Mechanismscan include; interference with normal receptor-ligand interactions, interference with membranaefunctions, interference with cellular energy production, and binding to biomolecules.
Toxicity Assessment. Review of literature, results in toxicity tests, and data from field surveysregarding the toxicity of any given material to an appropriate receptor.
Toxicity Test. The means by which the toxicity of a chemical or other test material is determined.5
A toxicity test is used to measure the degree of response produced by exposure to a specific level ofstimulus (or concentration of chemical) compared with an unexposed control.
Toxicity Value. A numerical expression of a substance's exposure-response relationship that is used2
in risk assessments.
Toxicant. A poisonous substance.
Trophic Level. A functional classification of taxa within a community that is based on feeding6
relationships (e.g., aquatic and terrestrial plants make up the first trophic level, and herbivores makeup the second).
Type I Error. Rejection of a true null hypothesis (see also Appendix D).10
009017

Glossary-10
Type II Error. Acceptance of a false null hypothesis (see also Appendix D).10
Uptake. A process by which materials are transferred into or onto an organism.5
Uncertainty. Imperfect knowledge concerning the present or future state of the system under11
consideration; a component of risk resulting from imperfect knowledge of the degree of hazard or ofits spatial and temporal distribution.
Volatilization. The conversion of a chemical substance from a liquid or solid state to a gaseous14
vapor state.
Xenobiotic. A chemical or other stressor that does not occur naturally in the environment.6
Xenobiotics occur as a result of anthropogenic activities such as the application of pesticides and thedischarge of industrial chemicals to air, land, or water.ENDNOTES
Krebs 1978, U.S. EPA 1989, Calow 1993, Freedman 1989, Rand and Petrocelli 1985, U.S.1 2 3 4 5 6
EPA 1992a, Ricklefs 1990, U.S. EPA 1992b, ASTM 1993a, Sokal and Rohlf 1981, Suter7 8 9 10 11
1993, Wallace et al. 1981, Curtis 1983, Parker 1994, Sullivan 1993, U.S. EPA 1990, 12 13 14 15 16 17
Zar 1984, Keith 1988, Gilbert 1987, ASTM 1993b, Huggett et al. 1992, Stedman 1995,18 19 20 21 22
Amdur et al. 1991.23
GLOSSARY REFERENCES
Amdur, M.O.; Doull J.; Klaassen, C.D. 1991. Casarett and Doull's Toxicology. Fourth Edition.New York, NY: McGraw-Hill.
American Society for Testing and Materials (ASTM). 1993a. ASTM Standard E 943. Standardterminology relating to biological effects and environmental fate.
American Society for Testing and Materials (ASTM). 1993b. ASTM Standard E 1525. Standardguide for designing biological tests with sediments.
Calow, P. (ed.). 1993. Handbook of Ecotoxicology. Volume 1. Boston, MA: Blackwell Publishing.
Curtis, H. 1983. Biology. Fourth Edition. New York, NY: Worth.
Freedman, B. 1989. Environmental Ecology. The Impacts of Pollution and Other Stresses onEcosystem Structure and Function. New York, NY: Academic Press.
Gilbert, R.O. 1987. Statistical Methods for Environmental Pollution Monitoring. New York, NY:Reinhold.
Keith, L.H. (ed.). 1988. Principles of Environmental Sampling. American Chemical Society.
009018

Glossary-11
Krebs, C.J. 1978. Ecology: The experimental analysis of distribution and abundance. Secondedition. New York, NY: Harper & Row.
Huggett, R.J.; Kimerle, R.A.; Nehrle, P.M. Jr.; Bergman, H.L. (eds.). 1992. Biomarkers:Biochemical, Physiological, and Histological Markers of Anthropogenic Stress. A SpecialPublication of SETAC. Chelsea, MI: Lewis Publishers.
Parker, S.P. (ed.). 1994. Dictionary of Scientific and Technical Terms. Fifth Edition. New York,NY: McGraw-Hill.
Rand, G.M.; Petrocelli, S.R. 1985. Fundamentals of Aquatic Toxicology. Methods and Applications.New York, NY: McGraw Hill.
Ricklefs, R.E. 1990. Ecology. Second Edition. New York, NY: W.H. Freeman.
Sokal, R.R.; Rohlf, F.J. 1981. Biometry. Second Edition. New York, NY: W.H. Freeman.
Stedman, T.L. 1995. Stedman's Medical Dictionary. 26th Edition. Baltimore, MD: Williams andWilkins.
Sullivan, T.F.P. 1993. Environmental Regulatory Glossary. Government Institutes, Inc.
Suter, G.W. II. 1993. Ecological Risk Assessment. Ann Arbor, MI: Lewis.
U. S. Environmental Protection Agency (U.S. EPA). 1989. Risk Assessment Guidance for Superfund:Volume 1 - Human Health. Washington, DC: Office of Emergency and Remedial Response;EPA/540/1-89/002.
U. S. Environmental Protection Agency (U.S. EPA). 1990. Macroinvertebrate Field and LaboratoryMethods for Evaluating the Biological Integrity of Surface Waters. Washington, DC: Office ofWater; EPA/600/4-90/030.
U. S. Environmental Protection Agency (U.S. EPA). 1992a. Framework for Ecological RiskAssessment. Washington, DC: Risk Assessment Forum; EPA/630/R-02/011.
U.S. Environmental Protection Agency (U.S. EPA). 1992b. Sediment Classification MethodsCompendium. Washington, DC: Office of Water; EPA/823/R-092/006.
Wallace, R.A.; King, J.L.; Sanders, G.P. 1981. Biology. The Science of Life. Second Edition. IL:Scott, Foresman & Co.
Zar, J.H. 1984. Biostatistical Analysis. Princeton, NJ: Prentice-Hall.
009019

APPENDIX A
EXAMPLE ECOLOGICAL RISK ASSESSMENTSFOR HYPOTHETICAL SITES
009020

A-1
INTRODUCTION
Appendix A provides examples of Steps I through 5 of the ecological risk assessment process forthree hypothetical sites:
(1) A former municipal landfill from which copper is leaching into a large pond down-gradient of the site (the copper site);
(2) A former chemical production facility that spilled DDT, which has been transportedinto a nearby stream by surface water runoff (the DDT site); and
(3) A former waste-oil recycling facility that disposed of PCBs in a lagoon from whichextensive soil contamination has resulted (the PCB site).
These examples are intended to illustrate key points in Steps 1 through 5 of the ecological riskassessment process. No actual site is the basis for the examples.
The examples stop with Step 5 because the remaining steps (6 through 8) of the ecological riskassessment process and the risk management decisions depend on site-specific data collected duringa site investigation. We have not attempted to develop hypothetical data for analysis or the full rangeof information that a site risk manager would consider when evaluating remedial options.
009021

A-2
EXAMPLE 1: COPPER SITE
STEP 1: SCREENING-LEVEL PROBLEM FORMULATION AND ECOLOGICALEFFECTS EVALUATION
Site history. This is a former municipal landfill located in an upland area of the mid-Atlanticplain. Residential, commercial, and industrial refuse was disposed of at this site in the 1960s and1970s. Large amounts of copper wire also were disposed at this site over several years. Currently,minimal cover has been placed over the fill and planted with grasses. Terrestrial ecosystems in thevicinity of the landfill include upland forest and successional fields. Nearby land uses includeagriculture and residential and commercial uses. The landfill cover has deteriorated in severallocations. Leachate seeps have been noted on the slope of the landfill, and several seeps dischargeto a five-acre pond down-gradient of the site.
Site visit. A preliminary site visit was conducted and the ecological checklist was completed.The checklist indicated that the pond has an organic substrate; emergent vegetation, including cattailand rushes, occurs along the shore near the leachate seeps; and -the pond reaches a depth of five feettoward the middle. Fathead minnows, carp, and several species of sunfish were observed, and thebenthic macroinvertebrate community appeared to be diverse. The pond water was clear, indicatingan absence of phytoplankton. The pond appears to function as a valuable habitat for fish and otherwildlife using this area. Preliminary sampling indicated elevated copper levels in the seep as well aselevated base cations, total organic carbon (TOC), and depressed pH levels (pH 5.7).
Problem formulation. Copper is leaching from the landfill into the pond from a seep area.EPA's ambient water quality criteria document for copper (U.S. EPA, 1985) indicates that it cancause toxic effects in aquatic plants, aquatic invertebrates, and young fish at relatively low waterconcentrations. Thus, the seep might threaten the ability of the pond to support macroinvertebrateand fish communities and the wildlife that feed on them. Terrestrial ecosystems do not need to beevaluated because the overland flow of the seeps is limited to short gullies, a few inches wide. Thus,the area of concern has been identified as the five-acre pond and the associated leachate seeps.Copper in surface water and sediments of the pond might be of ecological concern.
Ecological effects evaluation. Copper is toxic to both aquatic plants and aquatic animals.Therefore, aquatic toxicity-based data will be used to screen for ecological risk in the preliminary riskcalculation. The screening ecotoxicity value selected for water-column exposure is the U.S. EPAchronic ambient water quality criterion (12 pg/L at a water hardness of 100 mg/L as CaCO ). A3
screening ecotoxicity value for copper in sediments was identified as 34 mg/kg (U.S. EPA, 1996).
009022

A-3
STEP 2: SCREENING-LEVEL EXPOSURE ESTIMATE AND RISK CALCULATION
Exposure estimate. Preliminary sampling data indicate that the leachate contains 53 pg/Lcopper as well as elevated base cations, elevated TOC, and depressed pH (pH 5.7). Sedimentconcentrations range from 300 mg/kg to below detection (2 mg/kg), decreasing with distance fromthe leachate seeps.
Risk calculation. The copper concentration in the seep water (53 ug/L) exceeds the chronicwater quality criterion for copper (12 ug/L). The maximum sediment copper concentration of 300mg/kg exceeds the screening ecotoxicity value for copper in sediments (34 mg/kg). Therefore, thescreening-level hazard quotients for both sediment and water exceed one. The decision at theScientific/Management Decision Point (SMDP) is to continue the ecological risk assessment
Similar screening for the levels of base cations generated hazard quotients below one in the seepwater. Although TOC and pH are not regulated under CERCLA, the possibility that thoseparameters might affect the biota of the pond should be kept in mind if surveys of the pond biota areconducted. Sediment concentrations of chemicals other than copper generated hazard quotients(HQs) of less than one at the maximum concentrations found.
STEP 3: BASELINE RISK ASSESSMENT PROBLEM FORMULATION
Based on the screening-level risk assessment, copper is known to be the only contaminant ofecological concern at the site.
Ecotoxicity literature review. A review of the literature on the ecotoxicity of copper toaquatic biota was conducted and revealed several types of information. Young aquatic organisms aremore sensitive to copper than adults (Demayo et al., 1982; Kaplan and Yoh, 1961; Hubschman,1965). Fish larvae usually are more sensitive than embryos (McKim et al., 1978; Weis and Weis,1991), and fish become less sensitive to copper as body weight increases (Demayo et al., 1982).Although the exact mechanism of toxicity to fish is unknown, a loss of osmotic control has beennoted in some studies (Demayo et al. 1982; Cheng and Sullivan, 1977).
Flowthrough toxicity studies in which copper concentrations were measured revealed LC values50
ranging from 75 to 790 ug/L for fathead minnows and 63 to 800 pg/L for common carp (U.S. EPA,1985). Coldwater fish species, such as rainbow trout, can be more sensitive, and species likepumpkinseeds (a sunfish) and bluegills are less sensitive (U.S. EPA, 1985). Although fish fry usuallyare the most sensitive life stage, this is not always the case; Pickering et al. (1977) determined an LC50
of 460 ug/L to 6-month-old juveniles and an LC of 490 ug/L to 6-week-old fry for fathead50
minnows. A copper concentration in water of 37 ug/L has been shown to cause a significantreduction in fish egg production (Pickering et al., 1977).
009023

A-4
Elevated levels of copper in sediments have been associated with changes in benthic communitystructure, notably reduced numbers of species (Winner et al., 1975; Kraft and Sypniewski, 1981).Studies also have been conducted with adult Hyalelia azteca (an amphipod) exposed to copper insediments. One of these studies indicated an LC50 of 1,078 mg/kg in the sediment (Cairns et al.,1984); however, a no-observed-adverse-effect level (NOAEL) for copper in sediments was notidentified for an early life stage of a benthic invertebrate.
A literature review of the ecotoxicity of copper to aquatic plants, both algae and vascular plants,did not reveal information on the toxic mechanism by which copper affects plants. The review didindicate that exposure of plants to high copper levels inhibits photosynthesis and growth (U.S. EPA,1985), and cell separation after cell division (Hatch, 1978). Several studies conducted usingSelenastrum capricornutum indicated that concentrations at 300 ug/L kill algae after 7 days, and avalue of 90 pg/l causes complete growth inhibition after 7 days (Bartlett et al., 1974).
The literature indicates that copper does not biomagnify in food chains and does notbioaccumulate in most animals because it is a biologically regulated essential element. Accumulationin phytoplankton and filter-feeding mollusks, however, does occur. The toxicity of copper in wateris influenced by water hardness, alkalinity, and pH (U.S. EPA,1985).
Exposure pathways. A flow diagram was developed to depict the environmental pathwaysthat could result in impacts of copper to the pond's biota (see Exhibit A-1). Direct exposure tocopper in the pond water and sediments could cause acute or chronic toxicity in early life stages offish and/or benthic invertebrates, and in aquatic plants. Risks to filterfeeding mollusks andphytoplankton as well as animals that feed on them are not considered because the mollusks andphytoplankton are unlikely to occur in significant quantities in the pond. The exposure pathways thatwill be evaluated, therefore, are direct contact with contaminated sediments and water.
Assessment endpoints and conceptual model. Based on the screening-level riskassessment, the ecotoxicity literature review, and the complete exposure pathways, development ofa conceptual model for the site is initiated. Copper can be acutely or chronically toxic to organismsin an aquatic community through direct exposure of the organisms to copper in the water andsediments. Threats of copper to higher trophic level organisms are unlikely to exceed threats toorganisms at the base of the food chain, because copper is an essential nutrient which is effectivelyregulated by most organisms if the exposure is below toxic levels. Fish fry in particular can be verysensitive to copper in water.
Based on these receptors and the potential for both acute and chronic toxicity, an appropriategeneral assessment endpoint for the ecosystem would be the maintenance of the communitycomposition of the pond. A more operational definition of the assessment endpoint would be themaintenance of pond community structure typical for the locality and for the physical attributes of thepond, with no loss of species or community alteration due to copper toxicity.
009024

A-5
Risk questions. One question is whether the concentrations of copper present in the sedimentsand water over at least part of the pond are toxic to aquatic plants or animals. A further question iswhat concentration of copper in sediments represents a threshold for adverse effects. That level couldbe used as a preliminary cleanup goal.
STEP 4: MEASUREMENT ENDPOINTS AND STUDY DESIGN
To answer the hypothesis identified in Step 3, lines of evidence were considered when selectingmeasurement endpoints: (1) whether the ambient copper levels are higher than levels known to bedirectly toxic to aquatic organisms likely or known to be present in the pond; (2) whether water andsediments taken from the pond are more toxic to aquatic organisms than water and sediments froma reference pond; and (3) whether the aquatic community structure in the site pond is simplifiedrelative to a reference pond.
Measurement endpoints. Since the identified assessment endpoint is maintaining a typicalpond community structure, the possibility of directly measuring the condition of the plant, fish, andmacroinvertebrate communities in the pond was considered. Consultation with experts on benthicmacroinvertebrates suggested that standard measures of the pond benthic invertebrate communityprobably would be insensitive measures of existing effects at this particular site because of the highspatial variation in benthic communities within and among ponds of this size. Measuring the fishcommunity also would be unsuitable, due to the limited size of the pond and low diversity of fishspecies anticipated. Since copper is not expected to bioaccumulate or biomagnify in this pond, directtoxicity testing was selected as appropriate. Because early life stages tend to be more sensitive to thetoxic effects of copper than older life stages, chronic toxicity would be measured on early life stages.For animals, toxicity is defined as a statistically significant decrease in survival or juvenile growthrates (measurement endpoints) of a test group exposed to water or sediments from the site comparedwith a test group exposed to water or sediments from a reference site. For plants, toxicity is definedas a statistically significant decrease in growth rate (measurement endpoint) with the samecomparison.
One toxicity test selected is a 10-day (i.e., chronic) solid-phase sediment toxicity test using anearly life stage of Hyalella azteca. The measures of effects for the test are mortality rates and growthrates (measured as length and weight increases). Two water-column toxicity tests will be used: (1)a 7-day test using the alga Selenastrum capricornutum (growth test) and (2) a 7-day larval fish testusing Pimephales promelas (mortality and growth endpoints). The H. azteca and P. promelastoxicity tests will be used to determine the effects of copper on early life stages of invertebrates andfish in sediment and the water column, respectively. The test on S. capricornutum will be used todetermine the phytotoxicity of copper in the water column.
009025

A-6
EXHIBIT A-1Conceptual Model for the Copper Site
009026

A-7
Study design. To answer the questions stated in the problem formulation step, the studydesign specified in the following. The water column tests will be run on 100 percent seep water, 100percent pond water near the seep, 100 percent reference-site water, and the laboratory control. U.S.EPA test protocols will be followed. Five sediment samples will be collected from the pond bottomat intervals along the observed concentration gradient, from a copper concentration of 300 mg/kg atthe leachate seeps down to approximately 5 mg/kg near the other end of the pond. The sedimentsampling locations will transect the pond at equidistant locations and include the point of maximumpond depth. All sediment samples will be split so that copper concentrations can be measured insediments from each sampling location. A reference sediment will be collected and a laboratorycontrol will be run. Test organisms will not be fed during the test; sediments will be sieved to removenative organisms and debris. Laboratory procedures will follow established protocols and will bedocumented and reviewed prior to initiation of the test. For the water-column test, statisticalcomparisons will be made between responses to each of the two pond samples and the reference site,as well as the laboratory control. Statistical comparisons also will be made of responses to sedimentstaken from each sampling location and responses to the reference sediment sample.
Because leachate seeps can be intermittent (depending on rainfall), the study design specifies thata pre-sampling visit is required to confirm that the seep is flowing and can be sampled. The studydesign also specifies that both sediments and water will be sampled at the same time at each samplinglocation.
As the work plan (WP) and sampling and analysis plan (SAP) were finished, the ecological riskassessor and the risk manager agreed on the site conceptual model, assessment endpoints, and studydesign (SMDP).
STEP 5: FIELD VERIFICATION OF STUDY DESIGN
A site assessment was conducted two days prior to the scheduled initiation of the siteinvestigation to confirm that the seep was active. It was determined that the seep was active and thatthe site investigation could be initiated.
009027

A-8
REFERENCES
Bartlett, L.; Rabe, F.W.; Funk, W.H. 1974. Effects of copper, zinc, and cadmium onSelenastrum capricornutum. Water Res. 8: 179-185.
Cairns, M.A.; Nebeker, A.V.; Gakstatter, J.H.; Griffis, W.L. 1984. Toxicity of copper-spikedsediments to freshwater invertebrates. Environ. Toxicol. Chem. 3: 345-445.
Cheng, T.C.; Sullivan, J.T. 1977. Alterations in the osmoregulation of the pulmonategastropod Biomphalaria glabrata due to copper. J. Invert. Path. 28: 101.
Demayo, A., et al. 1982. Effects of copper on humans, laboratory and farm animals, terrestrialplants, and aquatic life. CRC Crit. Rev. Environ. Control. 12: 183.
Hatch, R.C. 1978. Poisons causing respiratory insufficiency. In: L.M. Jones, N.H. Booth andL.E. McDonald (eds.), Veterinary Pharmacology and Therapeutics. Iowa State University,IA: Ames Press.
Hubschman, J.H. 1965. Effects of copper on the crayfish Orconectes rusticus (Girard). I. Acutetoxicity. Crustaceana 12: 33-42.
Kaplan, H.M.; Yoh, L. 1961. Toxicity of copper to frogs. Herpetologia 17: 1 131-135
Kraft, K.J.; Sypniewski, R.H. 1981. Effect of sediment copper on the distribution of benthic macroinvertebrates in the Keweenaw Waterway. J. Great Lakes Res. 7: 258-263.
McKim, J.M.; Eaton, J.G.; Holcombe, G.W. 1978. Metal toxicity to embryos and larvae of eightspecies of freshwater fish. II. Copper. Bull. Environ. Contam. Toxicol. 19: 608-616.
Pickering, Q.; Brungs, W.; Gast, M. 1977. Effect of exposure time and copper concentration offathead minnows, Pimephales promelas (Rafinesque). Aquatic Toxicol. 12: 107.
U.S. Environmental Protection Agency (U.S. EPA). 1996. Ecotox Thresholds. ECO Update,Intermittent Bulletin, Volume 3, Number 2. Washington, DC: Office of Emergency andRemedial Response, Hazardous Site Evaluation Division; Publication 9345.012FSI;EPA/540/F-95/038; NTIS PB95-963324.
U.S. Environmental Protection Agency (U.S. EPA). 1985. Ambient Water Quality Criteria for Copper. Washington, DC: Office of Water; EPA/440/5-84/031.
Weis, P.; Weis, J.S. 1991. The developmental toxicity of metals and metalloids in fish. In: Newman,
009028

A-9
M.C.; McIntosh, A.W. (eds.), Metal Ecotoxicology: Concepts and Applications. Boca Raton,FL: CRC Press, Inc., Lewis Publishers.
Winner, R.W.; Kelling, T.; Yeager, R.; et al. 1975. Response of a macroinvertebrate fauna to acopper gradient in an experimentally-polluted stream. Verh. Int. Ver. Limnol. 19: 2121-2127.
009029

A-10
EXAMPLE 2: DDT SITE
STEP 1: SCREENING-LEVEL PROBLEM FORMULATION AND ECOLOGICALEFFECTS EVALUATION
Site history. This is the site of a former chemical production facility located adjacent to astream. The facility manufactured and packaged dichlorodiphenyltrichloroethane (DDT). Due topoor storage practices, several DDT spills have occurred.
Site visit A preliminary site visit was conducted and the ecological checklist was completed.Information gathered indicates that surface water drainage from the site flows through severaldrainage swales toward an unnamed creek. This creek is a second-order stream containing riffle-runareas and small pools. The stream substrate is composed of sand and gravel in the pools with somedepositional areas in the backwaters and primarily cobble in the riffles.
Problem formulation. Previous sampling efforts indicated the presence of DDT and itsmetabolites in the stream's sediments over several miles at concentrations up to230 mg/kg. A varietyof wildlife, especially piscivorous birds, use this area for feeding. Many species of minnow have beennoted in this strewn. DDT is well known for its tendency to bioaccumulate and biomagnify in foodchains, and available evidence indicates that it can cause reproductive failure in birds due to eggshellthinning.
The risk assessment team and risk manager agreed that the assessment endpoint is adverse effectson reproduction of high-trophic-level wildlife, particularly piscivorous birds.
Ecological effects evaluation. Because DDT is well studied, a dietaryconcentration above which eggshell thinning might occur was identified in existing U.S. EPAdocuments on the ecotoxicity of DDT. Moreover, a no-observed-adverse-effect-level (NOAEL) forthe ingestion route for birds also was identified.
STEP 2: SCREENING-LEVEL EXPOSURE ESTIMATE AND RISK CALCULATION
Exposure estimate. For the screening-level exposure estimate, maximum concentrations ofDDT identified in the sediments were used. To estimate the concentration of DDT in forage fish, themaximum concentration in sediments was multiplied by the highest DDT bioaccumulation factorrelating forage fish tissue concentrations to sediment concentrations reported in the literature.Moreover, it was assumed that the piscivorous birds obtain 100 percent of their diet from thecontaminated area.
Risk calculation. The predicted concentrations of DDT in forage fish were compared with thedietary NOAEL for DDT in birds. This risk screen indicated that DDT concentrations measured atthis site might be high enough to cause adverse reproductive effects in birds. Thus, transfer of DDTfrom the sediments to the stream and biota are of concern at this site.
009030

A-11
STEP 3: BASELINE RISK ASSESSMENT PROBLEM FORMULATION
Based on the screening-level risk assessment, potential bioaccumulation of DDT in aquatic foodchains and effects of DDT on reproduction in piscivorous birds are known concerns. Duringrefinement of the problem, the potential for additional ecological effects of DDT was examined.
Ecotoxicity literature review. In freshwater systems, DDT can have direct effects onanimals, particularly aquatic insects. A literature review of the aquatic toxicity of DDT wasconducted, and a NOAEL and LOAEL identified for the toxicity of DDT to aquatic insects. Aquaticplants are not affected by DDT. Additional quantitative information on effects of DDT on birds wasreviewed, particularly to identify what level of eggshell thinning is likely to reduce reproductivesuccess. A number of studies have correlated DDT residues measured in eggs of birds to increasedeggshell thinning and egg loss due to breakage. Eggshell thinning of more than 20 percent appearsto result in decreased hatching success due to eggshell breakage (Anderson and Hickey, 1972;Dilworth et al., 1972). Information was not available for any piscivorous species of bird. Lincer(1975) conducted a I laboratory feeding study using American kestrels. Females fed a diet of 6mg/kg DDE (1.1 mg/kgBW-day) produced eggs with shells which were 25.5 percent thinner thanarchived eggshells collected prior to widespread use of DDT. Based on this information, a LOAELof 1.1 mg/kgBW-day was selected to evaluate the effects of DDT on piscivorous birds.
Exposure pathways, assessment endpoints, and conceptual model. Based onknowledge of the fate and transport of DDT in aquatic systems and the ecotoxicity of DDT to aquaticorganisms and birds, a conceptual model was initiated. DDT buried in the sediments can be releasedto the water column during resuspension and redistribution of the sediments. Some diffusion of DDTto the water column from the sediment surface also will occur. The benthic community would be aninitial receptor for the DDT in sediments, which could result in reduced benthic species abundanceand DDT accumulation in species that remain. Fish that feed on benthic organisms might be exposedto DDT both in the water column and in their food. Piscivorous birds would be exposed to the DDTthat has accumulated in the fish, and could be exposed at levels sufficiently high to cause more than20 percent eggshell thinning. Based on this information, two assessment endpoints were identified:(1) maintaining stream community structure typical for the stream order and location, and (2)protecting piscivorous birds from eggshell thinning that could result in reduced reproductive success.
DDE is a degradation product of DDT; typically, field measures of DDT are reported as the sum of the concentrations ofDDT, DDE, and DDD (another deVWation product).
009031

A-12
009032

A-13
A flow diagram of the exposure pathways for DDT was added to the conceptual model (ExhibitA-2). The diagram identifies the primary, secondary, and tertiary sources of DDT at the site, as wellas the primary, secondary, and tertiary types of receptors that could be exposed.
Risk questions. Two questions were developed: (1) has the stream community beenaffected by the DDT, and (2) have food-chain accumulation and transfer of DDT occurred to theextent that 20 percent or more eggshell thinning would be expected in piscivorous birds that use thearea.
STEP 4: MEASUREMENT ENDPOINTS AND STUDY DESIGN
Measurement endpoints. For the assessment endpoint of protecting piscivorous birds fromeggshell thinning, the conceptual model indicated that DDT in sediments could reach piscivorousbirds through forage fish. Belted kingfishers are known to feed in the stream. They also have thesmallest home range of the piscivorous birds in the area, which means that more kingfishers canforage entirely from the contaminated stream area than can other species of piscivorous birds. Thus,one can conclude that, if the risk assessment shows no threat of eggshell g to the kingfisher, thereshould be minimal or no threat to other piscivorous birds that might utilize the site. Eggshell thinningin the belted kingfisher therefore was selected as the measure of effect.
Data from the literature suggest that DDT can have a bioaccumulation factor in surface watersystems as high as six orders of magnitude (10 ); however, in most aquatic ecosystems, the actual6
bioaccumulation of DDT from the environment is lower, often substantially lower. Many factorsinfluence the actual accumulation of DDT in the environment. There is considerable debate over theparameters of any proposed theoretical bioaccumulation model; therefore, it was decided to measuretissue residue levels in the forage fish at the site instead of estimating the tissue residue levels inforage fish using a bioaccumulation factor (BAF).
Existing information on the distribution of DDT in the stream indicates that a general gradient ofDDT concentrations exists in the sediments, and five locations could be identified that correspondedto a range of DDT concentrations in sediments. Based on information available on fish communitiesin streams similar to the one in the site area, creek chub (Semotilus afromaculatus) were selected tomeasure exposure levels for kingfishers. Creek chub feed on benthic invertebrates, which are in directcontact with the contaminated sediments. Adult creek chub average 10 inches and about 20 grams,allowing for analysis of individual fish. Creek chub also have small home ranges during the springand summer, and thus it should be possible to relate DDT levels in the chub to DDT levels in thesediments.
009033

A-14
For the assessment endpoint of maintaining stream community structure, the selectedmeasurement endpoints were several metrics describing the abundance and trophic structure of thestream benthic macroinvertebrate community.
Study design. The study design specified that creek chub would be collected at severallocations with known DDT concentrations in sediments. The fish would be analyzed for bodyburdens of DDT, and the relationship between DDT levels in the sediments and in the creek chubwould be established. The fish DDT concentrations would be used to evaluate the DDT threat topiscivorous birds feeding on the fish at each location. Using the DDT concentrations measured infish that correspond to a LOAEL and NOAEL for adverse effects in birds, the correspondingsediment contamination levels would be determined. Those sediment DDT levels then could be usedto derive a cleanup level that would reduce threats of eggshell thinning to piscivorous birds.
The study design for measuring DDT residue levels in creek chub specified that 10 creek chubof the same size and sex would be collected at each location and that each creek chub be at least 20grams, so that individuals could be analyzed. In addition, at one location, QA/QC requirementsdictated that an additional 10 fish be collected. In this example, it was necessary to verify in the fieldthat sufficient numbers of creek chub of the specified size were present to meet the tissue samplingrequirements. In addition, the stream conditions needed to be evaluated to determine what fishsampling techniques would work best at the targeted locations.
The study design and methods for benthic macroinvertebmte collection followed the RapidBioassessment Protocol (RBP) manual for level three evaluation (U.S. EPA, 1989). Benthicmacroinvertebmte samples were co-located with sampling for fish tissue residue levels so that oneset of co-located water and sediment samples for analytic chemistry could serve for comparison withboth tissue analyses.
The study design also specified that the hazard quotient (HQ) method would be used to evaluatethe effects of DDT on the kingfisher during risk characterization. To determine the HQ, theestimated daily dose of DDT consumed by the kingfishers is divided by a LOAF-L of 1. I mg/kgBW-day for kestrels. To estimate the DDT dose to the kingfisher, the DDT concentrations in the chubis multiplied by the fish ingestion rate for kingfishers and divided by the body weight of kingfishers.This dose is adjusted by the area use factor. The area use factor corresponds to the proportion of thediet of a kingfisher that would consist of fish from the contaminated area. The area use factor is afunction of the home range size of kingfishers relative to the area -of contamination. The adjusteddose is compared to the LOAEL. A HQ of greater than one implies that impaired reproductivesuccess in kingfishers due to site contamination is likely, and an HQ of less than one implies impactsdue to site contaminants are unlikely (see text Section 2.3 for a description of HQs).
009034

A-15
STEP 5: FIELD VERIFICATION OF STUDY DESIGN
A field assessment was conducted and several small fish collection techniques were used todetermine which technique was the most effective for capturing creek chub at the site. Collectedchub were examined to determine the size range available and to determine if individuals could besexed.
Seine netting the areas targeted indicated that the creek chub might not be present in sufficientnumbers to provide the necessary biomass for chemical analyses. Based on these findings, acontingency plan was agreed to (SMDP), which stated that both the creek chub and the longoseddace (Rhinichthys cataractae) would be collected. If the creek chub were collected at all locationsin sufficient numbers, those samples would be analyzed and the dace would be released. If sufficientcreek chub could not be collected but sufficient longosed dace could, the longosed dace would beanalyzed and the creek chub released. If neither species could be collected at all locations in sufficientnumbers, then a mix of the two species would be used; however, for any given site only one specieswould be analyzed. In addition, at one location, preferably one with high DDT levels in the sediment,sufficient numbers of approximately 20 gram individuals of both species would be collected to allowcomparison (and calibration) of the accumulation between the two species. If necessary to meet theanalytic chemistry needs, similarly-sized individuals of both sexes of creek chub would be pooled.Pooling two or more individuals would be necessary for the smaller dace. The risk assessment teamdecided that the fish samples would be collected by electro-shocking. Field notes for all sampleswould document the number of fish per sample pool, sex, weight, length, presence of parasites ordeformities, and other measures and might help to explain any anomalous data.
REFERENCES
Anderson, D.W.; Hickey, J.J. 1972. Eggshell changes in certain North American birds. In: Voos,K.H. (ed.), Proceedings: XV Intemational Omithological Congress. The Hague, Netherlands;pp. 514-540.
Dilworth, T.G., Keith, J.A.; Pearce, P.A.; Reynolds, L.M. 1972. DDE and eggshell thickness in NewBrunswick woodcock. J. Wildl. Manage. 36: 1186-1193.
Lincer, J.L. 1975. DDE-induced eggshell thinning in the American kestrel; a comparison of the fieldsituation and laboratory results. J. App. Ecol. 12: 781-793.
U.S. Environmental Protection Agency (U.S. EPA). 1989. Rapid Bioassessment Protocols for Usein Streams and Rivers: Benthic Macroinvertebrates and Fish. Washington, DC: Office of Water(Plafkin, J.L., Barbour, M.T., Porter, K.D., Gross, S.K., and Hughes, R.M., authors);EPA/440/4-89/001.
009035

A-16
EXAMPLE 3: PCB SITE
STEP 1: SCREENING-LEVEL PROBLEM FORMULATION AND ECOLOGICALEFFECTS EVALUATION
Site history. This is a former waste-oil recycling facility located in a remote area. Oilscontaminated with polychlorinated biphenyl compounds (PCBs) were disposed of in a lagoon. Thelagoon was not lined, and the soil is composed mostly of sand. Oils contaminated with PCBsmigrated through the soil and contaminated a wide area adjacent to the site.
Site visit During the preliminary site visit, the ecological checklist was completed. Most of thehabitat is upland forest, old field, and successional terrestrial areas. Biological surveys at this sitehave noted a variety of small mammal sips. In addition, red-tailed hawks were observed.
Problem formulation. At least 10 acres surrounding the site are known to be -contaminatedwith PCBS. Some PCBs are reproductive toxins in mammals (Ringer et al.,' 1972; Aulerich et al.,1985; Wren, 1991; Kamrin and Ringer, 1996). When ingested, they induce (i.e., increaseconcentrations and activity of) enzymes in the liver, which might affect the metabolism of somesteroid hormones (Rice and O'Keefe, 1995). Whatever the mechanism of action, several physiologicalfunctions that are controlled by steroid hormones can be altered by exposure of mammals to PCBS,and reproduction appears to be the most sensitive endpoint for PCB toxicity in mammals (Rice andO’Keefe, 1995). Given this information, the screening ecological risk assessment should includepotential exposure pathways for mammals to PCBS.
Several possible exposure pathways were evaluated for mammals. PCBs are not highly volatile,so inhalation of PCBs by animals would not be an important exposure pathway. PCBs in soilsgenerally are not taken up by most plants, but are accumulated by soil macroinvertebrates. Thus,herbivores, such as votes and rabbits, would not be exposed to PCBs in most of their diets; whereasinsectivores, such as shrews, or omnivores, such as deer n-Lice, could be exposed to accumulatedPCBs in their diets. PCBs also are known to biomagnify in terrestrial food chains; therefore, theingestion exposure route needs evaluation, and shrews and/or deer mice would be appropriatemammalian receptors to evaluate in this exposure pathway.
Potential reproductive effects on predators that feed on shrews or mice also would be importantto evaluate. The literature indicated that exposure to PCBs through the food chain could causereproductive 'unpai nt in predatory birds through a similar mechanism as in mammals. The prey ofred-tail hawks include votes, deer mice, and various insects. Thus, this raptor could be at risk ofadverse reproductive effects.
Ecological effects evaluation. No-observed-adverse-effect levels (NOAELS) for the effectsof PCBs and other contaminants at the site on mammals, birds, and other biota were identified in theliterature.
009036

A-17
009037

A-18
STEP 2: SCREENING-LEVEL EXPOSURE ESTIMATE AND RISK CALCULATION
Exposure estimate. For the screening-level risk calculation, the highest PCB and othercontaminant levels measured on site were used to estimate exposures.
Risk calculation. The potential contaminants of concern were screened based on NOAELsfor exposure routes appropriate to each contaminant. Based on this screen, PCBs were confirmedto be the only contaminants of concern to small mammals, and possibly to birds, based on the levelsmeasured at this site. Thus, at the SMDP, the risk manager and lead risk assessor decided to continueto Step 3 of the ecological risk assessment process.
STEP 3: BASELINE RISK ASSESSMENT PROBLEM FORMULATION
The screening-level ecological risk assessment confirmed that PCBs are of concern to smallmammals based on the levels measured at the site and suggested that predatory birds might be at riskfrom PCBs that accumulate in some of their mammalian prey.
Ecotoxicity literature review. A literature review was conducted to evaluate potentialreproductive effects in birds. PCBs have been implicated as a cause of reduced reproductive successof piscivorous birds (e.g., cormorants, terns) in the Great Lakes (Kubiak et al., 1989; Fox et al.,1991). Limited information was available on the effects of PCBs to red-tailed hawks. A study onAmerican kestrel indicated that consumption of 33 mg/kgBWday PCBs resulted in a significantdecrease in sperm concentration in male kestrels (Bird et al ., 1983). Implications of this decreasefor mating success in kestrels was not evaluated in the study, but studies on other bird species indicatethat it could increase the incidence of infertile eggs and therefore reduce the number of young fledgedper pair. The Great Lakes International Joint Commission (IJC) recommends 0.1 mg/kg total PCBsas a prey tissue level that will protect predatory birds and mammals (IJC, 1988). (This number is usedas an illustration and not to suggest that this particular level is appropriate for a given site.)
Exposure pathways. The complete exposure pathways identified during Steps I wereconsidered appropriate for the baseline ecological risk assessment as well.
Assessment endpoints and conceptual model. Based on the screening-level riskassessment for small mammals and the results of the ecotoxicity literature search for birds, aconceptual model was initiated for the site, which included consideration of predatory birds (e.g., red-tailed hawks) and their prey. The ecological risk assessor and the risk manager agreed (SMDP) thatassessment endpoints for the site would be the protection of small mammals and predatory birdsfrom reproductive impairment caused by PCBs that had accumulated in their prey.
An exposure pathway diagram was developed for the conceptual model to identify the exposurepathways by which predatory birds could be exposed to PCBs originating in the soil at the site (seeExhibit A-3). While votes may be prevalent at the site, they are not part of the exposure pathway for
009038

A-19
predators because they are herbivorous and PCBs do not accumulate in plants. Deer mice(Peromyscus maniculatus), on the other hand, also are abundant at the site and, being omnivorous,are likely to be exposed to PCBs that have accumulated in the insect component of their diet.Preliminary calculations indicated that environmental levels likely to cause reproductive effects inpredatory birds are lower than those likely to cause reproductive effects in mice because mice feedlower in the food chain than do raptors. The assessment endpoint was therefore restricted toreproductive impairment in predatory birds.
Risk questions. Based on the conceptual model, one question was whether predatory birdscould consume a high enough dose of PCBs in their diet to impair their reproduction. Given thepresence of red-tailed hawks on site, the question was refined to ask whether that species couldconsume sufficient quantities of PCBs in their diet to affect reproduction.
STEP 4: MEASUREMENT ENDPOINTS AND STUDY DESIGN
Measurement endpoints. To determine whether PCB levels in prey of the redtailed hawkexceed levels that might impair their reproduction, PCB levels would be measured in deer mice takenfrom the site (of all of the species in the diet of the red-tailed hawk, deer mice are assumed toaccumulate the highest levels of PCBS). Based on estimated prey ingestion rates for red-tailedhawks, a total PCB dose would be estimated from the measured PCB concentrations in the mice.
Study design. The available measures of PCB concentrations in soil at the site indicated agradient of decreasing PCB concentration with increasing distance from the unlined lagoon. Threelocations along this gradient were selected to measure PCB concentrations in deer mice. The studydesign specified that eight deer mice of the same size and sex would be collected at each location.Each mouse should be approximately 20 grams so that contaminant levels can be measured inindividual mice. With concentrations measured in eight individual mice, it is possible to estimate amean concentration and an upper confidence limit of the mean concentration in deer mice for thelocation. In addition, QA/QC requirements dictate that an additional eight deer mice should becollected at one location.
For this site, it was necessary to verify that sufficient numbers of deer mice of the specified sizewould be present to meet the sampling requirements. In addition, habitat conditions needed to beevaluated to determine what trapping techniques would work at the targeted locations.
009039

A-20
The study design specified further that the hazard quotient (HQ) method would be used toestimate the risk of reproductive impairment in the red-tailed hawk from exposure to PCBs in theirprey. To determine the HQ, the measured DDT concentrations in deer mice is divided by the LOAELof 33 mg/kgBW-day for a decrease in sperm concentration in kestrels. To estimate the dose to thered-tailed hawk, the PCB concentrations in deer mice is multiplied by the quantity of deer mice thatcould be ingested by a red-tailed hawk each day and divided by the body weight of the hawk. Thisdose is adjusted by a factor that corresponds to the proportion of the diet of a red-tailed hawk thatwould come from the contaminated area. This area use factor is a function of the home range sizeof the hawks relative to the area of contamination. A HQ of greater than one implies that impactsdue to site contamination are likely, and an HQ of less than one implies impacts due to sitecontaminants are unlikely.
STEP 5: FIELD VERIFICATION OF STUDY DESIGN
A field assessment using several trapping techniques was conducted to determine (1) whichtechnique was most effective for capturing deer mice at the site and (2) whether the technique wouldyield sufficient numbers of mice over 20 grams to meet the specified sampling design. On the firstevening of the field assessment, two survey lines of 10 live traps were set for deer mice in typical old-field habitat in the area believed to contain the desired DDT concentration gradient for the studydesign. At the beginning of the second day, the traps were retrieved. Two deer mice over 20 gramswere captured in each of the survey lines. These results indicated that collection of deer mice overa period of a week or less with this number and spacing of live traps should be adequate to meet thestudy objectives.
REFERENCES
Aulerich, R.J.; Bursian, S.J.; Breslin, W.J.; et al. 1985. Toxicological manifestations of 2,4,5-,2',4',5'-, 2,3,6,2',3',6'-, and 3,4,5,3',4',5'-hexachlorobiphenyl and Aroclor 1254 in mink. J. Toxicol.Environ. Health 15: 63-79.
Bird, D.M.; Tucker, P.H.; Fox, G.A.; Lague, P.C. 1983. Synergistic effects of Aroclor 1254 andmirex on the semen characteristics of American kestrels. Arch. Environ. Contam. Toxicol. 12:633-640.
Fox, G.A., Collins, B.; Hayaskawa, E.; et al. 1991. Reproductive outcomes in colonial fisheatingbirds: a biomarker for developmental toxicants in Great Lakes food chains. H. Spatial variationin the occurrence and prevalence of bill defects in young doublecrested cormorants in the GreatLakes. J. Great Lakes Res. 17:158-167.
International Joint Commission (IJC) of United States and Canada. 1988. Great Lakes Water QualityAgreement. Amended by protocol. Signed 18 November 1987. Ottawa, Canada.
009040

A-21
Kamrin, M.A.; Ringer, R.K. 1996. Toxicological implications of PCB residues in mammals. In:Beyer, W.N.; Heinz, G.H.; Redmon-Norwood, A.R. (eds.). Environmental Contaminants inWildlife: Interpreting Tissue Concentrations. A Special Publication of the Society ofEnvironmental Toxicology and Chemistry (SETAC), La Point, T.W. (series ed.). Boca Raton,FL: CRC Press, Inc., Lewis Publishers. pp 153-164.
Kubiak, TJ.; Harris, H.J.; Smith, L.M.; et al. 1989. Microcontaminats and reproductiveimpairment of the Forster's tem on Green Bay, Lake Michigan-1983. Arch. Environ. Contam. Toxicol. 18: 706-727.
Rice, C.P; O'Keefe, P. 1995. Sources, pathways, and effects of PCBs, dioxins, anddibenzofurans. In: Hoffman, D.J.; Rattner, B.A.; Burton, G.A. Jr.; Cairns, J., Jr. (eds.).Handbook of Ecotoxicology. Ann Arbor, MI: CRC Press, Inc., Lewis Publishers.
Ginger, R.K.; Aulerich, R.J.; Zabik, M. 1972. Effect of dietary polychlorinated biphenyls ongrowth and reproduction of mink. Extended abstract. ACS (American Chemical Society)164th Annu. Meet.
12: 149-154.
Wren, C.D. 1991. Cause-effect linkages between chemicals and populations of mink (Mustalavison) and otter (Lutra canadensis) in the Great Lakes basin. J. Toxicol. Environ. Health33: 549-585.
009041

APPENDIX B
REPRESENTATIVE SAMPLING GUIDANCE DOCUMENT,VOLUME 3: BIOLOGICAL
009042

OSWER Directive XXXX-XXEPA 540/R/94/XXX
PBXX-XXXXXMay 1997
DRAFT
Superfund ProgramRepresentative Sampling Guidance
Volume 3: Biological
Interim Final
Environmental Response Team CenterOffice of Emergency and Remedial Response
Office of Solid Waste and Emergency Response
U.S. Environmental Protection AgencyWashington, D.C. 20460
009043

Notice
The policies and procedures established in this document are intended solely for the guidance of government personnel,for use in the Superfund Program. They are not intended, and cannot be relied upon, to create any rights, substantive orprocedural, enforceable by any party in litigation with the United States. The Agency reserves the right to act at variancewith these policies and procedures and to change them at any time without public notice.
For more information on Biological Sampling procedures, refer to the Compendium of ERT Toxicity TestingProcedures, OSWER Directive 9360-4-08, EPA/540/P-91/009 (U.S. EPA 1991a). Topics covered in this compendiuminclude: toxicity testing; and surface water and sediment sampling.
Please note that the procedures in this document should only be used by individuals properly trained and certified undera 40 Hour Hazardous Waste Site Training Course that meets the requirements set forth in 29 CFR 1910.120(e)(3). It shouldnot be used to replace or supersede any information obtained in a 40 Hour Hazardous Waste Site Training Course.
Questions, comments, and recommendations are welcomed regarding the Superfund Program Representative SamplingGuidance, Volume 3 -- Biological. Send remarks to:
Mark Sprenger Ph.D. - Environmental ScientistDavid Charters Ph.D. - Environmental Scientist
U.S. EPA - Environmental Response Center (ERC)Building 18, MS-101
2890 Woodbridge AvenueEdison, NJ 08837-3679
For additional copies of the Superfund Program Representative Sampling Guidance, Volume 3 -- Biological, contact:
National Technical Information Services5285 Port Royal RoadSpringfield, VA 22161Phone (703) 487-4650
U.S. EPA employees can order a copy by calling the ERC at (908) 321-4212
009044

Disclaimer
This document has been reviewed in accordance with U.S. Environmental Protection Agency policy and approved forpublication. Mention of trade names or commercial products does not constitute endorsement or recommendation for use.
The following trade names are mentioned in this document:
Havahart® - Allcock Manufacturing Co., Lititz, PA
Longworth - Longworth Scientific Instrument Company, Ltd., England
Museum Special - Woodstream Corporation, Lititz, PA
Sherman - H.B. Sherman Traps, Tallahassee, FL
009045

This page intentionally left blank.
009046

CONTENTS
Notice . . . . . . . . . . . . . . . . . . . . . . . . . . . . . . . . . . . . . . . . . . . . . . . . . . . . . . . . . . . . . . . . . . . . . . . . . . . . . . . . . . . . . . . . . . ii
Disclaimer . . . . . . . . . . . . . . . . . . . . . . . . . . . . . . . . . . . . . . . . . . . . . . . . . . . . . . . . . . . . . . . . . . . . . . . . . . . . . . . . . . . . . iii
List of Figures . . . . . . . . . . . . . . . . . . . . . . . . . . . . . . . . . . . . . . . . . . . . . . . . . . . . . . . . . . . . . . . . . . . . . . . . . . . . . . . . . viii
List of Tables . . . . . . . . . . . . . . . . . . . . . . . . . . . . . . . . . . . . . . . . . . . . . . . . . . . . . . . . . . . . . . . . . . . . . . . . . . . . . . . . . . . vii
Preface . . . . . . . . . . . . . . . . . . . . . . . . . . . . . . . . . . . . . . . . . . . . . . . . . . . . . . . . . . . . . . . . . . . . . . . . . . . . . . . . . . . . . . . . ix
1.0 INTRODUCTION . . . . . . . . . . . . . . . . . . . . . . . . . . . . . . . . . . . . . . . . . . . . . . . . . . . . . . . . . . . . . . . . . . . . . . . . . . . . 1
1.1 Objective and Scope . . . . . . . . . . . . . . . . . . . . . . . . . . . . . . . . . . . . . . . . . . . . . . . . . . . . . . . . . . . . . . . . . . . . . . . 11.2 Risk Assessment Overview . . . . . . . . . . . . . . . . . . . . . . . . . . . . . . . . . . . . . . . . . . . . . . . . . . . . . . . . . . . . . . . . . 11.3 Conceptual Site Model . . . . . . . . . . . . . . . . . . . . . . . . . . . . . . . . . . . . . . . . . . . . . . . . . . . . . . . . . . . . . . . . . . . . . 21.4 Data Quality Objectives . . . . . . . . . . . . . . . . . . . . . . . . . . . . . . . . . . . . . . . . . . . . . . . . . . . . . . . . . . . . . . . . . . . . 31.5 Technical Assistance . . . . . . . . . . . . . . . . . . . . . . . . . . . . . . . . . . . . . . . . . . . . . . . . . . . . . . . . . . . . . . . . . . . . . . 4
2.0 BIOLOGICAL/ECOLOGICAL ASSESSMENT APPROACHES . . . . . . . . . . . . . . . . . . . . . . . . . . . . . . . . . . . . . . 6
2.1 Introduction . . . . . . . . . . . . . . . . . . . . . . . . . . . . . . . . . . . . . . . . . . . . . . . . . . . . . . . . . . . . . . . . . . . . . . . . . . . . . . 62.2 RISK EVALUATION . . . . . . . . . . . . . . . . . . . . . . . . . . . . . . . . . . . . . . . . . . . . . . . . . . . . . . . . . . . . . . . . . . . . . 6
2.2.1 Literature Screening Values . . . . . . . . . . . . . . . . . . . . . . . . . . . . . . . . . . . . . . . . . . . . . . . . . . . . . . . . . . . . 62.2.2Risk Calculations . . . . . . . . . . . . . . . . . . . . . . . . . . . . . . . . . . . . . . . . . . . . . . . . . . . . . . . . . . . . . . . . . . . . . 62.2.3Standard Field Studies . . . . . . . . . . . . . . . . . . . . . . . . . . . . . . . . . . . . . . . . . . . . . . . . . . . . . . . . . . . . . . . . . 6
2.2.3.1Reference Area Selection . . . . . . . . . . . . . . . . . . . . . . . . . . . . . . . . . . . . . . . . . . . . . . . . . . . . . . 62.2.3.2Receptor Selection . . . . . . . . . . . . . . . . . . . . . . . . . . . . . . . . . . . . . . . . . . . . . . . . . . . . . . . . . . . 72.2.3.3Exposure-Response Relationships . . . . . . . . . . . . . . . . . . . . . . . . . . . . . . . . . . . . . . . . . . . . . . . 82.2.3.4Chemical Residue Studies . . . . . . . . . . . . . . . . . . . . . . . . . . . . . . . . . . . . . . . . . . . . . . . . . . . . . 82.2.3.5Population/Community Response Studies . . . . . . . . . . . . . . . . . . . . . . . . . . . . . . . . . . . . . . . . . 92.2.3.6Toxicity Testing/Bioassays . . . . . . . . . . . . . . . . . . . . . . . . . . . . . . . . . . . . . . . . . . . . . . . . . . . . . 9
3.0 BIOLOGICAL SAMPLING METHODS . . . . . . . . . . . . . . . . . . . . . . . . . . . . . . . . . . . . . . . . . . . . . . . . . . . . . . . . . 11
3.1 Chemical Residue Studies . . . . . . . . . . . . . . . . . . . . . . . . . . . . . . . . . . . . . . . . . . . . . . . . . . . . . . . . . . . . . . . . . 113.1.1 Collection Methods . . . . . . . . . . . . . . . . . . . . . . . . . . . . . . . . . . . . . . . . . . . . . . . . . . . . . . . . . . . . . . . 11
3.1.1.1Comparability Considerations . . . . . . . . . . . . . . . . . . . . . . . . . . . . . . . . . . . . . . . . . . . . . . . . . 123.1.1.2Mammals . . . . . . . . . . . . . . . . . . . . . . . . . . . . . . . . . . . . . . . . . . . . . . . . . . . . . . . . . . . . . . . . . 123.1.1.3Fish . . . . . . . . . . . . . . . . . . . . . . . . . . . . . . . . . . . . . . . . . . . . . . . . . . . . . . . . . . . . . . . . . . . . . 133.1.1.4Vegetation . . . . . . . . . . . . . . . . . . . . . . . . . . . . . . . . . . . . . . . . . . . . . . . . . . . . . . . . . . . . . . . . 13
3.1.2 Sample Handling and Preparation . . . . . . . . . . . . . . . . . . . . . . . . . . . . . . . . . . . . . . . . . . . . . . . . . . . . 143.1.3 Analytical Methods . . . . . . . . . . . . . . . . . . . . . . . . . . . . . . . . . . . . . . . . . . . . . . . . . . . . . . . . . . . . . . . 14
009047

3.2 Population/community Response Studies . . . . . . . . . . . . . . . . . . . . . . . . . . . . . . . . . . . . . . . . . . . . . . . . . . . . . 153.2.1 Terrestrial Vertebrate Surveys . . . . . . . . . . . . . . . . . . . . . . . . . . . . . . . . . . . . . . . . . . . . . . . . . . . . . . 153.2.2 Benthic Macroinvertebrate Surveys . . . . . . . . . . . . . . . . . . . . . . . . . . . . . . . . . . . . . . . . . . . . . . . . . . 15
3.2.2.1Rapid Bioassessment Protocols for Benthic Communities . . . . . . . . . . . . . . . . . . . . . . . . . . 163.2.2.2General Benthological Surveys . . . . . . . . . . . . . . . . . . . . . . . . . . . . . . . . . . . . . . . . . . . . . . . . 163.2.2.3Reference Stations . . . . . . . . . . . . . . . . . . . . . . . . . . . . . . . . . . . . . . . . . . . . . . . . . . . . . . . . . . 163.2.2.4Equipment for Benthic Surveys . . . . . . . . . . . . . . . . . . . . . . . . . . . . . . . . . . . . . . . . . . . . . . . . 16
3.2.3 Fish Biosurveys . . . . . . . . . . . . . . . . . . . . . . . . . . . . . . . . . . . . . . . . . . . . . . . . . . . . . . . . . . . . . . . . . . 173.2.3.1Rapid Bioassessment Protocols for Fish Biosurveys . . . . . . . . . . . . . . . . . . . . . . . . . . . . . . . . 17
3.3 Toxicity Tests . . . . . . . . . . . . . . . . . . . . . . . . . . . . . . . . . . . . . . . . . . . . . . . . . . . . . . . . . . . . . . . . . . . . . . . . . . . 173.3.1 Examples of Acute Toxicity Tests . . . . . . . . . . . . . . . . . . . . . . . . . . . . . . . . . . . . . . . . . . . . . . . . . . . . 173.3.2 Examples of Chronic Toxicity Tests . . . . . . . . . . . . . . . . . . . . . . . . . . . . . . . . . . . . . . . . . . . . . . . . . . 18
4.0 QUALITY ASSURANCE/QUALITY CONTROL . . . . . . . . . . . . . . . . . . . . . . . . . . . . . . . . . . . . . . . . . . . . . . . . . 21
4.1 Introduction . . . . . . . . . . . . . . . . . . . . . . . . . . . . . . . . . . . . . . . . . . . . . . . . . . . . . . . . . . . . . . . . . . . . . . . . . . . . . 214.2 Data Categories . . . . . . . . . . . . . . . . . . . . . . . . . . . . . . . . . . . . . . . . . . . . . . . . . . . . . . . . . . . . . . . . . . . . . . . . . . 214.3 Sources of Error . . . . . . . . . . . . . . . . . . . . . . . . . . . . . . . . . . . . . . . . . . . . . . . . . . . . . . . . . . . . . . . . . . . . . . . . . 21
4.3.1 Sampling Design . . . . . . . . . . . . . . . . . . . . . . . . . . . . . . . . . . . . . . . . . . . . . . . . . . . . . . . . . . . . . . . . . 214.3.2 Sampling Methodology and Sample Handling . . . . . . . . . . . . . . . . . . . . . . . . . . . . . . . . . . . . . . . . . . 224.3.3 Sample Homogeneity . . . . . . . . . . . . . . . . . . . . . . . . . . . . . . . . . . . . . . . . . . . . . . . . . . . . . . . . . . . . . . 224.3.4 Sample Analysis . . . . . . . . . . . . . . . . . . . . . . . . . . . . . . . . . . . . . . . . . . . . . . . . . . . . . . . . . . . . . . . . . 22
4.4 QA/QC Samples . . . . . . . . . . . . . . . . . . . . . . . . . . . . . . . . . . . . . . . . . . . . . . . . . . . . . . . . . . . . . . . . . . . . . . . . . 234.4.1 Replicate Samples . . . . . . . . . . . . . . . . . . . . . . . . . . . . . . . . . . . . . . . . . . . . . . . . . . . . . . . . . . . . . . . . 234.4.2 Collocated Samples . . . . . . . . . . . . . . . . . . . . . . . . . . . . . . . . . . . . . . . . . . . . . . . . . . . . . . . . . . . . . . . 244.4.3 Reference Samples . . . . . . . . . . . . . . . . . . . . . . . . . . . . . . . . . . . . . . . . . . . . . . . . . . . . . . . . . . . . . . . 254.4.4 Rinsate Blank Samples . . . . . . . . . . . . . . . . . . . . . . . . . . . . . . . . . . . . . . . . . . . . . . . . . . . . . . . . . . . . 254.4.5 Field Blank Samples . . . . . . . . . . . . . . . . . . . . . . . . . . . . . . . . . . . . . . . . . . . . . . . . . . . . . . . . . . . . . . 254.4.6 Trip Blank Samples . . . . . . . . . . . . . . . . . . . . . . . . . . . . . . . . . . . . . . . . . . . . . . . . . . . . . . . . . . . . . . . 254.4.7 Performance Evaluation/Laboratory Control Samples . . . . . . . . . . . . . . . . . . . . . . . . . . . . . . . . . . . . 254.4.8 Controls . . . . . . . . . . . . . . . . . . . . . . . . . . . . . . . . . . . . . . . . . . . . . . . . . . . . . . . . . . . . . . . . . . . . . . . . 254.4.9 Matrix Spike/Matrix Spike Duplicate Samples . . . . . . . . . . . . . . . . . . . . . . . . . . . . . . . . . . . . . . . . . 264.4.10 Laboratory Duplicate Samples . . . . . . . . . . . . . . . . . . . . . . . . . . . . . . . . . . . . . . . . . . . . . . . . . . . . . . 26
4.5 Data Evaluation . . . . . . . . . . . . . . . . . . . . . . . . . . . . . . . . . . . . . . . . . . . . . . . . . . . . . . . . . . . . . . . . . . . . . . . . . 264.5.1 Evaluation of Analytical Error . . . . . . . . . . . . . . . . . . . . . . . . . . . . . . . . . . . . . . . . . . . . . . . . . . . . . . . 264.5.2 Data Validation . . . . . . . . . . . . . . . . . . . . . . . . . . . . . . . . . . . . . . . . . . . . . . . . . . . . . . . . . . . . . . . . . . 26
5.0 DATA ANALYSIS AND INTERPRETATION . . . . . . . . . . . . . . . . . . . . . . . . . . . . . . . . . . . . . . . . . . . . . . . . . . . 27
5.1 Introduction . . . . . . . . . . . . . . . . . . . . . . . . . . . . . . . . . . . . . . . . . . . . . . . . . . . . . . . . . . . . . . . . . . . . . . . . . . . . . 275.2 Data Presentation And Analysis . . . . . . . . . . . . . . . . . . . . . . . . . . . . . . . . . . . . . . . . . . . . . . . . . . . . . . . . . . . . . 27
009048

5.2.1 Data Presentation Techniques . . . . . . . . . . . . . . . . . . . . . . . . . . . . . . . . . . . . . . . . . . . . . . . . . . . . . . . 275.2.2 Descriptive Statistics . . . . . . . . . . . . . . . . . . . . . . . . . . . . . . . . . . . . . . . . . . . . . . . . . . . . . . . . . . . . . . 275.2.3 Hypothesis Testing . . . . . . . . . . . . . . . . . . . . . . . . . . . . . . . . . . . . . . . . . . . . . . . . . . . . . . . . . . . . . . . 27
5.3 Data Interpretation . . . . . . . . . . . . . . . . . . . . . . . . . . . . . . . . . . . . . . . . . . . . . . . . . . . . . . . . . . . . . . . . . . . . . . . 285.3.1 Chemical Residue Studies . . . . . . . . . . . . . . . . . . . . . . . . . . . . . . . . . . . . . . . . . . . . . . . . . . . . . . . . . . 285.3.2 Population/Community Studies . . . . . . . . . . . . . . . . . . . . . . . . . . . . . . . . . . . . . . . . . . . . . . . . . . . . . . 285.3.3 Toxicity Testing . . . . . . . . . . . . . . . . . . . . . . . . . . . . . . . . . . . . . . . . . . . . . . . . . . . . . . . . . . . . . . . . . . 285.3.4 Risk Calculation . . . . . . . . . . . . . . . . . . . . . . . . . . . . . . . . . . . . . . . . . . . . . . . . . . . . . . . . . . . . . . . . . . 28
APPENDIX A - CHECKLIST FOR ECOLOGICAL ASSESSMENT/SAMPLING . . . . . . . . . . . . . . . . . . . . . . . . . . . 30
APPENDIX B - EXAMPLE OF FLOW DIAGRAM FOR CONCEPTUAL SITE MODEL . . . . . . . . . . . . . . . . . . . . 47
APPENDIX C - EXAMPLE SITES . . . . . . . . . . . . . . . . . . . . . . . . . . . . . . . . . . . . . . . . . . . . . . . . . . . . . . . . . . . . . . . . . 50
REFERENCES . . . . . . . . . . . . . . . . . . . . . . . . . . . . . . . . . . . . . . . . . . . . . . . . . . . . . . . . . . . . . . . . . . . . . . . . . . . . . . . . . 53
009049
List of Figures
FIGURE 1 - Conceptual Site Model . . . . . . . . . . . . . . . . . . . . . . . . . . . . . . . . . . . . . . . . . . . . . . . . . . . . . . . . . . . . . . . . . . 5
FIGURE 2 - Common Mammal Traps . . . . . . . . . . . . . . . . . . . . . . . . . . . . . . . . . . . . . . . . . . . . . . . . . . . . . . . . . . . . . . . 19
FIGURE 3 - Illustrations of Sample Plots . . . . . . . . . . . . . . . . . . . . . . . . . . . . . . . . . . . . . . . . . . . . . . . . . . . . . . . . . . . . . 29
List of Tables
TABLE 1 - Reference List of Standard Operating Procedures -- Ecological Sampling Methods . . . . . . . . . . . . . . . . . . 20
009050

Preface
This document is third in a series of guidance documents designed to assist Superfund Program Site Managers such as On-Scene Coordinators (OSCs), Site Assessment Managers (SAMs), and other field staff in obtaining representative samplesat Superfund sites. It is intended to assist Superfund Program personnel in evaluating and documenting environmental threatin support of management decisions, including whether or not to pursue a response action. This document provides generalguidance for collecting representative biological samples (i.e., measurement endpoints) once it has been determined by theSite Manager that additional sampling will assist in evaluating the potential for ecological risk. In addition, this documentwill:
! Assist field personnel in representative biological sampling within the objectives and scope of the Superfund Program
! Facilitate the use of ecological assessments as an integral part of the overall site evaluation process
! Assist the Site Manager in determining whether an environmental threat exists and what methods are available to assessthat threat
This document is intended to be used in conjunction with other existing guidance documents, most notably, Ecological RiskAssessment Guidance for Superfund: Process for Designing and Conducting Ecological Risk Assessments, OSWER, EPA540-R-97/006.
The objective of representative sampling is to ensure that a sample or a group of samples accurately characterizes siteconditions. Biological information collected in this manner complements existing ecological assessment methods.Representative sampling within the objectives of the Superfund Program is used to:
! promote awareness of biological and ecological issues! define the parameters of concern and the data quality objectives (DQOs)! develop a biological sampling plan! define biological sampling methods and equipment! identify and collect suitable quality assurance/quality control (QA/QC) samples! interpret and present the analytical and biological data
The National Contingency Plan (NCP) requires that short-term response (removal) actions contribute to the efficientperformance of any long-term site remediation, to the extent applicable. Use of this document will help determine ifbiological sampling should be conducted at a site, and if so, what samples will assist program personnel in the collectionof information required to make such a determination.
Identification and assessment of potential environmental threats are important elements for the Site Manager to understand.These activities can be accomplished through ecological assessments such as biological sampling. This document focuseson the performance of ecological assessment screening approaches, more detailed ecological assessment approaches, andbiological sampling methods.
009051

1.0 INTRODUCTION
1.1 OBJECTIVE AND SCOPE
This document is intended to assist Superfund Programpersonnel in evaluating and documenting environmentalthreat in support of management decisions. It presentsecological assessment and sampling as tools in meetingthe objectives of the Superfund Program, which include:
! Determine threat to public health, welfare, and theenvironment
! Determine the need for long-term action
! Develop containment and control strategies
! Determine appropriate treatment and disposaloptions
! Document attainment of clean-up goals
This document is intended to assist Superfund Programpersonnel in obtaining scientifically valid and defensibleenvironmental data for the overall decision-makingprocess of site actions. Both the ComprehensiveEnvironmental Response, Compensation, and LiabilityAct (CERCLA) [§104(a)(1)], as amended by theSuperfund Amendments and Reauthorization Act(SARA), and the NCP [§300.400(a)(2)], require that theUnited States Environmental Protection Agency (U.S.EPA) "protect human health and the environment."
Environmental threats may be independent of humanhealth threats, whether they co-exist at a site or are theresult of the same causative agents. It is thereforeimportant to determine and document potential,substantial, and/or imminent threats to the environmentseparately from threats to human health.
Representative sampling ensures that a sample or a groupof sample accurately characterizes site conditions.
Representative biological sampling and ecological riskassessment include, but are not limited to, the collectionof site information and the collection of samples forchemical or toxicological analyses. Biological samplingis dependent upon specific site requirements duringlimited response actions or in emergency responsesituations. Applying the methods of collectingenvironmental information, as outlined in this document,can facilitate the decision-making process (e.g., duringchemical spill incidents).
The collection of representative samples is critical to thesite evaluation process since all data interpretationassumes proper sample collection. Samples collectedwhich inadvertently or intentionally direct the generateddata toward a conclusion are biased and therefore notrepresentative.
This document provides Superfund Program personnelwith general guidance for collecting representativebiological samples (i.e., measurement endpoints, [seeSection 1.2 for the definition of measurement endpoint]).Representative biological sampling is conducted once theSite Manager has determined that additional samplingmay assist in evaluating the potential for ecological risk.This determination should be made in consultation witha trained ecologist or biologist. The topics covered inthis document include sampling methods and equipment,QA/QC, and data analysis and interpretation.
The appendices in this document provide several types ofassistance. Appendix A provides a checklist for initialecological assessment and sampling. Appendix Bprovides an example flow diagram for the developmentof a conceptual site model. Appendix C providesexamples of how the checklist for ecologicalassessment/sampling is used to formulate a conceptualsite model that leads up to the design of a siteinvestigation.
This document is intended to be used in conjunction withother existing guidance documents, most notably,Ecological Risk Assessment Guidance for Superfund:Process for Designing and Conducting Ecological RiskAssessments, EPA 540-R-97/006 (U.S. EPA 1997).
1.2 RISK ASSESSMENT OVERVIEW
The term ecological risk assessment (ERA), as used inthis document, and as defined in Ecological RiskAssessment Guidance for Superfund: Process forDesigning and Conducting Ecological RiskAssessments, OSWER, EPA 540-R-97/006 (U.S. EPA1997) refers to:
"... a qualitative and/or quantitative appraisal ofthe actual or potential impacts of a hazardouswaste site on plants and animals other thanhumans and domesticated species."
Risk assessments are an integral part of the Superfundprocess and are conducted as part of the baseline riskassessment for the remedial investigation and feasibility
009052

study (RI/FS). The RI is defined by a characterization of Guidelines for human health risk assessment have beenthe nature and extent of contamination, and ecological established; however, comparable protocols forand human health risk assessments. The nature and ecological risk assessment do not currently exist.extent of contamination determines the chemicals presenton the site. The ecological and human health riskassessments determine if the concentrations threaten theenvironment and human health.
An ecological risk assessment is a formal process thatintegrates knowledge about an environmentalcontaminant (i.e., exposure assessment) and its potentialeffects to ecological receptors (i.e., hazard assessment).The process evaluates the likelihood that adverseecological effects may occur or are occurring as a resultof exposure to a stressor. As defined by U.S. EPA(1992), a stressor is any physical, chemical or biologicalentity that can induce an adverse ecological response.Adverse responses can range from sublethal chroniceffects in an individual organism to a loss of ecosystemfunction.
Although stressors can be biological (e.g., introducedspecies), in the Superfund Program substancesdesignated as hazardous under CERCLA are usually thestressors of concern. A risk does not exist unless (1) thestressor has the ability to cause one or more adverseeffects, and (2) it co-occurs with or contacts an ecologicalcomponent long enough and at sufficient intensity to elicitthe identified adverse effect.
The risk assessment process also involves theidentification of assessment and measurement endpoints.Assessment endpoints are explicit expressions of theactual environmental values (e.g., ecological resources)that are to be protected. A measurement endpoint is ameasurable biological response to a stressor that can berelated to the valued characteristic chosen as theassessment endpoint (U.S. EPA 1997). Biologicalsamples are collected from a site to represent thesemeasurement endpoints. See Section 2.2 for a detaileddiscussion of assessment and measurement endpoints.
Except where required under other regulations, issuessuch as restoration, mitigation, and replacement areimportant to the program but are reserved forinvestigations that may or may not be included in the RIphase. During the management decision process ofselecting the preferred remedial option leading to theRecord of Decision (ROD), mitigation and restorationissues should be addressed. Note that these issues are notnecessarily issues within the baseline ecological riskassessment.
Ecological Risk Assessment Guidance for Superfund:Process for Designing and Conducting Ecological RiskAssessments.” (U.S. EPA 1997) provides conceptualguidance and explains how to design and conductecological risk assessments for a CERCLA RI/FS. TheFramework for Ecological Risk Assessment (U.S. EPA1992) provides an Agency-wide structure for conductingecological risk assessments and describes the basicelements for evaluating site-specific adverse effects ofstressors on the environment. These documents shouldbe referred to for specific information regarding the riskassessment process.
While the ecological risk assessment is a necessary firststep in a “natural resource damage assessment” toprovide a causal link, it is not a damage evaluation. Anatural resource damage assessment may be conducted atany Superfund site at the discretion of the NaturalResource Trustees. The portion of the damageassessment beyond the risk assessment is theresponsibility of the Natural Resource Trustees, not of theU.S. EPA. Therefore, natural resource damageassessment is not addressed in this guidance.
1.3 CONCEPTUAL SITE MODEL
A conceptual site model is an integral part of a siteinvestigation and/or ecological risk assessment as itprovides the framework from which the study design isstructured. The conceptual site model followscontaminants from their sources, through transport andfate pathways (air, soil, surface water, groundwater), tothe ecological receptors. The conceptual model is astrong tool in the development of a representativesampling plan and is a requirement when conducting anecological risk assessment. It assists the Site Manager inevaluating the interaction of different site features (e.g.,drainage systems and the surrounding topography),thereby ensuring that contaminant sources, pathways, andecological or human receptors throughout the site havebeen considered before sampling locations, techniques,and media are chosen. Frequently, a conceptual model is created as a site map(Figure 1) or flow diagram that describes the potentialmovement of contaminants to site receptors (seeAppendix B). Important considerations when creating aconceptual model are:
! The state(s) (or chemical form) of eachcontaminant and its potential mobility throughvarious media
009053

! Site topographical features ! Meteorological conditions (e.g., climate,
precipitation, humidity, wind direction/speed) ! Wildlife area utilization.
Preliminary and historical site information may providethe identification of the contaminant(s) of concern and thelevel(s) of the contamination. A sampling plan should bedeveloped from the conceptual model based on theselected assessment endpoints.
The conceptual site model (Figure 1) is applied to thisdocument, Representative Sampling Guidance Volume3: Biological. Based on the model, you canapproximate:
! Potential Sourceshazardous waste site (waste pile, lagoon,emissions), drum dump (runoff, leachate),agricultural (runoff, dust, and particulates)
! Potential Exposure Pathways - ingestion
waste contained in the pile on thehazardous waste site; soil particles nearthe waste pile; drum dump; or area ofagricultural activity
- inhalationdust and particulates from waste pile,drum dump, or area of agricultural activity
- absorption/direct contact In addition to these considerations, the quality assurancesoil near waste pile, drum dump, or area ofagricultural activity and surface waterdownstream of sources
! Potential Migration Pathways - air (particulates and gases) from drum dump
and area of agricultural activity - soil (runoff) from the hazardous waste site,
drum dump, and agricultural runoff - surface water (river & lake) from hazardous
waste site and agricultural runoff - groundwater (aquifer) from drum dump
leachate.
! Potential Receptors of Concern (and associated potential routes) - wetland vegetation/mammals/invertebrates if
suspected to be in contact with potentiallycontaminated soil and surface water
- riverine vegetation/aquatic organisms ifsuspected to be in contact with potentiallycontaminated surface water and soil
- lake vegetation/mammals/aquatic organisms if
suspected to be in contact with potentiallycontaminated surface water and leachate.
1.4 DATA QUALITY OBJECTIVES
Data quality objectives (DQOs) state the level ofuncertainty that is acceptable from data collectionactivities. DQOs also define the data quality necessary tomake a certain decision. Consider the following whenestablishing DQOs for a particular project:
• Decision(s) to be made or question(s) to beanswered;
• Why environmental data are needed and howthe results will be used;
• Time and resource constraints on datacollection;
• Descriptions of the environmental data to becollected;
• Applicable model or data interpretation methodused to arrive at a conclusion;
• Detection limits for analytes of concern; and
• Sampling and analytical error.
components of precision, accuracy (bias), completeness,representativeness, and comparability should also beconsidered. Quality assurance components are defined asfollows:
• Precision -- measurement of variability in thedata collection process.
• Accuracy (bias) -- measurement of bias in theanalytical process. The term "bias" throughoutthis document refers to the QA/QC accuracycomponent.
• Completeness -- percentage of samplingmeasurements which are judged to be valid.
• Representativeness -- degree to which sampledata accurately and precisely represent thecharacteristics of the site contaminants and theirconcentrations.
• Comparability -- evaluation of the similarity ofconditions (e.g., sample depth, sample
009054

homogeneity) under which separate sets of dataare produced.
Many of the DQOs and quality assurance considerationsfor soil, sediment, and water sampling are also applicableto biological sampling. However, there are alsoadditional considerations that are specific to biologicalsampling.
• Is biological data needed to answer thequestion(s) and, if so, how will the data be used;
• Seasonal, logistical, resource, and legalconstraints on biological specimen collection;
• What component of the biological system willbe collected or evaluated (i.e., tissue samples,whole organisms, population data, communitydata, habitat data);
• The specific model or interpretation scheme tobe utilized on the data set;
• The temporal, spatial, and behavioral variabilityinherent in natural systems.
Quality assurance/quality control (QA/QC) objectives arediscussed further in Chapter 4.
1.5 TECHNICAL ASSISTANCE
In this document, it is assumed that technicalspecialists are available to assist Site Managers and othersite personnel in determining the best approach toecological assessment. This assistance ensures that allapproaches are up-to-date and that best professionaljudgment is exercised. Refer to Appendix A for moreinformation.
Support in designing and evaluating ecologicalassessments is currently available from regional technicalassistance groups such as Biological TechnicalAssistance Groups (BTAGs). Support is also availablefrom the Environmental Response Team Center (ERTC)as well as from other sources within each region.
009055

009056

2.0 BIOLOGICAL/ECOLOGICAL ASSESSMENT APPROACHES
2.1 INTRODUCTION 2.2.1 Literature Screening Values
Biological assessments vary in their level of effort, To determine the environmental effects of contaminantscomponents, and complexity, depending upon the at a hazardous waste site, the levels of contaminantsobjectives of the study and specific site conditions. An found may be compared to literature toxicity screeningassessment may consist of literature-based risk values or established screening criteria. These valuesevaluations and/or site-specific studies (e.g., should be derived from studies that involve testing of thepopulation/community studies, toxicity tests/bioassays, same matrix and a similar organism of concern. Mostand tissue residue analyses). simply stated, if the contaminant levels on the site are
Superfund Program personnel (RPMs and OSCs) may be site may be necessary to determine the presence of risk.limited to completing the ecological checklist (Appendix Site contaminant levels that are lower than establishedA) during the Preliminary Site Evaluations and to criteria may indicate that no further evaluation isconsulting an ecological specialist if it is determined that necessary at the site for that contaminant.additional field data are required. The checklist isdesigned to be completed by one person during an initialsite visit. The checklist provides baseline data, is usefulin designing sampling objectives, and requires a fewhours to complete in the field.
When the Site Manager determines that additional datacollection is needed at a response site, the personnel andother resources required depends on the selectedapproach and the site complexity.
To determine which biological assessment approach orcombination of approaches is appropriate for a given siteor situation, several factors must be considered. Theseinclude what management decisions will ultimately needto be made based on the data; what are the studyobjectives; and what should be the appropriate level ofeffort to obtain knowledge of contaminant fate/ transportand ecotoxicity.
2.2 RISK EVALUATION
Three common approaches to evaluating environmentalrisk to ecological receptors are (1) the use of literaturescreening values (e.g., literature toxicity values) forcomparison to site-specific contaminant levels, (2) a"desk-top" risk assessment which can model existing site-specific contaminant data to ecological receptors forsubsequent comparison to literature toxicity values, and(3) field investigation/laboratory analysis that involves asite investigation (which may utilize existing contaminantdata for support) and laboratory analysis of contaminantlevels in media and/or experimentation using bioassayprocedures. These three approaches are described infurther detail next.
above the established criteria, further evaluation of the
2.2.2 Risk Calculations
The "desk-top" risk calculation approach compares sitecontaminants to information from studies found intechnical literature. This type of evaluation can serve asa screening assessment or as a tier in a more complexevaluation. Since many assumptions must be made dueto limited site-specific information, risk calculations arenecessarily conservative. The collection and inclusion ofsite-specific field data can reduce the number and/or themagnitude of these "conservative" assumptions, therebygenerating a more realistic calculation of potential risk.(See Chapter 5.0 for a complete discussion on riskcalculations.)
2.2.3 Standard Field Studies
Two important aspects of conducting a field study thatwarrant discussion are the selection of a reference areaand the selection of the receptors of concern. These areimportant to establish prior to conducting a field study.
2.2.3.1 Reference Area Selection
A reference area is defined in this document as an areathat is outside the chemical influence of the site butpossesses similar characteristics (e.g., habitat, substratetype) that allows for the comparison of data between theimpacted area (i.e., the site) and the unimpacted area (i.e.,the reference area). Reference areas can provideinformation regarding naturally occurring compounds andthe existence of any regional contamination independentof the site. They can help determine if contaminants areubiquitous in the area and can separate site-related issuesfrom non-site related issues.
009057

The reference area must be of similar habitat type and the site are PCBs that are bioaccumulative, a mammalsupport a species composition similar to the study area. such as a mink could be selected for the study since thisThe collection and analysis of samples from a reference species is documented to be sensitive to thearea can support site-specific decisions regarding uptake, bioaccumulation of PCBs. The mink in this case hasbody burden, and accumulation of chemicals and toxicity. been selected to be used for establishing the measurement
The reference area should be outside the area of influence However, it may not be feasible to collect mink for studyof the site and if possible, in an area of minimal due to their low availability in a given area. Therefore,contamination or disturbance. Location of reference the food items of the mink (e.g., small mammals, aquaticareas in urban or industrial areas is frequently difficult, vertebrates and invertebrates) may be collected andbut an acceptable reference area is usually critical to the analyzed for PCBs as an alternative means of evaluatingsuccessful use of ecological assessment methods. the risk to mink. The resulting residue data may be
2.2.3.2 Receptor Selection
The selection of a receptor is dependent upon theobjectives of the study and the contaminants present. Thefirst step is to determine the toxicity characteristics of thecontaminants (i.e., acute, chronic, bioaccumulative, ornon-persistent). The next step is to determine theexposure route of the chemical (i.e., dermal, ingestion,inhalation).
Selection of the receptor or group of receptors is acomponent of establishing the measurement endpoint inthe study design. When discussing the term measurementendpoint, it is useful to first define a related concept, theassessment endpoint. An assessment endpoint is definedas “an explicit expression of the environmental value thatis to be protected.” For example, “maintaining aquaticcommunity composition and structure downstream of asite similar to that upstream of the site” is an explicitassessment endpoint. Inherent in this assessment endpointis the process of receptor selection that would mostappropriately answer the question that the endpointraises. Related to this assessment endpoint is themeasurement endpoint which is defined as “a measurableecological characteristic that is related to the valuedcharacteristic chosen as the assessment endpoint.” Forexample, measurements of biological effects such asmortality, reproduction, or growth of an invertebratecommunity are measurement endpoints. Establishingthese endpoints will ensure (1) that the proper receptorwill be selected to best answer the questions raised by theassessment and measurement endpoints, and (2) that thefocus of the study remains on the component of theenvironment that may be used as the basis for decision.
There are a number of factors that must be consideredwhen selecting a target species. The behavioral habitsand lifestyle of the species must be consistent with theenvironmental fate and transport of the contaminants ofinterest as well as pathways of exposure to receptorspecies. For example, if the contaminants of concern at
endpoint that is representative of piscivorous mammals.
utilized to produce a dose model. From this model, areference dose value may be determined from which theprobable effects to mink calculated.
The movement patterns of a measurement endpoint arealso important during the receptor selection process.Species that are migratory or that have large feedingranges are more difficult to link to site exposure thanthose which are sessile, territorial, or have limitedmovement patterns.Ecological field studies offer direct or corroborativeevidence of a link between contamination and ecologicaleffects. Such evidence includes:
! Reduction in population sizes of species thatcan not be otherwise explained by naturallyoccurring population cycles
! Absence of species normally occurring in thehabitat and geographical distribution
! Dominance of species associated primarily withstressed habitat
! Changes in community diversity or trophicstructure relative to a reference location
! High incidence of lesions, tumors, or otherpathologies
! Development of exposure responserelationships.
Ecologists usually compare data of observed adverseeffects to information obtained from a reference area notaffected by site contamination. To accomplish this,chemical and biological data should be collectedsimultaneously and then compared to determine if acorrelation exists between contaminant concentrationsand ecological effects (U.S. EPA 1991b). Thesimultaneous collection of the data is important inreducing the effect of temporal variability as a factor inthe correlation analysis.
The type of field study selected is directed by thecontaminants present linked to the assessment endpoint.Prior to choosing a specific study approach, the sitecontaminant must be determined using information about
009058

known or suspected site contaminants and how the nature thereby strengthening the linkage to the site. A numberof these contaminants may be modified by several of organism- and contaminant-specific factors should alsoenvironmental and ecotoxicological factors. In addition, be considered when designing residue studies (see Philipsevaluation of chemical fate and transport information is [1977] and [1978] for additional information). Thenecessary to determine the appropriate matrix and subsequent chemical analysis may be conducted ontechnique. specific target tissues or the whole body. In most cases,
Contaminants can be a food chain threat, a lethal threat, biological assessments. This is because most preya direct non-lethal toxicant, indirect toxicant, or some species are eaten in entirety by the predator.combination of the four. Chemical residue studies areappropriate if the contaminant of concern (COC) will In designing residue analysis studies, it is important tobioaccumulate. Ecotoxicological information can provide evaluate the exposure pathway carefully. If the organismsinsight about contaminants that are expected to analyzed are not within the site-specific exposureaccumulate in organisms. It can also provide information pathway, the information generated will not relate to theabout which organisms provide the best data for the study environmental threat. Evaluation of the exposureobjectives. For example, the species-specific pathway may suggest that a species other than the one ofbioaccumulation rate must be considered along with direct concern might provide a better evaluation ofanalytical detection limits; the bioaccumulated levels potential threat or bioaccumulation.need to be above the analytical detection limits. Incontrast, population/ community studies or toxicity testing Because there are different data needs for each objective,may be more appropriate if the contaminants cause direct the study objective needs to be determined prior to thelethality. collection of organisms. In these studies the actual
2.2.3.3 Exposure - ResponseRelationships
The relationship between the exposure (or dose) of acontaminant and the response that it elicits is afundamental concept in toxicology (Timbrell 1989). Thesimplest response to observe is death. Some examples ofother responses that vary in terms of ease of measurementinclude pathological lesions, cell necrosis, biochemicalchanges, and behavioral changes. It is this foundation ofexposure-response relationships upon which the conceptof chemical residue studies, population/communitystudies, and toxicity testing/bioassays are built upon.
2.2.3.4 Chemical Residue Studies
Residue studies are appropriate to use when there isconcern about the accumulation of contaminants in thetissues of indigenous species. Residue studies areconducted by collecting organisms of one or more speciesand comparing the contaminant bioaccumulation data tothose organisms collected from a reference area.
Chemical residue studies require field collection of biotaand subsequent tissue analysis. A representativeorganism for collection and analysis is selected based onthe study objectives and the site habitat. Generally theorganism should be abundant, sessile (or with limitedhome range), and easy to capture. These attributes helpto provide a sufficient number of samples for analysis
whole-body analysis is the method of choice to support
accumulation (dependent upon the bioavailability) of thecontaminants is evaluated rather than assumed fromliterature values. The information collected then allowsfor site-specific evaluation of the threat and reduces theuncertainty associated with the use of literaturebioavailability values. These factors may be applied forspecific areas of uncertainty inherent from theextrapolation of available data (e.g., assumptions of 100percent bioaccumulation, variations in sensitivepopulations).
As stated previously, because site conditions as well asthe bioavailability can change over time, it is importantthat exposure medium (soil, sediment, or water) samplesand biological samples are collected simultaneously andanalyzed for the same parameters to allow for thecomparison of environmental contaminant levels in thetissue and the exposure medium. This is critical inestablishing a site-specific linkage that must bedetermined on a case-by-case basis.
2.2.3.5 Population/CommunityResponse Studies
The fundamental approach to population or communityresponse studies is to systematically sample an area,documenting the organisms of the population orcommunity. Individuals are typically identified andenumerated, and calculations are made with respect to thenumber, and species present. These calculated values(e.g., indices or metrics) are used to compare samplinglocations and reference conditions. Some population and
009059
community metrics include the number of individuals, endpoints in acute toxicity testing is mortality (alsospecies composition, density, diversity, and community referred to as lethality) because it is one of the most easilystructure. measured parameters.
2.2.3.6 Toxicity Testing/Bioassays
A third common assessment approach is to utilize toxicitytests or bioassays. A toxicity test may be designed tomeasure the effects from acute (short-term) or chronic(long-term) exposure to a contaminant. An acute testattempts to expose the organism to a stimulus that issevere enough to produce a response rapidly. Theduration of an acute toxicity test is short relative to theorganism’s life cycle and mortality is the most commonresponse measured. In contrast, a chronic test attemptsto induce a biological response of relatively slowprogress through continuous, long-term exposure to acontaminant.
In designing a toxicity test, it is critical to understand thefate, transport, and mechanisms of toxicity of thecontaminants to select the test type and conditions. Thetoxicity test must be selected to match the site and itsconditions rather than modify the site matrix for the useof a particular test. Factors to consider are the testspecies, physical/chemical factors of the contaminatedmedia, acclimation of test organisms, necessity forlaboratory versus field testing, test duration, and selectionof test endpoints (e.g., mortality or growth). A thoroughunderstanding of the interaction of these and other factorsis necessary to determine if a toxicity test meets the studyobjectives.
The selection of the best toxicity test, including the choiceof test organism, depends on several factors:
! The decisions that will be based on the resultsof the study
! The ecological setting of the site
! The contaminant(s) of concern
Toxicity testing can be conducted on a variety of samplematrices, including water (or an aqueous effluent),sediment, and soil. Soil and sediment toxicity tests canbe conducted on the parent material (solid-phase tests) oron the elutriate (a water extract of the soil or sediment).Solid-phase sediment and soil tests are currently thepreferred tests since they evaluate the toxicity of thematrix of interest to the test organisms, thereby providingmore of a realistic site-specific exposure scenario.
As stated previously, one of the most frequently used
In contrast, some contaminants do not cause mortality intest organisms but rather they affect the rate or success ofreproduction or growth in test organisms. In this case,the environmental effect of a contaminant may be that itcauses reproductive failure but does not cause mortalityin the existing population. In either case, the populationwill either be eliminated or drastically reduced.
The use of control as well as reference groups is normallyrequired. Laboratory toxicity tests include a control thatevaluates the laboratory conditions, and the health andresponse of the test organisms. Laboratory controls arerequired for all valid toxicity tests. A reference providesinformation on how the test organisms respond to theexposure medium without the site contaminants.Therefore, the reference is necessary for interpretation ofthe test results in the context of the site (i.e., sample datais compared to the reference data). It is not uncommonfor conditions other than contamination to induce aresponse in a toxicity test. With proper reference andcontrol tests, toxicity tests can be used to establish a linkbetween contaminants results and adverse effects.
Within the Superfund Program, conducting toxicity teststypically involves collecting field samples (water,sediment, soil) and transferring the materials to alaboratory. In situ (field conducted) tests can be run iffield conditions permit. There are benefits andlimitations associated with each approach. The mostnotable benefit of laboratory testing is that exposureconditions are controlled, but this leads to its mostnotable limitation, a reduction of realism. With in situtests, the reality of the exposure situation is increased, butthere is a reduction of test controls. See U.S. EPA'sCompendium of ERT Toxicity Testing Procedures,OSWER Directive 9360.4-08, EPA/540/P-91/009 (U.S.EPA 1991a), for descriptions of nine common toxicitytests and Standard Guide for Conducting SedimentToxicity Tests with Freshwater Invertebrates, ASTMStandard E1383, October 1990.
009060

Species Selection for Toxicity Testing
Selection of the test organism is critical in designing astudy using toxicity testing. The species selected shouldbe representative relative to the assessment endpoint,typically an organism found within the exposure pathwayexpected in the field. To be useful in evaluating risk, thetest organism must respond to the contaminant(s) ofconcern. This can be difficult to achieve since the speciesand tests available are limited. Difficult choices andbalancing of factors are frequently necessary.
009061

3.0 BIOLOGICAL SAMPLING METHODS
Once a decision has been made that additional data are logistical reasons. Exposure levels for these receptorsrequired to assess the biological threat posed by a site, an can be estimated by collecting organisms that are preyedappropriate sampling plan must be developed. The upon by the ROC. For example, if the ROC is aselection of ecological sampling methods and equipment predatory bird, the species collected for contaminant levelis dependent upon the field assessment approach, as measurements may be one of several small mammals ordiscussed in Chapters 1 and 2. Thus, the selection of an fish that the ROC is known to eat.assessment approach is the initial step in the collectionprocess. This chapter does not present step-by-step As noted previously, it is critical to link the accumulatedinstructions for a particular method, nor does it present an contaminants both to the site and to an exposure medium.exhaustive list of methods or equipment. Rather, it Subsequently, the collection and analysis ofpresents specific examples of the most commonly used representative soil, sediment, or water samples from themethods and associated equipment. Table 4.1 (at the end same location are critical. A realistic site-specificof this chapter) lists some of the standard operating Bioaccumulation Factor (BAF) or Bioconcentrationprocedures (SOPs) used by the U.S. EPA's Factor (BCF) may then be calculated for use in the siteEnvironmental Response Team Center (ERTC). exposure models.
Because of the complex process required for selectingthe proper assessment approach for a particular site,consultation with an ecologist/biologist experienced inconducting ecological risk assessments is stronglyrecommended.
3.1 CHEMICAL RESIDUE STUDIES
Chemical residue studies are a commonly used approachthat can address the bioavailability of contaminants inmedia (e.g., soil, sediment, water). They are often called It should be noted that any applicable state permitstissue residue studies because they measure the should be acquired before any biological sampling event.contaminant body burden in site organisms. States requirements on organism, method, sampling
When collecting organisms for tissue analyses, it is from year to year. critical that the measured levels of contaminants in theorganism are attributable to a particular location and The techniques used to collect different organisms arecontaminant level within the site. Collection techniques specific to the study objectives. All techniques aremust be evaluated for their potential to bias the generated selective to some extent for certain species, sizes, habitat,data. Collection methods can result in some form of or sexes of animals. Therefore, the potential biasesbiased data either by the size, sex, or individual health of associated with each technique should be determinedthe organism. Collection techniques are chosen based on prior to the study. If the biases are recognized prior tothe habitat present and the species of interest. When collection, the sampling may be designed to minimizerepresentative approaches are not practical, the potential effect of the bias. For example, large traps are notbias must be identified and considered when drawing effective for trapping small animals since small mammalsconclusions from the data. The use of a particular are not heavy enough to trigger the trap or may escapecollection technique should not be confused with the need through minute trap openings.to target a "class" of individuals within a population forcollection. For example, in a specific study it may be In determining environmental threat, the target speciesdesirable to collect only males of the species or to collect generally consist of prey species such as earthworms,fish of consumable size. small mammals, or fish. Residue data from these
Some receptors of concern (ROCs) cannot be collected trophic level organisms, which may be difficult to captureand analyzed directly because of low numbers of or analyze.individuals in the study area, or other technical or
"Bioconcentration is usually considered to be that processby which toxic substances enter aquatic organisms, bygill or epithelial tissue from the water. Bioaccumulationis a broader term in the sense that it usually includes notonly bioconcentration but also any uptake of toxicsubstances through the consumption of one organism."(Brungs and Mount 1978).
3.1.1 Collection Methods
location, and data usage differ widely and may change
organisms can be used to evaluate the risk to higher
009062

3.1.1.1 Comparability Considerations
There are two issues that directly affect field collection.First, organisms such as benthic macroinvertebrates tendto have a patchy or non-uniform distribution in theenvironment due to micro habitats and other factors.Therefore, professional evaluation in matching habitat forsampling is critical in the collection of a trulyrepresentative sample of the community. Second,variability in sampling effort and effectiveness needs tobe considered.
3.1.1.2 Mammals
Trapping is the most common method for the collectionof mammals. The selection of traps is determined by thespecies targeted and the habitat present. Both live trap orkill trap methods may be acceptable for residue studies,but consideration of other data uses (e.g., histopathology)or concern for injury or death of non-target species caninfluence the use of certain trap types. Several trap methods are available for collecting smallmammals. Commonly used traps include MuseumSpecial, Havahart, Longworth, and Sherman traps(Figure 3). Although somewhat labor-intensive, pitfalltrap arrays may also be established to include mammalsthat are not regularly trapped using other techniques (e.g.,shrews).
Trap placement is a key element when collectingsamples. Various methods of trap placement can beutilized. These include, but are not limited to:
! Sign method/Best set method
! Paceline method
! Grid method
When using the sign/best set method, an experiencedfield technical specialist searches for fresh mammal signs(e.g., tacks, scat, feeding debris) to determine where thetrap should be positioned. This method typicallyproduces higher trapping success than other methods,however, this method is biased and is therefore generallyused to determine what species are present at the site.
The paceline method involves placement of traps atregular intervals along a transect. A starting point isselected and marked, a landmark is identified to indicatethe direction of the transect, and as the field memberwalks the transect, the traps are placed at regularintervals along it.
The grid method is similar to the paceline method butinvolves a group of evenly spaced parallel transects ofequal lengths to create a grid. Traps are placed at eachgrid node. The size of the grid is dependent on thespecies to be captured and the type of study. Grids ofbetween 500 to 1,000 square meters containingapproximately 100 traps are common. If a grid isestablished in a forest interior, additional paralleltrapping lines may be established to cover the edgehabitat.
Regardless of the type of trapping used, habitatdisturbance should be kept to a minimum to achievemaximum trapping success. In most areas, a trappingsuccess of 10 percent is considered maximum but isoftentimes significantly lower (e.g., 2 to 5 percent). Partof this reduced trapping success is due to habitatdisturbance. Therefore, abiotic media samples (e.g., soil,sediment, water) should be collected well in advance oftrapping efforts or after all trapping is completed.Trapping success also varies with time but may increaseover time with diminishing returns. In other words,extending the trapping period over several days mayproduce higher trapping success by allowing mammalsthat were once peripheral to the trapping area toimmigrate into the now mammal-depauperate area. These immigrants would not be representative of thetrapping area. Therefore, a trapping period of 3 days istypically used to minimize this situation.
Trapping success will also vary widely based on theavailable habitat, targeted species, season, andgeographical location of the site. When determining trapsuccess objectives, it is important to keep in mind theminimum sample mass/volume requirements for chemicalresidue studies.
3.1.1.3 Fish
Electrofishing, gill nets, trawl nets, seine nets, andminnow traps are common methods used for thecollection of fish. The selection of which technique touse is dependent on the species targeted for collectionand the system being sampled. In addition, there areother available fish netting and trapping techniques thatmay be more appropriate in specific areas. As withmammal trapping, disturbance in the area being sampledshould be kept to a minimum to ensure collectionsuccess.
Electrofishing uses electrical currents to gather, slowdown, or immobilize fish for capture. An electrical fieldis created between and around two submerged electrodesthat stuns the fish or alters their swimming within or
009063

around the field. Depending on the electrical voltage, the The use of minnow traps is a passive collection techniqueelectrical pulse frequency, and the fish species, the fish for minnow-sized fish. The trap itself is a metal or plasticmay swim towards one of the electrodes, swim slowly cage that is secured to a stationary point and baited toenough to capture, or may be stunned to the point of attract fish. Small funnel-shaped openings on either endimmobilization. This technique is most effective on fish of the trap allow fish to swim easily into it, but arewith swimbladders and/or shallow water since these fish difficult to locate for exit. Cage “extenders” or “spacers”will float to the surface for easy capture. that are inserted to lengthen the cage, allow larger
Electrofishing can be done using a backpack-mounted collected. electroshocker unit, a shore-based unit, or from a boatusing either type. Electrofishing does not work in salinewaters and can be ineffective in very soft water.Electrofishing is less effective in deep water where thefish can avoid the current. In turbid waters, it may bedifficult to see the stunned fish.
Gill netting is a highly effective passive collectiontechnique for a wide range of habitats. Because of its lowvisibility under water, a gill net captures fish byentangling their gill plates as they attempt to swimthrough the area in which the gill net has been placed in.Unfortunately, this may result in fish to be injured orkilled due to further entanglement, predation, or fatigue.
The size and shape of fish captured is relative to the sizeand kind of mesh used in the net thus creating biastowards a certain sized fish. These nets are typically usedin shallow waters, but may extend to depths exceeding 50meters. The sampling area should be free of obstructionsand floating debris, and provide little to no current.(Hurbert 1983)
Otter trawl netting is an active collection technique thatutilizes the motion of a powered boat to drag a pocket-shaped net through a body of water. The net is secured tothe rear of a boat and pulled to gather any organisms thatare within the opening of the pocket. This pocket is keptopen through the use of underwater plates on either sideof the net that act as keels, spreading the mouth of the netopen.
Seining is another active netting technique that traps fishby encircling them with a long wall of netting. The top ofthe net is buoyed by floats and the bottom of the net isweighed down by lead weights or chains. Seine nets areeffective in open or shallow waters with unobstructedbottoms. Beach or haul seines are used in shallow watersituations where the net extends to the bottom. Purseseines are designed for applications in open water and donot touch the bottom (Hayes 1983).
organisms such as eels, or for a larger mass of fish to be
3.1.1.4 Vegetation
Under certain conditions, the analysis of the chemicalresidue in plants may be a highly effective method ofassessing the impacts of a site. The bioaccumulativepotential of plants varies greatly however, amongcontaminants, contaminant species, soil/sediment textureand chemistry, plant condition, and genetic compositionof the plant. In addition to this variability, plants cantranslocate specific contaminants to different parts of theplant. For example, one contaminant may tend toaccumulate in the roots of a plant, whereas a secondcontaminant may tend to accumulate in the fruit of thesame plant. In this scenario, the collection and analysisof a plant part that normally does not receive translocatedmaterials would not result in a useful sample. Therefore,it is crucial to conduct a literature review prior toestablishing a sampling protocol.
Sampling of herbaceous plants should be conductedduring the growing season of the species of interest.Sampling of woody plants may be conducted during thegrowing or dormant season, however, most plantstranslocate materials from the aboveground portions ofthe plant to the roots prior to dormancy.
Collection methods and sampling specifics may be foundin U.S. EPA/ERT SOP #2037, Terrestrial PlantCommunity Sampling; others are provided in Table 4.1.
3.1.2 Sample Handling andPreparation
The animals or plants collected should be identified tospecies level or the lowest practical taxonomic level.Appropriate metrics (e.g., weight, animal body length,plant height) and the presence of any external anomalies,parasites, and external pathologies should be recorded.If compositing of the sample material is necessary, itshould be performed in accordance with the study design.
Depending upon the study objectives, it may be necessaryto isolate the contaminant levels in animal tissue from the
009064

contaminant levels in the food or abiotic matrices (e.g., The requirement for split samples or other QA samplessediment) entrained in the digestive tract of the organism. must be determined prior to sampling to ensure aThis is an important process in that it separates the sufficient volume of sample is collected. Chapter 4.0contribution of two distinct sources of contaminants to the discusses the selection and use of QA/QC samples.next trophic level, thereby allowing the data user torecognize the relative importance of the two sources. The detection limits of the analytical parameters should
Clearing of the digestive tract (i.e., depuration) of the Detection limits are selected based on the level oforganism must then be accomplished prior to the analytical resolution that is needed to interpret the datachemical analysis. The specific depuration procedures against the study objectives. For example, if the detectionwill vary with each type of organism but all involve limit for a compound is 10 mg/kg but the concentration inallowing the organism to excrete waste products in a tissue which causes effects is 1 mg/kg, the detection limitmanner in which the products may not be reingested, is not adequate to determine if a problem exists. It shouldabsorbed, or deposited back onto the organism. be noted that standard laboratory detection limits for
Biological samples should be handled with caution to Chapter 4.0 provides details on detection limits and otheravoid personal injury, exposure to disease, parasites, or QA/QC parameters.sample contamination. Personal protection such asgloves should be worn when handling animals and traps The tissue analysis can consist of whole body residueto reduce the transfer of scents or oils from the hand to analysis or analysis of specific tissues (i.e., fish fillets).the trap, which could cause an avoidance reaction in the Although less frequently used in Superfund, tissues suchtargeted animals. as organs (e.g., kidney or liver) may be analyzed. The
Samples collected for biological evaluation must be fillet, or specific organ samples are to be analyzed.treated in the same manner as abiotic samples (i.e., thesame health and safety guidelines, decontamination Concurrent analyses should include a determination ofprotocols, and procedures for preventing cross- percent lipids and percent moisture. Percent lipids maycontamination must be adhered to). Biological samples be used to normalize the concentration of non-polardo require some extra caution in handling to avoid organic contaminant data. In addition, the lipid contentpersonal injury and exposure to disease, parasites, and of the organisms analyzed can be used to evaluate thevenoms/resins. The selection of sample containers and organism’s health. Percent moisture determinationsstorage conditions (e.g., wet ice) should follow the same allow the expression of contaminant levels on the basis ofprotocols as abiotic samples. Refer to Chapter 4.0 for wet or dry weight. Wet weight concentration data aredetermination of holding times and additional quality frequently used in food chain accumulation models, andassurance/quality control (QA/QC) handling procedures. dry weight basis data are frequently reported between
3.1.3 Analytical Methods
Chemical analytical methods for tissue analysis aresimilar to those for abiotic matrices (e.g., soil and water),however, the required sample preparation procedures(e.g., homogenization and subsampling) of biologicalsamples are frequently problematic. For example, largebones, abundant hair, or high cellulose fiber content mayresult in difficult homogenization of mammals and plants.Extra steps may be required during sample cleanup dueto high lipid (fat) levels in animals tissue or high resincontent in plant tissue.
Most tissue samples can be placed in a laboratory blenderwith dry ice and homogenized at high speeds. Thesample material is then left to sit to allow for thesublimation of the dry ice. Aliquots of the homogenatemay then be removed for the required analyses.
be established prior to the collection of samples.
abiotic matrices are often not adequate for tissue samples.
study endpoints will determine whether whole body,
sample location comparisons.
Histopathological Analysis
Histopathological analysis can be an effective mechanismfor establishing causative relationships due tocontaminants since some contaminants can cause distinctpathological effects. For example, cadmium causesvisible kidney damage providing causal links betweencontaminants and effects. These analyses may beperformed on organisms collected for residue analysis. Apartial necropsy performed on the animal tissue mayindicate the presence of internal abnormalities orparasites. The time frame and objectives of the studydetermine if histopathological analysis is warranted.
3.2 POPULATION/COMMUNITYRESPONSE STUDIES
009065

Population/community response studies are a commonly may be used to assess overall water quality, evaluate theutilized field assessment approach. The decision to integrity of watersheds, or suggest the presence of anconduct a population/community response study is based influence of the community structure that is independenton the type(s) of contaminants, the time available to of water quality and habitat conditions. conduct the study, the type of communities potentiallypresent at the site, and the time of year of the study. Because BMIs are a primary food source for many fishThese studies are most commonly conducted on non- and other organisms, threats beyond the benthictime-critical or long-term remediation-type site activities. community can be inferred from the evaluation of BMIs.During limited time frame responses, however, a Techniques such as rapid bioassessment protocols maypopulation/community survey or screening level study be used as a tool to support this type of finding andmay be useful for providing information about potential inference. A more comprehensive discussion of generalimpacts associated with a site. benthological surveys may be found in U.S. EPA (1990).
3.2.1 Terrestrial Vertebrate Surveys
Methods for determining adverse effects on terrestrialvertebrate communities are as follows: censusing orpopulation estimates, sex-age ratio determinations,natality/mortality estimations, and diversity studies.
True or accurate censuses are usually not feasible formost terrestrial vertebrate populations due to logisticaldifficulties. Estimations can be derived by counting asubset of organisms or counting and evaluating signssuch as burrows, nests, tracks, feces, and carcasses.Capture-recapture studies may be used to estimatepopulation size but are labor-intensive and usuallyrequire multiple-season sampling. If conductedimproperly, methods for marking captured organismsmay cause irritation or injury or interfere with thespecies’ normal activities.
Age ratios provide information on natality and rearingsuccess, age-specific reproductive rates, and mortalityand survival rates. Sex ratios indicate whether sexes arepresent in sufficient numbers and proportions for normalreproductive activity.
Community composition (or diversity) can be assessed byspecies frequency, species per unit area, spatialdistribution of individuals, and numerical abundance ofspecies (Hair 1980).
3.2.2 Benthic MacroinvertebrateSurveys
Benthic macroinvertebrate (BMI) population/community various components of the community and habitat areevaluations in small- to medium- sized streams have been evaluated, a numerical score is calculated, and the scoresuccessfully used for approximately 100 years to is compared to predetermined values. A review of thedocument injury to the aquatic systems. There are many scores, together with habitat assessment and the physicaladvantages to using BMI populations to determine the and chemical data, support a determination of impact.potential ecological impact associated with a site. U.S. EPA Reference (May, 1989a) presents theSampling is relatively easy, and equipment requirements calculation and interpretation of scores.are minimal. An evaluation of the community structure
3.2.2.1 Rapid BioassessmentProtocols for BenthicCommunities
Rapid bioassessment protocols are an inexpensivescreening tool used for determining if a stream issupporting or not supporting a designated aquatic lifeuse. The rapid bioassessment protocols advocate anintegrated assessment, comparing habitat and biologicalmeasures with empirically defined reference conditions(U.S. EPA 1989a).
The three major components of a rapid bioassessmentessential for determining ecological impact are:
! Biological survey
! Habitat assessment
! Physical and chemical measurements
As with all population/community evaluations, the habitatassessment is of particular concern with respect torepresentative sampling. Care must be taken to preventbias during collection of the benthic community resultingfrom sampling dissimilar habitats. Similar habitats mustbe sampled to make valid comparisons betweenlocations. In addition to habitat similarity, the samplingtechnique and level of effort at each location must beuniform to achieve an accurate interpretation of results.
In the U.S. EPA Rapid Bioassessment Protocol (RBP),
009066

Standard protocols, including the RBP, have been collection.developed to facilitate surveying BMIs to determineimpact rapidly. These protocols use a standard approach Long-handled nets or a Surber sampler with a 0.5-to reduce the amount of time spent collecting and millimeter (mm) size mesh are common sampling nets foranalyzing samples. Protocols range from a quick survey the collection of macroinvertebrates from a riffle area ofof the benthos (Protocol I) to a detailed laboratory a stream. Samples to be collected from deep waterclassification analysis (Protocol III). Protocol I may be gravel, sand, or soft bottom habitats such as ponds, lakes,conducted in several hours; Protocol II is more intensive or rivers are more often sampled using a small Ponar orand focuses on major taxonomic levels; and Protocol III Ekman dredge. Artificial substrates are used in varyingmay require numerous hours to process each sample to a habitats when habitat matching is problematic and/orgreater level of taxonomic and community assessment native substrate sampling would not be effective. Theresolution. These protocols are used to determine most common types of artificial substrate samplers arecommunity health and biological condition via tolerance multiple-plate samplers or barbecue basket samplers.values and matrices. They also create and amend ahistorical data base that can be used for future siteevaluation. The organisms to be taken to the laboratory for
3.2.2.2 General BenthologicalSurveys
Benthological surveys can be conducted with methodsother than those discussed in the RBP protocols utilizingtechniques discussed in the literature. The overallconcept is generally the same as that used in the RBP, butthe specific sampling technique changes depending onthe habitat or community sampled.
3.2.2.3 Reference Stations Protocols for Fish
The use of a reference station is essential to determinepopulation/community effects attributable to a site. Theuse of a reference station within the study area ispreferable (upstream or at a nearby location otherwiseoutside the area of site influence). In some cases this isnot possible due to regional impacts, area-wide habitatdegradation, or lack of a similar habitat. In these casesthe use of population/community studies should be re-evaluated within the context of the site investigation. Ifthe choice is made to include the population/communitystudy, regional reference or a literature-based evaluationof the community may be options.
3.2.2.4 Equipment for BenthicSurveys
The selection of the most appropriate samplingequipment for a particular site is based primarily on thehabitat being sampled. This subsection is a briefoverview of the equipment available for the collection ofBMIs. Detailed procedures are not discussed in thisdocument. For additional information, refer to the SOPsand methods manuals provided in Table 4.1, or consultan ecologist/biologist experienced in this type of field
identification or retained for archival purposes may beplaced in wide-mouthed plastic or glass jars (for ease inremoving contents) and preserved in 70 percent 2-propanol (isopropyl alcohol) or ethyl alcohol (ethanol),30 percent formalin, or Kahle's solution. Refer tomethods manuals for detailed information on samplehandling and preservation.
3.2.3 Fish Biosurveys
3.2.3.1 Rapid Bioassessment
Biosurveys
RBPs IV and V are two levels of fish biosurvey analyses.Protocol IV consists of a questionnaire to be completedwith the aid of local and state fisheries experts. ProtocolV is a rigorous analysis of the fish community throughcareful species collection, identification, andenumeration. This level is comparable to themacroinvertebrate Protocol III (see Section 3.2.2.1) ineffort. Detailed information on both protocols can befound in Rapid Bioassessments Protocols for Use InStreams and Rivers (U.S. EPA 1989a).
3.3 TOXICITY TESTS
Toxicity tests evaluate the relative threat of exposure tocontaminated media (e.g., soil, sediment, water) in acontrolled setting. These tests are most often conductedin the laboratory, although they may be conducted in thefield as well. These tests provide an estimate of therelationship between the contaminated medium, the levelof contaminant, and the severity of adverse effects underspecific test parameters. Toxicity tests are categorized byseveral parameters which include duration of the test, testspecies, life stage of the organism, test end points, and
009067

other variables.
The collection of the actual samples on which the testsare to be conducted follow the same protocols ascollection of representative samples for chemicalanalyses. Typically, a subsample of the media collectedfor toxicity testing is submitted for chemical analyses.The use of a concentration gradient for toxicity testing isfrequently desired to establish a concentration gradientwithin the test. This also eliminates the need to sampleall the locations at a site. The specific methods to befollowed for toxicity tests are described in detail in U.S.EPA's Compendium of ERT Toxicity TestingProcedures, OSWER Directive 9360.4-08, EPA/540/P-91-009 (U.S. EPA 1991a), as well as existing SOPslisted in Table 4.1. These published procedures addresssample preservation, handling and storage, equipmentand apparatus, reagents, test procedures, calculations,QA/QC, and data validation. The practical uses ofvarious toxicity tests, including examples of acute andchronic tests, are described next. Each section includesan example toxicity test.
3.3.1 Examples Of Acute Toxicity Tests
Example No. 1 (solid-phase soil) At the end of the exposure period, the larvae are removed
Laboratory-raised earthworms are placed 30 per replicate body weight. into test chambers containing site soil. A laboratorycontrol and a site reference treatment are established to The organisms are then returned to the test vessels andprovide a means for comparison of the resulting data set. allowed to mature to the adult stage. An emergence trapDepending on the anticipated contaminant concentrations is placed over the test vessel and the number of emergingin the site soil, the soil may be used in its entirety or adults is recorded. These results, as well as the lengthdiluted with control or site reference soil. The test and weight results, are statistically compared to thechambers are examined daily for an exposure period of control and site reference treatments to infer the14 days and the number dead organisms is tabulated. toxicological effects of the contaminant concentrations.When the observed mortality in the site soil treatments isstatistically compared to control and site referencetreatments, inferences regarding the toxicity of thecontaminant concentrations in the site soil treatments maybe drawn.
Example No. 2 (surface water)
Fathead minnows (Pimephales promelas) are exposedfor 96 hours in aerated test vessels containing surfacewater from sampling locations representing aconcentration gradient. The mortality of the organisms isrecorded at the end of the exposure period andstatistically compared to control and site referencetreatments. Statistically significant differences betweentreatments may be attributed to the varying contaminantconcentrations.
3.3.2 Examples of ChronicToxicity Tests
Example No. 1 (surface water)
Fathead minnow larvae (Pimephales promelas) areexposed for 7 days to surface water collected fromsampling locations that represent a concentrationgradient. Each replicate consists of 20 individuals of thesame maturity level. The test vessels are aerated and thewater is replaced daily. The fish, which should haveremained alive throughout the exposure period, areharvested and measured for body length and body weight.These results represent growth rates and are statisticallycompared to the control and site reference treatments toinfer the toxicological effects of the contaminantconcentrations.
Example No. 2 (sediment)
Midge (Chironomus sp.) larvae are exposed for 10 daysto sediment, overlain with site reference water, andcollected from sampling locations that represent aconcentration gradient. Each replicate consists of 200individuals of the same maturity level (1st instar). Thetest vessels are aerated and the water is replaced daily.
from the test vessels and measured for body length and
009068

Figure 2: Common Mammal Traps
Havahart Trap
Longworth live trap
(A) (B)Folding (A) and non-folding (B) Sherman live traps
009069

TABLE 1Reference List of Standard Operating Procedures -- Ecological Sampling Methods
SOP/Method No. Source Procedure/Method Title Publication No.
SOP No. 1820 ERTC Tissue Homogenization Procedure (in development)
SOP No. 1821 ERTC Semi-Volatiles Analysis of Tissue Samples by GC/MS (in development)
SOP No. 1822 ERTC Pesticides/PCB Analysis of Tissue Samples by GC/ECD (in development)
SOP No. 1823 ERTC Microwave Digestion and Metals Analysis of Tissue Samples (in development)
SOP No. 2020 ERTC OSWER EPA/540/P-91/0097-Day Standard Reference Toxicity Test Using Larval Fathead Minnows Pimephales promelas
SOP No. 2021 ERTC OSWER EPA/540/P-91/00924-Hour Range Finding Test Using Daphnia magna or Daphnia pulex
SOP No. 2022 ERTC OSWER EPA/540/P-91/00996-Hour Acute Toxicity Test Using Larval Pimephales promelas
SOP No. 2023 ERTC OSWER EPA/540/P-91/00924-Hour Range Finding Test Using Larval Pimephales promelas
SOP No. 2024 ERTC OSWER EPA/540/P-91/00948-Hour Acute Toxicity Test Using Daphnia magna or Daphnia pulex
SOP No. 2025 ERTC OSWER EPA/540/P-91/0097-Day Renewal Toxicity Test Using Ceriodaphnia dubia
SOP No. 2026 ERTC OSWER EPA/540/P-91/0097-Day Static Toxicity Test Using Larval Pimephales promelas
SOP No. 2027 ERTC OSWER EPA/540/P-91/00996-Hour Static Toxicity Test Using Selenastrum capricornutum
SOP No. 2028 ERTC OSWER EPA/540/P-91/00910-Day Chronic Toxicity Test Using Daphnia magna or Daphnia pulex
SOP No. I-001 ERTC (in development)15-Day Solid Phase Toxicity Test Using Chironomus tentans
SOP No. I-002 ERTC (in development)28-Day Solid Phase Toxicity Test Using Hyalella azteca
Greene et al.(1989) - EPA 600/3-88-02914-Day Acute Toxicity Test Using adult Eisenia andrei (earthworms)
SOP No. I-005 ERTC Field Processing of Fish (in development)
SOP No. 2029 ERTC Small Mammal Sampling and Processing (in development)
SOP No. 2032 ERTC Benthic Sampling (in development)
SOP No. 2033 ERTC Plant Protein Determination (in development)
SOP No. 2034 ERTC Plant Biomass Determination (in development)
SOP No. 2035 ERTC Plant Peroxidase Activity Determination (in development)
SOP No. 2036 ERTC Tree Coring and Interpretation (in development)
SOP No. 2037 ERTC Terrestrial Plant Community Sampling (in development)
009070

4.0 QUALITY ASSURANCE/QUALITY CONTROL
4.1 INTRODUCTION
The goal of representative sampling is to yieldquantitative data that accurately depict site conditions ina given period of time. QA/QC measures specified in thesampling procedures minimize and quantify the errorintroduced into the data.
Many QA/QC measures are dependant on QA/QCsamples submitted with regular field samples. QA/QCsamples evaluate the three following types of information:(1) the degree of site variation; (2) whether samples werecross-contaminated during sampling and sample handlingprocedures; and (3) whether a discrepancy in sampleresults is attributable to field handling, laboratoryhandling, or analysis. For additional information on QAobjectives, refer to U.S. EPA Quality Assurance/QualityControl (QA/QC) Guidance for Removal Activities,EPA/540/G-90/004, April 1990.
4.2 DATA CATEGORIES
The U.S. EPA has established a process of data qualityobjectives (DQOs) which establish what type, quantity,and quality of environmental data are appropriate fortheir intended application. In its DQO process, U.S.EPA has defined two broad categories of data: screeningand definitive.
Screening data are generated by rapid, less precisemethods of analysis with less rigorous samplepreparation. Sample preparation steps may be restrictedto simple procedures such as dilution with a solvent,rather than an elaborate extraction/digestion and cleanup.At least 10 percent of the screening data are confirmedusing the analytical methods and QA/QC procedures andcriteria associated with definitive data. Screening datawithout associated confirmation data are not consideredto be data of known quality. To be acceptable, screeningdata must include the following:
! chain of custody! initial and continuing calibration! analyte identification! analyte quantification
Streamlined QC requirements are the definingcharacteristic of screening data.
Definitive data are generated using rigorous analyticalmethods (e.g., approved U.S. EPA reference methods).
These data are analyte-specific, with confirmation ofanalyte identity and concentration. Methods producetangible raw data (e.g., chromatograms, spectra, digitalvalues) in the form of hard-copy printouts or computer-generated electronic files. Data may be generated at thesite or at an off-site location as long as the QA/QCrequirements are satisfied. For the data to be definitive,either analytical or total measurement error must bedetermined. QC measures for definitive data contain allthe elements associated with screening data, but alsoinclude trip, method, and rinsate blanks; matrix spikes;performance evaluation samples; and replicate analysesfor error determination.
For more details on these data categories, refer to U.S.EPA Data Quality Objectives Process For Superfund,EPA/540/R-93/071, Sept 1993.
4.3 SOURCES OF ERROR
The four most common potential sources of data error inbiological sampling:
! Sampling design! Sampling methodology! Sample heterogeneity! Sample analysis
4.3.1 Sampling Design
The initial selection of a habitat is a potential source ofbias in biological sampling, which might eitherexaggerate or mask the effects of hazardous substances inthe environment. In a representative sampling scheme,habitat characteristics such as plant and animal speciescomposition, substrates, and degree of shading should besimilar at all locations, including the reference location.The same individual should select both the test site andthe control and background site to minimize error incomparing site conditions.
Standardized procedures for habitat assessment andselection also help minimize design error. The selectionof an inappropriate species may introduce an error intothe representative sampling design. This error can beminimized by selecting a species that is representative ofthe habitat and whose life-cycle is compatible with thetiming of the study. In addition, migratory or transientspecies should be avoided.
009071

4.3.2 Sampling Methodology
Sampling methodology and sample handling proceduresmay contain possible sources of error such as uncleansample containers, improper sample handling, andimproper shipment procedures. Procedures for samplecollection and handling should be standardized to allow 4.3.4 Sample Analysiseasier identification of potential error. Follow SOPs orestablished procedures to ensure that all samplingtechniques are performed consistently despite differentsampling teams, dates, or locations. Use QA/QCsamples (Section 4.4) to evaluate errors due to impropersampling methodology and sample handling procedures.These guidelines should apply to biological as well assoil, sediment, and water sampling.
During fishing operations, the sampling crew can preventhabitat disturbance by staying out of the water body nearthe sampling locations. The use of any particulartechnique may introduce judgment error into thesampling regimen if done improperly. For all techniques,sampling should be conducted from the downstreamlocation to the upstream location to avoid contaminationof the upstream stations. Data comparability ismaintained by using similar collection methods andsampling efforts at all stations.
Rapid bioassessments in the field should include twoQA/QC procedures: 1) collection of replicate samples atstations to check on the accuracy of the collection effort,and 2) repeat a portion (typically 10%) recount andreidentification for accuracy.
For tissue analyses, tools and other sampling equipmentshould be dedicated to each sample, or must bedecontaminated between uses. To avoid contamination,sample containers must be compatible with the intendedtissue matrix and analysis.
4.3.3 Sample Heterogeneity
Tissues destined for chemical analysis should behomogenized. Ideally, tissue sample homogenates shouldconsist of organisms of the same species, sex, anddevelopment stage and size since these variables all affect 4.4 QA/QC SAMPLESchemical uptake. There is no universal SOP for tissuehomogenization; specific procedures depend on the sizeand type of the organism. For example, tissues must becut from fur and shell-bearing organisms as they cannotbe practically homogenized as a whole. Homogenizationprocedures may vary by site objective. Tissuehomogenates should be stored away from light and keptfrozen at -20E C. Tissue homogenates are prepared inthe laboratory and could be subject to cross-
contamination.
Refer to U.S. EPA/ERT SOP #1820, TissueHomogenization Procedures for further details on tissuehomogenization procedures.
Analytical procedures may introduce errors fromlaboratory cross-contamination, extraction difficulties,and inappropriate methodology. Fats naturally present intissues may interfere with sample analysis or extractionand elevate detection limits. Detection limits in the tissuesamples must be the same as in the background tissuesamples if a meaningful comparison is to be made. Tominimize this interference, select an extraction ordigestion procedure applicable to tissue samples.
Because many compounds (e.g., chlorinatedhydrocarbons) concentrate in fatty tissues, a percent lipidanalysis is necessary to normalize results among samples.Lipid recoveries vary among different analytical methods;percent lipid results for samples to be normalized andcompared must be generated by the same analyticalmethod. Select a lipid analysis based on the objective ofthe study (see references Herbes and Allen [1983] andBligh and Dyer 1959). Sample results may benormalized on a wet-weight basis. If sample results areto be reported on a dry-weight basis, instruct theanalytical laboratory to report the percent moisturecontent for each sample.
Appropriate sample preservation prevents loss ofcompounds and decomposition of tissues before analysis.Consult the appropriate SOP, analytical method, ordesignated laboratory contact to confirm holding times fortissue samples.
Tissue samples destined for sorting and identification(e.g., benthic macroinvertebrates, voucher fish) should bepreserved in isopropyl or ethyl alcohol, formalin, orKahle's solution. Preservation in these solvents precludesany chemical analysis.
QA/QC samples are collected at the site as prepared bythe laboratory. Analysis of the QA/QC samples providesinformation on the variability and usability of biologicalsampling data, indicates possible field sampling orlaboratory error, and provides a basis for future validationand usability of the analytical data. The most commonfield QA/QC samples are field replicates, reference, andrinsate blank samples. The most common laboratory
009072

QA/QC samples are performance evaluation (PE), matrix variability of the test organism population within eachspike (MS), and matrix spike duplicate (MSD) samples. treatment. This assumes the sample matrix exhibits aQA/QC results may suggest the need for modifying uniform concentration of the contaminants of concernsample collection, preparation, handling, or analytical within each treatment. Large variability may indicate aprocedures if the resultant data do not meet site-specific problem with the test procedures or organisms or lack ofquality assurance objectives. contaminant homogeneity within the sample matrix.
Refer to data validation procedures in U.S. EPA QualityAssurance/Quality Control (QA/QC) Guidance forRemoval Activities, EPA/540/G-90/004, April 1990, forguidelines on utilizing QA/QC samples.
4.4.1 Replicate Samples
Field Replicates
Field replicates for solid media are samples obtainedfrom one sampling point that are homogenized, dividedinto separate containers, and treated as separate samplesthroughout the remaining sample handling and analyticalprocesses. Field replicates for aqueous samples aresamples obtained from one location that are homogenizedand divided into separate containers. There are no "true"field replicates for biological samples, however,biological samples collected from the same station aretypically referred to as replicates. In this case, thebiological replicates are used to determine the variabilityassociated with heterogeneity within a biologicalpopulation. Field replicates may be sent to two or morelaboratories or to the same laboratory as unique samples.
Field replicates may be used to determine total error forcritical samples with contaminant concentrations near thelevel that determines environmental impact. Todetermine error, a minimum of eight replicate samples isrecommended for valid statistical analysis. For total errordetermination, samples should be analyzed by the samelaboratory. The higher detection limit associated withcomposite samples may limit the usefulness of errordetermination.
NOTE: A replicate biological sample may consist ofmore than a single organism in those cases where thespecies mass is less than the mass required by theanalytical procedure to attain required detection limits.This variability in replicate biological samples isindependent of the variability in analytical procedures.
Toxicity Testing Replicates
For sediment samples, at least 3 replicate treatmentsshould be conducted to determine variability betweentests. The function of these replicates is to determine the
Site-Specific Examples of the Use of Replicates
Example No. 1
Two contaminant sources were identified at an activecopper smelting facility. The first area was a slag pilecontaining high levels of copper suspected of migratinginto the surrounding surface runoff pathways,subsequently leaching into the surface water of asurrounding stream system. The second area was thecontaminated creek sediment that was present in thedrainage pathway of the slag pile.
Whole-phase sediment toxicity tests were selected toevaluate the toxicity associated with the copper levels inthe stream sediments. Sediment was collected at eachsampling location (six locations total) to provide thetesting laboratory with sufficient sample volume toperform these evaluations. Ten-day static renewal testsusing the amphipod, Hyalella azteca, and the midge,Chironomus tentans, were chosen. The toxicity testutilized four “replicates” per sampling location (ortreatment), each replicate containing fifteen organisms.The purpose of these replicates was to determine thevariability within the test organism population withineach treatment.
The results reported mean survival for Hyalella azteca inthe contaminated sediment (8 to 50 percent) to besignificantly lower than survival in the uncontaminatedreference sediment (85 percent). Similarly, meansurvival for Chironomus tentans in the contaminatedsediment (0 to 63 percent) was significantly lower thansurvival in the uncontaminated reference sediment (83percent).
Example No. 2
An inactive manufacturing facility had stored its stockcompounds in unprotected piles for a number of years,resulting in DDT contamination of the adjacentwatershed. DDT contamination in a stream locatedadjacent to the site extended from the manufacturingfacility to approximately 27 miles downstream.
A field study was designed to quantitatively determine ifthe levels of DDT in the water and sediment in thisstream were resulting in an adverse ecological impact.
009073

This was accomplished through the examination of A total of 32 mammals were collected at this site.several in situ environmental variables in conjunction Twelve were collected from each on-site area and sixwith laboratory analyses. Water, sediment, and resident were collected from the reference area. All capturedbiota were collected and submitted for various physical mammals were submitted for whole body analysis ofand chemical determinations. Additional sediments were PCBs. Mean PCB concentrations in the mammals weresecured and utilized for toxicity testing with three as follows: on-site areas (1250 and 1340 Fg/kg, wetsurrogate species. Finally, the benthic invertebrate weight); reference area (490 Fg/kg, wet weight). A one-community was sampled and the structure and function of way analysis of variance was conducted on the data setthis segment of the aquatic ecosystem evaluated. treating each animal in an area as a “replicate” (i.e., 12
Benthic invertebrates were collected from three areas at the reference). The results of the statistical analyseseach sampling location (i.e., three “replicates” per indicated that there was a statistically significantlocation) and evaluated for various quantitative difference between on-site and reference area PCB levelscommunity metrics. The purpose of these replicates were in the mammals (p<0.10). Therefore, in this example,to determine the spatial variability in the stream among there were no analytical replicates since each individualthe three areas within each sampling location. mammal was analyzed. However, each mammalCommunity structure, diversity indices, taxonomic represented a statistical replicate within each trappingevenness, an evaluation of the function feeding groups, area.and statistical analyses were performed on the data set.
Qualitative and statistical comparison of the resultsbetween the contaminated areas and the uncontaminatedreference indicated that the benthic invertebratecommunity was adversely affected downstream of the sitecompared to the upstream reference. Taxonomic andfunctional diversity varied inversely with DDT levels insediment and water. These results were furthersubstantiated by the toxicity evaluation results.
Example No. 3
Phase I and II Remedial Investigation and FeasibilityStudies (RIFS) have indicated that the soils surroundingan industrial and municipal waste disposal site werecontaminated with PCBs. A preliminary site surveyrevealed the presence of small mammal habitat andmammal signs in the natural areas adjacent to the site aswell as an area that appeared to be outside of the site’sinfluence (i.e., a potential reference area). A siteinvestigation was subsequently conducted to determinethe levels of PCBs accumulating into the residentmammal community from contact with the PCB-contaminated soil.
Three small mammal trapping areas were identified forthis site. Two areas were located in PCB-contaminatedareas, the third area was a reference. Trapping gridswere established in each area consisting of 100 traps ofvarious design. Six soil samples were also collected fromeach trapping area to characterize the levels of PCBsassociated with the anticipated captured mammals.
replicates from each on-site area and 6 replicates from
4.4.2 Collocated Samples
A collocated sample is collected from an area adjoininga field sample to determine variability of the matrix andcontaminants within a small area of the site. Forexample, collocated samples for chemistry analysis splitfrom the sample collected for the toxicity test arecollected about one-half to three feet away from the fieldsample location. Plants collected from within the samesampling plot may be considered collocated. Collocatedsamples are appropriate for assessing variability only ina small area, and should not be used to assess variabilityacross the entire site or for assessing error.
4.4.3 Reference Samples
Reference biological samples may be taken from areference area outside the influence of the site.Comparison of results from actual samples and samplesfrom the reference area may indicate uptake, bodyburden, or accumulation of chemicals on the site. Thereference area should be close to the site. It should havehabitats, size and terrain similar to the site underinvestigation. The reference site need not be pristine.Biological reference samples should be of the samespecies, sex, and developmental stage as the field sitesample.
4.4.4 Rinsate Blank Samples
A rinsate blank is used to assess cross-contaminationfrom improper equipment decontamination procedures.Rinsate blanks are samples obtained by running analyte-free water over decontaminated sampling equipment.Any residual contamination should appear in the rinsate
009074

data. Analyze the rinsate blank for the same analytical preparation, reagents, and analytical methods as the fieldparameters as the field samples collected that day. When samples. LCS results can show bias and/or variability indedicated cutting tools or other sampling equipment are analytical results.not used, collect one rinsate blank per device per day.
4.4.5 Field Blank Samples
Field blanks are samples prepared in the field usingcertified clean water or sand that are then submitted to thelaboratory for analysis. A field blank is used to evaluatecontamination or error associated with samplingmethodology, preservation, handling/shipping, andlaboratory procedures. If appropriate for the test, submitone field blank per day.
4.4.6 Trip Blank Samples
Trip blanks are samples prepared prior to going into thefield. They consist of certified clean water or sand, andthey are not opened until they reach the laboratory. Usetrip blanks when samples are being analyzed for volatileorganics. Handle, transport, and analyze trip blanks inthe same manner as the other volatile organic samplescollected that day. Trip blanks are used to evaluate errorassociated with sampling methodology, shipping andhandling, and analytical procedures, since any volatileorganic contamination of a trip blank would have to beintroduced during one of those procedures.
4.4.7 Performance Evaluation /Laboratory Control Samples
A performance evaluation (PE) sample evaluates theoverall error from the analytical laboratory and detectsany bias in the analytical method being used. PE samplescontain known quantities of target analytes manufacturedunder strict quality control. They are usually prepared bya third party under a U.S. EPA certification program.The samples are usually submitted "blind" to analyticallaboratories (the sampling team knows the contents of thesamples, but the laboratory does not). Laboratoryanalytical error (usually bias) may be evaluated by thepercent recoveries and correct identification of thecomponents in the PE sample.
4.4.8 Controls
Analytical Laboratory Control Samples
A chemical analytical laboratory control sample (LCS)contains quantities of target analytes known to thelaboratory and are used to monitor "controlled"conditions. LCSs are analyzed under the same sample
Toxicity Testing Control Groups
In toxicity tests, a laboratory reference toxicant treatmentand a control treatment are both typically utilized inaddition to a site reference treatment. This test involvesexposing the test organism population to a standardizedreference toxicant at a standardized dose, then comparingthe response to historical laboratory records for thatculture. The mortality results of the newly conductedreference toxicant test should be similar to the historicalresults. This is conducted to reveal if the generation(s) inthe present culture is viable for use in the toxicity test, orif the culture has grown resistant or intolerant to thetoxicant over time. Therefore, a laboratory referencetoxicant test should be conducted prior to the testing ofthe site matrices.
In contrast, a laboratory control test is conductedsimultaneously with the testing of the site matrices. Thistreatment identifies mortality factors that are unrelated tosite contaminants. This is accomplished by exposing thetest organism population to a clean dilution water and/ora clean laboratory substrate.
4.4.9 Matrix Spike/Matrix SpikeDuplicate Samples
Matrix spike and matrix spike duplicate samples(MS/MSDs) are supplemental volumes of field-collectedsamples that are spiked in the laboratory with a knownconcentration of a target analyte to determine matrixinterference. Matrix interference is determined as afunction of the percent analyte recovery in the sampleextraction. The percent recovery from MS/MSDsindicates the degree to which matrix interferences willaffect the identification and/or quantitation of a substance.MS/MSDs can also be used to monitor laboratoryperformance. When two or more pairs of MS/MSDs areanalyzed, the data obtained may also be used to evaluateerror due to laboratory bias and precision. Analyze oneMS/MSD pair to assess bias for every 10 samples, anduse the average percent recovery for the pair. To assessprecision, analyze at least eight matrix spike replicatesfrom the same sample, and determine the standarddeviation and the coefficient of variation. See the U.S.EPA Quality Assurance/ Quality Control (QA/QC)Guidance for Removal Activities (April 1990) fordirections on calculating analytical error.
MS/MSDs are a required QA/QC element of the
009075

definitive data objectives. MS/MSDs should accompany April 1990. Validation of organic data may require anevery 10 samples. Since the MS/MSDs are spiked field experienced chemist due to complexity of tissue analysis.samples, sufficient volume for three separate analysesmust be provided. Organic analysis of tissue samples isfrequently subject to matrix interferences which causesbiased analytical results. Matrix spike recoveries areoften low or show poor precision in tissue samples. Thematrix interferences will be evident in the matrix spikeresults. Although metals analysis of tissue samples isusually not subject to these interferences, MS/MSDsamples should be utilized to monitor method andlaboratory performance. Some analytical parameterssuch as percent lipids, organic carbon, and particle-sizedistribution are exempt from MS/MSD analyses.
4.4.10 Laboratory DuplicateSamples
A laboratory duplicate is a sample that undergoespreparation and analysis twice. The laboratory takes twoaliquots of one sample and treats them as if they wereseparate samples. Comparison of data from the twoanalyses provides a measure of analytical reproducibilitywithin a sample set. Discrepancies in duplicate analysesmay indicate poor homogenization in the field or othersample preparation error, whether in the field or in thelaboratory. However, duplicate analyses are not possiblewith most tissue samples unless a homogenate of thesample is created.
4.5 DATA EVALUATION
4.5.1 Evaluation of Analytical Error
Analytical error becomes significant in decision-makingas sample results approach the level of environmentalimpact. The acceptable level of error is determined bythe intended use of the data and litigation concerns. Tobe definitive, analytical data must have quantitativemeasurement of analytical error with PE samples andreplicates. The QA samples identified in this section canindicate a variety of qualitative and quantitative samplingerrors. Due to matrix interferences, causes of error maybe difficult to determine in organic analysis of tissuesamples.
4.5.2 Data Validation
Data from tissue sample analysis may be validatedaccording to the Contract Laboratory Program NationalFunctional Guidelines (U.S. EPA 1994) and according toU.S. EPA Quality Assurance/Quality Control (QA/QC)Guidance for Removal Activities, EPA/540/G-90/004,
009076

5.0 DATA ANALYSIS AND INTERPRETATION
5.1 INTRODUCTION
The main objective of biological surveys conducted atSuperfund sites is the assessment of site-related threat oreffect. For many types of biological data (e.g., levels ofcontaminants in organisms collected on site and from areference location), hypotheses are tested to determinethe presence or absence of an effect. For some biologicaltests (e.g., benthic macroinvertebrate studies, toxicitytests), the data analysis and interpretation process is Large data sets are often summarized using a fewoutlined in existing documents (U.S. EPA November descriptive statistics. Two important features of a set of1990, U.S. EPA May 1996). For many Superfund data are the central tendency and the spread. Statisticsecological assessments, a weight-of-evidence approach used to describe central tendency include the arithmeticis used to interpret the results of different studies or tests mean, median, mode and geometric mean. Spread orconducted at a site. dispersion in a data set refers to the variability in the
The statistical tests and methods that will be employed Statistics used to describe data dispersion include rangeshould be based on the objective of the data evaluation. and standard deviation. Methods for calculatingThese components should be outlined in the Work Plan descriptive statistics can be found in any statisticsor Sampling and Analysis Plan. This process will help textbook, and many software programs are available forfocus the study to ensure that the appropriate type and statistical calculations.number of samples are collected.
5.2 DATA PRESENTATION ANDANALYSIS
5.2.1 Data Presentation Techniques
In many cases, before descriptive statistics are calculatedfrom a data set, it is useful to try various graphicaldisplays of the raw data. The graphical displays helpguide the choice of any necessary transformations of thedata set and the selection of appropriate statistics tosummarize the data. Since most statistical proceduresrequire summary statistics calculated from a data set, it isimportant that the summary statistics represent the entiredata set. For example, the median may be a moreappropriate measure of central tendency than the meanfor a data set that contains outliers. Graphical display ofa data set could indicate the need to log transform data sothat symmetry indicates a normal distribution. Four of themost useful graphical techniques are described next.
A histogram is a bar graph that displays the distributionof a data set, and provides information regarding thelocation of the center of the sample, amount of dispersion,extent of symmetry, and existence of outliers. Stem andleaf plots are similar to histograms in that they provideinformation on the distribution of a data set; however theyalso contain information on the numeric values in the data
set. Box and whisker plots can be used to compare twoor more samples of the same characteristic (e.g., streamIBI values for two or more years). Scatter plots are auseful method for examining the relationship betweentwo sets of variables. Figure 4 illustrates the four graphtechniques described previously.
5.2.2 Descriptive Statistics
observations about the center of the distribution.
5.2.3 Hypothesis Testing
Biological studies are conducted at Superfund sites todetermine adverse effects due to site-related factors. Formany types of biological data, hypothesis testing is thestatistical procedure used to evaluate data. Hypothesistesting involves statistically evaluating a parameter ofconcern, such as the mean or median, at a specifiedprobability for incorrectly interpreting the analysisresults. In conventional statistical analysis, hypothesistesting for a trend or effect is based on a null hypothesis.Typically, the null hypothesis is presumed when there isno trend or effect present. To test this hypothesis, dataare collected to estimate an effect. The data are used toprovide a sample estimate of a test statistic, and a tablefor the test statistic is consulted to determine how unlikelythe observed value of the statistic is if the null hypothesisis true. If the observed value of the test statistic isunlikely, the null hypothesis is rejected. In ecological riskassessment, a hypothesis is a question about therelationship among assessment endpoints and theirpredicted responses when exposed to contaminants. Themost basic hypothesis that is applicable to virtually allSuperfund sites is that site-related contaminants arecausing adverse effects of the assessment endpoint(s).
009077

A) Histogram
D) Scatter Plot
B) Leaf Plot
C) Whisker Plot
Figure 3 Illustrations of Sample Plots
IBI DATA
12 25 33 5612 24 34 5814 26 3515 24 3616 24 3522 27 3824 23 4123 28 42
009078

5.3 DATA INTERPRETATION
5.3.1 Chemical Residue Studies
Chemical residue data may be evaluated in two ways.First, the contaminant concentrations by themselvesprovide evidence of bioaccumulation and probable foodchain transfer of the contaminants, and an overall pictureof the distribution of contaminants in the biologicalcommunity. Second, the residue data may be evaluatedagainst literature residue values that are known to causeno effect or an adverse effect in the organism.
5.3.2 P o p u l a t i o n / C o m m u n i t yStudies
The interpretation of population/community data isextensive, therefore, the reader is referred to a detailedtreatment in U.S. EPA (November 1990), U.S. EPA(1989a), Karr et al. (1986), and other literature.
5.3.3 Toxicity Testing
Measurement endpoints obtained in toxicity tests aregenerally compared to results from a laboratory controland a reference location sample to determine whetherstatistically significant differences exist. If significanteffects (e.g., mortality, decreased reproduction) areobserved, additional statistical analyses can be run todetermine whether observed effects correlate withmeasured contaminant levels. The reader is referred to adetailed treatment in ASTM (1992), U.S. EPA (May1988), U.S. EPA (March 1989b).
5.3.4 Risk Calculation
Preliminary screening value results are interpreted bycomparison of historical and/or new site analytical dataagainst literature toxicity values. This comparison willsuggest if the probability of risk exists and whetheradditional evaluation is desired.
If the evaluation is pursued to an ecological riskassessment, mathematical models, such as the HazardQuotient method, are used to evaluate the site dataagainst literature toxicity values. Based on the type ofmodel used, the results can be extrapolated to suggest thepresence of ecological risk.
009079
APPENDIX A - CHECKLIST FOR ECOLOGICAL ASSESSMENT/SAMPLING
Introduction
The checklist that follows provides guidance in making observations for an ecological assessment. It is not intended forlimited or emergency response actions (e.g., removal of a few drums) or for purely industrial settings with no discharges.The checklist is a screening tool for preliminary site evaluation and may also be useful in planning more extensive siteinvestigations. It must be completed as thoroughly as time allows. The results of the checklist will serve as a starting pointfor the collection of appropriate biological data to be used in developing a response action. It is recognized that certainquestions in this checklist are not universally applicable and that site-specific conditions will influence interpretation.Therefore, a site synopsis is requested to facilitate final review of the checklist by a trained ecologist.
Checklist
The checklist has been divided into sections that correspond to data collection methods and ecosystem types. These sectionsare:
I. Site Description
IA. Summary of Observations and Site Setting
II. Terrestrial Habitat Checklist
IIA. Wooded IIB. Shrub/Scrub IIC. Open Field IID. Miscellaneous
III. Aquatic Habitat Checklist -- Non-Flowing Systems
IV. Aquatic Habitat Checklist -- Flowing Systems
V. Wetlands Habitat Checklist
009080

Checklist for Ecological Assessment/Sampling
I. SITE DESCRIPTION
1. Site Name: ____________________________________________________
Location: ____________________________________________________
_______________________________________________________________
County:___________________________City:_______________________State:_______________________
2. Latitude: _______________________ Longitude: _________________
3. What is the approximate area of the site? __________________________________________
4. Is this the first site visit? ~ yes ~ no If no, attach trip report of previous site visit(s), if available.
Date(s) of previous site visit(s):________________________________________.
5. Please attach to the checklist USGS topographic map(s) of the site, if available.
6. Are aerial or other site photographs available? ~ yes ~ no If yes, please attach any available photo(s) to the sitemap at the conclusion of this section.
009081

7. The land use on the site is: The area surrounding the site is: ____________________ mile radius
_____% Urban _____% Urban
_____% Rural _____% Rural
_____% Residential _____% Residential
_____% Industrial (~ light ~ heavy) _____% Industrial (~ light ~ heavy)
_____% Agricultural _____% Agricultural
(Crops:______________________________) (Crops:______________________________)
_____% Recreational _____% Recreational
(Describe; note if it is a park, etc.) (Describe; note if it is a park, etc.)
________________________________________ ______________________________
________________________________________ ______________________________
_____% Undisturbed _____% Undisturbed
_____% Other _____% Other
8. Has any movement of soil taken place at the site? ~ yes ~ no. If yes, please identify the most likely cause of thisdisturbance:
_____ Agricultural Use _____ Heavy Equipment _____ Mining
_____ Natural Events _____ Erosion _____ Other
Please describe:
009082

9. Do any potentially sensitive environmental areas exist adjacent to or in proximity to the site, e.g., Federal and Stateparks, National and State monuments, wetlands, prairie potholes? Remember, flood plains and wetlands are notalways obvious; do not answer "no" without confirming information.
Please provide the source(s) of information used to identify these sensitive areas, and indicate their general locationon the site map.
10. What type of facility is located at the site?
~ Chemical ~ Manufacturing ~ Mixing ~ Waste disposal
~ Other (specify)_____________________________________________________
11. What are the suspected contaminants of concern at the site? If known, what are the maximum concentration levels?
12. Check any potential routes of off-site migration of contaminants observed at the site:
~ Swales ~ Depressions ~ Drainage ditches
~ Runoff ~ Windblown particulates ~ Vehicular traffic
~ Other (specify)__________________________________________________________________
13. If known, what is the approximate depth to the water table?_________________________________
14. Is the direction of surface runoff apparent from site observations? ~ yes ~ no If yes, to which of the followingdoes the surface runoff discharge? Indicate all that apply.
~ Surface water ~ Groundwater ~ Sewer ~ Collection impoundment
15. Is there a navigable waterbody or tributary to a navigable waterbody? ~ yes ~ no
009083

16. Is there a waterbody anywhere on or in the vicinity of the site? If yes, also complete Section III: Aquatic HabitatChecklist -- Non-Flowing Systems and/or Section IV: Aquatic Habitat Checklist -- Flowing Systems.
~ yes (approx. distance____________________) ~ no
17. Is there evidence of flooding? ~ yes ~ no Wetlands and flood plains are not always obvious; do not answer "no"without confirming information. If yes, complete Section V: Wetland Habitat Checklist.
18. If a field guide was used to aid any of the identifications, please provide a reference. Also, estimate the time spentidentifying fauna. [Use a blank sheet if additional space is needed for text.]
19. Are any threatened and/or endangered species (plant or animal) known to inhabit the area of the site? ~ yes ~ no If yes, you are required to verify this information with the U.S. Fish and Wildlife Service. If species' identities areknown, please list them next.
20. Record weather conditions at the time this checklist was prepared:
DATE:____________________
______________ Temperature (EC/EF) ______________ Normal daily high temperature
______________ Wind (direction/speed) ______________ Precipitation (rain, snow)
______________ Cloud cover
009084

IA. SUMMARY OF OBSERVATIONS AND SITE SETTING
Completed by___________________________________________________ Affiliation_________________
Additional Preparers_________________________________________________________________________
Site Manager_________________________________________________________________________________
Date________________________
009085

II. TERRESTRIAL HABITAT CHECKLIST
IIA. WOODED
1. Are there any wooded areas at the site? ~ yes ~ no If no, go to Section IIB: Shrub/Scrub.
2. What percentage or area of the site is wooded? (_____% _____ acres). Indicate the wooded area on the site mapwhich is attached to a copy of this checklist. Please identify what information was used to determine the woodedarea of the site.
3. What is the dominant type of vegetation in the wooded area? (Circle one: Evergreen/Deciduous/ Mixed) Provide aphotograph, if available.
Dominant plant, if known:________________________________________
4. What is the predominant size of the trees at the site? Use diameter at breast height.
~ 0-6 in. ~ 6-12 in. ~ > 12 in.
5. Specify type of understory present, if known. Provide a photograph, if available.
IIB. SHRUB/SCRUB
1. Is shrub/scrub vegetation present at the site? ~ yes ~ no If no, go to Section IIC: Open Field.
2. What percentage of the site is covered by scrub/shrub vegetation? ( _____% _____ acres). Indicate the areas ofshrub/scrub on the site map. Please identify what information was used to determine this area.
3. What is the dominant type of scrub/shrub vegetation, if known? Provide a photograph, if available.
4. What is the approximate average height of the scrub/shrub vegetation?
~ 0-2 ft. ~ 2-5 ft. ~ > 5 ft.
009086

5. Based on site observations, how dense is the scrub/shrub vegetation?
~ Dense ~ Patchy ~ Sparse
IIC. OPEN FIELD
1. Are there open (bare, barren) field areas present at the site? ~ yes ~ no If yes, pleaseindicate the type below:
~ Prairie/plains ~ Savannah ~ Old field ~ Other (specify)____________________
2. What percentage of the site is open field? ( _____% _____ acres). Indicate the open fields on the site map.
3. What is/are the dominant plant(s)? Provide a photograph, if available.
4. What is the approximate average height of the dominant plant?____________________
5. Describe the vegetation cover: ~ Dense ~ Sparse ~ Patchy
IID. MISCELLANEOUS
1. Are other types of terrestrial habitats present at the site, other than woods, scrub/shrub, and open field? ~ yes ~ no If yes, identify and describe them below.
2. Describe the terrestrial miscellaneous habitat(s) and identify these area(s) on the site map.
009087

3. What observations, if any, were made at the site regarding the presence and/or absence of insects, fish, birds,mammals, etc.?
4. Review the questions in Section I to determine if any additional habitat checklists should be completed for this site.
009088

III. AQUATIC HABITAT CHECKLIST -- NON-FLOWING SYSTEMS
Note: Aquatic systems are often associated with wetland habitats. Please refer to Section V, Wetland HabitatChecklist.
1. What type of open-water, non-flowing system is present at the site?
~ Natural (pond, lake)~ Artificially created (lagoon, reservoir, canal, impoundment)
2. If known, what is the name(s) of the waterbody(ies) on or adjacent to the site?
_______________________________________________________________________________
3. If a waterbody is present, what are its known uses (e.g.: recreation, navigation, etc.)?
4. What is the approximate size of the waterbody(ies)? ______________ acre(s).
5. Is any aquatic vegetation present? ~ yes ~ no If yes, please identify the type of vegetation present if known.
~ Emergent ~ Submergent ~ Floating
6. If known, what is the depth of the water? ______________________________________________
7. What is the general composition of the substrate? Check all that apply.
~ Bedrock ~ Sand (coarse) ~ Muck (fine/black)
~ Boulder (>10 in.) ~ Silt (fine) ~ Debris
~ Cobble (2.5-10 in.) ~ Marl (shells) ~ Detritus
~ Gravel (0.1-2.5 in.) ~ Clay (slick) ~ Concrete
~ Other (specify)____________________________________________________________
8. What is the source of water in the waterbody?
~ River/Stream/Creek ~ Groundwater ~ Other (specify)____________________
~ Industrial discharge ~ Surface runoff
009089

9. Is there a discharge from the site to the waterbody? ~ yes ~ no If yes, please describe this discharge and its path.
10. Is there a discharge from the waterbody? ~ yes ~ no If yes, and the information is available, identify from the listbelow the environment into which the waterbody discharges.
~ River/Stream/Creek ~ onsite ~ offsite Distance____________________
~ Groundwater ~ onsite ~ offsite
~ Wetland ~ onsite ~ offsite Distance____________________
~ Impoundment ~ onsite ~ offsite
11. Identify any field measurements and observations of water quality that were made. For those parameters for whichdata were collected provide the measurement and the units of measure below:
_________ Area
__________ Depth (average)
_________ Temperature (depth of the water at which the reading was taken) ____________
__________ pH
__________ Dissolved oxygen
__________ Salinity
__________ Turbidity (clear, slightly turbid, turbid, opaque) (Secchi disk depth ___________ )
__________ Other (specify)
12. Describe observed color and area of coloration.
13. Mark the open-water, non-flowing system on the site map attached to this checklist.
009090

14. What observations, if any, were made at the waterbody regarding the presence and/or absence of benthicmacroinvertebrates, fish, birds, mammals, etc.?
009091

IV. AQUATIC HABITAT CHECKLIST -- FLOWING SYSTEMS
Note: Aquatic systems are often associated with wetland habitats. Please refer to Section V, Wetland HabitatChecklist.
1. What type(s) of flowing water system(s) is (are) present at the site?
~ River ~ Stream ~ Creek~ Dry wash ~ Arroyo ~ Brook~ Artificially ~ Intermittent Stream ~ Channeling created ~ Other (specify)____________________ (ditch, etc.)
2. If known, what is the name of the waterbody?______________________________________
3. For natural systems, are there any indicators of physical alteration (e.g., channeling, debris, etc.)?~ yes ~ no If yes, please describe indicators that were observed.
4. What is the general composition of the substrate? Check all that apply.
~ Bedrock ~ Sand (coarse) ~ Muck ( fine/black)
~ Boulder (>10 in.) ~ Silt (fine) ~ Debris
~ Cobble (2.5-10 in.) ~ Marl (shells) ~ Detritus
~ Gravel (0.1-2.5 in.) ~ Clay (slick) ~ Concrete
~ Other (specify)____________________
5. What is the condition of the bank (e.g., height, slope, extent of vegetative cover)?
6. Is the system influenced by tides? ~ yes ~ no What information was used to make this determination?
009092

7. Is the flow intermittent? ~ yes ~ no If yes, please note the information that was used in making this determination.
8. Is there a discharge from the site to the waterbody? ~ yes ~ no If yes, please describe the discharge and its path.
9. Is there a discharge from the waterbody? ~ yes ~ no If yes, and the information is available, please identify whatthe waterbody discharges to and whether the discharge is on site or off site.
10. Identify any field measurements and observations of water quality that were made. For those parameters for whichdata were collected, provide the measurement and the units of measure in the appropriate space below:
_____ Width (ft.)
_____ Depth (ft.)
_____ Velocity (specify units):_________________________
_____ Temperature (depth of the water at which the reading was taken_________________)
_____ pH
_____ Dissolved oxygen
_____ Salinity
_____ Turbidity (clear, slightly turbid, turbid, opaque)(Secchi disk depth _______________)
_____ Other (specify)________________________________________
009093

11. Describe observed color and area of coloration.
12. Is any aquatic vegetation present? ~ yes ~ no If yes, please identify the type of vegetation present, if known.
~ Emergent ~ Submergent ~ Floating
13. Mark the flowing water system on the attached site map.
14. What observations were made at the waterbody regarding the presence and/or absence of benthicmacroinvertebrates, fish, birds, mammals, etc.?
009094
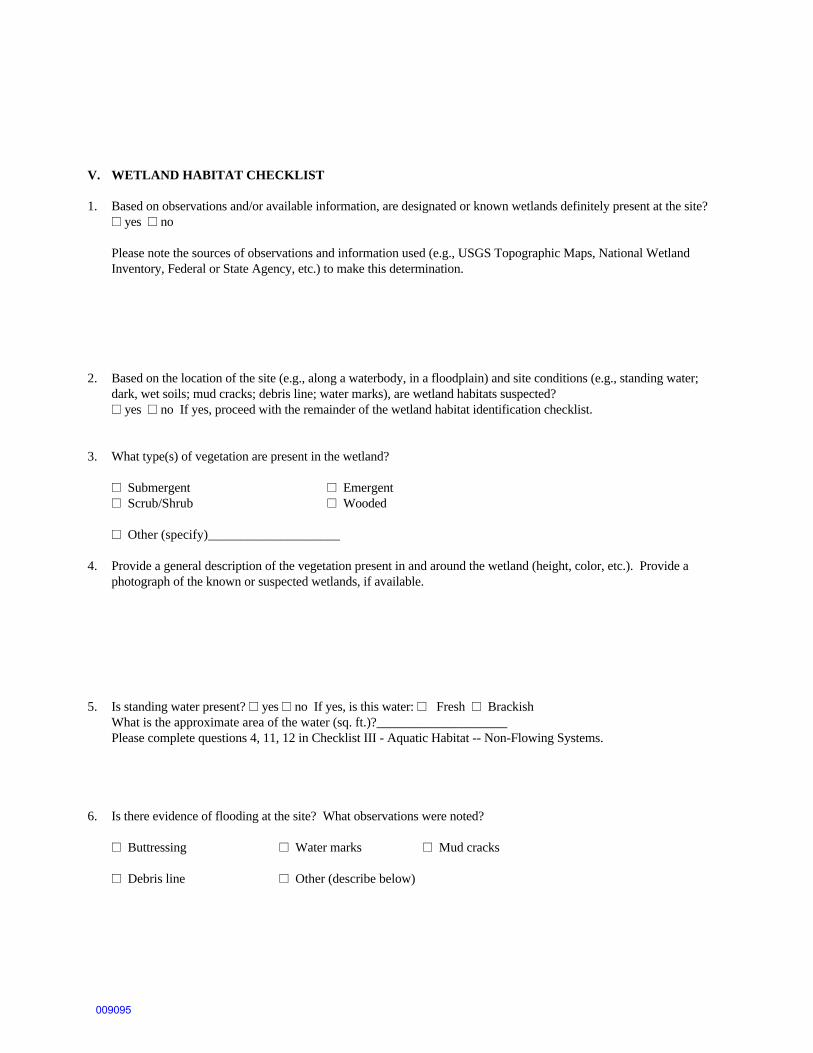
V. WETLAND HABITAT CHECKLIST
1. Based on observations and/or available information, are designated or known wetlands definitely present at the site? ~ yes ~ no
Please note the sources of observations and information used (e.g., USGS Topographic Maps, National WetlandInventory, Federal or State Agency, etc.) to make this determination.
2. Based on the location of the site (e.g., along a waterbody, in a floodplain) and site conditions (e.g., standing water;dark, wet soils; mud cracks; debris line; water marks), are wetland habitats suspected? ~ yes ~ no If yes, proceed with the remainder of the wetland habitat identification checklist.
3. What type(s) of vegetation are present in the wetland?
~ Submergent ~ Emergent~ Scrub/Shrub ~ Wooded
~ Other (specify)____________________
4. Provide a general description of the vegetation present in and around the wetland (height, color, etc.). Provide aphotograph of the known or suspected wetlands, if available.
5. Is standing water present? ~ yes ~ no If yes, is this water: ~ Fresh ~ BrackishWhat is the approximate area of the water (sq. ft.)?____________________Please complete questions 4, 11, 12 in Checklist III - Aquatic Habitat -- Non-Flowing Systems.
6. Is there evidence of flooding at the site? What observations were noted?
~ Buttressing ~ Water marks ~ Mud cracks
~ Debris line ~ Other (describe below)
009095

7. If known, what is the source of the water in the wetland?
~ Stream/River/Creek/Lake/Pond ~ Groundwater
~ Flooding ~ Surface Runoff
8. Is there a discharge from the site to a known or suspected wetland? ~ yes ~ no If yes, please describe.
9. Is there a discharge from the wetland? ~ yes ~ no. If yes, to what waterbody is discharge released?
~ Surface Stream/River ~ Groundwater ~ Lake/Pond ~ Marine
10. If a soil sample was collected, describe the appearance of the soil in the wetland area. Circle or write in the bestresponse.
Color (blue/gray, brown, black, mottled) __________________________________________
Water content (dry, wet, saturated/unsaturated) __________________________
11. Mark the observed wetland area(s) on the attached site map.
009096

APPENDIX B -- Example of Flow Diagram For Conceptual Site Model
Figure B-1
009097

Figure B-2
009098

Figure B-3
009099

APPENDIX C - EXAMPLE SITES
Example sites are presented in this document to demonstrate how information from the checklist for ecologicalassessment/sampling is used in conjunction with representative biological sampling to meet the study objectives. Ageneral history for each site is presented first, then additional preliminary information
I. SITE HISTORIES
Site A -- Copper Site
This is a former municipal landfill located in an upland area of the mid-Atlantic plain. Residential, commercial, andindustrial refuse were disposed at the site from 1961 to 1980. Large amounts of copper wire were also disposed at thissite. Minimal grass cover has been placed over the fill. Terrestrial ecosystems in the vicinity of the landfill includeupland forest, successional fields, agricultural land, and residential and commercial areas. The surface of the landfill hasdeteriorated in several locations. Leachate seeps have been noted on the slope of the landfill, several of which dischargeto a 5-acre pond down-gradient of the site.
Site B -- Stream DDT Site
This is a former chemical production facility located adjacent to a stream. The facility manufactured and packageddichlorodiphenyltrichloroethane (DDT). Due to poor storage practices, several DDT spills have occurred.
Site C -- Terrestrial PCB Site
This site is a former waste oil recycling facility located in a remote area. Oils contaminated with polychlorinatedbiphenyl compounds (PCBs) were disposed in a lagoon. The lagoon is not lined and the substrate is composed mostly ofsand. Oils contaminated with PCBs have migrated through the soil and contaminated a wide area adjacent to the site.
II. USE OF THE CHECKLIST FOR ECOLOGICAL ASSESSMENT/SAMPLING
Site A -- Copper Site
A preliminary site visit was conducted, and the checklist indicated the following: 1) the pond has an organic substrate,2) emergent vegetation including cattail and Phragmites occurs along the shore near the leachate seeps, and 3) the pondreaches a depth of five feet toward the middle. Several species of sunfish, minnows, and carp were observed. A diversebenthic macroinvertebrate community also has been noted in the pond. The pond appears to function as a valuablehabitat for fish and other wildlife.
Preliminary sampling indicated elevated copper levels in the seep as well as elevated base cations, total organic carbon(TOC), and depressed pH levels (pH 5.7).
Copper can cause toxic effects in both aquatic plants and invertebrates at relatively low water concentrations, therebyaffecting the pond's ability to support macroinvertebrate and fish communities, as well as the wildlife that feed at thepond. Terrestrial ecosystems do not need to be evaluated because the overland flow of the seeps is limited to shortgullies. Thus, the area of concern has been identified as the 5-acre pond and the associated leachate seeps.
A review of the literature on the ecotoxicity of copper to aquatic biota and plants, both algae and vascular, wasconducted. In general it was found that young organisms are more sensitive to copper with decreasing sensitivity asbody weight increases. The toxicity of copper in water is influenced by water hardness, alkalinity, and pH.
009100

Site B -- Stream DDT Site
The ecological checklist was completed as part of the preliminary site visit. The information gathered indicates thatsurface water drainage from the site flows through several drainage swales toward a small unnamed creek. This creek isa second order stream containing riffle-run areas and small pools. The stream substrate is composed of sand and gravelin the pools with some small depositional areas in the backwater areas, and primarily cobble in the riffles. Previoussampling efforts have indicated the presence of DDT and its metabolites in the stream sediments at a concentration of230 milligrams per kilogram (mg/kg). A variety of wildlife, especially piscivorous birds, utilize this area for feeding. Many species of minnow have been noted in this stream. DDT is well known for its tendency to bioaccumulate andbiomagnify in food chains, and available evidence indicates that it can cause reproductive failure in birds due to eggshellthinning.
In freshwater systems, DDT can have direct effects on animals, particularly insects. A literature review of the aquatictoxicity of DDT was conducted, and a no observed adverse effects level (NOAEL) was identified for aquatic insects. Aquatic plants are not affected by DDT. Additional information on the effects of DDT on birds identified decreasedreproductive success due to eggshell thinning.
Site C -- Terrestrial PCB Site
During a preliminary site visit, the ecological checklist was completed. Most of the habitat is upland forest, old field,and successional terrestrial areas. Biological surveys at this site have noted a variety of small mammals, and red-tailedhawks were also observed. The area of concern has been identified as the 10-acre area surrounding the site. PCBs havebeen shown to reduce reproductive success in mammals or target liver functions. PCBs are not highly volatile, soinhalation of PCBs would not be an important exposure pathway. However, PCBs have been shown to biomagnifyindicating that the ingestion exposure route needs evaluation. Shrews and/or voles would be appropriate mammalianreceptors to evaluate for this exposure route. Potential reproductive effects on predators that feed on small mammalswould also be important to evaluate. The literature has indicated that exposure to PCBs through the food chain cancause chronic toxicity to predatory birds.
Limited information was available on the effects of PCBs to red-tailed hawks. Studies on comparable species haveindicated decreased sperm concentration that may affect reproductive success.
III. CONCEPTUAL SITE MODEL FORMULATION
Site A -- Copper Site
The assessment endpoint for this site was identified as the maintenance of pond fish and invertebrate communitycomposition similar to that of other ponds in the area of similar size and characteristics. Benthic macroinvertebratecommunity studies may be relatively labor-intensive and potentially an insensitive measure in this type of system. Measuring the fish community would also be unsuitable due to the limited size of the pond and the expected lowdiversity of fish species. In addition, copper is not strongly food-chain transferrable. Therefore, direct toxicity testingwas selected as an appropriate measurement endpoint. Toxicity was defined as a statistically significant decrease insurvival or juvenile growth rates in a population exposed to water or sediments, as compared to a population from thereference sites.
One toxicity test selected was a 10-day solid-phase sediment toxicity test using early life-stage Hyalella azteca. Themeasurement endpoints for the test are mortality and growth rates (measured as length and weight changes). Two water-column toxicity tests were selected: a 7-day test using the alga Selenastrum capricornutum (growth test) and a 7-daylarval fish test using Pimephales promelas (mortality and growth endpoints).
009101

Five sediment samples were collected from the pond bottom at intervals along an identified concentration gradient. Reference sediment was also collected. A laboratory control was utilized in addition to the reference sediment in thistoxicity test. The study design specified that sediment for the toxicity tests was collected from the leachate seeps knownto be at the pond edge, and from four additional locations transecting the pond at equidistance locations. A pre-samplingvisit was required to confirm that the seep was flowing due to the intermittent nature of leachate seeps.
Site B -- Stream DDT Site
A conceptual model was developed to evaluate the environmental pathways for DDT that could result in ecologicalimpacts. DDT in the sediments can be released to the water column during natural resuspension and redistribution ofthe sediments. Some diffusion of DDT to the water column from the sediment surface may also occur. The benthicmacroinvertebrate community would be an initial receptor for the DDT in sediments. Fish that feed on the benthicmacroinvertebrates could be exposed to the DDT both in the water column and in their food. Piscivorous birds wouldbe exposed to the DDT that has accumulated in the fish. For example, belted kingfishers are known to feed in thestream. Given the natural history of this species, it is possible that they forage entirely in the contaminated area. Fromthis information, the assessment endpoint was identified to be the protection of piscivorous birds from eggshell thinningdue to DDT exposure. From this assessment endpoint, eggshell thinning in the belted kingfisher was selected as themeasurement endpoint.
Existing information identified a DDT gradient in the stream sediments. Forage fish (e.g., creek chub) were selected tomeasure exposure levels for kingfishers. The study design for measuring DDT residue levels specified that 10 creekchub of the same size and sex will be collected at each location for chemical residue analysis. Although analytical datafor the stream sediment exists, new co-located sediment samples were specified to be collected to provide a strongerlink between the present state of contamination in the sediment and in the fish.
Site C -- Terrestrial PCB Site
A conceptual model was prepared to determine the exposure pathways by which predatory birds could be exposed toPCBs originating in the soil at the site. The prey of red-tailed hawks includes voles, deer mice, and various insects. Voles are herbivorous and prevalent at the site. However, PCBs do not strongly accumulate in plants, thus voles maynot represent a strong exposure pathway to hawks. Deer mice are omnivorous and may be more likely than voles to beexposed to PCBs. The assessment endpoint for this site was identified to be the protection of reproductive success inhigh trophic level species exposed to PCBs via diet.
Initially, a sampling feasibility study was conducted to confirm sufficient numbers of the deer mice. Two survey lines of10 live traps were set for deer mice in the area believed to contain the desired concentration gradient for the studydesign. Previous information indicated a gradient of decreasing PCB concentration with increasing distance from theunlined lagoon. Three locations were selected along this gradient to measure PCB concentrations in prey. Co-locatedsoil and water samples were also collected. The analytical results of these matrices were utilized as variables in a foodchain accumulation model which predicted the amount of contaminant in the environment that may travel through thefood chain, ultimately to the red-tailed hawk.
009102

REFERENCES
ASTM. 1992. Standard Guide for Conducting Early Life-Stage Toxicity Tests with Fishes. American Society for Testing and Materials. E1241-92.
Bligh, E.G., W.J. Dyer. 1959. Lipid Extraction and Purification. Canadian Journal of Biochemistry and Physiology. Vol37. pp. 912-917
Brungs, W.A. and D.I. Mount. 1978. Introduction to a Discussion of the Use of Aquatic Toxicity Tests for Evaluation of the Effects of Toxic Substances. Cairns, J. Jr., K.L. Dickson and A.W. Makei (eds.) Estimating the Hazard of Chemical Substances to Aquatic Life. ASTM 657. Amer. Soc. Test. Materials, Philadelphia, PA. p. 1526.
Green, J.C., C.L. Bartels, W.J. Warren-Hicks, B.R. Parkhurst, G.L. Linder, S.A. Peterson, and W.E. Meiller. 1989. Protocol for Short Term Toxicity Screening of Hazardous Waste. U.S. Environmental Protection Agency, Environmental Research Laboratory, Corvallis, OR. EPA 600/3-88/029.
Hair, J.D. 1980. Measurement of ecological diversity. in S.D. Schemnitz, ed. Wildlife Management Techniques Manual. Fourth Edition. The Wildlife Society, Washington, D.C. pp269-275.
Hayes, M.L. 1983. Active Fish Capture Methods, Chapter 7 in Fisheries Techniques. American Fisheries Society. pp. 123-145.
Herbes, S.E. and C.P. Allen. 1983. Lipid Quantification of Freshwater Invertebrates: Method Modification for Microquantitation. Canadian Journal of Fisheries and Aquatic Sciences. 40(8). pp. 1315-1317.
Hurbert, W.A. 1983. Passive Capture Methods, Chapter 6 in Fisheries Techniques. American Fisheries Society. pp. 95-122.05
Karr, J.R., K.D. Fausch, P.L. Angermeier, P.R. Yant, and I.J. Schlosser. 1986. Assessing Biological Integrity in Running Waters: A Method and Its Rationale. Special Publication 5. Illinois Natural History Survey.
Philips, D.J.H. 1977. The Use of Biological Indicator Organisms to Monitor Trace Metal Pollution In Marine and Estuarine Environments-A Review. Environmental Poll. 13, pp. 281-317.
Philips, D.J.H. 1978. Use of Biological Indicator Organisms to Quantitate Organochlorine Pollutants in Aquatic Environments-A Review. Environmental Poll. 16, pp. 167-229.
Timbrell, J.A. 1989. Introduction to Toxicology. Taylor and Francis, London. 155p.
U.S. EPA (Environmental Protection Agency). 1997. Ecological Risk Assessment Guidance for Superfund: Process forDesigning and Conducting Ecological Risk Assessments. Office of Solid Waste and Emergency Response. EPA 540-R-97/006.
U.S. EPA (Environmental Protection Agency). 1994. CLP National Functional Guidelines for Inorganic Data Review. Office of Solid Waste and Emergency Response. Publication 9240.1-05
U.S. EPA (Environmental Protection Agency). January 1991. Compendium of ERT Toxicity Testing Procedures. OSWER Directive 9360.4-08.
U.S. EPA (Environmental Protection Agency). 1992. Framework for Ecological Risk Assessment. EPA/630/R-92/001.
009103

U.S. EPA (Environmental Protection Agency). December 1991b. ECO Update. Volume 1, Number 2, Publication 9345.0-05I. Office of Emergency and Remedial Response, Hazardous Site Evaluation Division (OS-230).
U.S. EPA (Environmental Protection Agency). April 1990. Quality Assurance/Quality Control (QA/QC) Guidance for Removal Activities, Sampling QA/QC Plan and Data Validation Procedures. EPA/540/G-90/004.
U.S. EPA (Environmental Protection Agency). November 1990. Macroinvertebrate Field and Laboratory Methods for Evaluating the Biological Integrity of Surface Waters. Aquatic Biology Branch and Development and Evaluation Branch, Quality Assurance Research Division, Environmental Monitoring Systems Laboratory, Cincinnati, Ohio, EPA/600/4-90/030.
U.S. EPA (Environmental Protection Agency). March 1989b. Short-Term Methods for Estimating the Chronic Toxicityof Effluents and Receiving Waters to Freshwater Organisms. EPA/600/4-89/001.
U.S. Environmental Protection Agency. May 1989a. Rapid Bioassessment Protocols For Use In Streams And Rivers: Benthic Macroinvertebrates and Fish. EPA/444/4-89-001.
U.S. Environmental Protection Agency. May 1988. Short-Term Methods for Estimating the Chronic Toxicity of Effluents and Receiving Waters to Marine and Estuarine Organisms. EPA/600/4-87/028.
009104

APPENDIX CSUPPLEMENTAL GUIDANCE ON LITERATURE SEARCH
009105

APPENDIX CSUPPLEMENTAL GUIDANCE ON LITERATURE SEARCH
A literature search is conducted to obtain information on contaminants of concern, their potentialecological effects, and species of concern. This appendix is separated into two sections; Section C-1describes the information necessary for the literature review portion of an ecological risk assessment.Topics include information for exposure profiles, bioavailability or bioconcentration factors forvarious compounds, life-history information for the species of concern or the surrogate species, andan ecological effects profile. Section C-2 lists information sources and techniques for a literaturesearch and review. Topics include a discussion of how to select key words on which to base a searchand various sources of information (i.e., databases, scientific abstracts, literature reviews, journalarticles, and government documents). Threatened and endangered species are discussed separatelydue to the unique databases and information sources available for these species.
Prior to conducting a literature search, it is important to determine what information is neededfor the ecological risk assessment. The questions raised in Section D-1 must be thoroughly reviewed,the information necessary to complete the assessment must be determined, and the purpose of theassessment must be clearly defined. Once these activities are completed, the actual literature searchcan begin. These activities will assist in focusing and streamlining the search.
C-1 LITERATURE REVIEW FOR AN ECOLOGICAL RISK ASSESSMENT
Specific information. During problem formulation, the risk assessor must determine whatinformation is needed for the risk assessment. For example, if the risk assessment will estimate theeffects of lead contamination of soils on terrestrial vertebrates, then literature information on theeffects of dissolved lead to fish would not be relevant. The type and form of the contaminant and thebiological species of concern often can focus the literature search. For example, the toxicity oforganometallic compounds is quite different from the comparable inorganic forms. Different isomersof organic compounds also can have different toxic effects.
Reports of toxicity tests should be reviewed critically to ensure that the study was scientificallysound. For example, a report should specify the exposure routes, measures of effect and exposure,and the full study design. Moreover, whether the investigator used accepted scientific techniquesshould be determined.
The exposure route used in the study should also be comparable to the exposure route in the riskassessment. Data reported for studies where exposure is by injection or gavage are not directlycomparable to dietary exposure studies. Therefore, an uncertainty factor might need to be includedin the risk assessment study design, or the toxicity report should not be used in the risk assessment.
To use some data reported in the literature, dose conversions are necessary to estimate toxicitylevels for species other than those tested. Doses for many laboratory studies are reported in termsof mg contaminant/kg diet, sometimes on a wet-weight basis and sometimes on a dry-weight basis.
009106

That expression should be converted to mg contaminant/kg wet bodyweight/day, so that estimatesof an equivalent dose in another species can be scaled appropriately. Average ingestion rate and wetbody weight for a species often are reported in the original toxicity study. If not, estimates of thosedata can be obtained from other literature sources to make the dose conversion:
Dose = (mg contaminant/kg diet) × ingestion rate (kg/day) × (1/wet body weight (kg)).
If the contaminant concentration is expressed as mg contaminant/kg dry diet, the ingestion rate shouldalso be in terms of kg of dry diet ingested per day.
Exposure profile. Once contaminants of concern are selected for the ecological riskassessment, a general overview of the contaminants' physical and chemical properties is needed. Thefate and transport of contaminants in the environment determines how biota are likely to be exposed.Many contaminants undergo degradation (e.g., hydrolysis, photolysis, microbial) after release intothe environment. Degradation can affect toxicity, persistence, and fate and transport of compounds.Developing an exposure profile for a contaminant requires information regarding inherent propertiesof the contaminant that can affect fate and transport or bioavailability.
Bioavailability. Of particular importance in an ecological risk assessment is the bioavailabilityof site contaminants in the environment. Bioavailability influences exposure levels for the biota.Some factors that affect bioavailability of contaminants in soil and sediment include the proportionof the medium composed of organic matter, grain size of the medium, and its pH. The aerobic stateof sediments is important because it often affects the chemical form of contaminants. Those physicalproperties of the media can change the chemical form of a contaminant to a form that is more or lesstoxic than the original contaminant. Many contaminants adsorb to organic matter, which can makethem less bioavailable.
Environmental factors that influence the bioavailability of a contaminant in water are importantto aquatic risk assessments. Factors including pH, hardness, or aerobic status can determine both thechemical form and uptake of contaminants by biota. Other environmental factors can influence howorganisms process contaminants. For example, as water temperatures rise, metabolism of fish andaquatic invertebrates increases, and the rate of uptake of a contaminant from water can increase.
If the literature search on the contaminants of concern reveals information on the bioavailabilityof a contaminant, then appropriate bioaccumulation or bioconcentration factors (BAFs or BCFs) forthe contaminants should be determined. If not readily available in the literature, BAF or BCF valuescan be estimated from studies that report contaminant concentrations in both the environmentalexposure medium (e.g., sediments) and in the exposed biota (e.g., benthic macroinvertebrates).Caution is necessary, however, when extrapolating BAF or BCF values estimated for one ecosystemto another ecosystem.
009107

Life history. Because it is impossible and unnecessary to model an entire ecosystem, theselection of assessment endpoints and associated species of concern, and measurement endpoints(including those for a surrogate species if necessary) are fundamental to a successful risk assessment.This process is described in Steps 3 and 4. Once assessment and measurement endpoints are agreedto by the risk assessor and risk manager, life history information for the species of concern or thesurrogate species should be collected. Patterns of activity and feeding habits of a species affect theirpotential for exposure to a contaminant (e.g., grooming activities of small mammals, egestion of boneand hide by owls). Other important exposure factors include food and water ingestion rates,composition of the diet, average body weight, home range size, and seasonal activities such asmigration.
Ecological effects profile. Once contaminants and species of concern are selected duringproblem formulation, a general overview of toxicity and toxic mechanisms is needed. The distinctionbetween the species of concern representing an assessment endpoint and a surrogate speciesrepresenting a measurement endpoint is important. The species of concern is the species that mightbe threatened by contaminants at the site. A surrogate species is used when it is not appropriate orpossible to measure attributes of the species of concern. A surrogate for a species of concern shouldbe sufficiently similar biologically to allow inferences on likely effects in the species of concern.
The ecological effects profile should include toxicity information from the literature for eachpossible exposure route. A lowest-observed-adverse-effect level (LOAEL) and the no-observed-adverse-effect level (NOAEL) for the species of concern or its surrogate should be obtained.Unfortunately, LOAELs are available for few wildlife species and contaminants. If used with caution,toxicity data from a closely related species can be used to estimate a LOAEL and a NOAEL for areceptor species.
C-2 INFORMATION SOURCES
This section describes information sources that can be examined to find the information describedin Section 3-1. A logical and focused literature search will reduce the time spent searching forpertinent information.
A first step in a literature search is to develop a search strategy, including a list of key words. Thenext step is to review computerized databases, either on-line or CD-ROM-based information systems.These systems can be searched based on a number of parameters.
Scientific abstracts that contain up-to-date listings of current, published information also areuseful information sources. Most abstracts are indexed by author or subject. Toxicity studies andinformation on wildlife life-histories often are summarized in literature reviews published in booksor peer-reviewed journals. Original reports of toxicity studies can be identified in the literaturesection of published documents. The original article in which data are reported must be reviewedbefore the data are cited in a risk assessment.
009108

Key words. Once the risk assessor has prepared a list of the specific information needed for therisk assessment, a list of key words can be developed. Card catalogs, abstracts, on-line databases,and other reference materials usually are indexed on a limited set of key words. Therefore, the keywords used to search for information must be considered carefully.
Useful key words include the contaminant of concern, the biological species of concern, the typeof toxicity information wanted, or other associated words. In addition, related subjects can be usedas key words. However, it usually is necessary to limit peripheral aspects of the subject in order tonarrow the search. For example, if the risk assessor needs information on the toxicity of lead in soilsto moles, then requiring that both "lead" and "mole" are among the key words can focus the literaturesearch. If the risk assessor needs information on a given plant or animal species (or group of species),key words should include both the scientific name (e.g., genus and species names or order or familynames) and an accepted common name(s). The projected use of the data in the risk assessment helpsdetermine which key words are most appropriate.
If someone outside of the risk assessment team will conduct the literature search, it is importantthat they understand both the key words and the study objectives for the data.
Databases. Databases are usually on-line or CD-ROM-based information systems. Thesesystems can be searched using a number of parameters. Prior to searching databases, the risk assessorshould determine which database(s) is most likely to provide the information needed for the riskassessment. For example, U.S. Environmental Protection Agency's (EPA's) AQUIRE database(AQUatic Information REtrieval database) provides information specifically on the toxicity ofchemicals to aquatic plants and animals. PHYTOTOX includes data on the toxicity of contaminantsto terrestrial and aquatic plants, and TERRETOX includes data on toxicity to terrestrial animals.U.S. EPA's IRIS (Integrated Risk Information System) provides information on human health risks(e.g., references to original toxicity studies) and regulatory information (e.g., reference doses andcancer potency factors) for a variety of chemicals. Other useful databases include the NationalLibrary of Medicine's HSDB (Hazardous Substances Data Bank) and the National Center forEnvironmental Assessment's HEAST Tables (Health Effects Assessment Summary Tables).Commercially available databases include BIOSIS (Biosciences Information Services) andENVIROLINE. Another database, the U.S. Public Health Service's Registry of Toxic Effects ofChemical Substances (RTECS) is a compilation of toxicity data extracted from the scientific literatureand is also available online.
009109

Several states have Fish and Wildlife History Databases or Academy of Science databases, whichoften provide useful information on the life-histories of plants and animals in the state. Statedatabases are particularly useful for obtaining information on endemic organisms or geographicallydistinct habitats.
Databases searches can yield a large amount of information in a short period of time. Thus, if thekey words do not accurately describe the information needed, database searches can provide a largeamount of irrelevant information. Access fees and on-line fees can apply; therefore, the selection ofrelevant key words and an organized approach to the search will reduce the time and expense of on-line literature searches.
Abstracts. Published abstract compilations (e.g., Biological Abstracts, Chemical Abstracts,Applied Ecology Abstracts) contain up-to-date listings of current, published information. Mostabstracts are indexed by author or subject. Authors and key words can be cross-referenced to identifyadditional publications. Abstract compilations also include, for each citation, a copy of its abstractfrom the journal or book in which it was published. Reviewing the abstracts of individual citationsis a relatively quick way to determine whether an article is applicable to the risk assessment. As withcomputerized database searches, it is important to determine which abstract compilations are mostsuitable for the risk assessor's information needs.
Published abstract compilations that are indexed by author are particularly useful. If an authoris known to conduct a specific type of research, their name would be referenced in the abstract forother articles on similar subjects. If the risk assessor considers an abstract pertinent to theassessment, the original article must be retrieved and reviewed before it can be cited in the riskassessment. Otherwise, the results of the risk assessment could be based on incorrect and incompleteinformation about a study.
Abstracts usually must be searched manually, which can be a very time consuming. The judicioususe of key words can help to reduce the amount of time needed to search through these volumes.
Literature review publications. Published literature reviews often cover toxicity or wildlifeinformation of value to an ecological risk assessment. For example, the U.S. Fish and WildlifeServices (U.S. FWS) has published several contaminant-specific documents that list toxicological dataon terrestrial, aquatic, and avian studies (e.g., Eisler, 1988). The U.S. EPA publishes ambient waterquality criteria documents (e.g., U.S. EPA, 1985) that list all the data used to calculate those values.Some literature reviews critically evaluate the original studies (e.g., toxicity data reviewed by NOAA,1990). The Wildlife Exposure Factors Handbook (U.S. EPA, 1993a,b) provides pertinentinformation on exposure factors (e.g., body weights, food ingestion rates, dietary composition, homerange size) for 34 selected wildlife species.
009110

Literature reviews can provide an extensive amount of information. However, the risk assessormust obtain a copy of the original of any studies identified in a literature review that will be used inthe risk assessment. The original study must be reviewed and evaluated before it can be used in therisk assessment. Otherwise, the results of the risk assessment could be based on incorrect andincomplete information about a study.
References cited in previous studies. Pertinent studies can be identified in the literaturecited section of published documents that are relevant to the risk assessment, and one often canidentify several investigators who work on related studies. Searching for references in the literaturecited section of published documents, however, takes time and might not be very effective. However,this is probably the most common approach to identifying relevant literature. If this approach isselected, the best place to start is a review article. Many journals do not list the title of a citation foran article, however, limiting the usefulness of this technique. Also, it can be difficult to retrieveliterature cited in obscure or foreign journals or in unpublished masters' theses or doctoraldissertations. Although this approach tends to be more time consuming than the other literaturesearch approaches described above, it probably is the most common approach used to locateinformation for a risk assessment.
Journal articles, books, government documents. There are a variety of journals, books,and government documents that contain information useful to risk assessments. The samerequirement for retrieving the original reports for any information used in the risk assessmentdescribed for other information sources applies to these sources.
Threatened and endangered species. Threatened and endangered species are of concernto both federal and state governments. When conducting an ecological risk assessment, it often isnecessary to determine or estimate the effects of site contaminants to federal threatened orendangered species. In addition, other special-status species (e.g., species listed by a state asendangered or threatened within the state) also can be the focus of the assessment. During theproblem formulation step, the U.S. FWS or state Natural Heritage programs should be contacted todetermine if these species are present or might be present on or near a Superfund site.
Once the presence of a special-status species is confirmed or considered likely, information onthis species, as well as on surrogate species, should be included in the literature search. There arespecific federal and state programs that deal with issues related to special-status species, and oftenthere is more information available for these than for non-special-status species used as surrogatesfor an ecological risk assessment. Nonetheless, the use of surrogate species usually is necessary whenan assessment endpoint is a special-status species.
009111
REFERENCES
Eisler, R. 1988. Lead Hazards to Fish, Wildlife, and Invertebrates: A Synoptic Review. U.S. Fishand Wildlife Service Patuxent Wildlife Research Center, Laurel MD: U.S. Department of theInterior; Biological Report 85(1.14), Contaminant Hazard Reviews Rep. No. 14.
National Oceanic and Atmospheric Administration (NOAA). 1990. The Potential for BiologicalEffects of Sediment-Sorbed Contaminants Tested in the National Status and Trends Program.Seattle, WA: Office of Oceanography and Marine Assessment. NOAA/TM/NOS/OMA-52.Technical memorandum by Long, E.R. and Morgan, L.G.
U.S. Environmental Protection Agency (U.S. EPA). 1993a. Wildlife Exposure Factors HandbookVolume I. Washington, DC: Office of Research and Development; EPA/600/R-93/187a.
U.S. Environmental Protection Agency (U.S. EPA). 1993b. Wildlife Exposure Factors HandbookVolume II: Appendix. Washington, DC: Office of Research and Development; EPA/600/R-93/187b.
U.S. Environmental Protection Agency (U.S. EPA). 1985. Ambient Water Quality Criteria forCopper-1984. Washington, DC: Office of Water, Regulations and Standards, Criteria andStandards Division. EPA/440/5-84-031. PB85-227023.
009112

APPENDIX DSTATISTICAL CONSIDERATIONS
009113

D-1
APPENDIX DSTATISTICAL CONSIDERATIONS
In the biological sciences, statistical tests often are needed to support decisions based onalternative hypotheses because of the natural variability in the systems under investigation. Astatistical test examines a set of sample data, and, based on an expected distribution of the data, leadsto a decision on whether to accept the hypothesis underlying the expected distribution or whether toreject that hypothesis and accept an alternative one. The null hypothesis is a hypothesis of nodifferences. It usually is formulated for the express purpose of being rejected. The alternative or testhypothesis is an operational statement of the investigator's research hypothesis. An example of a nullhypothesis for toxicity testing would be that mortality of water fleas exposed to water from acontaminated area is no different than mortality of water fleas exposed to water from an otherwisesimilar, but uncontaminated area. An example of the test hypothesis is that mortality of water fleasexposed to water from the contaminated area is higher than mortality of water fleas exposed touncontaminated water.
D-1 TYPE I AND TYPE II ERROR
There are two types of correct decisions for hypothesis testing: (1) accepting a true nullhypothesis, and (2) rejecting a false null hypothesis. There also are two types of incorrect decisions:rejecting a true null hypothesis, called Type I error; and accepting a false null hypothesis, called TypeII error.
When designing a test of a hypothesis, one should decide what magnitude of Type I error(rejection of a true null hypothesis) is acceptable. Even when sampling from a population of knownparameters, there are always some sample sets which, by chance, differ markedly. If one allows 5percent of samples to lead to a Type I error, then one would on average reject a true null hypothesisfor 5 out of every 100 samples taken. In other words, we would be confident that, 95 times out of100, one would not reject the null hypothesis of no difference "by mistake" (because chance aloneproduced such deviant results). When the probability of Type I error (commonly symbolized by ")is set at 0.05, this is called a significance level of 5 percent. Setting a significance level of 5 percentis a widely accepted convention in most experimental sciences, but it is just that, a convention. Onecan demand more confidence (e.g., " = 0.01) or less confidence (e.g., " = 0.10) that the hypothesisof no difference is not rejected by mistake.
If one requires more confidence for a given sample size that the null hypothesis is not rejected bymistake (e.g., " = 0.01), the chances of Type II error increase. In other words, the chance increasesthat one will mistakenly accept a false null hypothesis (e.g., mistakenly believe that the contaminatedwater from the site has no effect on mortality of water fleas). The probability of Type II error iscommonly denoted by $.
009114

With a specified alternative hypothesis, once " and the sample size (N) are set, $ is1
determined.
D-2
Thus:p (Type I error) = "p (Type II error) = $
However, if one tries to evaluate the probability of Type II error (accepting a false hypothesis of nodifference), there is a problem. If the null hypothesis is false, then some other hypothesis must betrue, but unless one can specify a second hypothesis, one can't determine the probability of Type IIerror. This leads to another important statistical consideration, which is the power of a study designand the statistical test used to evaluate the results.
D-2 STATISTICAL POWER
The power of a statistical test is equal to (1 - $) and is equal to the probability of rejecting the nullhypothesis (no difference) when it should be rejected (i.e., it is false) and the specified alternativehypothesis is true. Obviously, for any given test (e.g., a toxicity test at a Superfund site), one wouldlike the quantity (1 - $) to be as large as possible (and $ to be as small as possible). Because onegenerally cannot specify a given alternative hypothesis (e.g., mortality should be 40 percent in theexposed population), the power of a test is generally evaluated on the basis of a continuum of possiblealternative hypotheses.
Ideally, one would specify both " and $ before an experiment or test of the hypothesis isconducted. In practice, it is usual to specify " (e.g., 0.05) and the sample size because the exactalternative hypothesis cannot be specified. Given the inverse relationship between the likelihood of1
making Type I and Type II errors, a decrease in " will increase $ for any given sample size.
To improve the statistical power of a test (i.e., reduce $), while keeping " constant, one can eitherincrease the sample size (N) or change the nature of the statistical test. Some statistical tests aremore powerful than others, but it is important that the assumptions required by the test (e.g.,normality of the underlying distribution) are met for the test results to be valid. In general, the morepowerful tests rely on more assumptions about the data (see Section D-3).
Alternative study designs sometimes can improve statistical power (e.g., stratified randomsampling compared with random sampling if something is known about the history and location ofcontaminant release). A discussion of different statistical sampling designs is beyond the scope of thisguidance, however. Several references provide guidance on statistical sampling design, samplingtechniques, and statistical analyses appropriate for hazardous waste sites (e.g., see Cochran, 1977;Green, 1979; Gilbert, 1987; Ott, 1995).
One also can improve the power of a statistical test if the test hypothesis is more specific than"two populations are different," and, instead, predicts the direction of a difference (e.g., mortality in
009115

D-3
Highlight D-2 Key Points About Statistical Significance, Power, and Sample Size
(1) The significance level for a statistical test, ", is the probability that a statistical test will yielda value under which the null hypothesis will be rejected when it is in fact true. In other words," defines the probability of committing Type I error (e.g., concluding that the site medium istoxic when it is in fact not toxic to the test organisms).
(2) The value of $ is the probability that a statistical test will yield a value under which the nullhypothesis is accepted when it is in fact false. Thus, $ defines the probability of committingType II error (e.g., concluding that the site medium is not toxic when it is in fact toxic to thetest organisms).
(3) The power of a statistical test (i.e., 1 - $) indicates the probability of rejecting the nullhypotheses when it is false (and therefore should be rejected). Thus, one wants the power ofa statistical test to be as high as possible.
(4) Power is related to the nature of the statistical test chosen. A one-tailed test is more powerfulthan a two-tailed test. If the alternative to the null hypothesis can state the expected directionof a difference between a test and control group, one can use the more powerful one-tailed test.
(5) The power of any statistical test increases with increasing sample size.
the exposed group is higher than mortality in the control group). When one can predict the directionof a difference between groups, one uses a one-tailed statistical test; otherwise, one must use the lesspowerful two-tailed version of the test.
D-3 STATISTICAL MODEL
Associated with every statistical test is a model and a measurement requirement. Each statisticaltest is valid only under certain conditions. Sometimes, it is possible to test whether the conditionsof a particular statistical model are met, but more often, one has to assume that they are or are notmet based on an understanding of the underlying population and sampling design. The conditions thatmust be met for a statistical test to be valid often are referred to as the assumptions of the test.
The most powerful statistical tests (see previous section) are those with the most extensiveassumptions. In general, parametric statistical tests (e.g., t test, F test) are the most powerful tests,but also have the most exacting assumptions to be met:
(1) The "observations" must be independent;
(2) The "observations" must be drawn from a population that is normally distributed;
009116

D-4
(3) The populations must have the same variance (or in special cases, a known ratio of variances);and
(4) The variables must have been measured at least on an interval scale so that it is possible touse arithmetic operations (e.g., addition, multiplication) on the measured values (Siegel,1956).
The second and third assumptions are the ones most often violated by the types of data associatedwith biological hypothesis testing. Often, distributions are positively skewed (i.e., longer upper thanlower tail of the distribution). Sometimes, it is possible to transform data from positively skeweddistributions to normal distributions using a mathematical function. For example, many biologicalparameters turn out to be log-normally distributed (i.e., if one takes the log of all measures, theresulting values are normally distributed). Sometimes, however, the underlying shape of thedistribution cannot be normalized (e.g., it is bimodal).
When the assumptions required for parametric tests are not met, one must use nonparametricstatistics (e.g., median test, chi-squared test). Nonparametric tests are in general less powerful thanparametric tests because less is known or assumed about the shape of the underlying distributions.However, the loss in power can be compensated for by an increase in sample size, which is theconcept behind measures of power-efficiency.
Power-efficiency reflects the increase in sample size necessary to make test B (e.g., anonparametric test) as efficient or powerful as test A (e.g., a parametric test). A power-efficiencyof 80 percent means that in order for test B to be as powerful as test A, one must make 10observations for test B for every 8 observations for test A.
For further information on statistical tests, consult references on the topic (e.g., see referencesbelow).
REFERENCES
Cochran, W. G. 1977. Sampling Techniques. Third edition. New York, NY: John Wiley and Sons,Inc.
Gilbert, R.O. 1987. Statistical Methods for Environmental Pollution Monitoring. New York, NY: Reinhold.
Green, R. H. 1979. Sampling Design and Statistical Methods for Environmental Biologists. New York, NY:Wiley.
Ott, W.R. 1995. Environmental Statistics and Data Analysis. Boca Raton, FL: CRC Press, Inc., LewisPublishers.
Siegel, S. 1956. Non-parametric Statistics. New York, NY: McGraw-Hill.
009117

D-5
009118