Ecological classification of southern intertidal … classification of southern intertidal zo nes of...
19
Iranian Journal of Fisheries Sciences 13(1)1-19 2014 Ecological classification of southern intertidal zones of Qeshm Island, based on CMECS model Ansari, Z. 1 ; Seyfabadi, J. 1 ; Owfi, F.* 2 ; Rahimi, M. 1 and Allee, R. 3 Received: December 2012 Accepted: July 2013 Abstract The “Coastal and Marine Ecological Classification Standard (CMECS)”, a new approach to ecological classification, was applied to 122 km of the southern intertidal zone of Qeshm Island located the Hormouz Strait - the Persian Gulf. Two components of this model, Surface Geology (SGC) and Biotic Cover (BCC) were used. Considering the extent and geomorphological alternations of the covered area, 12 sampling sites within 5 sub- regions were designated using by GPS. In total, 60 habitats (biotopes) with 47 codes were determined; this variety of biotopes is directly related to the diverse surface geology (substrate) of the covered area. Most of the biotopes and codes were recorded in the mid- eastern coastal zone, due to heterogeneity in substrate structure associated with numerous ecological niches in rocky shores. Crustacean species such as Eriphia smithi, Thalamita prymna, Molluscan species such as Clypeomorous bifisciatus, Cerithium caeruleum and echinoderm species such as Echinometra mathaei and Ophiactis sp. were characteristic of rocky shores, while Crustacea groups including Ocypode rotundata and Dotilla sp., and Umbonium vestiarium (Mollusca) were characteristic of sandy shores. Although the highest number of codes was recorded in Zeitun Park site (Eastern coast), it did not possess the expected specific species (such as Diadema setosum, Linckia multiflora and Ophiocoma scolopendrina), that were encountered in sites with similar surface geology. This could have been caused by tourist traffic at the Zeitun Park site. Keywords: Surface Geology, Biotic Cover, Biotope, CMECS model, Coastal Zone, Qeshm Island 1-Department of Marine Biology Sciences, Faculty of Natural Resource and Marine Science, Tarbiat Modares University, P.O. Box 46414-356, Noor, Mazandaran, Iran 2-Ecology Department, Iranian Fisheries Research Organization (IFRO), P. O. Box: 14155-6116, Tehran, Iran 3- National Oceanic and Atmospheric Administration (NOAA), Florida, USA * Corresponding author: [email protected] Downloaded from jifro.ir at 20:42 +0430 on Thursday May 17th 2018
Transcript of Ecological classification of southern intertidal … classification of southern intertidal zo nes of...

Iranian Journal of Fisheries Sciences 13(1)1-19 2014
Ecological classification of southern intertidal zones of
Qeshm Island, based on CMECS model
Ansari, Z.1; Seyfabadi, J.1; Owfi, F.*2; Rahimi, M.1and Allee, R.3
Received: December 2012 Accepted: July 2013
Abstract
The “Coastal and Marine Ecological Classification Standard (CMECS)”, a new
approach to ecological classification, was applied to 122 km of the southern intertidal zone
of Qeshm Island located the Hormouz Strait - the Persian Gulf. Two components of this
model, Surface Geology (SGC) and Biotic Cover (BCC) were used. Considering the extent
and geomorphological alternations of the covered area, 12 sampling sites within 5 sub-
regions were designated using by GPS. In total, 60 habitats (biotopes) with 47 codes were
determined; this variety of biotopes is directly related to the diverse surface geology
(substrate) of the covered area. Most of the biotopes and codes were recorded in the mid-
eastern coastal zone, due to heterogeneity in substrate structure associated with numerous
ecological niches in rocky shores. Crustacean species such as Eriphia smithi, Thalamita
prymna, Molluscan species such as Clypeomorous bifisciatus, Cerithium caeruleum and
echinoderm species such as Echinometra mathaei and Ophiactis sp. were characteristic of
rocky shores, while Crustacea groups including Ocypode rotundata and Dotilla sp., and
Umbonium vestiarium (Mollusca) were characteristic of sandy shores. Although the
highest number of codes was recorded in Zeitun Park site (Eastern coast), it did not
possess the expected specific species (such as Diadema setosum, Linckia multiflora and
Ophiocoma scolopendrina), that were encountered in sites with similar surface geology.
This could have been caused by tourist traffic at the Zeitun Park site.
Keywords: Surface Geology, Biotic Cover, Biotope, CMECS model, Coastal Zone, Qeshm
Island
1-Department of Marine Biology Sciences, Faculty of Natural Resource and Marine Science, Tarbiat
Modares University, P.O. Box 46414-356, Noor, Mazandaran, Iran
2-Ecology Department, Iranian Fisheries Research Organization (IFRO), P. O. Box: 14155-6116, Tehran,
Iran
3- National Oceanic and Atmospheric Administration (NOAA), Florida, USA
* Corresponding author: [email protected]
Dow
nloa
ded
from
jifr
o.ir
at 2
0:42
+04
30 o
n T
hurs
day
May
17t
h 20
18

2 Ansari et al., Ecological classification of southern intertidal zones of ...
Introduction
The Coastal Zone is a term used to define
a transition area between terrestrial and
aquatic ecosystems, which is more sensitive
and vulnerable than other terrestrial
ecosystems. Banica et al. (2003). Increasing
pressure on these areas can decrease the
quality of marine habitats, and can even lead
to the loss of sensitive habitats. Lund and
Wilbur (2007). Effective management of
specific habitats and species requires a
relatively clear understanding of their present
distribution, the underpinning biology and
ecology, and also their sensitivity to natural
and anthropogenic changes. Elliott et al.
(1998). Consistent mapping of habitats in
environmental management and conservation
requires standardized classifications and
terminologies for habitats. In this regard,
“Biotope” has been suggested as the most
informative operational unit for research and
management. Costello (2009). In the strict
sense, biotopes are part of habitats in that they
are defined by the species present, but the
term is now more widely used to include both
this habitat and the biocoenosis. Olenin and
Ducrotoy( 2006) that identified by dominant
or diagnostic species, with emphasis on
species that have a high constancy and
physically linked to the habitat. Madden et al.
(2009). Habitat classifications are therefore,
most accurate and ecologically relevant at the
biotope level because of the direct relationship
between the biota and their environment.
Andrefouet et al. (2003); Capolsini et al.
(2003). The Coastal and Marine Ecological
Classification Standard System (CMECS) is
one of the newest models that have been
applied for the classification of biotopes, it
has included reviews and summaries of many
habitat classification studies Madden et al.
(2009). CMECS is a hierarchical framework
that applies a uniform set of rules and
terminologies across multiple habitat scales
using a combination of oceanographic,
physiographic and biological criteria. Keefer
et al. (2007).The use of geological
characteristics is proving to be effective tool
for describing marine benthic habitats. Greene
et al. (2000); Valentine et al. (2003). In fact, a
benthic habitat is more than a substrate, and is
formed from several components that, in
addition to substrate, include species as well
as the species’ tolerances and preferences.
Diaz et al. (2004).
CMECS (Version III, 2009) Madden et
al. (2009) has five distinct components
including Surface Geology Component
(SGC), Sub-benthic Component (SBC), Biotic
Cover Component (BCC), Geo-Form
Component (GFC) and Water Column
Component (WCC), of which we have only
applied SGC and BCC. The CMECS model is
further divided into six Systems (nearshore,
neritic, oceanic, estuarine, freshwater
influenced and lacustrine) and two
Subsystems defined by tidal regime. Madden
et al. (2009). Of these we considered,
intertidal zone since it has been more
disturbed and damaged by anthropogenic
activities than any other marine habitat. Pinn
and Rodgers (2005). In the Biotic Cover
Component (BCC), each subsystem is further
divided into classes and then subclasses and
finally biotic groups. Biotic groups are often
observational and descriptive defined by
obvious structure-forming organisms. Classes
Dow
nloa
ded
from
jifr
o.ir
at 2
0:42
+04
30 o
n T
hurs
day
May
17t
h 20
18

Iranian Journal of Fisheries Sciences13(1) 2014 3
and subclasses for the SGC are determined by
the dominant (in terms of percent cover)
geologic or biogenic cover of the substrate.
Madden et al. (2009). Finally, specific
habitats have shown by Geographic
Information System (GIS) maps for each
dominant species. In GIS, a coding system
facilitates data organization and queries.
Kutcher et al. (2005). Maps showing habitat
characteristics, such as seafloor topography
and surficial sediments, are expected to
improve the efficiency of managing the ocean
environment (Tierney, 2004).Current version
of CMECS (FGDC CMECS, 2012) is now
available as this paper goes to publication.
Southern Qeshm Island encompass a
wide range of coastal ecosystems such as
backbarrier, floodway, creek, mangrove
forests, cliff, rocky shore and sandy beach,
which provide excellent habitats for various
types of species. The present study aimed to
assess classification of intertidal habitats of
the southern coastal stretch of Qeshm Island
as a tool for the environmental management of
its highly important biogeographic and
economic circumstances, considered as
sensitive and vulnerable to anthropogenic
activities.
Materials and methods
Qeshm Island (26-27˚N and 55-56˚E)
with an area of 1491 km2 (122 km long, 18
km wide on average) is the largest island in
the Persian Gulf. It is situated in the Strait of
Hormoz along Hormozgan province.
GOMDAF (2004), FGDC CMECS (2012).
The study was carried out in four
seasons during 2009-2010 and covered 122
km intertidal stretch of the southern Qeshm
Island. Considering the extent and
geomorphology of the covered area, 12
stations within 5 sub-regions were designated
using by Garmin 60 CX GPS device.
Table 1: Names and locations of sampling sites /stations
Site / Station
Latitude Longitude
Coastline
length
(km) No. Name
1 Zeitun Park N26˚ 56΄ 13.8" E56˚ 16΄ 37.2" 6.1
2 Cistern 26˚ 55΄ 32.7" 56˚ 13΄ 49.0" 6.1
3 Creek mouth N26˚ 54΄ 38.9" E56˚ 10΄ 17.4" 10
4 Nakhl-e-Gol N26˚ 50΄ 11.2" E56˚ 07΄ 41.7" 9.4
5 Holyshrine N26˚ 46΄ 38.7" E56˚ 04΄ 15.0" 4.4
6 Backbarrier (Suza) N26˚ 45΄ 30.1" E56˚ 01΄ 56.7" 2.6
7 Backbarrier (Mesen) N26˚ 44΄ 48.1" E56˚ 00΄ 44.0" 3.5
8 South of Military Restricted Zone N26˚ 41΄ 59.6" E55˚ 57΄ 37.6 " 0.5
9 Hara Forest N26˚ 42΄ 29.4" E55˚ 55΄ 00.9" 6.9
10 Backbarrier (Salakh) N26˚ 40΄ 57.5" E55˚ 40΄ 45.3" 29.9
11 Salt Floodway N26˚ 36΄ 44.9" E55˚ 31΄ 34.8" 17.1
12 Dustaku N26˚ 34΄ 46.1" E55˚ 20΄ 21.3" 21.2
Dow
nloa
ded
from
jifr
o.ir
at 2
0:42
+04
30 o
n T
hurs
day
May
17t
h 20
18

4 Ansari et al., Ecological classification of southern intertidal zones of
Figure 1: Map of Qeshm Island, showing the
In order to record dominant species of
fauna and flora, communities were observed
and randomly sampled using 0.5×0.5 m
quadrate (0.25 m2) with three replicates at
each station. Photos of the samples were also
taken before collecting and preserving them in
4% formalin solution for further
identification, which was carried to the lowest
possible level using valid identification keys.
Jones (1986); Bosch et al. (1995);
Hosseinzadeh et al. (2001); Quddusi and
Feroz (2006); Gharanjik and Rouhani (2010).
Sediments were sieved with a
mechanical shaker for particle size analysis
and determination of grain size. Eleftheriou
and McIntyre (2005), the value of Total
Organic Matter (TOM) was estimated by loss
Ecological classification of southern intertidal zones of ...
Map of Qeshm Island, showing the designated sites / stations in the southern coast
In order to record dominant species of
fauna and flora, communities were observed
and randomly sampled using 0.5×0.5 m
) with three replicates at
each station. Photos of the samples were also
taken before collecting and preserving them in
4% formalin solution for further
identification, which was carried to the lowest
possible level using valid identification keys.
1986); Bosch et al. (1995);
Hosseinzadeh et al. (2001); Quddusi and
Feroz (2006); Gharanjik and Rouhani (2010).
Sediments were sieved with a
mechanical shaker for particle size analysis
and determination of grain size. Eleftheriou
the value of Total
Organic Matter (TOM) was estimated by loss
of weight on ignition. Motamed (1995) ;
Luzak and Janquin (1997). For this purpose,
400-500 g of sediment was collected from the
upper 15 cm of the surface for particle size
analysis and 10-12 g of sediment was
collected from the upper 5 cm of the surface
for measuring organic matter. Eleftheriou, and
McIntyre (2006), Madden et al. (2009).
Sediment was also sieved in the seawater to
observe infauna. Slope of the coast was also
measured with laser distance measurer (LD
500 STABILA). According to CMECS, the
sediment size and biological characteristics
were used to categorize habitats within related
class, subclass and lower levels.
designated sites / stations in the southern coast
Motamed (1995) ;
For this purpose,
500 g of sediment was collected from the
upper 15 cm of the surface for particle size
g of sediment was
collected from the upper 5 cm of the surface
Eleftheriou, and
et al. (2009).
Sediment was also sieved in the seawater to
observe infauna. Slope of the coast was also
r distance measurer (LD
500 STABILA). According to CMECS, the
sediment size and biological characteristics
were used to categorize habitats within related
Dow
nloa
ded
from
jifr
o.ir
at 2
0:42
+04
30 o
n T
hurs
day
May
17t
h 20
18
Iranian Journal of Fisheries Sciences13(1) 2014 5
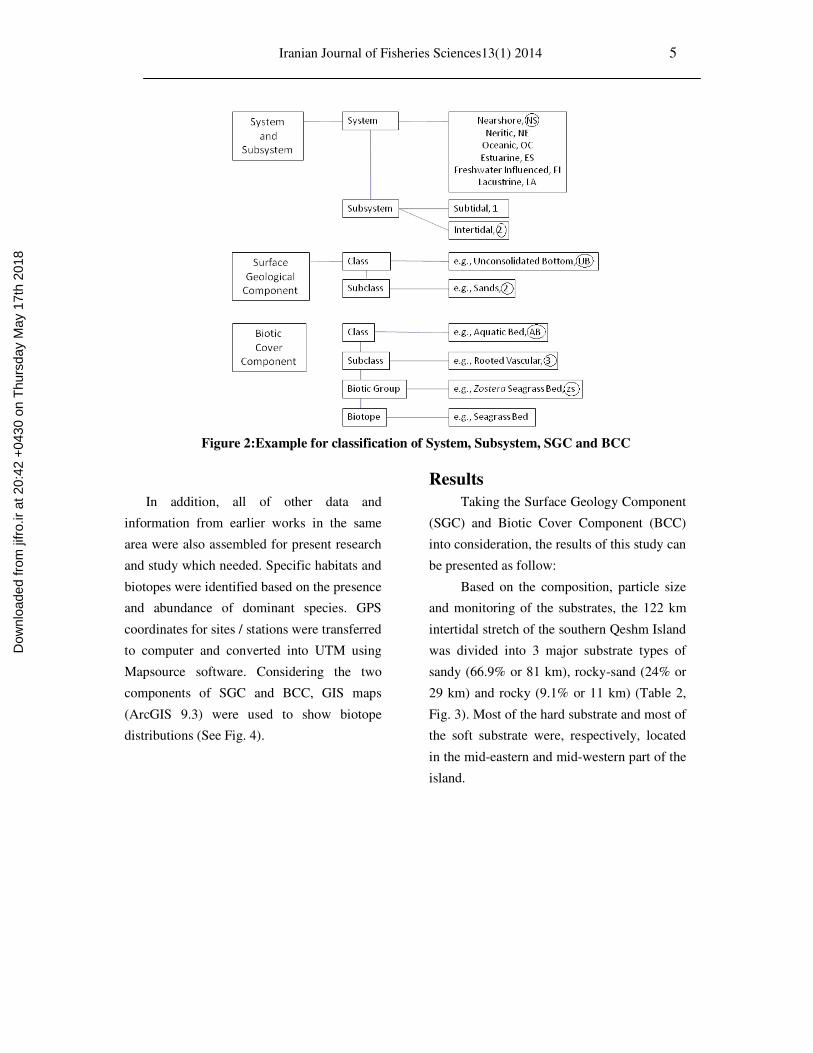
Figure 2:Example for classification of System, Subsystem, SGC and BCC
In addition, all of other data and
information from earlier works in the same
area were also assembled for present research
and study which needed. Specific habitats and
biotopes were identified based on the presence
and abundance of dominant species. GPS
coordinates for sites / stations were transferred
to computer and converted into UTM using
Mapsource software. Considering the two
components of SGC and BCC, GIS maps
(ArcGIS 9.3) were used to show biotope
distributions (See Fig. 4).
Results
Taking the Surface Geology Component
(SGC) and Biotic Cover Component (BCC)
into consideration, the results of this study can
be presented as follow:
Based on the composition, particle size
and monitoring of the substrates, the 122 km
intertidal stretch of the southern Qeshm Island
was divided into 3 major substrate types of
sandy (66.9% or 81 km), rocky-sand (24% or
29 km) and rocky (9.1% or 11 km) (Table 2,
Fig. 3). Most of the hard substrate and most of
the soft substrate were, respectively, located
in the mid-eastern and mid-western part of the
island.
Dow
nloa
ded
from
jifr
o.ir
at 2
0:42
+04
30 o
n T
hurs
day
May
17t
h 20
18

6 Ansari et al., Ecological classification of southern intertidal zones of ...
Table 2: Surface geological characteristics of the sampling sites / stations
Site
(Station)
Sediment
composition
(mean %)
TOM
(mean %)
Slope
(mean)
Coastal
substrate
structure
1 Sandy (75) 3< 4.0˚ Rocky-Sandy
2 - 3< 5.0˚ Rocky
3 Sandy (75) 3< 5.6˚ Sandy
4 Sandy (>75) >3 3.6˚ Sandy
5 - >3 6.6˚ Rocky
6 Sandy (>75) 3< 6.0˚ Rocky-Sandy
7 Sandy (>75) >3 5.6˚ Rocky-Sandy
8 - >3 4.03˚ Rocky
9 Sandy (>75) >3 5.6˚ Sandy
10 Sandy (>75) >3 7.2˚ Sandy
11 Sandy (>75) >3 4.6˚ Rocky-Sandy
12 Sandy (>75) >3 5.0˚ Sandy
One of the major features of Qeshm
Island sandy shores is presence of
homogeneous sandy platforms. Waves and
fine sediments have important roles in
formation of these platforms. In rocky and
rocky-sand shores tide pools were observed.
Which covered by algal mats in some seasons
(Fig. 3).
Figure 3:Sandy beach with sandy platform (left), rocky-sand (center) and rocky shore with
tide pools (right).
Biotic communities were categorized
based on CMECS, and also by considering
habitat diversity based on Surface Geology
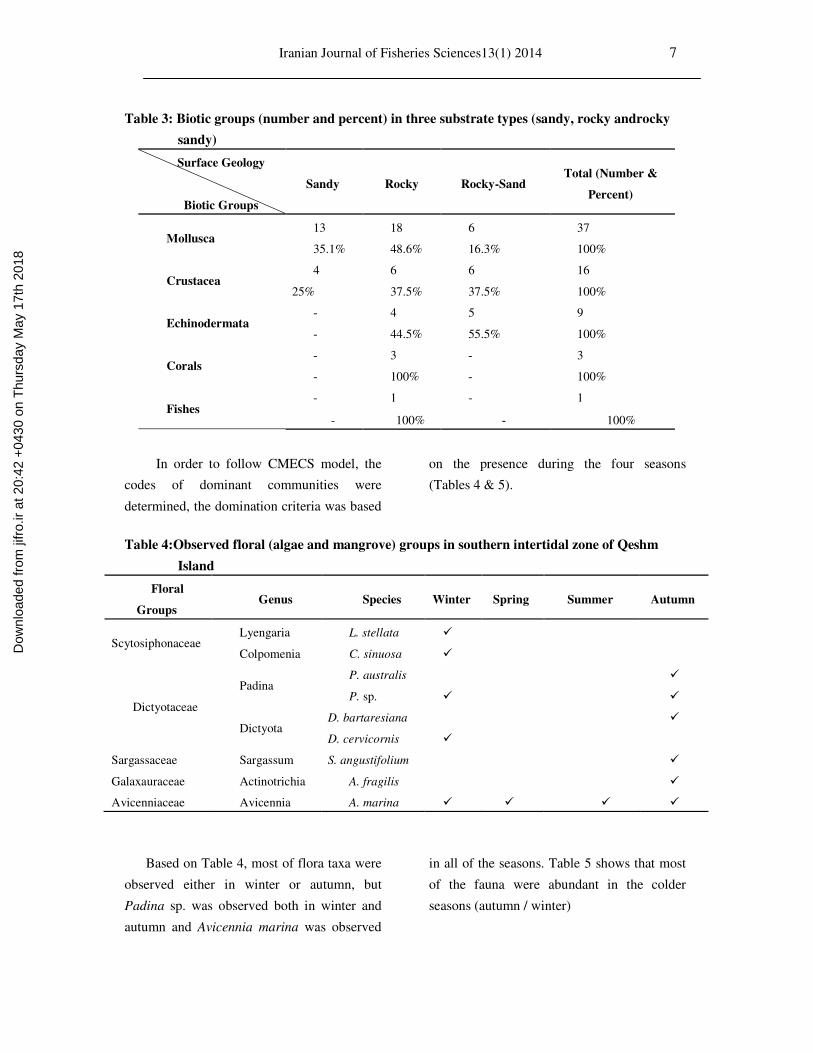
Characteristics (Table 3). All biotic groups
were most abundant in rocky or rocky-sandy
shores. Mollusca (18 taxa), corals (3 taxa) and
fishes (1 taxon) represented the highest and
the lowest diversity, respectively.
Dow
nloa
ded
from
jifr
o.ir
at 2
0:42
+04
30 o
n T
hurs
day
May
17t
h 20
18
Iranian Journal of Fisheries Sciences13(1) 2014 7
Table 3: Biotic groups (number and percent) in three substrate types (sandy, rocky androcky
sandy)
Total (Number &
Percent) Rocky-Sand Rocky Sandy
Surface Geology
Biotic Groups
37 6 18 13 Mollusca
100% 16.3% 48.6% 35.1%
16 6 6 4 Crustacea
100% 37.5% 37.5% 25%
9 5 4 - Echinodermata
100% 55.5% 44.5% -
3 - 3 - Corals
100% - 100% -
1 - 1 - Fishes
100% - 100% -
In order to follow CMECS model, the
codes of dominant communities were
determined, the domination criteria was based
on the presence during the four seasons
(Tables 4 & 5).
Table 4:Observed floral (algae and mangrove) groups in southern intertidal zone of Qeshm
Island
Floral
Groups Genus Species Winter Spring Summer Autumn
Scytosiphonaceae Lyengaria L. stellata �
Colpomenia C. sinuosa �
Dictyotaceae
Padina P. australis �
P. sp. � �
Dictyota D. bartaresiana �
D. cervicornis �
Sargassaceae Sargassum S. angustifolium �
Galaxauraceae Actinotrichia A. fragilis �
Avicenniaceae Avicennia A. marina � � � �
Based on Table 4, most of flora taxa were
observed either in winter or autumn, but
Padina sp. was observed both in winter and
autumn and Avicennia marina was observed
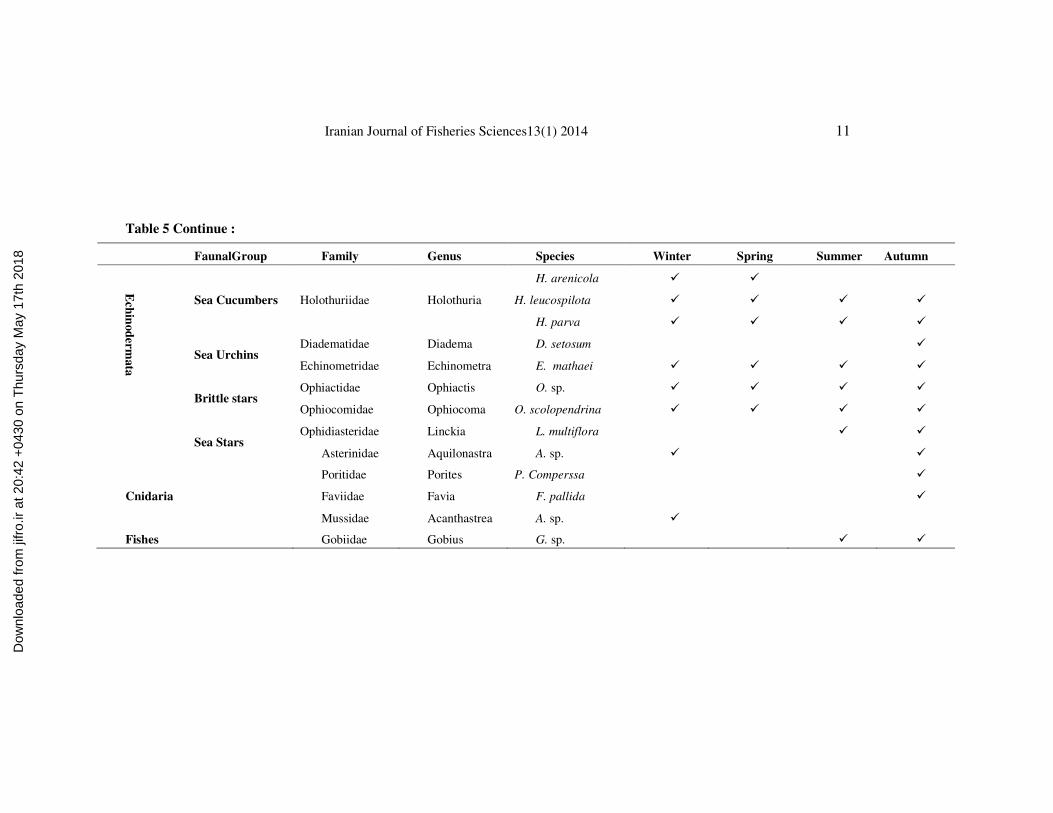
in all of the seasons. Table 5 shows that most
of the fauna were abundant in the colder
seasons (autumn / winter)
Dow
nloa
ded
from
jifr
o.ir
at 2
0:42
+04
30 o
n T
hurs
day
May
17t
h 20
18

8 Ansari et al., Ecological classification of southern intertidal zones of ...
Table 5:Observed faunal groups in southern intertidal zone of Qeshm Island
Faunal Group Family Genus Species Winter Spring Summer Autum
n
Cru
stasea
Hermit Crabs Coenobitidae Coenobita C. sp. �
Diogenidae Clibanariius C. signatus � � � �
Sand Crabs Ocypodidae
Ocypode O. rotundata � � � �
Uca U. lactea � �
Dotillidae Dotilla D. sp. � � � �
Rock Crabs
Portunidae Thalamita
T. prymna � � � �
T. crenata �
T. sp. �
Portunus P. segnis � �
Eriphidae Eriphia E. smithi � � � �
Grapsidae Grapsus
G. sp. � � �
G. albolineatus � � � �
G.granulosus � �
Xanthidae Leptodius L. exaratus �
Ocypodidae Macrophthalmus M. sp. �
Barnacles Balanidae Balanus B. sp. � � � �
Mollusks Gastropods Patellidae Patella P. sp. � � �
Dow
nloa
ded
from
jifr
o.ir
at 2
0:42
+04
30 o
n T
hurs
day
May
17t
h 20
18

Iranian Journal of Fisheries Sciences13(1) 2014 9
Table 5 Continue :
Faunal Group Family Genus Species Winter Spring Summer Autumn
Trochidae
Umbonium U. vestiarium � � � �
Trochus T. sp. � �
Osilinus O. kotschyi �
Turbinidae Turbo T. sp. � � �
Lunella L. coronata � � � �
Neritidae Nerita
N. longii � � �
N. albicilla � � � �
N. adenensis �
Planaxidae Planaxis P. sulcatus � � � �
Potamididae Cerithidea C. cingulata � � � �
Strombidae Strombus S. sp. � �
Cypraeidae Cypraea C. sp. � � � �
Thaididae Thais
T. savignyi � � � �
T. tissoti �
T. lacera �
Bursidae
Bufonaria B. echinata � �
Cronia C. konkanensis � � � �
Dow
nloa
ded
from
jifr
o.ir
at 2
0:42
+04
30 o
n T
hurs
day
May
17t
h 20
18

10 Ansari et al., Ecological classification of southern intertidal zones of ...
FaunalGroup
Table 5 Continue :
Family Genus Species Winter Spring Summer Autumn
Solenidae Solen S. roseomaculatus �
Cerithiidae Clypeomorus C. bifisciatus � � � �
Cerithium C. caeruleum � � � �
Muricidae Morula M. granulata � � � �
M. anaxares � � �
Nassariidae Nassarius N. sp. � � �
Olividae Oliva O. sp. � � � �
Conidae Conus C. sp. � � � �
Turritellidae Turritella T. sp. � �
Siphonariidae Siphonaria S. sp. � �
Bullidae Bulla B. ampulla � �
Onchididae Onchidium O. peroni �
Chitonidae Chiton C. lamyi � � �
Columbellidae Anachis A. fauroti �
Bivalves
Mytilidae Mytilus M. edulis � � �
Arcidae Barbatia B. decussata �
Veneridae Amiantis A. umbonella �
Callista C. umbonella �
Osteridae Saccostrea S. cucullata � � �
Dow
nloa
ded
from
jifr
o.ir
at 2
0:42
+04
30 o
n T
hurs
day
May
17t
h 20
18
Iranian Journal of Fisheries Sciences13(1) 2014 11
Table 5 Continue :
FaunalGroup Family Genus Species Winter Spring Summer Autumn
Ech
inod
erm
ata
Sea Cucumbers Holothuriidae Holothuria
H. arenicola � �
H. leucospilota � � � �
H. parva � � � �
Sea Urchins Diadematidae Diadema D. setosum �
Echinometridae Echinometra E. mathaei � � � �
Brittle stars Ophiactidae Ophiactis O. sp. � � � �
Ophiocomidae Ophiocoma O. scolopendrina � � � �
Sea Stars Ophidiasteridae Linckia L. multiflora � �
Asterinidae Aquilonastra A. sp. � �
Cnidaria
Poritidae Porites P. Comperssa �
Faviidae Favia F. pallida �
Mussidae Acanthastrea A. sp. �
Fishes Gobiidae Gobius G. sp. � �
Dow
nloa
ded
from
jifr
o.ir
at 2
0:42
+04
30 o
n T
hurs
day
May
17t
h 20
18

12 Ansari et al., Ecological classification of southern intertidal zones of ...
Biotic groups in all the designated sites /
stations were studied. The collected data were
initially grouped into “biotic” and “abiotic”,
and were combined into a single category
represented in Table 6. Based on CMECS
model, the Nearshore System and the
Intertidal Subsystem are represented with
[NS] and [2], respectively. Abiotic portion
(SGC) [s] in this research is based on hardness
or softness of the substrate and represented by
“Rock Shore [RS]” and “Unconsolidated
Shore [US]” classes, which are further divided
into “Bedrock [1]”, “Boulder [2]” and “Sands
[2]” subclasses. Biotic portion [b] is
represented by “Faunal Bed [FB]”, “Aquatic
Bed [AB]”, and “Forested Wetlands [FO]”
classes, which are further divided into “Sessile
Epifauna [1]”, “Mobile Epifauna [2]”,
“Infauna [3]”, “Macroalgae [1]” and
“Mangrove [2]” subclasses. Finally, 47 codes
were determined and reflected on a map
showing the distribution of biotopes (Fig. 4).
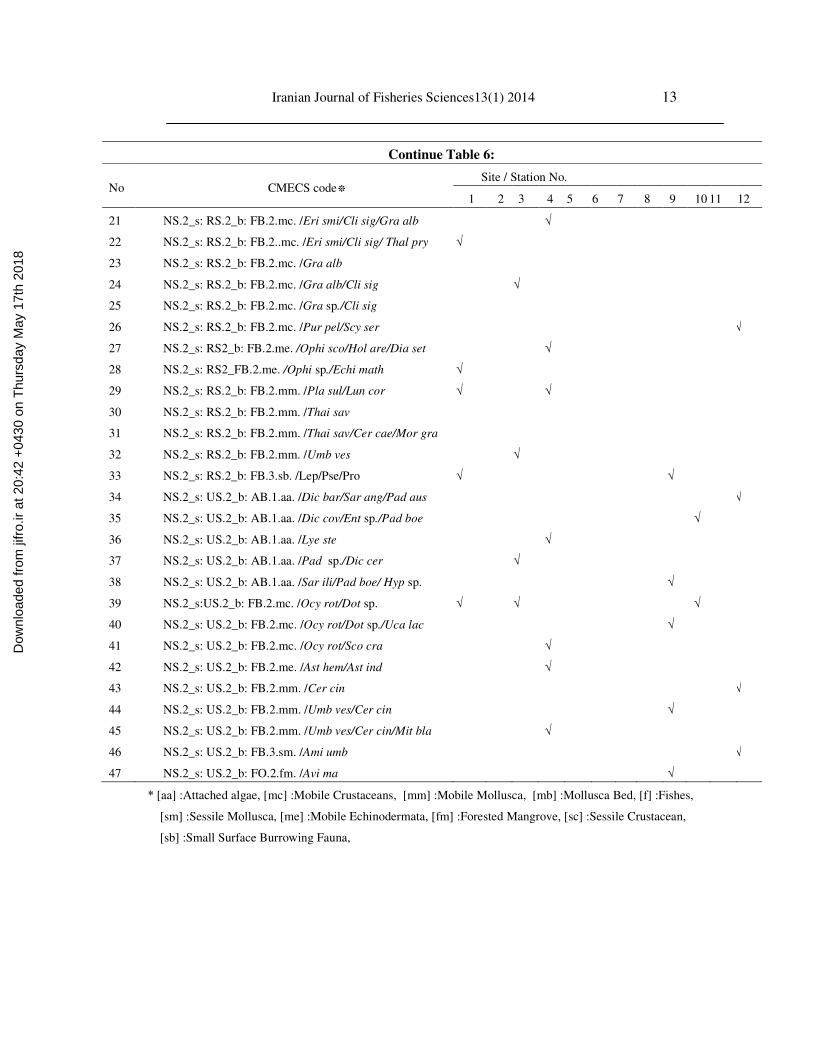
Based on Table 6, the highest number of codes
belongs to Gobius sp. with standard code
NS.2_s: RS.2_b: FB.2.f. /Gobi sp. and sand
crabs (Ocypode rotundata) with code
NS.2_s:US.2_b: FB.2.mc. /Ocy rot/Dot sp.
Table 6: Surface Geology Component and Biotic Cover Component components classification and coding
based on CMECS model in southern intertidal zone of Qeshm Island.
No CMECS code*
Site / Station No.
1 2 3 4 5 6 7 8 9 10 11 12
1 NS.1_s: RS.2_b: AB.1.aa. /Pad sp. √
2 NS.2_s: RS.1_b: AB.1.aa. /Act fra √
3 NS.2_s: RS.1_b: AB.1.aa. /Col sin √
4 NS.2_s: RS.1_b: AB.1.aa. /Dic cov/Pad boe/Lye ste √
5 NS.2_s: RS.1_b: FB1.sm. /Chit lam/Aca had √
6 NS.2_s: RS.1_b: FB.2.mc. /Eri smi/Cli sig/Thal pr √ √ √
7 NS.2_s: RS.1_b: FB.2.me. /Hol par /Ophi sco/ Echi math. √ √
8 NS.2_s: RS.1_b: FB.2.me. / Ophi sp. /Ophi sco/Echi math √
9 NS.2_s: RS.1_b: FB.2.mm. /Cer cae/Lun cor/ Thai sav √
10 NS.2_s: RS.1_b: FB.2.mm. /Lun cor/Cer Cae/Cly bif √
11 NS.2_s: RS.1_b: FB.2.mm. /Pla sul/Cer cae/Thai sav √
12 NS.2_s: RS.1_b: FB.3.sb. /Lep √ √
13 NS.2_s: RS.2_b: AB.1.aa. /Dic fri/pad boe/ Aca spi √
14 NS.2_s: RS.2_b: FB.1.mb. /Myt edu/ Sac cuc √
15 NS.2_s: RS.2_b: FB1.sc. /Bal sp. √
16 NS.2_s: RS.2_b: FB1.sm. /chit lam √
17 NS.2_s: RS.2_b: FB.1.sm. /Pat sp. √
18 NS.2_s: RS.2_b: FB.1.sm. /Sac cuc/Bar dec √
19 NS.2_s: RS.2_b: FB.1.sm. /Siph sp. √
20 NS.2_s: RS.2_b: FB.2.f. /Gobi sp. √ √ √
Dow
nloa
ded
from
jifr
o.ir
at 2
0:42
+04
30 o
n T
hurs
day
May
17t
h 20
18
Iranian Journal of Fisheries Sciences13(1) 2014 13
Continue Table 6:
No CMECS code*
Site / Station No.
1 2 3 4 5 6 7 8 9 10 11 12
21 NS.2_s: RS.2_b: FB.2.mc. /Eri smi/Cli sig/Gra alb √
22 NS.2_s: RS.2_b: FB.2..mc. /Eri smi/Cli sig/ Thal pry √
23 NS.2_s: RS.2_b: FB.2.mc. /Gra alb
24 NS.2_s: RS.2_b: FB.2.mc. /Gra alb/Cli sig √
25 NS.2_s: RS.2_b: FB.2.mc. /Gra sp./Cli sig
26 NS.2_s: RS.2_b: FB.2.mc. /Pur pel/Scy ser √
27 NS.2_s: RS2_b: FB.2.me. /Ophi sco/Hol are/Dia set √
28 NS.2_s: RS2_FB.2.me. /Ophi sp./Echi math √
29 NS.2_s: RS.2_b: FB.2.mm. /Pla sul/Lun cor √ √
30 NS.2_s: RS.2_b: FB.2.mm. /Thai sav
31 NS.2_s: RS.2_b: FB.2.mm. /Thai sav/Cer cae/Mor gra
32 NS.2_s: RS.2_b: FB.2.mm. /Umb ves √
33 NS.2_s: RS.2_b: FB.3.sb. /Lep/Pse/Pro √ √
34 NS.2_s: US.2_b: AB.1.aa. /Dic bar/Sar ang/Pad aus √
35 NS.2_s: US.2_b: AB.1.aa. /Dic cov/Ent sp./Pad boe √
36 NS.2_s: US.2_b: AB.1.aa. /Lye ste √
37 NS.2_s: US.2_b: AB.1.aa. /Pad sp./Dic cer √
38 NS.2_s: US.2_b: AB.1.aa. /Sar ili/Pad boe/ Hyp sp. √
39 NS.2_s:US.2_b: FB.2.mc. /Ocy rot/Dot sp. √ √ √
40 NS.2_s: US.2_b: FB.2.mc. /Ocy rot/Dot sp./Uca lac √
41 NS.2_s: US.2_b: FB.2.mc. /Ocy rot/Sco cra √
42 NS.2_s: US.2_b: FB.2.me. /Ast hem/Ast ind √
43 NS.2_s: US.2_b: FB.2.mm. /Cer cin √
44 NS.2_s: US.2_b: FB.2.mm. /Umb ves/Cer cin √
45 NS.2_s: US.2_b: FB.2.mm. /Umb ves/Cer cin/Mit bla √
46 NS.2_s: US.2_b: FB.3.sm. /Ami umb √
47 NS.2_s: US.2_b: FO.2.fm. /Avi ma √
* [aa] :Attached algae, [mc] :Mobile Crustaceans, [mm] :Mobile Mollusca, [mb] :Mollusca Bed, [f] :Fishes,
[sm] :Sessile Mollusca, [me] :Mobile Echinodermata, [fm] :Forested Mangrove, [sc] :Sessile Crustacean,
[sb] :Small Surface Burrowing Fauna,
Dow
nloa
ded
from
jifr
o.ir
at 2
0:42
+04
30 o
n T
hurs
day
May
17t
h 20
18

14 Ansari et al., Ecological classification of southern intertidal zone
Figure 4: Biotope distributions in the southern intertidal
Discussion
Nowadays, coastal classifications based
solely on geomorphology characteristic raise
complications and problems (Haslett, 2000).
All the world’s coasts are divisible into a
simple bifold division, viz, hard or stable and
soft or unstable (Cotton, 1954; Fairbridge,
2004). Qeshm Island is no exception to this
classification, having vast stable (rocky) and
unstable (sandy) shores. Describing the
composition of the surface substrate is a
fundamental part of any marine classification
scheme. The Surface Geology Component
(SGC) of CMECS is a first
characterization of the geology that provides
context and setting for many marine processes,
and provides soft or hard structure for benthic
fauna. Madden et al. (2009). CMECS model
Ecological classification of southern intertidal zones of ...
Biotope distributions in the southern intertidal zone of Qeshm Island, using by
Nowadays, coastal classifications based
on geomorphology characteristic raise
problems (Haslett, 2000).
All the world’s coasts are divisible into a
simple bifold division, viz, hard or stable and
soft or unstable (Cotton, 1954; Fairbridge,
2004). Qeshm Island is no exception to this
classification, having vast stable (rocky) and
Describing the
composition of the surface substrate is a
fundamental part of any marine classification
The Surface Geology Component
(SGC) of CMECS is a first-order
characterization of the geology that provides
ting for many marine processes,
and provides soft or hard structure for benthic
Madden et al. (2009). CMECS model
applications require basic biotic and
abiotic data. Abiotic data, such as SGC, is
designed to interoperate with the BCC to
provide an integrated assessment of the
physical/geological and biological aspects of
benthic cover (Madden et al., 2009).
Generally, uniform shores were located in the
mid-western and heterogeneous ones in the
mid-eastern, which could be related to wave
and wind force. Sandy beaches constitute
almost 81 km (67%) of the total 122 km
coastline covered in this study. Hara
(mangrove) forests, located in the mid
area, have not grown as well as result of
higher ratio of sand in the sediment (Table 2).
Rocky shores also exhibit a wide variety of
morphologies because several factors have
influenced their development. For example,
zone of Qeshm Island, using by GIS
applications require basic biotic and
abiotic data. Abiotic data, such as SGC, is
designed to interoperate with the BCC to
provide an integrated assessment of the
physical/geological and biological aspects of
benthic cover (Madden et al., 2009).
uniform shores were located in the
western and heterogeneous ones in the
eastern, which could be related to wave
and wind force. Sandy beaches constitute
almost 81 km (67%) of the total 122 km
coastline covered in this study. Hara
ts, located in the mid-western
area, have not grown as well as result of
higher ratio of sand in the sediment (Table 2).
Rocky shores also exhibit a wide variety of
morphologies because several factors have
influenced their development. For example,
Dow
nloa
ded
from
jifr
o.ir
at 2
0:42
+04
30 o
n T
hurs
day
May
17t
h 20
18

Iranian Journal of Fisheries Sciences13(1) 2014 15
the mid-eastern rocky coasts exhibit such
morphologies as arch, stack, and cliff that are
formed by erosion. Several processes are
involved in bedrock erosion, but the most
visible and important one is wave action,
particularly during the colder seasons. Wave
action has created numerous tide pools that
provide shelters for diverse organisms
(Stations 1, 2, 5 & 8). In addition, bioerosion
can occur when marine invertebrates such as
snails, limpets, sea urchins, and chitons abrade
the rock surface in search of food or shelter or
both. Physical characteristics of the substrate
such as grain size and Total Organic Matter
(TOM) are proving to be effective in
describing marine habitats (Table 2). Sediment
grain size is also an important factor in
regulating the distributions of infauna and
epifauna because many creatures are
dependent on a certain grade of substrate. Tait
and Dipper (1998). To create a coding system,
Surface Geology Component (SGC) classes
and subclasses were determined (in terms of
percent cover) by the dominant geologic or
biogenic cover of the substrate. Subclasses are
defined by the substrate composition and
particle size that will be used in coding,
accordingly.
During the second decade of the
twentieth century, pioneer studies of marine
benthos were initiated. Tait and Dipper
(1998). The intertidal zone encompass the
smallest area of the world’s oceans, yet it
accommodates tremendous diversity of life, as
great as or even greater than that found in the
more extensive subtidal habitats. Olenin and
Ducrotoy (2006). From pelagic environment
point of view, the sea bed provides a far wider
variety of habitats and, correspondingly, more
diverse fauna. Based on the results of this
research, 66 fauna taxa and 8 flora taxa were
identified, of which molluscs (Bivalves and
Gastropods, 37 taxa) and crustacean (16 taxa)
had the highest distribution, while
echinoderms (9 taxa) had an average
distribution. In the previous studies in
southern Qeshm Island, 65 mollusc species in
33 families Amini Yekta (2008), 19 crustacean
species in 10 families Asgari (2008), and 15
echinoderm species in 4 classes Izadi et
al.(2011) have been reported. Based on
findings of this research, Bufonaria echinata
(Gastropod), Thalamita prymna, Grapsus
granulosus and Macrophthalmus sp.
(Crustaceans), and also Aquilonaster sp.
(Echinoderm) obsereved and reported; these
species have not been reported earlier from
southern Qeshm Island. The highest diversity
in studied area was observed in the mid-
eastern region where substrates were
heterogeneous. Diversity decreased westward
as substrates became more sandy. Although
differences between communities can often be
correlated with differences in sediments size,
other factors such as light and turbidity can
also influence them. Tait and Dipper (1998).
Compared with the western sandy shore, the
mid-eastern shores are rocky-sandy and,
therefore, less disturbed by wave action,
however providing more suitable habitats for
organisms (Tables 3 & 4). There is usually a
wide diversity of species inhabiting a rocky
bottom due to its surface irregularities that
provide a great variety of microhabitats.
Crustacean species such as Eriphia smithi,
Thalamita prymna, molluscan species such as
Dow
nloa
ded
from
jifr
o.ir
at 2
0:42
+04
30 o
n T
hurs
day
May
17t
h 20
18

16 Ansari et al., Ecological classification of southern intertidal zones of ...
Clypeomorous bifisciatus, Cerithium
caeruleum and echinoderms such as
Echinometra mathaei and Ophiactis sp. can be
regarded as the rocky shores' characteristic
species.
Community and population of tidal
fauna in sandy shores mainly dwell below the
surface, but sometimes there are species which
emerge to crawl or swim. Although sandy
beach constitutes the highest coverage in the
southern Qeshm Island, diversity here was far
less than on rocky coasts of the mid-eastern of
Qeshm Island (Table 3). Macro-faunal
diversity is dependent on particle size,
gradient and wave action. Tait and Dipper
(1998). Due to available of intensive wave
action in the southern part of Qeshm Island,
sediment particles are <62 micron (silt and
clay). Thus wave action should be regarded as
a major factor in distribution of the sand
dwelling populations in southern Qeshm
Island, since it can directly or indirectly
influence many important characteristics of
the substrate, such as stability, particle size,
gradient and organic content. On the other
hand, waves can carry creatures upward or
downward in the shore to levels that could be
unsuitable for their survival. The results show
that mentioned factors are lower diversity in
the sandy shore habitats, ultimately (Tables 3,
4 & 5). Salinity is also very important for
distribution of organisms. The presence of the
salt dome adjacent to station 11 and high
salinity resulted in sandy beach species (such
as Ocypode rotundata, Dotilla sp. (Crustacea)
and Umbonium vestiarium (Mollusca).
Based on CMECS definition for biotope,
60 biotopes / habitats were identified and
mapped out (See Table 6, Fig. 4), of which
more than 65% were located in the mid-
eastern area of the Qeshm Island, and the rest
in the mid-western area. This uneven
distribution is directly related to the substrates,
being heterogeneous in the mid-eastern and
homogeneous in the mid-western shores. The
highest and lowest number of biotopes were
recorded in stations Zeitun Park (9 codes) and
back barrier (3 codes), respectively (Tables 1
& 6). Although Zeitun Park had the highest
number of biotopes, it did not possess certain
expected species (such as Diadema setosum,
Linckia multiflora, Ophiocoma scolopendrina)
that were encountered in stations with similar
surface geology. It could be attributed to
tourist traffic. Application of CMECS in
Chabahar coast (along the Oman Sea) resulted
in recording 27 habitats with 13 codes
(Shahraki et al., 2010). Fewer codes in
Chabahar than in the present study could be
attributed to the application of older version of
CMECS, and exclusion of SGC. Further,
present study and research introduce new
biotopes for echinoderms and infauna (Table
6), which not found in Oman Sea coastal
habitats. Shahraki et al. (2010). In general,
application of the CMECS model in tropical
regions, where species diversity is high, is
challenging because the biotope code may not
refer to species. Seasonal distribution of
organisms, and other details such as feeding,
reproduction, and behavior of the organisms
could also be considered in establishing a
more advanced classification. This requires a
good knowledge on the biology of the covered
Dow
nloa
ded
from
jifr
o.ir
at 2
0:42
+04
30 o
n T
hurs
day
May
17t
h 20
18

Iranian Journal of Fisheries Sciences13(1) 2014 17
organisms, many of which still remain
unknown, relatively.
It seems that intertidal area (with their
high biodiversity and vulnerability to human
activities), require special management to
reduce the impacts on macroinvertebrates.
Therefore, a classification scheme can be
useful to coastal managers because: (1) it will
provide a mechanism for identifying and
mapping habitats, especially high value ones,
in the ocean with standardized descriptions;
(2) it will facilitate communication among
scientists and managers, and; (3) it will help
habitat mapping efforts by combining spatial
information with a standardized coding system
in GIS.
In this study, 60 habitats (biotopes) with
47 codes were determined; this large number
of biotopes is directly related to diverse
surface geology (substrate) of the covered
area. The majority of biotopes were recorded
in the mid-eastern coastal stretch associated
with numerous ecological niches in rocky
shores. Crustacean species such as Eriphia
smithi, Thalamita prymna, molluscan species
such as Clypeomorous bifisciatus, Cerithium
caeruleum and Echinoderm species such as
Echinometra mathaei and Ophiactis sp. can be
regarded as the “rocky shores specific” species
while Ocypode rotundata, Dotilla sp.
(Crustacea) and Umbonium vestiarium
(Mollusca) can be regarded as the “sandy
shores specific” species. Although the greatest
number of standard codes were recorded in
Zeitun Park (adjacent to Qeshm city), this area
did not contain certain expected species (such
as Diadema setosum, Linckia multiflora,
Ophiocoma scolopendrina) that were
encountered in sites with similar surface
geology. This could be attributed to tourist
traffic in the Zeitun Park area.
Acknowledgements
The authors express their gratitude to M.
H. Ebrahimi, N. Kheirabadi and M. Dakhte
(Management of Geopark Boreo of Qeshm
Island Free Zone Organization) for their
assistance in the sampling. We would also like
to thank F. Amini Yekta, F. Aghajanpour, M.
Asgari, S. Izadi, M. Moradi, B. Gharanjik, Z.
Mirbagheri, M. Khaleghi for their valuable
assistance in species identification. We are
also greatly honored by Dr. Christopher
Madden from South Florida Water
Management District - USA and Dr. Mark
Finkbeiner from National Oceanic and
Atmospheric Administration (NOAA) - USA
for their kindly helping and answering our
questions and problems for confirmation of
the CMECS local codes.
References
Amini Yekta, F., 2008. Identification and
investigation on temporal diversity of intertidal
gastropods in southern coasts of Qeshm Island,
M.Sc thesis. Shaheed Beheshti University,
Faculty of Life Sciences, 164P.
Andrefouet, S., Kramer, P., Torres-Pulliza, D.
and Joyce, K. E., 2003. Multi-sites evaluation
of IKONOS data for classification of tropical
coral reef environments. Remote Sensing of
Environment, 88, 128-143.
Asgari, M., 2008. Identification and temporal
diversity of intertidal crabs in southern coasts
of Qeshm Island, M.S. c. thesis. Shaheed
Dow
nloa
ded
from
jifr
o.ir
at 2
0:42
+04
30 o
n T
hurs
day
May
17t
h 20
18

18 Ansari et al., Ecological classification of southern intertidal zones of ...
Beheshti University, Faculty of Life Sciences,
134P.
Banica, A., Bastard, J. and Kosiek, M., 2003.
Integrated Coastal Zone Management (ICZM).
A framework to tackle environmental issues?
Danish Approach. Centre for Environmental
Studies, The University of Aarhus, 11P.
Bosch, D., Dance, S. P., Moolenbeek, R. G. and
Oliver, P. G., 1995. Sea shells of Eastern
Arabia, Motivate Publishing, Dubai, 296P.
Capolsini, P., Andrefouet, S., Rion, C. and
Payri, C., 2003. A comparison of Landsat
ETMC, SPOT HRV, IKONOS, ASTER and
airborne MASTER data for coral reef habitat
mapping in South Pacific islands. Canadian
Journal of Remote Sensing, 29, 187-200.
Costello, M. J., 2009. Distinguishing marine
habitat classification concepts for ecological
data management. Marine Ecology Progress
Series, 397, 253-268.
Cotton, C. A., 1954. Deductive morphology and
the genetic classification of coasts. The
Scientific Monthly, 78(3), 163–181.
Diaz, R. J., Solan, M. and Valente, R. M., 2004.
A review of approaches for classifying benthic
habitats and evaluating habitat quality. Journal
of Environmental Management, 73, 165–181.
Eleftheriou, A. and McIntyre, A., 2006. Methods
for the study of marine benthos. Blackwell
Publishing, 418P.
Elliott, M., Nedwell, S., Jones, N. V., Read, S. J.,
Cutts, N. D. and Hemingway, K. L., 1998.
Intertidal sand and mud flats and subtidal
mobile sandbanks: An overview of dynamic
and sensitivity characteristics for conservation
management of marine SACs. United Kingdom
Marine SACs Project, 151P.
Fairbridge, R. W., 2004. Classification of coasts.
Journal of Coastal Research, 20(1), 155-165.
FGDC CMECS., 2012. Coastal and Marine
Ecological Classification Standard, Version 4,
Marine and Coastal Spatial Data
Subcommittee, Federal Geographic Data
Committee, 343P.
Geographical Organization affiliated to
Ministry of Defense and Armed Forces
Logistics (GOMDAF)., 2004. Geographical
feature of Iranian Islands in the Persian Gulf
(Qeshm, Larak, Hormoz, Hengam), 627P.
Gharanjik, B. M. and Rouhani Ghadikolaee, K.,
2010. Atlas of the macrophytic algae of the
Persian Gulf and Oman Sea. Iranian Fisheries
Research Organization, Tehran, 170P.
Greene, H. G., Yoklavich, M. M., Starr, R. M.
and O’Connell, V. M., 2000. A classification
scheme for deep seafloor habitats.
Oceanologica Acta, 22, 663–678.
Haslett, S. K., 2000. Coastal systems. New York,
Routledge, 218P.
Hosseinzadeh, H., Daghoghi, B. and Rameshi,
H., 2001. Atlas of the Persian Gulf Molluscs.
Iranian Fisheries Research Organization,
Tehran, 208P.
Izadi, S., Ardalan, A. A., Hosseinzadeh Sahafi,
H. and Shokri, M. R., 2011. Introducing three
species of Echinoids (order Echinoidea) in
southern intertidal zone of Qeshm Island,
Persian Gulf. Iranian Journal of Fisheries
Sciences, 20(1), 161-164.
Jones, D. A., 1986. A field guide to the sea shores
of Kuwait and the Persian Gulf, Blandford
Press, University of Kuwait, 258P.
Keefer, M. L., Peery, C. A., Wright, N., Daigle,
W. R., Caudill, C. C., Clabough, T. S.,
Griffth, D. W. and Zacharias, M. A., 2007.
Dow
nloa
ded
from
jifr
o.ir
at 2
0:42
+04
30 o
n T
hurs
day
May
17t
h 20
18

Iranian Journal of Fisheries Sciences13(1) 2014 19
Evaluating the NOAA coastal and marine
ecological classification standard in estuarine
systems: A Columbia River Estuary case study.
Estuarine, Coastal and Shelf Science, 78, 89-
106.
Kutcher, T. E., Garfield, N. H. and Raposa, K.
B., 2005 (draft). A recommendation for a
comprehensive habitat and land use
classification system for the National Estuarine
Research Reserve System. National Estuarine
Research Reserve, 19P.
Lund, K. and Wilbur, A. R., 2007. Habitat
classification feasibility study for coastal and
marine environments in Massachusetts.
Massachusetts Office of Coastal Zone
Management, Boston, MA, 63P.
Luzak, C. and Janquin, M. A., 1997. Simple
standard procedure for the routine
determination of organic matter in marine
sediment. Hydrobiologia, 354, 87-94.
Madden, C. J., Goodin, K., Allee, R., Cicchetti,
G., Moses, C., Finkbeiner, M. and Bamford,
D., 2009. Coastal and marine ecological
classification standard (version ІІІ) Nature
Serve, Virginia, Arlington, 123P.
Motamed, A., 1995. Sedimentology. University of
Tehran Publication, Vol 1, 360 P.
Olenin, S. and Ducrotoy, J. P., 2006. The concept
of biotope in marine ecology and coastal
management. Marine Pollution Bulletin, 53,
20-29.
Pinn, E. H. and Rodgers, M., 2005. Influence of
visitors on intertidal biodiversity. Journal of the
Marine Biological Association of the United
Kingdom, 85, 263-268.
Quddusi, B. and Feroz, A., 2006. An illustrated
key to the Malacostraca (Crutacea) of the
Northern Arabian Sea, Part VI, Decapoda
Anomura. Pakistan Journal of Marine
Sciences, 15, 11-79.
Shahraki, M., Savari, A., Chegini, V., Owfi, F.,
Allee, B., Fazeli, N. and Madden, C., 2010.
Standard ecological classification (CMECS) of
sensitive and vulnerable coastal habitats of
Oman Sea (Chabahar-Gowatr). Iranian Journal
of Fisheries Sciences, 18(4), 89-99.
Tait, R. V. and Dipper, F. A., 1998. Elements of
marine ecology. Keyword Publishing. Britain,
453P.
Tierney, S., 2004. Waves of change: The
Massachusetts Ocean Management Task Force
Report and Recommendations. Report
submitted to Ellen Roy Herzfelder, The
Commonwealth of Massachusetts Secretary of
Environmental Affairs. Boston, MA, 70P.
Valentine, P. C., Cochrane, G. R. and Scanlon,
K. S., 2003. Mapping the seabed and habitats in
National Marine sanctuaries-examples from the
East, Gulf, and West Coasts. Marine
Technology Society Journal, 37(1), 10-17.
Dow
nloa
ded
from
jifr
o.ir
at 2
0:42
+04
30 o
n T
hurs
day
May
17t
h 20
18