
ECOLOGICAL CHEMISTRY AND ENGINEERING Atchie.uni.opole.pl/ece_a/A_20_11/ECE_A20(11).pdf ·...
142
SOCIETY OF ECOLOGICAL CHEMISTRY AND ENGINEERING ECOLOGICAL CHEMISTRY AND ENGINEERING A CHEMIA I IN¯YNIERIA EKOLOGICZNA A Vol. 20 No. 11 OPOLE 2013
Transcript of ECOLOGICAL CHEMISTRY AND ENGINEERING Atchie.uni.opole.pl/ece_a/A_20_11/ECE_A20(11).pdf ·...
SOCIETY OF ECOLOGICAL CHEMISTRY AND ENGINEERING
ECOLOGICAL CHEMISTRY
AND ENGINEERING A
CHEMIA I IN¯YNIERIA EKOLOGICZNA A
Vol. 20 No. 11
OPOLE 2013
EDITORIAL COMMITTEE
Witold Wac³awek (Society of Ecological Chemistry and Engineering, PL) – Editor-in-Chief
Marina V. Frontasyeva (Joint Institute for Nuclear Research, Dubna, RU) – heavy metals and radionuclides
Vasil Simeonov (University of Sofia, BG) – monitoring
Maria Wac³awek (Opole University, PL) – alternative energy sources
Barbara Wiœniowska-Kielian (University of Agriculture, Kraków, PL) – agricultural chemistry
PROGRAMMING BOARD
Witold Wac³awek (Society of Ecological Chemistry and Engineering, PL) – Chairman
Jerzy Bartnicki (Meteorological Institute – DNMI, Oslo-Blindern, NO)
Mykhaylo Bratychak (National University of Technology, Lviv, UA)
Bogus³aw Buszewski (Nicolaus Copernicus University, Toruñ, PL)
Eugenija Kupcinskiene (University of Agriculture, Kaunas, LT)
Bernd Markert (International Graduate School [IHI], Zittau, DE)
Nelson Marmiroli (University, Parma, IT)
Jacek Namieœnik (University of Technology, Gdañsk, PL)
Lucjan Paw³owski (University of Technology, Lublin, PL)
Krzysztof J. Rudziñski (Institute of Physical Chemistry PAS, Warszawa, PL)
Manfred Sager (Agency for Health and Food Safety, Vienna, AT)
Mark R.D. Seaward (University of Bradford, UK)
Pavlina Simeonova (Bulgarian Academy of Sciences, Sofia, BG)
Petr Škarpa (Mendel University of Agriculture and Forestry, Brno, CZ)
Piotr Tomasik (University of Agriculture, Kraków, PL)
Roman Zarzycki (University of Technology, £ódŸ, PL)
Ma³gorzata Rajfur (Opole University, PL) – Secretary
STATISTICAL EDITORS
W³adys³aw Kamiñski (Technical University, £ódŸ, PL)
Zbigniew Ziembik (Opole University, Opole, PL)
LANGUAGE EDITOR
Ian Barnes (University of Wuppertal, Wuppertal, DE)
EDITORIAL OFFICE
Opole University
ul. kard. B. Kominka 6, 45–032 OPOLE, PL
phone: +48 77 455 91 49
email: [email protected]
SECRETARY
Ma³gorzata Rajfur
phone: +48 77 401 60 42
email: [email protected]
Copyright © by
Society of Ecological Chemistry and Engineering, Opole
Wersj¹ pierwotn¹ czasopisma jest wersja elektroniczna
Ecological Chemistry and Engineering A / Chemia i In¿ynieria Ekologiczna A
is partly financed by Ministry of Science and Higher Education, Warszawa
ISSN 1898–6188
CONTENTS
Elwira TOMCZAK and Anna DOMINIAK – A Brief History of the Water Supply
System and Water Quality in the City of Lodz . . . . . . . . . . . . . . . . 1255
Ma³gorzata RAFA£OWSKA and Katarzyna SOBCZYÑSKA-WÓJCIK – Analysis
of Temperature Conditions and Dissolved Oxygen Concentrations in the Pilwa
Bay (Lake Dobskie) . . . . . . . . . . . . . . . . . . . . . . . . . . 1265
Andrzej SKWIERAWSKI – The Use of the Integrated Trophic State Index
in Evaluation of the Restored Shallow Water Bodies . . . . . . . . . . . . . . 1275
Mariusz DUDZIAK and Marek GRYTA – Nanofiltration of Fermentation Solutions
– Unfavourable Phenomena and Membrane Cleaning . . . . . . . . . . . . . . 1285
Marek TARNAWSKI and Natalia FLORENCKA – Changeability of Heavy Metals
Content in the Sediment of the Water Reservoir in the 1996–2005 Years . . . . . . 1295
Bartosz SZEL¥G, Jaros³aw GÓRSKI, £ukasz B¥K and Katarzyna GÓRSKA
– Modelling of Stormwater Quantity and Quality on the Example of Urbanised
Catchment in Kielce . . . . . . . . . . . . . . . . . . . . . . . . . . 1305
Piotr GODYÑ, Maria ZIELIÑSKA, Agnieszka DO£HAÑCZUK-ŒRÓDKA, Zbigniew
ZIEMBIK and Tadeusz MAJCHERCZYK – Study of the Excessive Pb-210
Content in Soil . . . . . . . . . . . . . . . . . . . . . . . . . . . . 1317
Ryszard MAZUREK and Pawe³ ZADRO¯NY – Sulphur in the Forest Soils
of the Ojcow National Park . . . . . . . . . . . . . . . . . . . . . . . 1327
Katarzyna SO£EK-PODWIKA – Soil Enzymatic Activity in the Impact Zone
of Sulphur Compounds Emission . . . . . . . . . . . . . . . . . . . . . 1335
Janusz Ryszard MROCZEK and Joanna KOSTECKA – Effect of Saponin Extract
on Vermicomposting of Selected Organic Waste . . . . . . . . . . . . . . . . 1343
Barbara FILIPEK-MAZUR, Andrzej LEPIARCZYK and Monika TABAK – Nitrogen
and Sulphur Fertilization on Yielding and Zinc Content in Seeds of Winter Rape
‘Baldur’ Cultivar . . . . . . . . . . . . . . . . . . . . . . . . . . . 1351
Antoni ROGÓ¯, Barbara WIŒNIOWSKA-KIELIAN and Monika TABAK – Lithium
Content in Selected Root Vegetables against Its Content in Soil . . . . . . . . . . 1359
Ma³gorzata KOSTECKA and Monika BOJANOWSKA – Mold Contamination
of Commercially Available Herbal Products and Dietary Supplements of Plant
Origin . . . . . . . . . . . . . . . . . . . . . . . . . . . . . . . 1369

VARIA
Invitation for ECOpole ’14 Conference . . . . . . . . . . . . . . . . . . . . 1383
Zaproszenie na Konferencjê ECOpole ’14 . . . . . . . . . . . . . . . . . . . 1385
Guide for Authors . . . . . . . . . . . . . . . . . . . . . . . . . . . . 1387
SPIS TREŒCI
Elwira TOMCZAK i Anna DOMINIAK – Historyczne zmiany struktury sieci
wodoci¹gowej na tle utrzymania standardów wody pitnej dla miasta £odzi . . . . . . 1255
Ma³gorzata RAFA£OWSKA i Katarzyna SOBCZYÑSKA-WÓJCIK – Analiza warunków
termiczno-tlenowych wód w Zatoce Pilwa (jezioro Dobskie) . . . . . . . . . . . 1265
Andrzej SKWIERAWSKI – Zastosowanie integralnego wskaŸnika stanu troficznego
do oceny odtworzonych p³ytkich zbiorników . . . . . . . . . . . . . . . . . 1275
Mariusz DUDZIAK i Marek GRYTA – Nanofiltracja roztworów fermentacyjnych
– zjawiska niekorzystne oraz czyszczenie membran . . . . . . . . . . . . . . 1285
Marek TARNAWSKI i Natalia FLORENCKA – Zmiennoœæ zawartoœci metali
ciê¿kich w osadach dennych zbiornika wodnego w latach 1996–2005 . . . . . . . . 1295
Bartosz SZEL¥G, Jaros³aw GÓRSKI, £ukasz B¥K i Katarzyna GÓRSKA
– Modelowanie iloœci i jakoœci œcieków deszczowych na przyk³adzie zlewni
zurbanizowanej w Kielcach . . . . . . . . . . . . . . . . . . . . . . . 1305
Piotr GODYÑ, Maria ZIELIÑSKA, Agnieszka DO£HAÑCZUK-ŒRÓDKA, Zbigniew
ZIEMBIK i Tadeusz MAJCHERCZYK – Badanie zawartoœci nadmiarowego Pb-210
w glebie . . . . . . . . . . . . . . . . . . . . . . . . . . . . . . 1317
Ryszard MAZUREK i Pawe³ ZADRO¯NY – Siarka w glebach leœnych Ojcowskiego
Parku Narodowego . . . . . . . . . . . . . . . . . . . . . . . . . . 1327
Katarzyna SO£EK-PODWIKA – Aktywnoœæ enzymatyczna gleb w strefie oddzia³ywania
emisji zwi¹zków siarki . . . . . . . . . . . . . . . . . . . . . . . . . 1335
Janusz Ryszard MROCZEK i Joanna KOSTECKA – Wp³yw ekstraktu saponinowego
na wermikompostowanie wybranych odpadów organicznych . . . . . . . . . . . 1343
Barbara FILIPEK-MAZUR, Andrzej LEPIARCZYK i Monika TABAK – Wp³yw
nawo¿enia azotem i siark¹ na plonowanie i zawartoœæ cynku w nasionach rzepaku
ozimego odmiany ‘Baldur’ . . . . . . . . . . . . . . . . . . . . . . . . 1351
Antoni ROGÓ¯, Barbara WIŒNIOWSKA-KIELIAN i Monika TABAK – Zawartoœæ
litu w wybranych warzywach korzeniowych na tle jego zawartoœci w glebie . . . . . 1359
Ma³gorzata KOSTECKA i Monika BOJANOWSKA – Zagro¿enie zanieczyszczenia
grzybami pleœniowymi zió³ oraz suplementów diety pochodzenia roœlinnego
dostêpnych na rynku . . . . . . . . . . . . . . . . . . . . . . . . . . 1369

VARIA
Invitation for ECOpole ’14 Conference . . . . . . . . . . . . . . . . . . . . 1383
Zaproszenie na Konferencjê ECOpole ’14 . . . . . . . . . . . . . . . . . . . 1385
Guide for Authors . . . . . . . . . . . . . . . . . . . . . . . . . . . . 1387
Elwira TOMCZAK1* and Anna DOMINIAK2
A BRIEF HISTORY OF THE WATER SUPPLY SYSTEM
AND WATER QUALITY IN THE CITY OF LODZ
HISTORYCZNE ZMIANY STRUKTURY SIECI WODOCI¥GOWEJ
NA TLE UTRZYMANIA STANDARDÓW WODY PITNEJ
DLA MIASTA £ODZI
Abstract: Poland’s third largest city, Lodz, underwent rapid industrial and demographic growth in the 19th
and 20th centuries, followed by a steep decline over the last three decades. This paper describes how the water
supply system has been adapted over the last century to meet these challenges, and in particular how the
source of water (surface or underground) and structure of the supply system has been adapted to maintain
drinking water quality. The Lodz water supply has been managed since 1925 by the firm Zaklad Wodociagow
i Kanalizacji Sp. z o.o. The water supply system was designed by the Englishman William H. Lindley (in
1909), but because of World War I and the global depression that followed work began only in 1934. After
World War II further deep wells were constructed, followed by a pipeline network and treatment plant.
A 50-kilometre pipeline bringing surface water from the Pilica River was completed in 1955, followed by the
Sulejowski Reservoir on the same river (1968–1973). Algal blooms on the reservoir presented a major
challenge, and deep wells were turned to as a solution. By 2010 Lodz had 58 deep well intakes, so that in
2013 it was no longer necessary to take taking surface water from the Sulejowski Reservoir.
Keywords: Lodz water supply system, exploitation of water, drinking water quality
Introduction
Poland’s third largest city, Lodz (2011 population 728,892; metropolitan population
1,428,600), is located in the drainage basin of the Vistula and Oder (Odra) rivers, in the
catchment area of two substantial watercourses: the Bzura, a tributary of the Vistula,
and the Ner, a tributary of the Oder. This richly watered area was favourable to
settlement and the emergence of the first textile manufactories. The rapid development
of Lodz as a textile centre in the nineteenth and early twentieth centuries resulted in the
intensive exploitation of the region’s natural water resources and a drastic decline in the
DOI: 10.2428/ecea.2013.20(11)113 ECOL CHEM ENG A. 2013;20(11):1255-1264
1 Faculty of Process and Environmental Engineering, Lodz University of Technology, ul. Wólczañska 213,
90–924 £ódŸ, Poland, phone: +48 42 631 37 88, email: [email protected] Municipal Water and Wastewater Company, 90–133 £ódŸ, Wierzbowa 52, Poland.
* Corresponding author: [email protected]
quality of groundwater. The industrialisation of the city, river regulation works, and the
changing course of the rivers together with the drainage of wetlands led to major
changes in the hydrographical map of the region.
The creation of an urban water supply system satisfied the basic needs of residents
and industry, but the continued growth of the city necessitated a search for ample and
reliable (albeit distant) sources of drinking water and the construction of an infra-
structure of wells, water treatment plants and a network of distribution pipelines. New
technologies were constantly developed to ensure the inhabitants were supplied with the
appropriate amount of water of the highest possible quality.
In 1909 the Lodz city authorities commissioned the renowned English civil engineer
Sir William Heerlein Lindley (1853–1917) to design water and sewerage systems for
the city. He pointed out the following potential sources of water:
1. Water-bearing chalk layers of the Upper Jurassic in the area north of Tomaszow
Mazowiecki – Sulejow, and subterranean water in the vicinity of Lodz.
2. Water-bearing layers of the Quaternary period to the northwest of the Pilica River
and the south and southwest of Lodz.
3. Surface water from the Pilica River.
Besides the needs of industry, which had its own water intakes, Lindley estimated the
city’s future daily water requirements at 154,000 cubic metres, assuming a million
inhabitants each consuming 130–200 litres per day.
Lindley’s design was ready by 30 October 1909, and in November plans at a scale of
1:10,000 of water mains and sewers were completed using the then novel technique of
heliography.
In 1901, Lodz had a population of 310,000, but in 1908 the Russian authorities
incorporated several villages and suburbs within the city boundaries, so that by 1911 the
population exceeded 450,000. During the First World War the German occupying
authorities conducted another large incorporation of lands within the city limits in 1915.
Lodz was then the most densely populated city in Poland, with 10,439 inhabitants per
square kilometre. A large number of these people were reliant solely on water from
individual shallow wells, which were often contaminated. The sub-surface aquifer
supplying these wells was slowly running dry as a result of widespread demand and
ever increasing consumption from numerous textile factories.
Development of the Lodz water supply network
In 1925 the operation, treatment and distribution of the Lodz water supply was
entrusted to the Municipal Water and Wastewater Company (ZWiK). However, as
a result of World War I and the global economic crisis, work on the Lodz water supply
system began only in 1934, under the supervision of the engineer Stefan Skrzywan, and
the cheapest possible version – based on deep wells – was chosen.
The initial phase required the drilling of five wells and construction of a 100-km
network of pipes. A pumping station and iron removal facility was to be built at
Dabrowa connected by pipelines to wells and a drinking-water reservoir at Stoki, from
which, via three water mains and a network of distribution pipes, water would be fed by
gravity to the city.
1256 Elwira Tomczak and Anna Dominiak
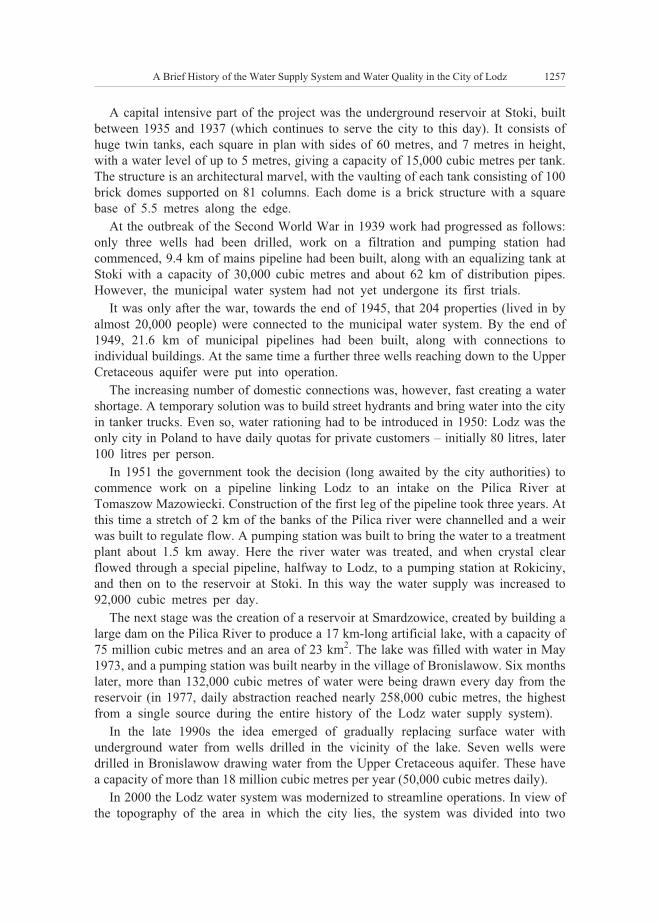
A capital intensive part of the project was the underground reservoir at Stoki, built
between 1935 and 1937 (which continues to serve the city to this day). It consists of
huge twin tanks, each square in plan with sides of 60 metres, and 7 metres in height,
with a water level of up to 5 metres, giving a capacity of 15,000 cubic metres per tank.
The structure is an architectural marvel, with the vaulting of each tank consisting of 100
brick domes supported on 81 columns. Each dome is a brick structure with a square
base of 5.5 metres along the edge.
At the outbreak of the Second World War in 1939 work had progressed as follows:
only three wells had been drilled, work on a filtration and pumping station had
commenced, 9.4 km of mains pipeline had been built, along with an equalizing tank at
Stoki with a capacity of 30,000 cubic metres and about 62 km of distribution pipes.
However, the municipal water system had not yet undergone its first trials.
It was only after the war, towards the end of 1945, that 204 properties (lived in by
almost 20,000 people) were connected to the municipal water system. By the end of
1949, 21.6 km of municipal pipelines had been built, along with connections to
individual buildings. At the same time a further three wells reaching down to the Upper
Cretaceous aquifer were put into operation.
The increasing number of domestic connections was, however, fast creating a water
shortage. A temporary solution was to build street hydrants and bring water into the city
in tanker trucks. Even so, water rationing had to be introduced in 1950: Lodz was the
only city in Poland to have daily quotas for private customers – initially 80 litres, later
100 litres per person.
In 1951 the government took the decision (long awaited by the city authorities) to
commence work on a pipeline linking Lodz to an intake on the Pilica River at
Tomaszow Mazowiecki. Construction of the first leg of the pipeline took three years. At
this time a stretch of 2 km of the banks of the Pilica river were channelled and a weir
was built to regulate flow. A pumping station was built to bring the water to a treatment
plant about 1.5 km away. Here the river water was treated, and when crystal clear
flowed through a special pipeline, halfway to Lodz, to a pumping station at Rokiciny,
and then on to the reservoir at Stoki. In this way the water supply was increased to
92,000 cubic metres per day.
The next stage was the creation of a reservoir at Smardzowice, created by building a
large dam on the Pilica River to produce a 17 km-long artificial lake, with a capacity of
75 million cubic metres and an area of 23 km2. The lake was filled with water in May
1973, and a pumping station was built nearby in the village of Bronislawow. Six months
later, more than 132,000 cubic metres of water were being drawn every day from the
reservoir (in 1977, daily abstraction reached nearly 258,000 cubic metres, the highest
from a single source during the entire history of the Lodz water supply system).
In the late 1990s the idea emerged of gradually replacing surface water with
underground water from wells drilled in the vicinity of the lake. Seven wells were
drilled in Bronislawow drawing water from the Upper Cretaceous aquifer. These have
a capacity of more than 18 million cubic metres per year (50,000 cubic metres daily).
In 2000 the Lodz water system was modernized to streamline operations. In view of
the topography of the area in which the city lies, the system was divided into two
A Brief History of the Water Supply System and Water Quality in the City of Lodz 1257
pressure zones. The northern part is gravity fed with water from the reservoir at Stoki.
Here the water is a mainly sourced from deep wells together with a small amount of
Pilica River water from the intake at Tomaszow Mazowiecki. The southern part of the
city, which is smaller both in terms of area and population, is supplied entirely from
deep wells in Bronislawow.
In all there are 43 wells within the city or on its outskirts; in 22 of these wells the
water is so good that it requires no treatment. Lodz also makes use of eight wells in
Rokiciny, seven in the vicinity of the Sulejowski Reservoir, and the intake on the Pilica
River at Tomaszów Mazowiecki, though by 2010 the total contribution of the latter to
the Lodz water supply amounted to only about 10 % [1].
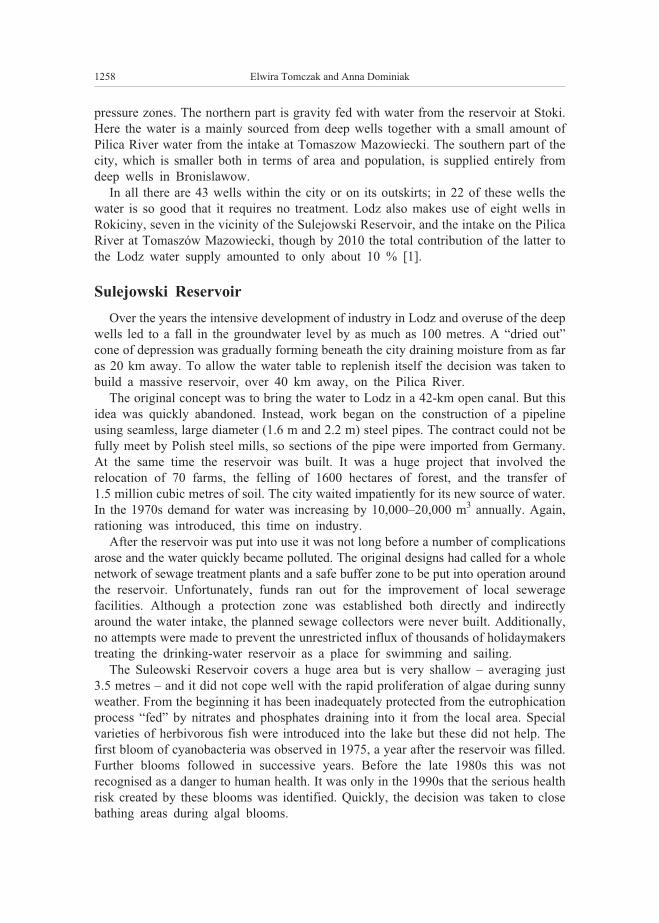
Sulejowski Reservoir
Over the years the intensive development of industry in Lodz and overuse of the deep
wells led to a fall in the groundwater level by as much as 100 metres. A “dried out”
cone of depression was gradually forming beneath the city draining moisture from as far
as 20 km away. To allow the water table to replenish itself the decision was taken to
build a massive reservoir, over 40 km away, on the Pilica River.
The original concept was to bring the water to Lodz in a 42-km open canal. But this
idea was quickly abandoned. Instead, work began on the construction of a pipeline
using seamless, large diameter (1.6 m and 2.2 m) steel pipes. The contract could not be
fully meet by Polish steel mills, so sections of the pipe were imported from Germany.
At the same time the reservoir was built. It was a huge project that involved the
relocation of 70 farms, the felling of 1600 hectares of forest, and the transfer of
1.5 million cubic metres of soil. The city waited impatiently for its new source of water.
In the 1970s demand for water was increasing by 10,000–20,000 m3 annually. Again,
rationing was introduced, this time on industry.
After the reservoir was put into use it was not long before a number of complications
arose and the water quickly became polluted. The original designs had called for a whole
network of sewage treatment plants and a safe buffer zone to be put into operation around
the reservoir. Unfortunately, funds ran out for the improvement of local sewerage
facilities. Although a protection zone was established both directly and indirectly
around the water intake, the planned sewage collectors were never built. Additionally,
no attempts were made to prevent the unrestricted influx of thousands of holidaymakers
treating the drinking-water reservoir as a place for swimming and sailing.
The Suleowski Reservoir covers a huge area but is very shallow – averaging just
3.5 metres – and it did not cope well with the rapid proliferation of algae during sunny
weather. From the beginning it has been inadequately protected from the eutrophication
process “fed” by nitrates and phosphates draining into it from the local area. Special
varieties of herbivorous fish were introduced into the lake but these did not help. The
first bloom of cyanobacteria was observed in 1975, a year after the reservoir was filled.
Further blooms followed in successive years. Before the late 1980s this was not
recognised as a danger to human health. It was only in the 1990s that the serious health
risk created by these blooms was identified. Quickly, the decision was taken to close
bathing areas during algal blooms.
1258 Elwira Tomczak and Anna Dominiak
Research showed that cyanobacterial toxins in the water could be effectively
removed during the purification process. Maximum effort was made in bringing water
drawn from the reservoir up to legal standards. A treatment plant (at Kalinko) was daily
consuming dozens of tons of chemicals, ranging from chlorine, aluminium sulphate and
activated silica to lime and activated carbon. It quickly became clear that, in its existing
form, the reservoir would never be a source of good clean water.
In the search for an alternative source of drinking water for Lodz it was decided to
build deep wells near the Sulejowski Reservoir, at Bronislawow. In all seven wells were
successively drilled down to the Upper Cretaceous aquifer, providing a total daily
capacity of 50,000 m3.
Changes in the quality of Lodz drinking water, 1945–2013
To reflect the influence that the source of water has on the quality of the tap water
delivered to customers over this period, five indicators of water quality are taken into
account in this paper: colour, turbidity, dissolved oxygen, and the content of iron and
manganese [1–5]. These are typical of the water quality parameters inspected by the
ZWiK laboratory.
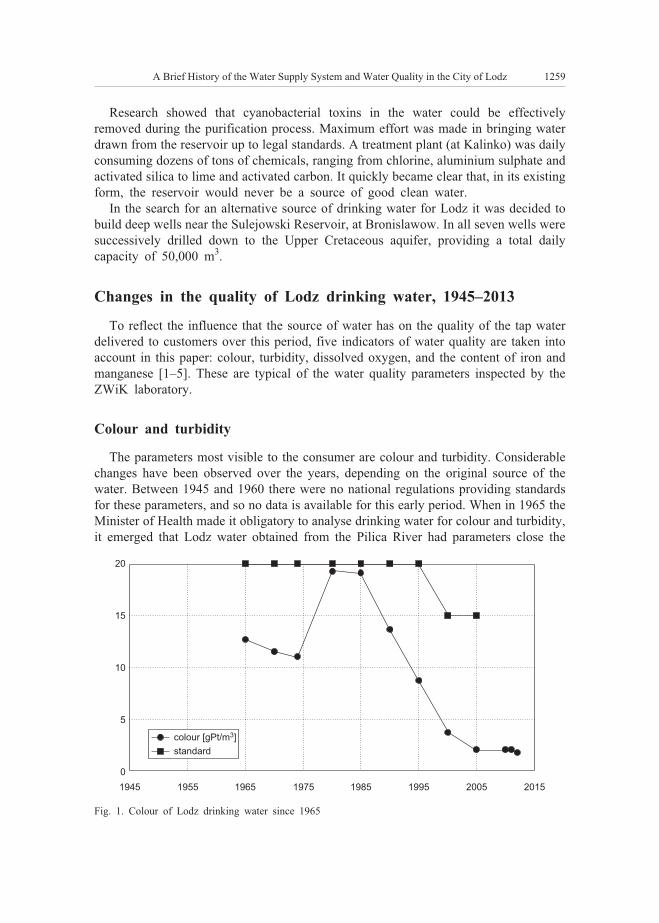
Colour and turbidity
The parameters most visible to the consumer are colour and turbidity. Considerable
changes have been observed over the years, depending on the original source of the
water. Between 1945 and 1960 there were no national regulations providing standards
for these parameters, and so no data is available for this early period. When in 1965 the
Minister of Health made it obligatory to analyse drinking water for colour and turbidity,
it emerged that Lodz water obtained from the Pilica River had parameters close the
A Brief History of the Water Supply System and Water Quality in the City of Lodz 1259
Fig. 1. Colour of Lodz drinking water since 1965
20
15
10
5
0
1945 1955 1965 1975 1985 1995 2005 2015
colour [gPt/m ]3
standard
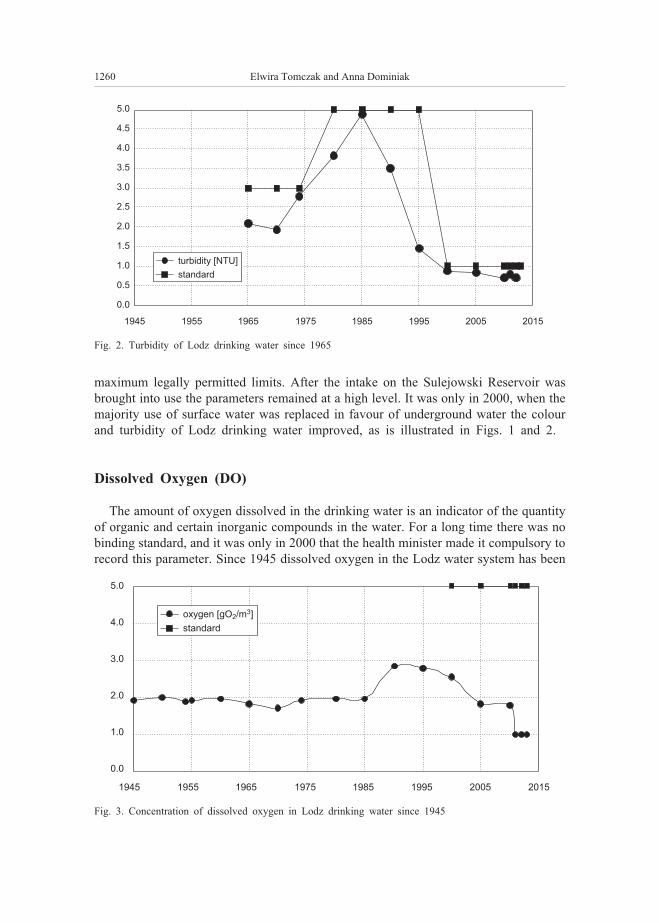
maximum legally permitted limits. After the intake on the Sulejowski Reservoir was
brought into use the parameters remained at a high level. It was only in 2000, when the
majority use of surface water was replaced in favour of underground water the colour
and turbidity of Lodz drinking water improved, as is illustrated in Figs. 1 and 2.
Dissolved Oxygen (DO)
The amount of oxygen dissolved in the drinking water is an indicator of the quantity
of organic and certain inorganic compounds in the water. For a long time there was no
binding standard, and it was only in 2000 that the health minister made it compulsory to
record this parameter. Since 1945 dissolved oxygen in the Lodz water system has been
1260 Elwira Tomczak and Anna Dominiak
Fig. 2. Turbidity of Lodz drinking water since 1965
5.0
4.5
4.0
3.5
3.0
2.5
2.0
1.5
1.0
0.5
0.0
1945 1955 1965 1975 1985 1995 2005 2015
standard
turbidity [NTU]
Fig. 3. Concentration of dissolved oxygen in Lodz drinking water since 1945
5.0
4.0
3.0
2.0
1.0
0.0
1945 1955 1965 1975 1985 1995 2005 2015
standard
oxygen [gO /m ]23
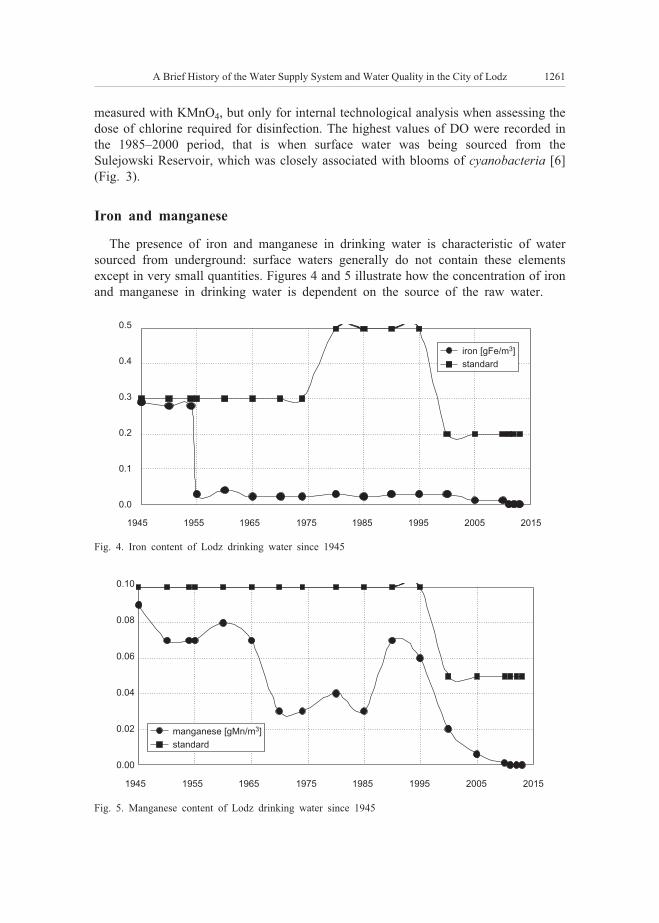
measured with KMnO4, but only for internal technological analysis when assessing the
dose of chlorine required for disinfection. The highest values of DO were recorded in
the 1985–2000 period, that is when surface water was being sourced from the
Sulejowski Reservoir, which was closely associated with blooms of cyanobacteria [6]
(Fig. 3).
Iron and manganese
The presence of iron and manganese in drinking water is characteristic of water
sourced from underground: surface waters generally do not contain these elements
except in very small quantities. Figures 4 and 5 illustrate how the concentration of iron
and manganese in drinking water is dependent on the source of the raw water.
A Brief History of the Water Supply System and Water Quality in the City of Lodz 1261
Fig. 4. Iron content of Lodz drinking water since 1945
1945 1955 1965 1975 1985 1995 2005 2015
0.5
0.4
0.3
0.2
0.1
0.0
standard
iron [gFe/m ]3
Fig. 5. Manganese content of Lodz drinking water since 1945
1945 1955 1965 1975 1985 1995 2005 2015
0.10
0.08
0.06
0.04
0.02
0.00
standard
manganese [gMn/m ]3
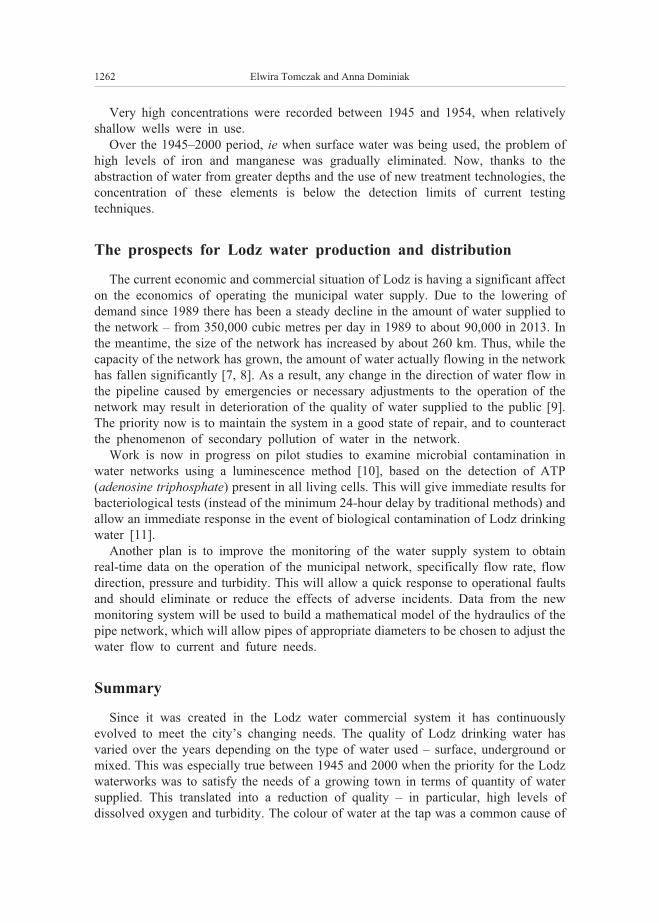
Very high concentrations were recorded between 1945 and 1954, when relatively
shallow wells were in use.
Over the 1945–2000 period, ie when surface water was being used, the problem of
high levels of iron and manganese was gradually eliminated. Now, thanks to the
abstraction of water from greater depths and the use of new treatment technologies, the
concentration of these elements is below the detection limits of current testing
techniques.
The prospects for Lodz water production and distribution
The current economic and commercial situation of Lodz is having a significant affect
on the economics of operating the municipal water supply. Due to the lowering of
demand since 1989 there has been a steady decline in the amount of water supplied to
the network – from 350,000 cubic metres per day in 1989 to about 90,000 in 2013. In
the meantime, the size of the network has increased by about 260 km. Thus, while the
capacity of the network has grown, the amount of water actually flowing in the network
has fallen significantly [7, 8]. As a result, any change in the direction of water flow in
the pipeline caused by emergencies or necessary adjustments to the operation of the
network may result in deterioration of the quality of water supplied to the public [9].
The priority now is to maintain the system in a good state of repair, and to counteract
the phenomenon of secondary pollution of water in the network.
Work is now in progress on pilot studies to examine microbial contamination in
water networks using a luminescence method [10], based on the detection of ATP
(adenosine triphosphate) present in all living cells. This will give immediate results for
bacteriological tests (instead of the minimum 24-hour delay by traditional methods) and
allow an immediate response in the event of biological contamination of Lodz drinking
water [11].
Another plan is to improve the monitoring of the water supply system to obtain
real-time data on the operation of the municipal network, specifically flow rate, flow
direction, pressure and turbidity. This will allow a quick response to operational faults
and should eliminate or reduce the effects of adverse incidents. Data from the new
monitoring system will be used to build a mathematical model of the hydraulics of the
pipe network, which will allow pipes of appropriate diameters to be chosen to adjust the
water flow to current and future needs.
Summary
Since it was created in the Lodz water commercial system it has continuously
evolved to meet the city’s changing needs. The quality of Lodz drinking water has
varied over the years depending on the type of water used – surface, underground or
mixed. This was especially true between 1945 and 2000 when the priority for the Lodz
waterworks was to satisfy the needs of a growing town in terms of quantity of water
supplied. This translated into a reduction of quality – in particular, high levels of
dissolved oxygen and turbidity. The colour of water at the tap was a common cause of
1262 Elwira Tomczak and Anna Dominiak
customer complaints, especially while water was being drawn from the Sulejowski
Reservoir.
The quality of Lodz tap water continues to be inspected regularly. Water is sampled
at treatment stations and when drawn into the water system, and also directly from
pipelines at nearly a hundred locations throughout the city. Dozens of parameters are
tested at the company’s laboratories.
A further safeguard is provided by so called bio-monitors – fish (perch) and mussels
that live in aquariums at eleven different facilities belonging to the firm. Water intended
for Lodz’s households flows continuously through the aquariums, and perch and
mussels are extremely sensitive to changes in water quality and to pollutants that might
pose a danger to human health. Since 2009 the mussels have been monitored by special
equipment that provides constant information on their wellbeing.
Since 2000, that is since the closure of the largest water-consuming industrial
customers, the problem has mainly been one of the excess of water in the system.
Besides the ageing infrastructure at intake points and treatment plants, dealing with the
oversize pipelines and stagnant water in the network has been a challenge. These
problems have largely been overcome so that today the water drawn from deep wells is
some of the best drinking water supplied to residents anywhere in Poland.
References
[1] Archive and internal documents of the ZWiK, £ódŸ: Archive of the ZWiK; 1920-2013.
[2] Regulation of the Minister for Health and Social Welfare dated 4 May 1990 amending the regulation on
the standards to be met by water for drinking and for commercial purposes. Journal of Laws 1990,
No 35, item 205.
[3] Regulation of the Minister for Health dated 4 September 2000: On the conditions that should be met by
water for drinking and for commercial purposes and water in bathing areas, and the basis for conducting
water quality inspections by Health Inspectorate bodies. Journal of Laws 2000, No 82, item 937.
[4] Regulation of the Minister for Health dated 29 March 2007: On the quality of water intended for human
consumption. Journal of Laws 2007, No 61, item 417.
[5] Regulation of the Minister for Health dated 20 April 2010 amending the regulation on the quality of
water intended for human consumption. Journal of Laws 2010, No 72, item 466.
[6] Œwierk D, Szpakowska B. An ecosystem valuation method for small water bodies. Ecol Chem Eng S.
2013:20(2):397-418. DOI: 10.2478/eces-2013-0029.
[7] Tynan N. Nineteenth century London water supply: Processes of innovation and improvement. The
Review of Austrian Economics. 2013:26(1):73-91. DOI 10.1007/s11138-012-0182-8.
[8] Bruggen B, Borghgraef K, Vinckier C. Causes of water supply problems in urbanised regions in
developing countries. Water Res Manage. 2010:24(9):1885-1902. DOI: 10.1007/s11269-009-9529-8.
[9] Patterson C, Adams J. Emergency response planning to reduce the impact of contaminated drinking
water during natural disasters. Frontiers of Earth Sci. 2011:5(4):341-349.
DOI: 10.1007/s11707-011-0196-8.
[10] Chmiel MJ. Metoda luminescencyjna jako alternatywa w badaniach zanieczyszczenia bakteriolo-
gicznego wody. Gaz, Woda i Technika Sanitarna. 2012;539-541.
[11] Goncharuk VV, Kovalenko VF, Zlatskii IA. Comparative analysis of drinking water quality of different
origin based on the results of integrated bioassay. J Water Chem Technol. 2012:34(1):61-64.
DOI: 10.3103/S1063455X12010092.
A Brief History of the Water Supply System and Water Quality in the City of Lodz 1263
HISTORYCZNE ZMIANY STRUKTURY SIECI WODOCI¥GOWEJ
NA TLE UTRZYMANIA STANDARDÓW WODY PITNEJ DLA MIASTA £ODZI
Wydzia³ In¿ynierii Procesowej i Ochrony Œrodowiska
Politechnika £ódzka
Abstrakt: Projekt ³ódzkiej sieci wodoci¹gowej, wykonany przez najlepszego europejskiego fachowca
W. Lindleya, powsta³ ju¿ w 1909 r. Realizacjê rozpoczêto w 1934 r., przy wspó³udziale polskiego in¿yniera
S. Skrzywana. Po II wojnie œwiatowej dokonano wiercenia dalszych studni g³êbinowych i zbudowano system
wodoci¹gowy oraz stacjê uzdatniania wody. Zbudowano 50 km ruroci¹gu Tomaszów–£ódŸ (1955 r.),
zbiornik retencyjny na Pilicy (1968–1973) i kolejne studnie g³êbinowe. W 2010 r. istnia³o ju¿ 58 ujêæ wód
podziemnych dlatego te¿ w 2013 r. zapad³a decyzja o rezygnacji z ujmowania wody powierzchniowej z Za-
lewu Sulejowskiego. Celem pracy by³o przedstawienie miejsc pobierania wody i struktury sieci wodo-
ci¹gowej, której budowa ulega³a zmianom w zale¿noœci od potrzeb i rozwoju du¿ego miasta, w powi¹zaniu
z uzyskiwaniem wody pitnej najwy¿szej jakoœci. Piecze nad eksploatacj¹ i dystrybucj¹ nieprzerwanie od
1925 r. sprawuje Zak³ad Wodoci¹gów i Kanalizacji Sp. z o.o. w £odzi.
S³owa kluczowe: wodoci¹g ³ódzki, eksploatacja wody, jakoœæ wody pitnej
1264 Elwira Tomczak and Anna Dominiak
Ma³gorzata RAFA£OWSKA1* and Katarzyna SOBCZYÑSKA-WÓJCIK1
ANALYSIS OF TEMPERATURE CONDITIONS
AND DISSOLVED OXYGEN CONCENTRATIONS
IN THE PILWA BAY (LAKE DOBSKIE)
ANALIZA WARUNKÓW TERMICZNO-TLENOWYCH WÓD
W ZATOCE PILWA (JEZIORO DOBSKIE)
Abstract: This study was carried out in the Pilwa Bay of Lake Dobskie located in the mesoregion known as
the Land of Great Masurian Lakes, Gizycko district. Temperature and oxygen conditions in the western,
central and eastern (connected to Lake Dobskie) parts of the Pilwa Bay were studied by analyzing the vertical
distribution of temperature and dissolved oxygen concentrations in the winter and summer seasons of three
consecutive years (2005–2007). Measurements were performed using the WTW OxiTop OC 100 system with
automatic temperature compensation.
During winter stagnation, the highest dissolved oxygen content was noted in the top water layer under ice
cover, and oxygen concentrations varied widely between years. An analysis of temperature and oxygen
profiles revealed an insignificant temperature difference of approximately 1–2 oC between the surface and
bottom layers of water, which indicates that the studied bay was not characterized by a summer stratification
pattern typical of deep water bodies.
Keywords: temperature and oxygen profiles, thermal stratification, bay
Introduction
Water heats and cools slowly, and it exhibits smaller changes in temperature than air.
The above implies that lake ecosystems provide a more supportive environment for the
growth of aquatic organisms than land habitats.
The temperature of surface (standing) waters is determined by the depth of the water
body, the movement and mixing of waters. Temperature is a key factor conditioning the
metabolic activity of aquatic organisms. It affects the solubility of chemical compounds
in water, and it supports thermal stratification. The accumulation of thermal energy in
DOI: 10.2428/ecea.2013.20(11)114 ECOL CHEM ENG A. 2013;20(11):1265-1273
1 Department of Land Reclamation and Environmental Management, University of Warmia and Mazury in
Olsztyn, pl. £ódzki 2, 10–957 Olsztyn, Poland, phone: +48 89 523 39 92, email: malgorzata.rafalow-
* Corresponding author: [email protected]
lakes is determined by various processes, mostly direct absorption of solar radiation,
transfer of energy from the sediment layer, transfer of energy from the surrounding land
and the metabolic activity of organisms.
During summer stagnation, surface waters in the epilimnion zone are mixed by the
wind, and they are characterized by relatively uniform temperature and oxygen
concentrations. The thickness of the epilimnion layer is determined mostly by weather
conditions in a given year, the size of the water body and its location relative to wind
direction. At a certain depth of the metalimnion (transition zone), temperature and
oxygen concentrations decrease rapidly to form meta- and oxycline zones. Temperature
and oxygen levels decrease fairly uniformly with an increase in depth. The highest
water density is noted at 4 oC, but such temperatures are observed only in deep lakes. In
the benthic zone, oxygen concentrations approximate zero. In shallow and highly
eutrophic water bodies, an absence of oxygen may be observed already at smaller
depths. A reverse temperature gradient is noted in the winter. Water is cooler in the
surface layer, its temperature increases with depth, along with a simultaneous drop in
oxygen concentrations. In transitional periods between direct stratification and inverse
stratification in the winter, homothermia, the vertical mixing of the water column takes
place in the spring and fall [1].
The aim of this study was to determine the effect of winter and summer seasons on
selected physicochemical properties of water in the Pilwa Bay.
Materials and methods
This study was carried out in the Pilwa Bay of Lake Dobskie located in the
mesoregion known as the Land of Great Masurian Lakes, Gizycko district. Lake
Dobskie constitutes the western part of the Mamry Lake complex, and it is a typical
ground moraine formation. The lake has an area of more than 1776 ha, and the bay
occupies 52.98 ha with an average depth of 1.36 m and a well-developed shoreline
(K = 1.88). The shoreline development index (K) is the quotient of shoreline length (l)and the circumference of a circle with an area equal to the lake’s area (A0):
Kl
A�
2 0�
The index is a denominate number equal to or higher than 1 [2]. In its present shape,
the bay is a only a remnant of the former section of Lake Dobskie that spanned an area
of more than 100 ha. The western part of the Pilwa Bay is supplied by watercourses
draining catchment areas which are semi-intensively farmed and intensively fertilized.
Sections of Lake Dobskie’s catchments are exposed to nitrogen runoffs from farmland.
The Pilwa Bay was selected for the study because it receives outflow water from
agricultural catchments and functions as an ecotone by preventing the penetration of
undesirable contaminants into the main basin of Lake Dobskie. However, long-term
human pressure has led to intense eutrophication in the bay.
1266 Ma³gorzata Rafa³owska and Katarzyna Sobczyñska-Wójcik
Vertical distributions of temperature and dissolved oxygen levels were measured in
the Pilwa Bay in the winter and summer seasons of the three-year experiment
(2005–2007). Measurements were performed using the WTW OXI Top OC 100 oxygen
sensor with automatic temperature compensation. In the summer, the Secchi disc
method was used to monitor water transparency. Additional measurements were
performed to determine electrolytic conductivity, oxygen saturation and pH of water. To
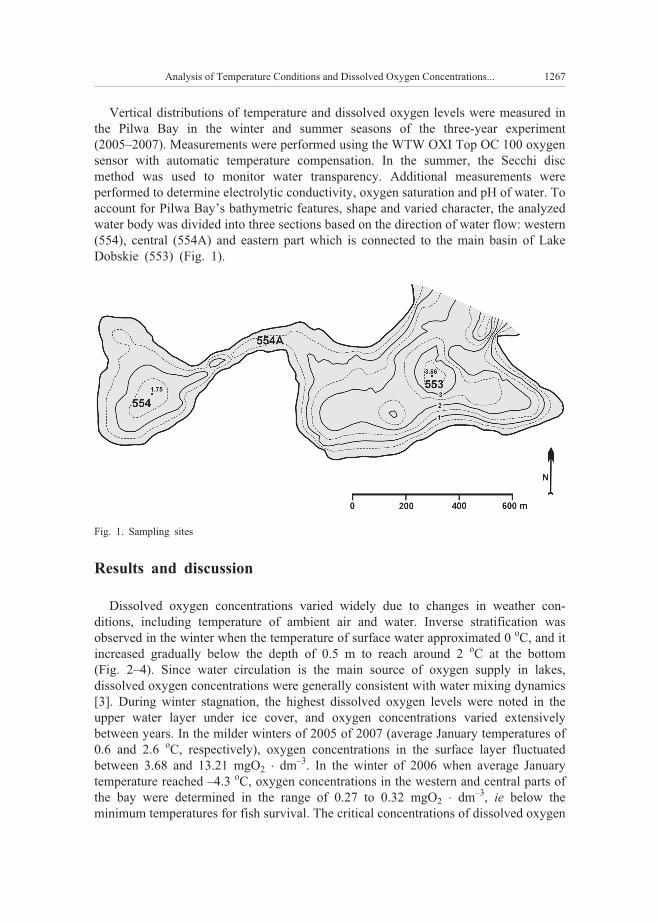
account for Pilwa Bay’s bathymetric features, shape and varied character, the analyzed
water body was divided into three sections based on the direction of water flow: western
(554), central (554A) and eastern part which is connected to the main basin of Lake
Dobskie (553) (Fig. 1).
Results and discussion
Dissolved oxygen concentrations varied widely due to changes in weather con-
ditions, including temperature of ambient air and water. Inverse stratification was
observed in the winter when the temperature of surface water approximated 0 oC, and it
increased gradually below the depth of 0.5 m to reach around 2 oC at the bottom
(Fig. 2–4). Since water circulation is the main source of oxygen supply in lakes,
dissolved oxygen concentrations were generally consistent with water mixing dynamics
[3]. During winter stagnation, the highest dissolved oxygen levels were noted in the
upper water layer under ice cover, and oxygen concentrations varied extensively
between years. In the milder winters of 2005 of 2007 (average January temperatures of
0.6 and 2.6 oC, respectively), oxygen concentrations in the surface layer fluctuated
between 3.68 and 13.21 mgO2 � dm–3. In the winter of 2006 when average January
temperature reached –4.3 oC, oxygen concentrations in the western and central parts of
the bay were determined in the range of 0.27 to 0.32 mgO2 � dm–3, ie below the
minimum temperatures for fish survival. The critical concentrations of dissolved oxygen
Analysis of Temperature Conditions and Dissolved Oxygen Concentrations... 1267
Fig. 1. Sampling sites
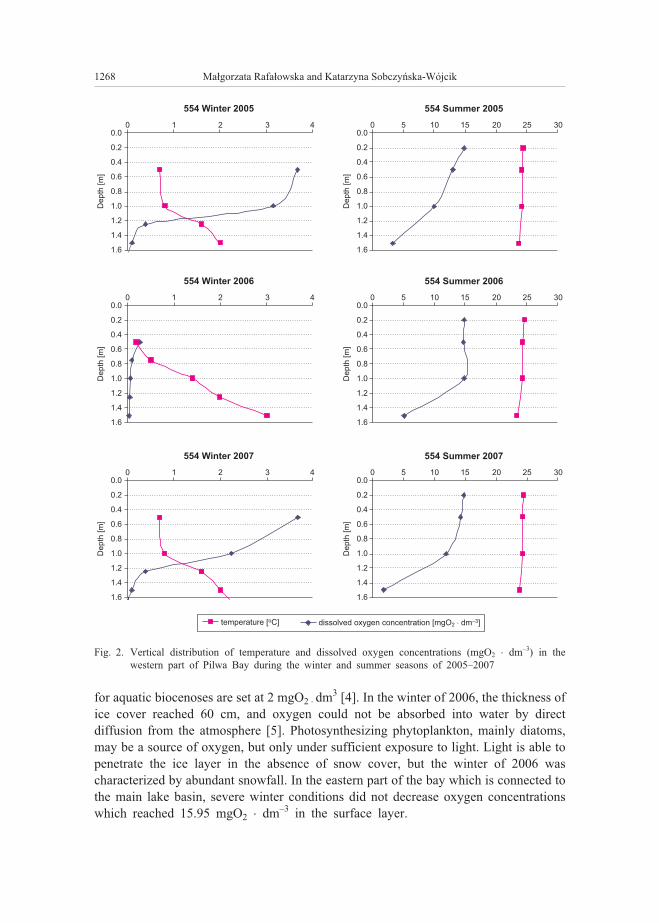
for aquatic biocenoses are set at 2 mgO2 � dm3 [4]. In the winter of 2006, the thickness of
ice cover reached 60 cm, and oxygen could not be absorbed into water by direct
diffusion from the atmosphere [5]. Photosynthesizing phytoplankton, mainly diatoms,
may be a source of oxygen, but only under sufficient exposure to light. Light is able to
penetrate the ice layer in the absence of snow cover, but the winter of 2006 was
characterized by abundant snowfall. In the eastern part of the bay which is connected to
the main lake basin, severe winter conditions did not decrease oxygen concentrations
which reached 15.95 mgO2 � dm–3 in the surface layer.
1268 Ma³gorzata Rafa³owska and Katarzyna Sobczyñska-Wójcik
554 Winter 2005
554 Winter 2006
554 Winter 2007
554 Summer 2005
554 Summer 2006
554 Summer 2007
0
0
0
0
0
0
5
5
5
1
1
1
10
10
10
15
15
15
2
2
2
20
20
20
25
25
25
3
3
3
30
30
30
4
4
4
0.0
0.2
0.4
0.6
0.8
1.0
1.2
1.4
1.6
0.0
0.2
0.4
0.6
0.8
1.0
1.2
1.4
1.6
0.0
0.2
0.4
0.6
0.8
1.0
1.2
1.4
1.6
0.0
0.2
0.4
0.6
0.8
1.0
1.2
1.4
1.6
0.0
0.2
0.4
0.6
0.8
1.0
1.2
1.4
1.6
0.0
0.2
0.4
0.6
0.8
1.0
1.2
1.4
1.6
temperature [ C]o dissolved oxygen concentration [mgO dm ]2–3�
De
pth
[m]
De
pth
[m]
De
pth
[m]
De
pth
[m]
De
pth
[m]
De
pth
[m]
Fig. 2. Vertical distribution of temperature and dissolved oxygen concentrations (mgO2 � dm–3) in the
western part of Pilwa Bay during the winter and summer seasons of 2005–2007
During summer stagnation, the bay was characterized by incomplete thermal and
oxygen stratification which is typical of shallow water bodies. The temperature of the
surface layer varied between 22.3 and 24.4 oC. An analysis of temperature and oxygen
profiles revealed an insignificant temperature difference of approximately 1–2 oC
between surface and bottom layers, which indicates that the examined bay was not
characterized by a summer stratification pattern typical of deep water bodies. In the
three-year period of the study, oxygen distribution patterns were correlated with
temperature curves.
Analysis of Temperature Conditions and Dissolved Oxygen Concentrations... 1269
554A Winter 2005
554A Winter 2006
554A Winter 2007
554A Summer 2005
554A Summer 2006
554A Summer 2007
0
0
0
0
0
0
5
5
5
3
0.1
3
10
10
10
15
15
15
6
0.2 0.3
6
20
20
20
25
25
25
9
0.4
9
30
30
30
12
0.5
12
0.0
0.2
0.4
0.6
0.8
1.0
1.2
0.0
0.2
0.4
0.6
0.8
1.0
1.2
0.0
0.2
0.4
0.6
0.8
1.0
1.2
0.0
0.2
0.4
0.6
0.8
1.0
1.2
0.0
0.2
0.4
0.6
0.8
1.0
1.2
0.0
0.2
0.4
0.6
0.8
1.0
1.2
temperature [ C]o dissolved oxygen concentration [mgO dm ]2–3�
De
pth
[m]
De
pth
[m]
De
pth
[m]
De
pth
[m]
De
pth
[m]
De
pth
[m]
Fig. 3. Vertical distribution of temperature and dissolved oxygen concentrations (mgO2 � dm–3) in the central
part of Pilwa Bay during the winter and summer seasons of 2005–2007
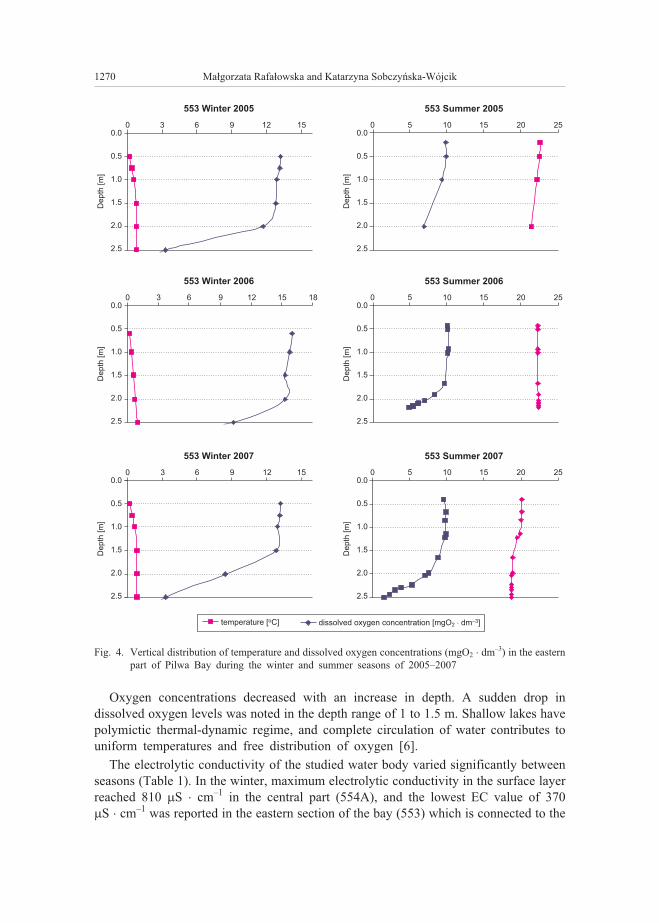
Oxygen concentrations decreased with an increase in depth. A sudden drop in
dissolved oxygen levels was noted in the depth range of 1 to 1.5 m. Shallow lakes have
polymictic thermal-dynamic regime, and complete circulation of water contributes to
uniform temperatures and free distribution of oxygen [6].
The electrolytic conductivity of the studied water body varied significantly between
seasons (Table 1). In the winter, maximum electrolytic conductivity in the surface layer
reached 810 �S � cm–1 in the central part (554A), and the lowest EC value of 370
�S � cm–1 was reported in the eastern section of the bay (553) which is connected to the
1270 Ma³gorzata Rafa³owska and Katarzyna Sobczyñska-Wójcik
553 Winter 2005
553 Winter 2006
553 Winter 2007
553 Summer 2005
553 Summer 2006
553 Summer 2007
0
0
0
0
0
0
5
5
5
3
3
3
10
10
10
15
15
15
6
6
6
20
20
20
25
25
25
9
9
9
15
15 18
12
12
12 15
0.0
0.5
1.0
1.5
2.0
2.5
0.0
0.5
1.0
1.5
2.0
2.5
0.0
0.5
1.0
1.5
2.0
2.5
0.0
0.5
1.0
1.5
2.0
2.5
0.0
0.5
1.0
1.5
2.0
2.5
0.0
0.5
1.0
1.5
2.0
2.5
temperature [ C]o dissolved oxygen concentration [mgO dm ]2–3�
De
pth
[m]
De
pth
[m]
De
pth
[m]
De
pth
[m]
De
pth
[m]
De
pth
[m]
Fig. 4. Vertical distribution of temperature and dissolved oxygen concentrations (mgO2 � dm–3) in the eastern
part of Pilwa Bay during the winter and summer seasons of 2005–2007
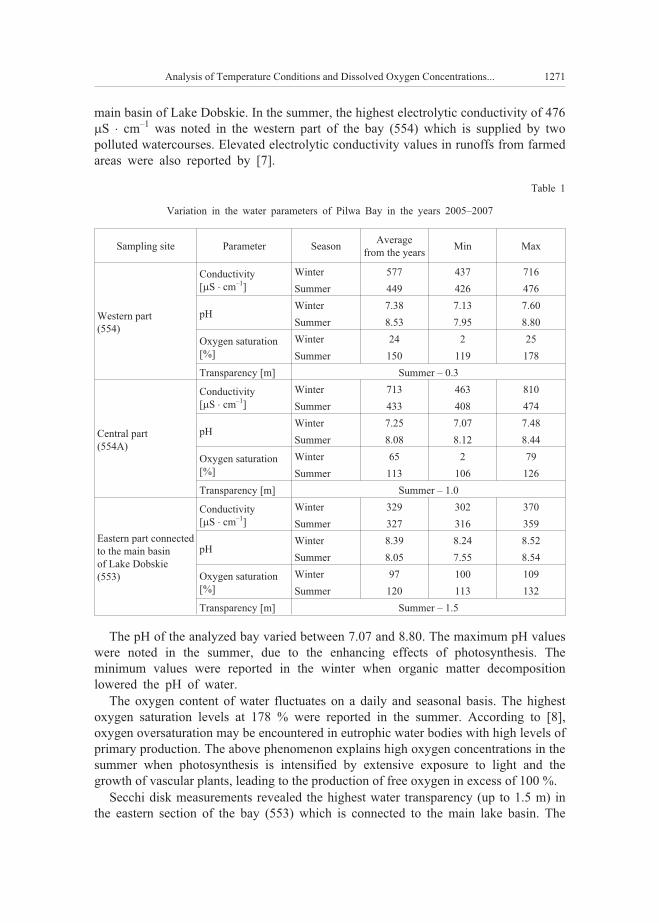
main basin of Lake Dobskie. In the summer, the highest electrolytic conductivity of 476
�S � cm–1 was noted in the western part of the bay (554) which is supplied by two
polluted watercourses. Elevated electrolytic conductivity values in runoffs from farmed
areas were also reported by [7].
Table 1
Variation in the water parameters of Pilwa Bay in the years 2005–2007
Sampling site Parameter SeasonAverage
from the yearsMin Max
Western part
(554)
Conductivity
[�S � cm–1]
Winter 577 437 716
Summer 449 426 476
pHWinter 7.38 7.13 7.60
Summer 8.53 7.95 8.80
Oxygen saturation
[%]
Winter 24 2 25
Summer 150 119 178
Transparency [m] Summer – 0.3
Central part
(554A)
Conductivity
[�S � cm–1]
Winter 713 463 810
Summer 433 408 474
pHWinter 7.25 7.07 7.48
Summer 8.08 8.12 8.44
Oxygen saturation
[%]
Winter 65 2 79
Summer 113 106 126
Transparency [m] Summer – 1.0
Eastern part connected
to the main basin
of Lake Dobskie
(553)
Conductivity
[�S � cm–1]
Winter 329 302 370
Summer 327 316 359
pHWinter 8.39 8.24 8.52
Summer 8.05 7.55 8.54
Oxygen saturation
[%]
Winter 97 100 109
Summer 120 113 132
Transparency [m] Summer – 1.5
The pH of the analyzed bay varied between 7.07 and 8.80. The maximum pH values
were noted in the summer, due to the enhancing effects of photosynthesis. The
minimum values were reported in the winter when organic matter decomposition
lowered the pH of water.
The oxygen content of water fluctuates on a daily and seasonal basis. The highest
oxygen saturation levels at 178 % were reported in the summer. According to [8],
oxygen oversaturation may be encountered in eutrophic water bodies with high levels of
primary production. The above phenomenon explains high oxygen concentrations in the
summer when photosynthesis is intensified by extensive exposure to light and the
growth of vascular plants, leading to the production of free oxygen in excess of 100 %.
Secchi disk measurements revealed the highest water transparency (up to 1.5 m) in
the eastern section of the bay (553) which is connected to the main lake basin. The
Analysis of Temperature Conditions and Dissolved Oxygen Concentrations... 1271
above results can be attributed to low algae content which is an important determinant
of turbidity. The lowest levels of water transparency (0.3 m) were noted in the western
part of the bay (554) due to the presence of cyanobacteria blooms [9].
Conclusions
1. During winter stagnation, the highest dissolved oxygen content in the Pilwa Bay
was noted in the top water layer under ice cover, and oxygen concentrations varied
widely between years.
2. Average dissolved oxygen concentrations were higher in the summer than in the
winter. Oxygen solubility decreased with depth in the analyzed water body.
3. In the three-year period of the study, electric conductivity values were higher in
the western part of the bay which is supplied with runoffs from semi-intensively farmed
and intensively fertilized catchment areas than in the eastern section of the bay which is
connected to the main basin of Lake Dobskie. Electric conductivity is a reliable
indicator of water supply, circulation and dissolved organic matter concentrations, and it
supports the identification of incidental events in catchment areas.
References
[1] Che³micki W. Woda – zasoby, degradacja, ochrona. Warszawa: PWN; 2002.
[2] Bajkiewicz-Grabowska E, Mikulski Z. Hydrologia ogólna. Warszawa: PWN; 2008.
[3] Jaroszewicz A, Hetmañski T. Sezonowa zmiennoœæ stê¿enia substancji biogenicznych w wodach jeziora
Dobra (Pojezierze Pomorskie); Poziom trofii jeziora. S³upskie Prace Biologiczne. 2009;6:71-79.
[4] Wojciechowski I. Ekologiczne podstawy kszta³towania œrodowiska. Warszawa: PWN; 1987.
[5] Poleszczuk G, Bucior A, Nowicka E, Grzegorczyk K. O jakoœci wód powierzchniowych jezior
Czajczego i Domys³owskiego w Woliñskim Parku Narodowym w ró¿nych porach roku.
http://wbiis.tu.koszalin.pl/towarzystwo/2005/13Poleszczuk_t.pdf.
[6] Lange W, Maœlanka W. Struktura tlenowa wybranych jezior Pojezierza Pomorskiego. Rocz Fizyczno-
-geograficzny UG. 1996;1: 25-35.
[7] Koc J, Nowicki Z, Gliñska K, £achacz A. Kszta³towanie siê jakoœci wód w warunkach ma³ej antro-
popresji na przyk³adzie zlewni Ardung (Pojezierze Olsztyñskie). Zesz Nauk Kom Nauk PAN „Cz³owiek
i Œrodowisko”. 2000;25:155-166.
[8] Dojlido JR. Chemia wód powierzchniowych. Bia³ystok: Wyd Ekonomia i Œrodowisko; 1995:342 pp.
[9] Rafa³owska M. Wp³yw intensywnej produkcji rolniczej na jakoœæ wód powierzchniowych i gruntowych.
Praca doktorska. UWM Olsztyn; 2010.
ANALIZA WARUNKÓW TERMICZNO-TLENOWYCH WÓD
W ZATOCE PILWA (JEZIORO DOBSKIE)
Katedra Melioracji i Kszta³towania Œrodowiska
Uniwersytet Warmiñsko-Mazurski w Olsztynie
Abstrakt: Badaniami objêto zatokê Pilwa jeziora Dobskiego po³o¿onego na obszarze mezoregionu Krainy
Wielkich Jezior Mazurskich, w powiecie gi¿yckim. W niniejszej pracy przedstawiono warunki termiczno-
-tlenowe wód zatoki. Podczas trzyletnich prac badawczych (2005–2007) w okresie zimy i lata wykonano
w zatoce (w czêœci zachodniej, œrodkowej i wschodniej po³¹czonej z g³ównym akwenem jeziora Dobskiego)
pomiary rozk³adu pionowego temperatury i tlenu rozpuszczonego. Pomiarów dokonano za pomoc¹ sondy
tlenowej z automatyczn¹ kompensacj¹ temperatury (WTW OXI Top OC 100).
1272 Ma³gorzata Rafa³owska and Katarzyna Sobczyñska-Wójcik

W wyniku badañ stwierdzono, ¿e w czasie stagnacji zimowej najwiêksza zawartoœæ tlenu rozpuszczonego
znajdowa³a siê w górnej warstwie pod powierzchni¹ lodu, a przebieg zmiennoœci stê¿enia tlenu by³ bardzo
zró¿nicowany w poszczególnych latach. Z analizy profilu termiczno-tlenowego wynika, ¿e istnieje niewielka
ró¿nica temperatur miêdzy powierzchni¹ lustra wody a dnem i wynosi ona oko³o 1–2 oC, w zwi¹zku z czym,
nie mo¿na mówiæ o typowej stratyfikacji letniej, jaka wystêpuje w akwenach g³êbokich.
S³owa kluczowe: profile termiczno-tlenowe, stratyfikacja termiczna, zatoka
Analysis of Temperature Conditions and Dissolved Oxygen Concentrations... 1273

Andrzej SKWIERAWSKI1
THE USE OF THE INTEGRATED TROPHIC STATE INDEX
IN EVALUATION OF THE RESTORED
SHALLOW WATER BODIES
ZASTOSOWANIE INTEGRALNEGO WSKA�NIKA
STANU TROFICZNEGO DO OCENY
ODTWORZONYCH P£YTKICH ZBIORNIKÓW
Abstract: The aim of this study was to determine the trophic status of five restored shallow lakes from
a group of 30 water bodies in the Olsztyn Lakeland, which were dried in the 19th century as part of a land
reclamation program. The effectiveness of the Integrated Trophic State Index (ITS) in the evaluation process
was analyzed. ITS is a relatively new method for diagnosing eutrophication intensity. It analyzes the balance
between production processes and organic matter decomposition through simultaneous measurements of
oxygen saturation and pH of water. ITS is a versatile tool which can be applied in various types of water
bodies. In this study, it was used to evaluate shallow water bodies characterized by excessive phosphorus
loads and susceptibility to blue-green algal blooms in summer.
During a three-year study carried out in 2010–2012, significant correlations were observed between %O2
and pH, which is a basic prerequisite for applying the ITS method. In the analyzed water bodies, correlation
coefficients were determined in the range of r = 0.68–0.83. ITS values varied in successive years ITS (from
7.73 to 8.67), ranging from eutrophy to hypertrophy. Most ITS scores were consistent with the values of
Carlson’s TSI, which indicates that used integrated trophic state index, based on the values of water pH and
oxygen saturation, accurately reflect the ecological status of degraded water bodies.
Keywords: trophic state, Carlson’s TSI, Integrated Trophic State Index (ITS), restored lakes, eutrophication
The trophic state is an indicator of the degree of transformation and ecological
disruption of water bodies. Various methods for evaluating the trophic state have been
proposed based on different criteria, such as nutrient supply, primary production levels
or changes observed in trophic structure in comparison with undisturbed ecosystems
[1–5]. Commonly used models evaluate the concentrations of primary biogenic
compounds (nitrogen and phosphorus) and phytoplankton characteristics (concentra-
tions of chlorophyll a and Secchi disc visibility). Those parameters are taken into
account in the most popular models: the Vollenweider model [6, 7] and Carlson’s
Trophic State Index [8].
DOI: 10.2428/ecea.2013.20(11)115 ECOL CHEM ENG A. 2013;20(11):1275-1283
1 Department of Land Improvement and Environmental Management, University of Warmia and Mazury
in Olsztyn, pl. £ódzki 2, 10–719 Olsztyn, Poland, phone: +48 89 523 43 14, email: andrzej.skwie-
In 1995, Neverova-Dziopak proposed the Integrated Trophic State Index (ITS) as
a new method for evaluating primary production levels in water bodies [3]. Unlike con-
ventional evaluation tools, this method analyzes the balance between primary produc-
tion and organic matter decomposition by measuring dissolved oxygen levels and pH of
water. A water body’s trophic status is evaluated by diagnosing changes in an aquatic
ecosystem caused by intensified primary production [3, 4]. ITS is a versatile tool which
can be applied in various types of water bodies. Its main advantage is the ease of obtaining
output data for trophic state assessments: only two indicators (% oxygen saturation and
pH of water) which are measured during standard water quality inspections are required.
ITS significantly simplifies the evaluation process. Every new method should be tested
under various conditions to analyze its suitability and reliability. To date, ITS has been
rarely used by researchers in evaluations of various water ecosystems [3, 9–11]. In this
study, the discussed method was used to assess degraded water bodies which generally
score poorly when conventional evaluation tools are applied.
The objective of this study was to evaluate the trophic status of restored shallow
water bodies which constitute a rare and poorly investigated category of aquatic eco-
systems. The second objective was to test the effectiveness of ITS in evaluations of eu-
trophic water bodies by comparing the obtained results with the values of Carlson’s TSI.
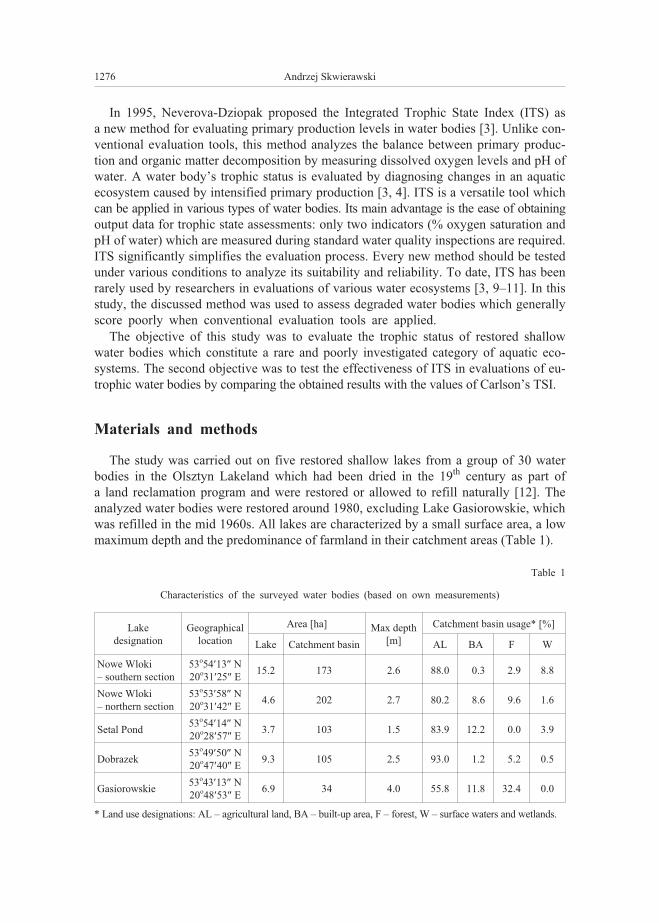
Materials and methods
The study was carried out on five restored shallow lakes from a group of 30 water
bodies in the Olsztyn Lakeland which had been dried in the 19th century as part of
a land reclamation program and were restored or allowed to refill naturally [12]. The
analyzed water bodies were restored around 1980, excluding Lake Gasiorowskie, which
was refilled in the mid 1960s. All lakes are characterized by a small surface area, a low
maximum depth and the predominance of farmland in their catchment areas (Table 1).
Table 1
Characteristics of the surveyed water bodies (based on own measurements)
Lake
designation
Geographical
location
Area [ha] Max depth
[m]
Catchment basin usage* [%]
Lake Catchment basin AL BA F W
Nowe Wloki
– southern section
53o54�13� N
20o31�25� E15.2 173 2.6 88.0 0.3 2.9 8.8
Nowe Wloki
– northern section
53o53�58� N
20o31�42� E4.6 202 2.7 80.2 8.6 9.6 1.6
Setal Pond53o54�14� N
20o28�57� E3.7 103 1.5 83.9 12.2 0.0 3.9
Dobrazek53o49�50� N
20o47�40� E9.3 105 2.5 93.0 1.2 5.2 0.5
Gasiorowskie53o43�13� N
20o48�53� E6.9 34 4.0 55.8 11.8 32.4 0.0
* Land use designations: AL – agricultural land, BA – built-up area, F – forest, W – surface waters and wetlands.
1276 Andrzej Skwierawski
Lake Nowe Wloki and Setal Pond were characterized by stable phytoplankton
communities with a predominance of Cyanobacteria. Weakly developed submerged
macrophytes and moderate phytoplankton blooms were observed in Lake Dobrazek.
Lake Gasiorowskie was classified as a pure water system where macrophytes, mostly
floating-leaf plants (Nymphaea alba and Nuphar lutea), were the most important
primary producers. Progressive disappearance of vascular plants was observed in the
above lake.
The study was carried out from 8th November 2010 to 10th September 2012. A total
of 23 water samples were collected from each of the five analyzed lakes, at about 6
week intervals throughout the whole period of observations. The indicators for
calculating ITS were measured locally with the use of the YSI 6600 multiparameter
sonde. The results were calculated separately for every lake based on data from
year-long measurements with the use of the following formula [3]:
ITS = � pHi / n + a (100 – � [O2%] / n)
where: pHi – water pH,
[O2%] – oxygen saturation of water,
a – coefficient of regression between pH and %O2,
n – number of measurements.
Comparative data for determinations for Carlson’s TSI were obtained simultaneously
with measurements of oxygen saturation and pH of water. Only the measurements
performed in the growing seasons of each analyzed year (May–September) were used to
calculate Carlson’s TSI. Partial TSI scores were determined based on phosphorus levels
(TSITP), concentrations of chlorophyll a (TSIChl) and Secchi disc visibility (TSISD) with
the use of the following formulas [7].
TSITP = 14.42 � ln(TP) + 4.15
TSIChl = 9.81 � ln(Chl) + 30.6
TSISD = 60 – 14.41 � ln(SD)
where: TP – phosphorus levels [�g � dm–3],
Chl – concentrations of chlorophyll a [�g � dm–3],
SD – Secchi disc visibility [m].
Phosphorus levels were determined in a laboratory with the use of ammonium
molybdate and tin(II) chloride after sample mineralization. Chlorophyll concentrations
were measured with the YSI 6600 sonde, and Secchi disc visibility was determined
during lake measurements with the involvement of a standard black and white disc with
the diameter of 20 cm. The data were processed in line with the principles applicable to
ITS and Carlson’s TSI. The results were verified statistically in the Statistica 10 PL
application.
The Use of the Integrated Trophic State Index in Evaluation... 1277
Results and discussion
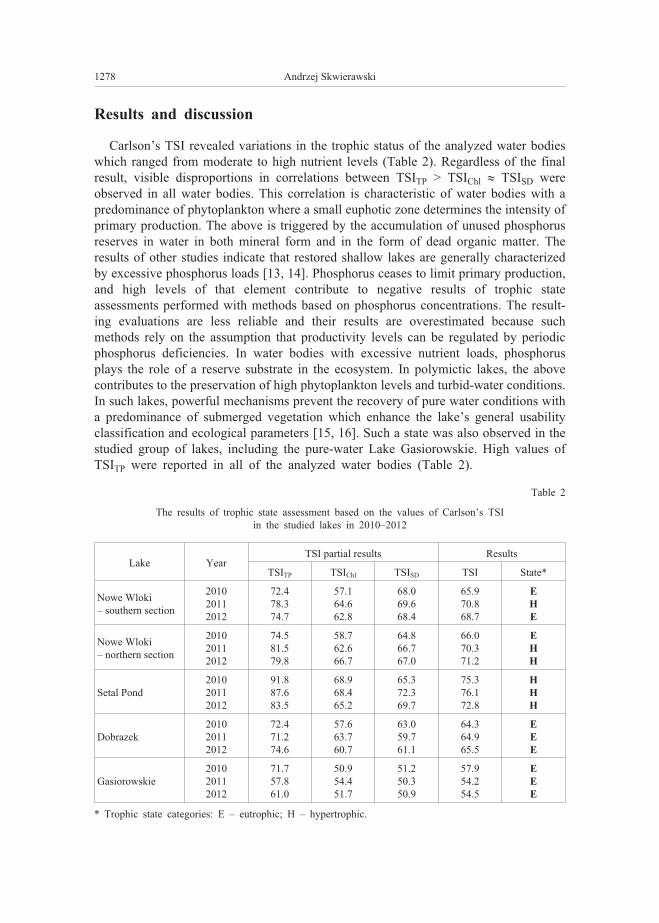
Carlson’s TSI revealed variations in the trophic status of the analyzed water bodies
which ranged from moderate to high nutrient levels (Table 2). Regardless of the final
result, visible disproportions in correlations between TSITP > TSIChl � TSISD were
observed in all water bodies. This correlation is characteristic of water bodies with a
predominance of phytoplankton where a small euphotic zone determines the intensity of
primary production. The above is triggered by the accumulation of unused phosphorus
reserves in water in both mineral form and in the form of dead organic matter. The
results of other studies indicate that restored shallow lakes are generally characterized
by excessive phosphorus loads [13, 14]. Phosphorus ceases to limit primary production,
and high levels of that element contribute to negative results of trophic state
assessments performed with methods based on phosphorus concentrations. The result-
ing evaluations are less reliable and their results are overestimated because such
methods rely on the assumption that productivity levels can be regulated by periodic
phosphorus deficiencies. In water bodies with excessive nutrient loads, phosphorus
plays the role of a reserve substrate in the ecosystem. In polymictic lakes, the above
contributes to the preservation of high phytoplankton levels and turbid-water conditions.
In such lakes, powerful mechanisms prevent the recovery of pure water conditions with
a predominance of submerged vegetation which enhance the lake’s general usability
classification and ecological parameters [15, 16]. Such a state was also observed in the
studied group of lakes, including the pure-water Lake Gasiorowskie. High values of
TSITP were reported in all of the analyzed water bodies (Table 2).
Table 2
The results of trophic state assessment based on the values of Carlson’s TSI
in the studied lakes in 2010–2012
Lake YearTSI partial results Results
TSITP TSIChl TSISD TSI State*
Nowe Wloki
– southern section
2010
2011
2012
72.4
78.3
74.7
57.1
64.6
62.8
68.0
69.6
68.4
65.9
70.8
68.7
E
H
E
Nowe Wloki
– northern section
2010
2011
2012
74.5
81.5
79.8
58.7
62.6
66.7
64.8
66.7
67.0
66.0
70.3
71.2
E
H
H
Setal Pond
2010
2011
2012
91.8
87.6
83.5
68.9
68.4
65.2
65.3
72.3
69.7
75.3
76.1
72.8
H
H
H
Dobrazek
2010
2011
2012
72.4
71.2
74.6
57.6
63.7
60.7
63.0
59.7
61.1
64.3
64.9
65.5
E
E
E
Gasiorowskie
2010
2011
2012
71.7
57.8
61.0
50.9
54.4
51.7
51.2
50.3
50.9
57.9
54.2
54.5
E
E
E
* Trophic state categories: E – eutrophic; H – hypertrophic.
1278 Andrzej Skwierawski
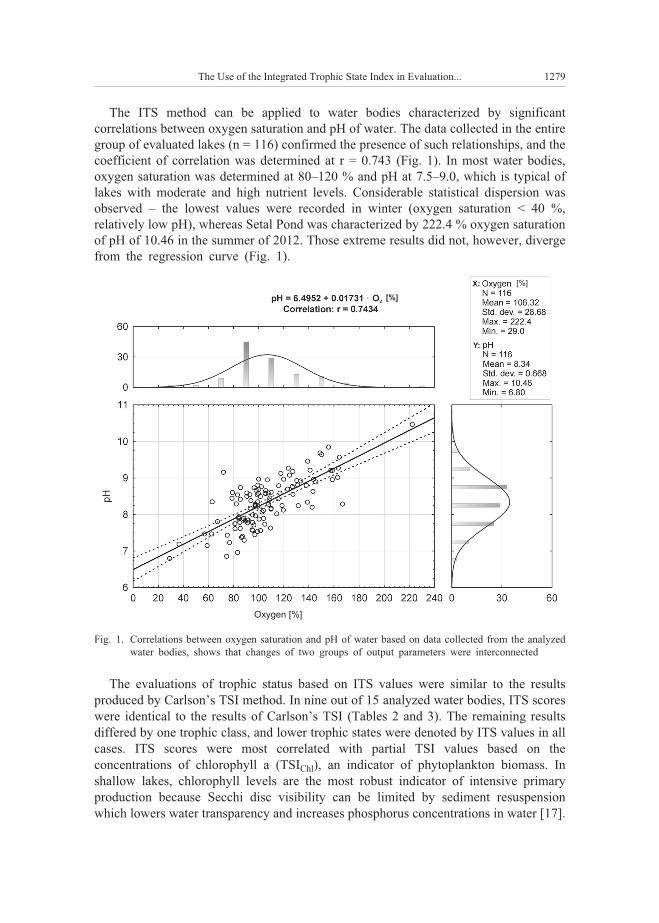
The ITS method can be applied to water bodies characterized by significant
correlations between oxygen saturation and pH of water. The data collected in the entire
group of evaluated lakes (n = 116) confirmed the presence of such relationships, and the
coefficient of correlation was determined at r = 0.743 (Fig. 1). In most water bodies,
oxygen saturation was determined at 80–120 % and pH at 7.5–9.0, which is typical of
lakes with moderate and high nutrient levels. Considerable statistical dispersion was
observed – the lowest values were recorded in winter (oxygen saturation < 40 %,
relatively low pH), whereas Setal Pond was characterized by 222.4 % oxygen saturation
of pH of 10.46 in the summer of 2012. Those extreme results did not, however, diverge
from the regression curve (Fig. 1).
The evaluations of trophic status based on ITS values were similar to the results
produced by Carlson’s TSI method. In nine out of 15 analyzed water bodies, ITS scores
were identical to the results of Carlson’s TSI (Tables 2 and 3). The remaining results
differed by one trophic class, and lower trophic states were denoted by ITS values in all
cases. ITS scores were most correlated with partial TSI values based on the
concentrations of chlorophyll a (TSIChl), an indicator of phytoplankton biomass. In
shallow lakes, chlorophyll levels are the most robust indicator of intensive primary
production because Secchi disc visibility can be limited by sediment resuspension
which lowers water transparency and increases phosphorus concentrations in water [17].
The Use of the Integrated Trophic State Index in Evaluation... 1279
Oxygen [%]
� [%]
[%]
Fig. 1. Correlations between oxygen saturation and pH of water based on data collected from the analyzed
water bodies, shows that changes of two groups of output parameters were interconnected
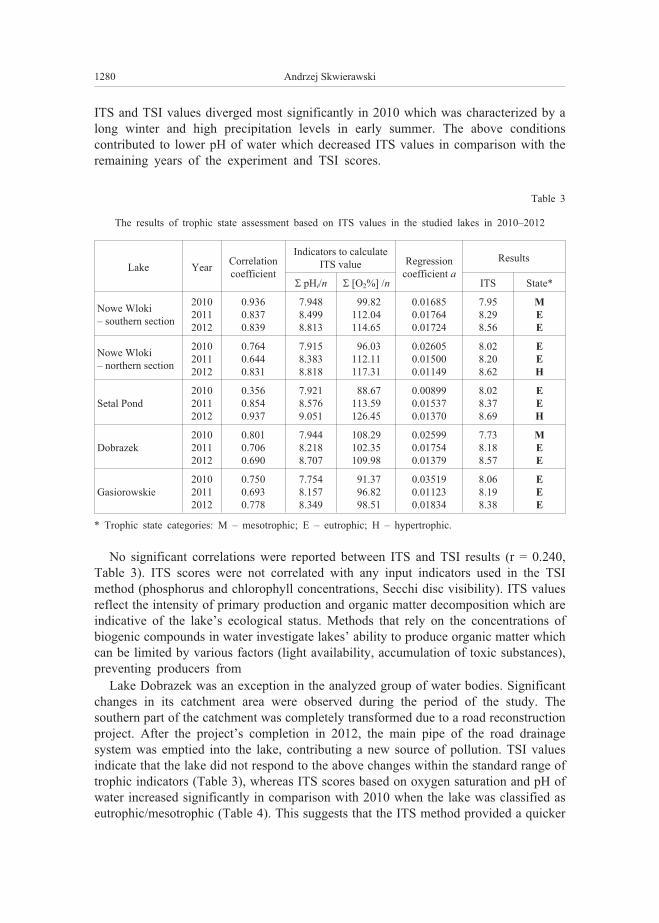
ITS and TSI values diverged most significantly in 2010 which was characterized by a
long winter and high precipitation levels in early summer. The above conditions
contributed to lower pH of water which decreased ITS values in comparison with the
remaining years of the experiment and TSI scores.
Table 3
The results of trophic state assessment based on ITS values in the studied lakes in 2010–2012
Lake YearCorrelation
coefficient
Indicators to calculate
ITS value Regression
coefficient a
Results
� pHi/n � [O2%] /n ITS State*
Nowe Wloki
– southern section
2010
2011
2012
0.936
0.837
0.839
7.948
8.499
8.813
99.82
112.04
114.65
0.01685
0.01764
0.01724
7.95
8.29
8.56
M
E
E
Nowe Wloki
– northern section
2010
2011
2012
0.764
0.644
0.831
7.915
8.383
8.818
96.03
112.11
117.31
0.02605
0.01500
0.01149
8.02
8.20
8.62
E
E
H
Setal Pond
2010
2011
2012
0.356
0.854
0.937
7.921
8.576
9.051
88.67
113.59
126.45
0.00899
0.01537
0.01370
8.02
8.37
8.69
E
E
H
Dobrazek
2010
2011
2012
0.801
0.706
0.690
7.944
8.218
8.707
108.29
102.35
109.98
0.02599
0.01754
0.01379
7.73
8.18
8.57
M
E
E
Gasiorowskie
2010
2011
2012
0.750
0.693
0.778
7.754
8.157
8.349
91.37
96.82
98.51
0.03519
0.01123
0.01834
8.06
8.19
8.38
E
E
E
* Trophic state categories: M – mesotrophic; E – eutrophic; H – hypertrophic.
No significant correlations were reported between ITS and TSI results (r = 0.240,
Table 3). ITS scores were not correlated with any input indicators used in the TSI
method (phosphorus and chlorophyll concentrations, Secchi disc visibility). ITS values
reflect the intensity of primary production and organic matter decomposition which are
indicative of the lake’s ecological status. Methods that rely on the concentrations of
biogenic compounds in water investigate lakes’ ability to produce organic matter which
can be limited by various factors (light availability, accumulation of toxic substances),
preventing producers from
Lake Dobrazek was an exception in the analyzed group of water bodies. Significant
changes in its catchment area were observed during the period of the study. The
southern part of the catchment was completely transformed due to a road reconstruction
project. After the project’s completion in 2012, the main pipe of the road drainage
system was emptied into the lake, contributing a new source of pollution. TSI values
indicate that the lake did not respond to the above changes within the standard range of
trophic indicators (Table 3), whereas ITS scores based on oxygen saturation and pH of
water increased significantly in comparison with 2010 when the lake was classified as
eutrophic/mesotrophic (Table 4). This suggests that the ITS method provided a quicker
1280 Andrzej Skwierawski
response to increased external pressure. Further work is, however, needed to validate
this hypothesis.
Table 4
Pearson’s matrix of correlations between TSI / ITS values and respective index components
for the group of investigated water bodies in different years of the study
(values in bold are statistically significant at p < 0.05)
Variable ITS TSI Chl_a SD P pH
ITS —
TSI 0.240 —
Chl_a 0.334 0.897 —
SD –0.157– –0.911– 0.684 —
P 0.092 0.843 0.878 –0.581 —
pH 0.927 0.407 0.426 –0.394 0.149 —
O2 0.668 0.498 0.375 –0.577 0.126 0.878
Explanations: Chl_a – chlorophyll a; SD – Secchi disk depth; P – concentration of total phosphorus; O2 –
oxygen saturation.
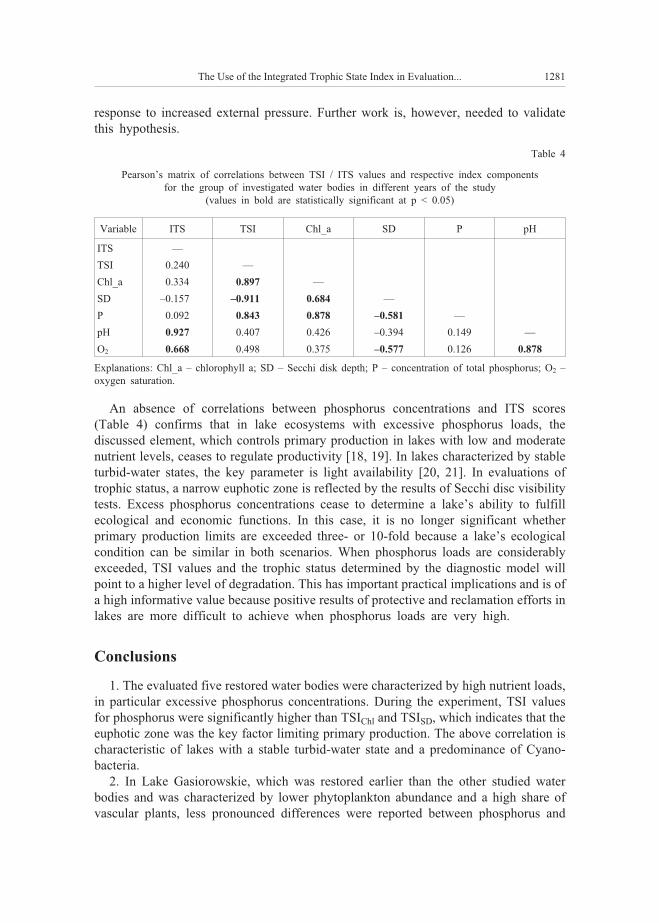
An absence of correlations between phosphorus concentrations and ITS scores
(Table 4) confirms that in lake ecosystems with excessive phosphorus loads, the
discussed element, which controls primary production in lakes with low and moderate
nutrient levels, ceases to regulate productivity [18, 19]. In lakes characterized by stable
turbid-water states, the key parameter is light availability [20, 21]. In evaluations of
trophic status, a narrow euphotic zone is reflected by the results of Secchi disc visibility
tests. Excess phosphorus concentrations cease to determine a lake’s ability to fulfill
ecological and economic functions. In this case, it is no longer significant whether
primary production limits are exceeded three- or 10-fold because a lake’s ecological
condition can be similar in both scenarios. When phosphorus loads are considerably
exceeded, TSI values and the trophic status determined by the diagnostic model will
point to a higher level of degradation. This has important practical implications and is of
a high informative value because positive results of protective and reclamation efforts in
lakes are more difficult to achieve when phosphorus loads are very high.
Conclusions
1. The evaluated five restored water bodies were characterized by high nutrient loads,
in particular excessive phosphorus concentrations. During the experiment, TSI values
for phosphorus were significantly higher than TSIChl and TSISD, which indicates that the
euphotic zone was the key factor limiting primary production. The above correlation is
characteristic of lakes with a stable turbid-water state and a predominance of Cyano-
bacteria.
2. In Lake Gasiorowskie, which was restored earlier than the other studied water
bodies and was characterized by lower phytoplankton abundance and a high share of
vascular plants, less pronounced differences were reported between phosphorus and
The Use of the Integrated Trophic State Index in Evaluation... 1281
chlorophyll concentrations and Secchi disc visibility. The results of TSI index for this
lake were the most advantageous compared to other studied sites.
3. The integrated trophic state index (ITS) revealed relatively high nutrient loads in
the studied water bodies. In most lakes, ITS scores were largely consistent with TSI
values. The obtained data indicate that ITS is a synthetic indicator that accounts for all
functional aspects of an aquatic ecosystem. ITS values are largely independent of
phosphorus loads, whereas the TSI method assigns a higher trophic class to lakes with
excess phosphorus concentrations.
Acknowledgements
This study has been financed by the National Science Center, project No. N N305 304440.
References
[1] Wang H, Wang H. Mitigation of lake eutrophication: Loosen nitrogen control and focus on phosphorus
abatement. Prog Nat Sci. 2009;19:1445-1451. DOI: 10.1016/j.pnsc.2009.03.009.
[2] Parparov A, Hambright KD, Hakanson L, Ostapenia AP. Water quality quantification: basics and
Implementation. Hydrobiologia 2006;560(1):227-237. DOI 10.1007/s10750-005-1642-y.
[3] Neverova-Dziopak E. Podstawy zarz¹dzania procesem eutrofizacji antropogenicznej [Fundamentals of
anthropogenic eutrophication process management]. Kraków: Wyd AGH; 2010.
[4] Panek P. WskaŸniki biotyczne stosowane w monitoringu wód od czasu implementacji w Polsce
Ramowej Dyrektywy Wodnej [Biotic indices used in Poland since the implementation of Water
Framework Directive]. Przegl Przyr. 2011;22(3):111-123.
[5] Peckham SD, Chipman JW, Lillesand TM, Dodson SI. Alternate stable states and the shape of the lake
trophic distribution. Hydrobiologia 2006;571:401-407. DOI 10.1007/s10750-006-0221-1.
[6] Munawar M, Fitzpatrick M. The application of Vollenweider’s eutrophication models for assessing
ecosystem health: Hamilton Harbour (Lake Ontario) example. Aquat Ecosyst Health.
2011;14(2):204-208. DOI: 10.1080/14634988.2011.577394.
[7] Nürnberg GK. Trophic state of clear and colored, soft- and hard-water lakes with special consideration
of nutrients, anoxia, phytoplankton and fish. Lake Reservoir Manage. 1996;12:432-447.
DOI: 10.1080/07438149609354283.
[8] Carlson RE. A trophic state index for lakes. Limnol Oceanogr. 1977;22:361-369.
DOI: 10.4319/lo.1977.22.2.0361.
[9] Jachniak E, Jaguœ A. Uwarunkowania i nasilenie eutrofizacji zbiornika Tresna [Conditions and intensity
of eutrophication of the Tresna reservoir]. Nauka Przyr Technol. 2011;5(4):56-65.
[10] Jaguœ A. Assessment of trophic state of inland water (the case of the Sola cascade dam reservoirs). Ecol
Chem Eng A. 2011;18(11):1433-1440.
[11] Neverova-Dziopak E, Kowalczyk E, Bartoszek L, Koszelnik P. Trophic state of the Solina Reservoir.
Zesz Nauk Polit Rzesz, Bud In¿ Œrod. 2011;58:197-208.
[12] Skwierawski A. The Causes, Extent and Consequences of Lake Drainage in the Olsztyn Lakeland in the
19th and Early 20th Century. In: Environment Alterations – Research and Protection Methods.
Contemporary Problems of Management and Environmental Protection. 2011;8:33-52.
[13] Skwierawski A. Water quality of restored shallow lake Nowe Wloki. Ecol Chem Eng.
2006;13(S2):345-354.
[14] Skwierawski A. Nitrogen and phosphorus loads in the restored lake Sawag. Ecol Chem Eng A.
2012;19(9):1029-1039. DOI: 10.2428/ecea.2012.19(09)098.
[15] Scheffer M. Alternative stable states in eutrophic shallow freshwater systems: a minimal model.
Hydrobiol Bull. 1989;23:73-85. DOI: 10.1007/BF02286429.
[16] Scheffer M, van Ness EH. Shallow lakes theory revisited: various alternative regimes driven by climate,
nutrients, depth and lake size. Hydrobiologia 2007;584:455-466. DOI 10.1007/s10750-007-0616-7.
1282 Andrzej Skwierawski
[17] Scheffer M, van Geest GJ, Zimmer K, Jeppesen E, Sondergaard M, Butler MG, Hanson MA, Declerck S,
de Meester L. Small habitat size and isolation can promote species richness: second-order effects on
biodiversity in shallow lakes and ponds. Oikos. 2006;112(1):227-231.
DOI: 10.1111/j.0030-1299.2006.14145.x.
[18] Wade AJ, Hornberger GM, Whitehead PG, Jarvie HP, Flynn N. On modelling the mechanisms that
control in-stream phosphorus, macrophyte, and epiphyte dynamics: an assessment of a new model using
general sensitivity analysis. Water Resour Res. 2001;37(11):2777-2792. DOI: 10.1029/2000WR000115.
[19] Schoumans OF, Mol-Dijkstra J, Akkermans LMW, Roest CWJ. SIMPLE: Assessment of non-point
phosphorus pollution from agricultural land to surface waters by means of a new methodology. Wat Sci
Tech. 2002;45:177-182. DOI: WebQuery/wurpubs/314355.
[20] Dokulil MT, Teubner K. Eutrophication and restoration of shallow lakes – the concept of stable
equilibria revisited. Hydrobiologia. 2003;506/509:29-35. DOI: 10.1023/B:HYDR.0000008629.34761.ed.
[21] Jense JH. A model of nutrient dynamics in shallow lakes in relation to multiple stable states. Hydro-
biologia 1997;342/343:1-8. DOI: 10.1023/A:1017018812215.
ZASTOSOWANIE INTEGRALNEGO WSKA�NIKA STANU TROFICZNEGO
DO OCENY ODTWORZONYCH P£YTKICH ZBIORNIKÓW
Katedra Melioracji i Kszta³towania Œrodowiska
Uniwersytet Warmiñsko-Mazurski w Olsztynie
Abstrakt: W pracy podjêto próbê oceny stanu troficznego piêciu p³ytkich zbiorników, nale¿¹cych do grupy
oko³o 30 obiektów Pojezierza Olsztyñskiego, wspó³czeœnie odtworzonych po osuszeniu dokonanym w XIX
w. W szczególnoœci przeanalizowano mo¿liwoœæ zastosowania integralnego wskaŸnika troficznoœci (Index ofTrophical State – ITS). WskaŸnik ten jest stosunkowo now¹ metod¹ diagnozy nasilenia procesu eutrofizacji.
Bazuje na ocenie równowagi procesów produkcji i rozk³adu materii organicznej, któr¹ okreœla siê poprzez
symultaniczny pomiar nasycenia wody tlenem i odczynu. Metoda ta jest przedstawiana jako uniwersalna,
maj¹ca zastosowanie w ró¿nych typach wód. W niniejszej pracy wykorzystano j¹ do oceny zbiorników
p³ytkich, cechuj¹cych siê du¿ym nadmiarem fosforu w obiegu i podatnych na zakwity sinic w sezonie letnim
(czêsto bardzo intensywne).
Badania w przekroju 3 lat (2010–2012) wykaza³y istotn¹ statystycznie korelacjê pomiêdzy %O2 i pH, co
jest podstawowym wymogiem mo¿liwoœci zastosowania wskaŸnika ITS. Wspó³czynniki korelacji dla
poszczególnych obiektów wodnych wynosi³y r = 0,68–0,83. Wyniki oceny stanu w kolejnych latach
zmienia³y siê w zakresie od eutrofii do wartoœci wykraczaj¹cych poza granicê tego stanu (ITS od 7,73 do
8,67). Uzyskane wyniki w wiêkszoœci przypadków by³y zgodne z rezultatami oceny powszechnie stosowanej
metody TSI Carlsona, co wskazuje, ¿e równie¿ w zdegradowanych zbiornikach relacja pH-O2 odzwierciedla
ich stan ekologiczny.
S³owa kluczowe: stan troficzny, TSI Carlsona, wskaŸnik ITS, odtworzone jeziora, eutrofizacja
The Use of the Integrated Trophic State Index in Evaluation... 1283

Mariusz DUDZIAK1* and Marek GRYTA2
NANOFILTRATION OF FERMENTATION SOLUTIONS
– UNFAVOURABLE PHENOMENA
AND MEMBRANE CLEANING
NANOFILTRACJA ROZTWORÓW FERMENTACYJNYCH
– ZJAWISKA NIEKORZYSTNE ORAZ CZYSZCZENIE MEMBRAN
Abstract: The intensity of unfavourable phenomena occurring in the nanofiltration process of fermentation
solutions, and the possibility of cleaning the membranes after this process were studied. The experiment was
carried out using a tubular module equipped with the AFC-30 membrane. The filtration process was carried
out at a transmembrane pressure of 2.0 MPa, linear velocity of the feed of 3.4 m/s and the temperature of the
feed equal to 20 oC. Hydraulic performance of the membrane was tested both during the filtration of model
and real solutions. The conditions for efficient cleaning of fouled surfaces of the membranes by using
different chemical reagents were determined. It was also attempted to rinse the membrane with clean water.
A preliminary study was performed to determine the transport and separation characteristics of the AFC-30
membrane for deionized water and salt solutions of NaCl and MgSO4 representing mono- and divalent ions,
respectively. In this case, the membrane was tested under varying transmembrane pressure in the range of 1.0
to 2.0 MPa.
Keywords: nanofiltration, fermentation solutions, decrease of hydraulic capacity of membrane, membrane
surface cleaning
Membrane techniques are used, among others, as a separation tool in separation
processes used for technological and waste streams occurring in the liquid or gas phase
[1]. The use of pressure-driven membrane processes such as microfiltration, ultra-
filtration, nanofiltration and reverse osmosis, has become increasingly common in the
case of liquid streams. Those processes have been applied in order to isolate the
individual components present in the form of suspensions, colloids or true solution
[1–2]. The characteristics of the pressure-driven membrane processes are presented in
DOI: 10.2428/ecea.2013.20(11)116 ECOL CHEM ENG A. 2013;20(11):1285-1294
1 Institute of Water and Wastewater Engineering, Silesian University of Technology, ul. S. Konarskiego 18,
44–100 Gliwice, Poland, phone: +48 32 237 16 98, fax: +48 32 237 10 47, email: [email protected]
2 Institute of Chemical and Environment Engineering, West Pomeranian University of Technology,
ul. J. Pu³askiego 10, 70–322 Szczecin, Poland, phone: +48 91 449 46 82, fax: +48 91 449 46 86, email:
* Corresponding author: [email protected]
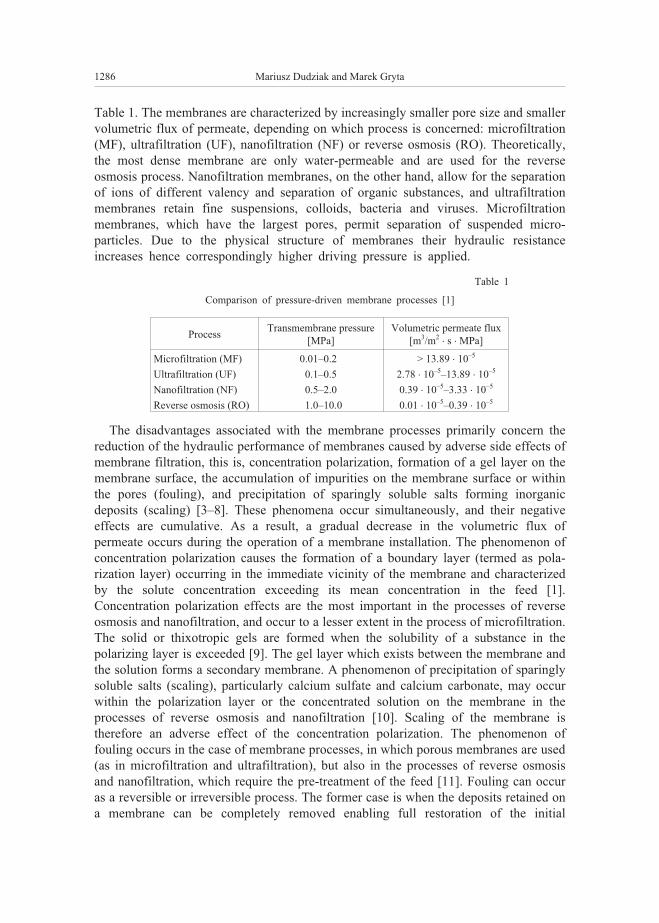
Table 1. The membranes are characterized by increasingly smaller pore size and smaller
volumetric flux of permeate, depending on which process is concerned: microfiltration
(MF), ultrafiltration (UF), nanofiltration (NF) or reverse osmosis (RO). Theoretically,
the most dense membrane are only water-permeable and are used for the reverse
osmosis process. Nanofiltration membranes, on the other hand, allow for the separation
of ions of different valency and separation of organic substances, and ultrafiltration
membranes retain fine suspensions, colloids, bacteria and viruses. Microfiltration
membranes, which have the largest pores, permit separation of suspended micro-
particles. Due to the physical structure of membranes their hydraulic resistance
increases hence correspondingly higher driving pressure is applied.
Table 1
Comparison of pressure-driven membrane processes [1]
ProcessTransmembrane pressure
[MPa]
Volumetric permeate flux
[m3/m2� s � MPa]
Microfiltration (MF) 0.01–0.2 > 13.89 � 10–5
Ultrafiltration (UF) 0.1–0.5 2.78 � 10–5–13.89 � 10–5
Nanofiltration (NF) 0.5–2.0 0.39 � 10–5–3.33 � 10–5
Reverse osmosis (RO) 1.0–10.0 0.01 � 10–5–0.39 � 10–5
The disadvantages associated with the membrane processes primarily concern the
reduction of the hydraulic performance of membranes caused by adverse side effects of
membrane filtration, this is, concentration polarization, formation of a gel layer on the
membrane surface, the accumulation of impurities on the membrane surface or within
the pores (fouling), and precipitation of sparingly soluble salts forming inorganic
deposits (scaling) [3–8]. These phenomena occur simultaneously, and their negative
effects are cumulative. As a result, a gradual decrease in the volumetric flux of
permeate occurs during the operation of a membrane installation. The phenomenon of
concentration polarization causes the formation of a boundary layer (termed as pola-
rization layer) occurring in the immediate vicinity of the membrane and characterized
by the solute concentration exceeding its mean concentration in the feed [1].
Concentration polarization effects are the most important in the processes of reverse
osmosis and nanofiltration, and occur to a lesser extent in the process of microfiltration.
The solid or thixotropic gels are formed when the solubility of a substance in the
polarizing layer is exceeded [9]. The gel layer which exists between the membrane and
the solution forms a secondary membrane. A phenomenon of precipitation of sparingly
soluble salts (scaling), particularly calcium sulfate and calcium carbonate, may occur
within the polarization layer or the concentrated solution on the membrane in the
processes of reverse osmosis and nanofiltration [10]. Scaling of the membrane is
therefore an adverse effect of the concentration polarization. The phenomenon of
fouling occurs in the case of membrane processes, in which porous membranes are used
(as in microfiltration and ultrafiltration), but also in the processes of reverse osmosis
and nanofiltration, which require the pre-treatment of the feed [11]. Fouling can occur
as a reversible or irreversible process. The former case is when the deposits retained on
a membrane can be completely removed enabling full restoration of the initial
1286 Mariusz Dudziak and Marek Gryta
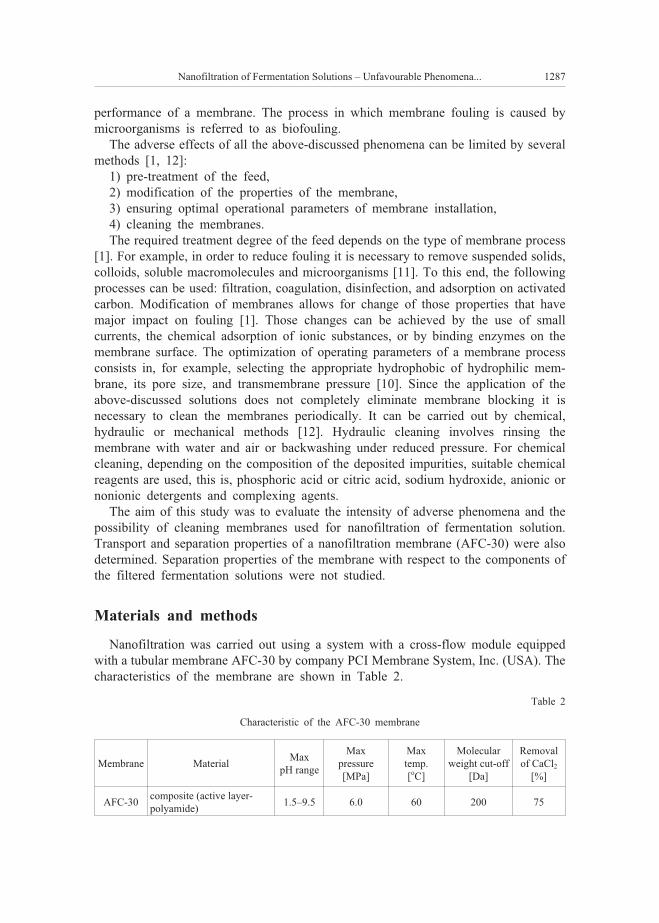
performance of a membrane. The process in which membrane fouling is caused by
microorganisms is referred to as biofouling.
The adverse effects of all the above-discussed phenomena can be limited by several
methods [1, 12]:
1) pre-treatment of the feed,
2) modification of the properties of the membrane,
3) ensuring optimal operational parameters of membrane installation,
4) cleaning the membranes.
The required treatment degree of the feed depends on the type of membrane process
[1]. For example, in order to reduce fouling it is necessary to remove suspended solids,
colloids, soluble macromolecules and microorganisms [11]. To this end, the following
processes can be used: filtration, coagulation, disinfection, and adsorption on activated
carbon. Modification of membranes allows for change of those properties that have
major impact on fouling [1]. Those changes can be achieved by the use of small
currents, the chemical adsorption of ionic substances, or by binding enzymes on the
membrane surface. The optimization of operating parameters of a membrane process
consists in, for example, selecting the appropriate hydrophobic of hydrophilic mem-
brane, its pore size, and transmembrane pressure [10]. Since the application of the
above-discussed solutions does not completely eliminate membrane blocking it is
necessary to clean the membranes periodically. It can be carried out by chemical,
hydraulic or mechanical methods [12]. Hydraulic cleaning involves rinsing the
membrane with water and air or backwashing under reduced pressure. For chemical
cleaning, depending on the composition of the deposited impurities, suitable chemical
reagents are used, this is, phosphoric acid or citric acid, sodium hydroxide, anionic or
nonionic detergents and complexing agents.
The aim of this study was to evaluate the intensity of adverse phenomena and the
possibility of cleaning membranes used for nanofiltration of fermentation solution.
Transport and separation properties of a nanofiltration membrane (AFC-30) were also
determined. Separation properties of the membrane with respect to the components of
the filtered fermentation solutions were not studied.
Materials and methods
Nanofiltration was carried out using a system with a cross-flow module equipped
with a tubular membrane AFC-30 by company PCI Membrane System, Inc. (USA). The
characteristics of the membrane are shown in Table 2.
Table 2
Characteristic of the AFC-30 membrane
Membrane MaterialMax
pH range
Max
pressure
[MPa]
Max
temp.
[oC]
Molecular
weight cut-off
[Da]
Removal
of CaCl2
[%]
AFC-30composite (active layer-
polyamide)1.5–9.5 6.0 60 200 75
Nanofiltration of Fermentation Solutions – Unfavourable Phenomena... 1287
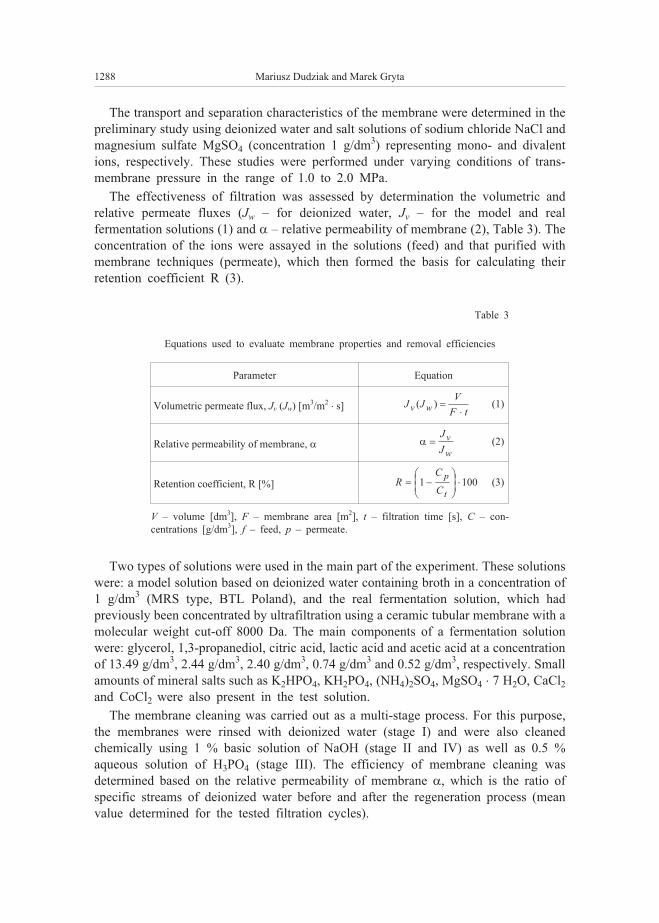
The transport and separation characteristics of the membrane were determined in the
preliminary study using deionized water and salt solutions of sodium chloride NaCl and
magnesium sulfate MgSO4 (concentration 1 g/dm3) representing mono- and divalent
ions, respectively. These studies were performed under varying conditions of trans-
membrane pressure in the range of 1.0 to 2.0 MPa.
The effectiveness of filtration was assessed by determination the volumetric and
relative permeate fluxes (Jw – for deionized water, Jv – for the model and real
fermentation solutions (1) and � – relative permeability of membrane (2), Table 3). The
concentration of the ions were assayed in the solutions (feed) and that purified with
membrane techniques (permeate), which then formed the basis for calculating their
retention coefficient R (3).
Table 3
Equations used to evaluate membrane properties and removal efficiencies
Parameter Equation
Volumetric permeate flux, Jv (Jw) [m3/m2� s] J J
V
F tv w( ) ��
(1)
Relative permeability of membrane, � � �J
Jv
w(2)
Retention coefficient, R [%] RC
C
p
t� �
�
�
��
��
�1 100 (3)
V – volume [dm3], F – membrane area [m2], t – filtration time [s], C – con-
centrations [g/dm3], f – feed, p – permeate.
Two types of solutions were used in the main part of the experiment. These solutions
were: a model solution based on deionized water containing broth in a concentration of
1 g/dm3 (MRS type, BTL Poland), and the real fermentation solution, which had
previously been concentrated by ultrafiltration using a ceramic tubular membrane with a
molecular weight cut-off 8000 Da. The main components of a fermentation solution
were: glycerol, 1,3-propanediol, citric acid, lactic acid and acetic acid at a concentration
of 13.49 g/dm3, 2.44 g/dm3, 2.40 g/dm3, 0.74 g/dm3 and 0.52 g/dm3, respectively. Small
amounts of mineral salts such as K2HPO4, KH2PO4, (NH4)2SO4, MgSO4 � 7 H2O, CaCl2and CoCl2 were also present in the test solution.
The membrane cleaning was carried out as a multi-stage process. For this purpose,
the membranes were rinsed with deionized water (stage I) and were also cleaned
chemically using 1 % basic solution of NaOH (stage II and IV) as well as 0.5 %
aqueous solution of H3PO4 (stage III). The efficiency of membrane cleaning was
determined based on the relative permeability of membrane �, which is the ratio of
specific streams of deionized water before and after the regeneration process (mean
value determined for the tested filtration cycles).
1288 Mariusz Dudziak and Marek Gryta
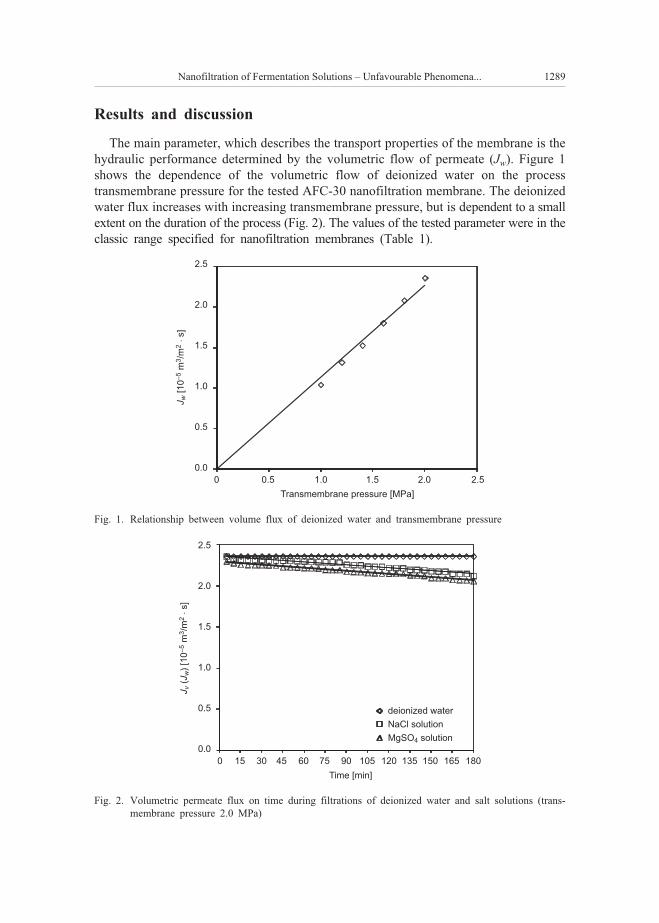
Results and discussion
The main parameter, which describes the transport properties of the membrane is the
hydraulic performance determined by the volumetric flow of permeate (Jw). Figure 1
shows the dependence of the volumetric flow of deionized water on the process
transmembrane pressure for the tested AFC-30 nanofiltration membrane. The deionized
water flux increases with increasing transmembrane pressure, but is dependent to a small
extent on the duration of the process (Fig. 2). The values of the tested parameter were in the
classic range specified for nanofiltration membranes (Table 1).
Nanofiltration of Fermentation Solutions – Unfavourable Phenomena... 1289
2.5
2.0
1.5
1.0
0.5
0.0
Jw
[10
m/m
s]
–5
32
�
0 0.5 1.0
Transmembrane pressure [MPa]
1.5 2.0 2.5
2.5
2.0
1.5
1.0
0.5
0.0
Jv
J()
[10
m/m
s]
w–
53
2�
0 15 30 45 60 75 90 105 120 135 150 165 180
Time [min]
deionized water
NaCl solution
MgSO solution4
Fig. 2. Volumetric permeate flux on time during filtrations of deionized water and salt solutions (trans-
membrane pressure 2.0 MPa)
Fig. 1. Relationship between volume flux of deionized water and transmembrane pressure
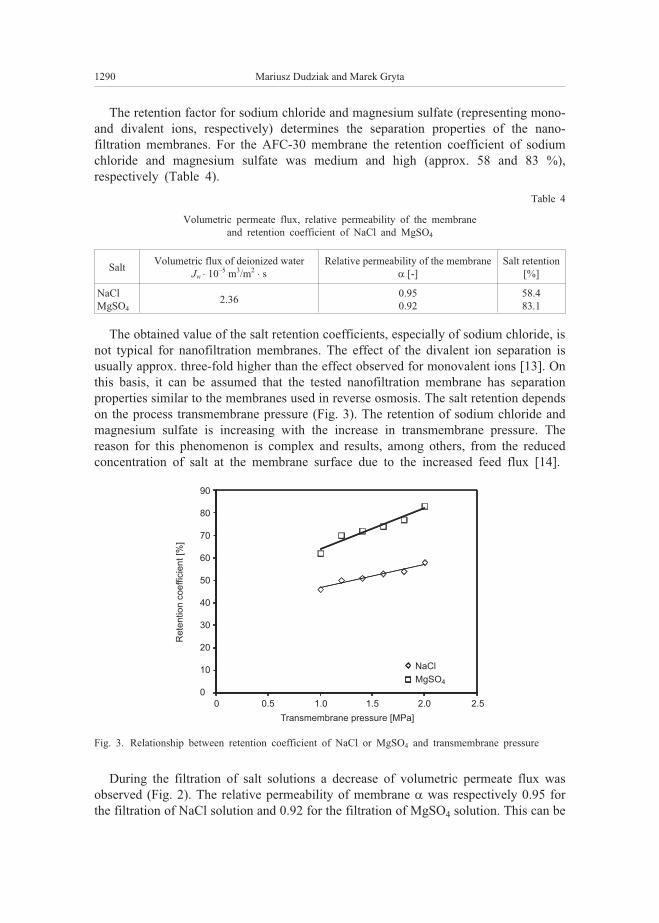
The retention factor for sodium chloride and magnesium sulfate (representing mono-
and divalent ions, respectively) determines the separation properties of the nano-
filtration membranes. For the AFC-30 membrane the retention coefficient of sodium
chloride and magnesium sulfate was medium and high (approx. 58 and 83 %),
respectively (Table 4).
Table 4
Volumetric permeate flux, relative permeability of the membrane
and retention coefficient of NaCl and MgSO4
SaltVolumetric flux of deionized water
Jw � 10–5 m3/m2� s
Relative permeability of the membrane
� [-]
Salt retention
[%]
NaCl
MgSO4
2.360.95
0.92
58.4
83.1
The obtained value of the salt retention coefficients, especially of sodium chloride, is
not typical for nanofiltration membranes. The effect of the divalent ion separation is
usually approx. three-fold higher than the effect observed for monovalent ions [13]. On
this basis, it can be assumed that the tested nanofiltration membrane has separation
properties similar to the membranes used in reverse osmosis. The salt retention depends
on the process transmembrane pressure (Fig. 3). The retention of sodium chloride and
magnesium sulfate is increasing with the increase in transmembrane pressure. The
reason for this phenomenon is complex and results, among others, from the reduced
concentration of salt at the membrane surface due to the increased feed flux [14].
During the filtration of salt solutions a decrease of volumetric permeate flux was
observed (Fig. 2). The relative permeability of membrane � was respectively 0.95 for
the filtration of NaCl solution and 0.92 for the filtration of MgSO4 solution. This can be
1290 Mariusz Dudziak and Marek Gryta
90
80
70
60
50
40
30
20
10
0
0 0.5 1.0
Transmembrane pressure [MPa]
Re
ten
tio
nco
effic
ien
t[%
]
1.5 2.0 2.5
NaCl
MgSO4
Fig. 3. Relationship between retention coefficient of NaCl or MgSO4 and transmembrane pressure
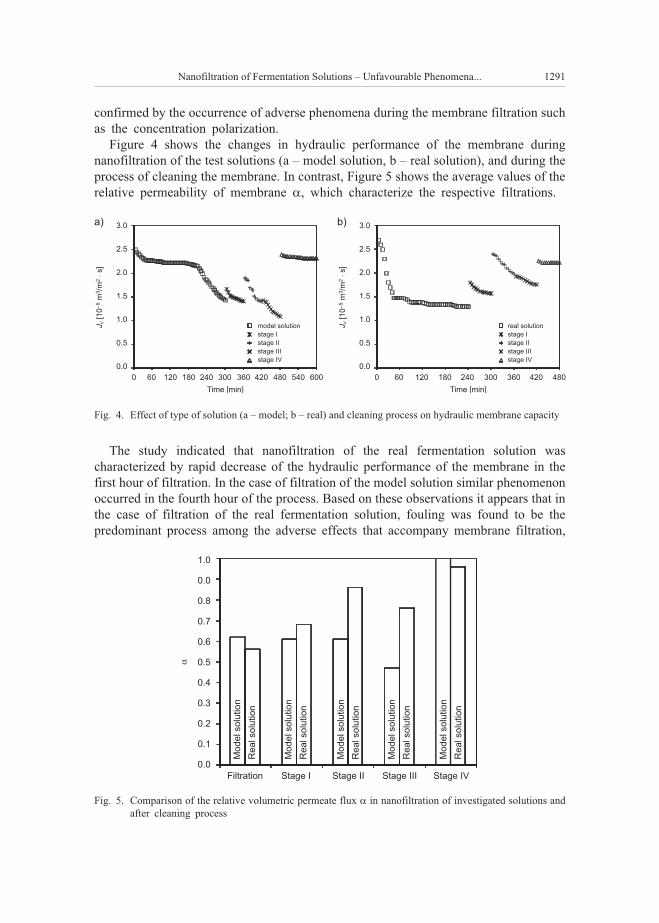
confirmed by the occurrence of adverse phenomena during the membrane filtration such
as the concentration polarization.
Figure 4 shows the changes in hydraulic performance of the membrane during
nanofiltration of the test solutions (a – model solution, b – real solution), and during the
process of cleaning the membrane. In contrast, Figure 5 shows the average values of the
relative permeability of membrane �, which characterize the respective filtrations.
The study indicated that nanofiltration of the real fermentation solution was
characterized by rapid decrease of the hydraulic performance of the membrane in the
first hour of filtration. In the case of filtration of the model solution similar phenomenon
occurred in the fourth hour of the process. Based on these observations it appears that in
the case of filtration of the real fermentation solution, fouling was found to be the
predominant process among the adverse effects that accompany membrane filtration,
Nanofiltration of Fermentation Solutions – Unfavourable Phenomena... 1291
3.0
2.5
2.0
1.5
1.0
0.5
0.0
3.0
2.5
2.0
1.5
1.0
0.5
0.0
Jv
[10
m/m
s]
–5
32
�
Jv
[10
m/m
s]
–5
32
�
0 060 60120 120180 180240 240300
Time [min] Time [min]
300360 360420 420480 480540 600
model solution
stage I
stage II
stage III
stage IV
a) b)
real solution
stage I
stage II
stage III
stage IV
Fig. 4. Effect of type of solution (a – model; b – real) and cleaning process on hydraulic membrane capacity
1.0
0.0
0.8
0.7
0.6
0.5
0.4
0.3
0.2
0.1
0.0
�
Stage I Stage II Stage III Stage IVFiltration
Mo
de
lso
lutio
n
Mo
de
lso
lutio
n
Mo
de
lso
lutio
n
Mo
de
lso
lutio
n
Mo
de
lso
lutio
n
Re
also
lutio
n
Re
also
lutio
n
Re
also
lutio
n
Re
also
lutio
n
Re
also
lutio
n
Fig. 5. Comparison of the relative volumetric permeate flux � in nanofiltration of investigated solutions and
after cleaning process
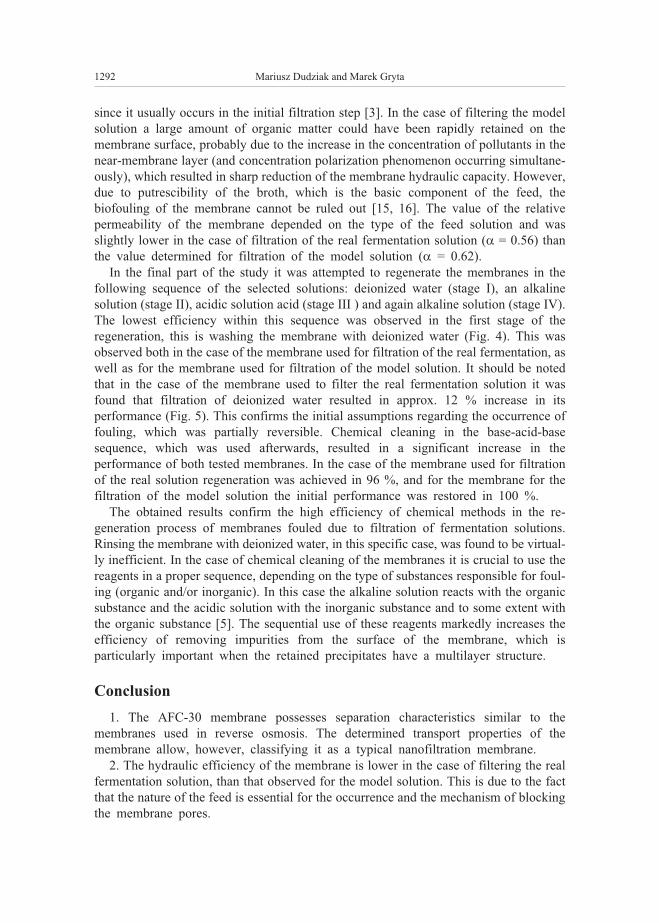
since it usually occurs in the initial filtration step [3]. In the case of filtering the model
solution a large amount of organic matter could have been rapidly retained on the
membrane surface, probably due to the increase in the concentration of pollutants in the
near-membrane layer (and concentration polarization phenomenon occurring simultane-
ously), which resulted in sharp reduction of the membrane hydraulic capacity. However,
due to putrescibility of the broth, which is the basic component of the feed, the
biofouling of the membrane cannot be ruled out [15, 16]. The value of the relative
permeability of the membrane depended on the type of the feed solution and was
slightly lower in the case of filtration of the real fermentation solution (� = 0.56) than
the value determined for filtration of the model solution (� = 0.62).
In the final part of the study it was attempted to regenerate the membranes in the
following sequence of the selected solutions: deionized water (stage I), an alkaline
solution (stage II), acidic solution acid (stage III ) and again alkaline solution (stage IV).
The lowest efficiency within this sequence was observed in the first stage of the
regeneration, this is washing the membrane with deionized water (Fig. 4). This was
observed both in the case of the membrane used for filtration of the real fermentation, as
well as for the membrane used for filtration of the model solution. It should be noted
that in the case of the membrane used to filter the real fermentation solution it was
found that filtration of deionized water resulted in approx. 12 % increase in its
performance (Fig. 5). This confirms the initial assumptions regarding the occurrence of
fouling, which was partially reversible. Chemical cleaning in the base-acid-base
sequence, which was used afterwards, resulted in a significant increase in the
performance of both tested membranes. In the case of the membrane used for filtration
of the real solution regeneration was achieved in 96 %, and for the membrane for the
filtration of the model solution the initial performance was restored in 100 %.
The obtained results confirm the high efficiency of chemical methods in the re-
generation process of membranes fouled due to filtration of fermentation solutions.
Rinsing the membrane with deionized water, in this specific case, was found to be virtual-
ly inefficient. In the case of chemical cleaning of the membranes it is crucial to use the
reagents in a proper sequence, depending on the type of substances responsible for foul-
ing (organic and/or inorganic). In this case the alkaline solution reacts with the organic
substance and the acidic solution with the inorganic substance and to some extent with
the organic substance [5]. The sequential use of these reagents markedly increases the
efficiency of removing impurities from the surface of the membrane, which is
particularly important when the retained precipitates have a multilayer structure.
Conclusion
1. The AFC-30 membrane possesses separation characteristics similar to the
membranes used in reverse osmosis. The determined transport properties of the
membrane allow, however, classifying it as a typical nanofiltration membrane.
2. The hydraulic efficiency of the membrane is lower in the case of filtering the real
fermentation solution, than that observed for the model solution. This is due to the fact
that the nature of the feed is essential for the occurrence and the mechanism of blocking
the membrane pores.
1292 Mariusz Dudziak and Marek Gryta
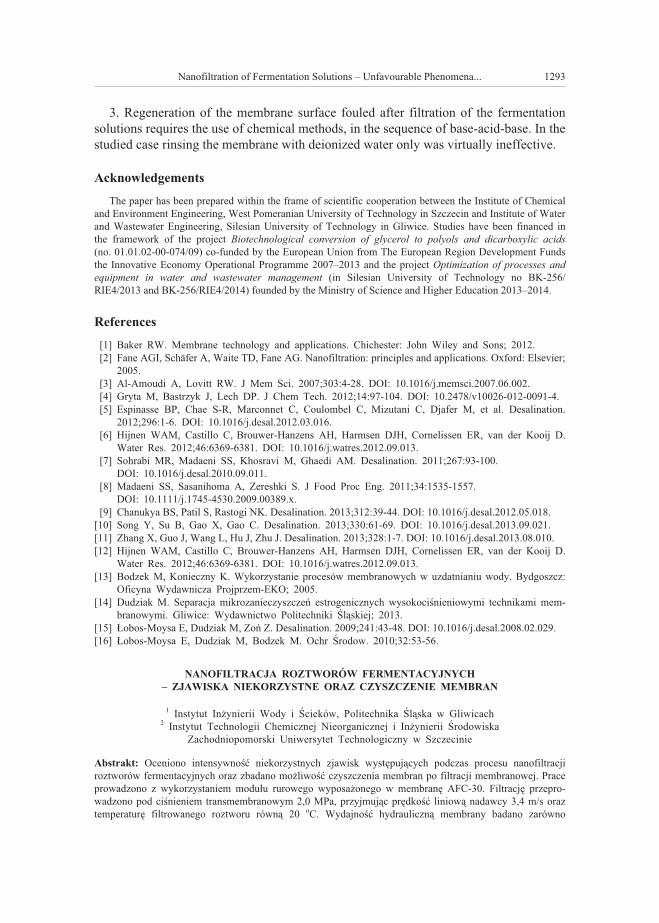
3. Regeneration of the membrane surface fouled after filtration of the fermentation
solutions requires the use of chemical methods, in the sequence of base-acid-base. In the
studied case rinsing the membrane with deionized water only was virtually ineffective.
Acknowledgements
The paper has been prepared within the frame of scientific cooperation between the Institute of Chemical
and Environment Engineering, West Pomeranian University of Technology in Szczecin and Institute of Water
and Wastewater Engineering, Silesian University of Technology in Gliwice. Studies have been financed in
the framework of the project Biotechnological conversion of glycerol to polyols and dicarboxylic acids(no. 01.01.02-00-074/09) co-funded by the European Union from The European Region Development Funds
the Innovative Economy Operational Programme 2007–2013 and the project Optimization of processes andequipment in water and wastewater management (in Silesian University of Technology no BK-256/
RIE4/2013 and BK-256/RIE4/2014) founded by the Ministry of Science and Higher Education 2013–2014.
References
[1] Baker RW. Membrane technology and applications. Chichester: John Wiley and Sons; 2012.
[2] Fane AGI, Schäfer A, Waite TD, Fane AG. Nanofiltration: principles and applications. Oxford: Elsevier;
2005.
[3] Al-Amoudi A, Lovitt RW. J Mem Sci. 2007;303:4-28. DOI: 10.1016/j.memsci.2007.06.002.
[4] Gryta M, Bastrzyk J, Lech DP. J Chem Tech. 2012;14:97-104. DOI: 10.2478/v10026-012-0091-4.
[5] Espinasse BP, Chae S-R, Marconnet C, Coulombel C, Mizutani C, Djafer M, et al. Desalination.
2012;296:1-6. DOI: 10.1016/j.desal.2012.03.016.
[6] Hijnen WAM, Castillo C, Brouwer-Hanzens AH, Harmsen DJH, Cornelissen ER, van der Kooij D.
Water Res. 2012;46:6369-6381. DOI: 10.1016/j.watres.2012.09.013.
[7] Sohrabi MR, Madaeni SS, Khosravi M, Ghaedi AM. Desalination. 2011;267:93-100.
DOI: 10.1016/j.desal.2010.09.011.
[8] Madaeni SS, Sasanihoma A, Zereshki S. J Food Proc Eng. 2011;34:1535-1557.
DOI: 10.1111/j.1745-4530.2009.00389.x.
[9] Chanukya BS, Patil S, Rastogi NK. Desalination. 2013;312:39-44. DOI: 10.1016/j.desal.2012.05.018.
[10] Song Y, Su B, Gao X, Gao C. Desalination. 2013;330:61-69. DOI: 10.1016/j.desal.2013.09.021.
[11] Zhang X, Guo J, Wang L, Hu J, Zhu J. Desalination. 2013;328:1-7. DOI: 10.1016/j.desal.2013.08.010.
[12] Hijnen WAM, Castillo C, Brouwer-Hanzens AH, Harmsen DJH, Cornelissen ER, van der Kooij D.
Water Res. 2012;46:6369-6381. DOI: 10.1016/j.watres.2012.09.013.
[13] Bodzek M, Konieczny K. Wykorzystanie procesów membranowych w uzdatnianiu wody. Bydgoszcz:
Oficyna Wydawnicza Projprzem-EKO; 2005.
[14] Dudziak M. Separacja mikrozanieczyszczeñ estrogenicznych wysokociœnieniowymi technikami mem-
branowymi. Gliwice: Wydawnictwo Politechniki Œl¹skiej; 2013.
[15] £obos-Moysa E, Dudziak M, Zoñ Z. Desalination. 2009;241:43-48. DOI: 10.1016/j.desal.2008.02.029.
[16] £obos-Moysa E, Dudziak M, Bodzek M. Ochr Œrodow. 2010;32:53-56.
NANOFILTRACJA ROZTWORÓW FERMENTACYJNYCH
– ZJAWISKA NIEKORZYSTNE ORAZ CZYSZCZENIE MEMBRAN
1 Instytut In¿ynierii Wody i Œcieków, Politechnika Œl¹ska w Gliwicach2 Instytut Technologii Chemicznej Nieorganicznej i In¿ynierii Œrodowiska
Zachodniopomorski Uniwersytet Technologiczny w Szczecinie
Abstrakt: Oceniono intensywnoœæ niekorzystnych zjawisk wystêpuj¹cych podczas procesu nanofiltracji
roztworów fermentacyjnych oraz zbadano mo¿liwoœæ czyszczenia membran po filtracji membranowej. Prace
prowadzono z wykorzystaniem modu³u rurowego wyposa¿onego w membranê AFC-30. Filtracjê przepro-
wadzono pod ciœnieniem transmembranowym 2,0 MPa, przyjmuj¹c prêdkoœæ liniow¹ nadawcy 3,4 m/s oraz
temperaturê filtrowanego roztworu równ¹ 20 oC. Wydajnoœæ hydrauliczn¹ membrany badano zarówno
Nanofiltration of Fermentation Solutions – Unfavourable Phenomena... 1293

podczas filtracji roztworów modelowych, jak i rzeczywistych. Okreœlono warunki prowadzenia efektywnego
czyszczenia zanieczyszczonej powierzchni membran metod¹ chemiczn¹ z u¿yciem ró¿nych reagentów.
Membranê próbowano równie¿ p³ukaæ czyst¹ wod¹. W zakresie badañ wstêpnych wyznaczona zosta³a
charakterystyka transportowa i separacyjna membrany AFC-30 dla wody zdejonizowanej oraz roztworów soli
NaCl i MgSO4 reprezentuj¹cych odpowiednio jony jedno- i dwuwartoœciowe. W tym przypadku w³aœciwoœci
membrany badano w zmiennych warunkach ciœnienia transmembranowego od 1,0 do 2,0 MPa.
S³owa kluczowe: nanofiltracja, roztwory fermentacyjne, obni¿enie wydajnoœci hydraulicznej membrany,
czyszczenie powierzchni membran
1294 Mariusz Dudziak and Marek Gryta
Marek TARNAWSKI1* and Natalia FLORENCKA2
CHANGEABILITY OF HEAVY METALS CONTENT
IN THE SEDIMENT OF THE WATER RESERVOIR
IN THE 1996–2005 YEARS
ZMIENNOŒÆ ZAWARTOŒCI METALI CIʯKICH
W OSADACH DENNYCH ZBIORNIKA WODNEGO
W LATACH 1996–2005
Abstract: The presented study was aimed to analyze the variability of the selected heavy metal content in
bottom sediments from a dam reservoir in Krempna, located in the upper part of the river Wisloka, in the
Subcarpathian Voivodeship. The concentrations of the analyzed heavy metals in the examined sediments were
variable. The copper content ranged from 8.4–49.16 mg � kg–1, zinc 28–98 mg � kg–1, chromium 8.7–70
mg � kg–1, nickel 20.53–74.5 mg � kg–1, lead 7.7–64.3 mg � kg–1 and cadmium 0.1–0.6 mg � kg–1. The heavy
metal concentrations in the bottom sediments of the Krempna reservoir were referred to the limit values that
inform whether the material is contaminated. The contents of heavy metals did not exceed the limit content.
The analyzed material was characterized by elevated concentrations of copper, chromium, nickel and lead, far
beyond the geochemical background of the Polish sediments given by the Polish Geological Institute.
Particularly high concentrations of nickel qualify the sediment as the class III, ie as contaminated. In the
analyzed study period of 1996–2005 the bottom sediments showed no clear tendency to excessive
accumulation of the examined elements. Heavy metal concentrations fluctuated in different years of the
sediment collection, however there was no clear decreasing or increasing trend.
Keywords: bottom sediments, heavy metals, dam reservoir
Heavy metals, due to their specific characteristics, are a potential threat to all living
organisms. They can occur in different forms in aquatic environment: as water-soluble
compounds or associated with the particles of the solid phase (mineral suspension of
bottom sediments) [1]. Soluble forms of metals are precipitated as a result of oxidation
processes, creation of different chemical compounds and sorption by organic and
DOI: 10.2428/ecea.2013.20(11)117 ECOL CHEM ENG A. 2013;20(11):1295-1303
1 Department of Hydraulic Engineering and Geotechnics, University of Agriculture in Krakow,
al. A. Mickiewicza 24–28, 30–059 Kraków, Poland, phone: +48 12 662 41 05, fax: +48 12 633 11 70, email:
[email protected] Faculty of Mining Surveying Environmental Engineering, University of Science and Technology,
al. A. Mickiewicza 30 C–4, 30–059 Kraków, Poland, phone: +48 12 617 47 55, email: [email protected]
* Corresponding autor: [email protected]
mineral fraction of sediments. At present, the chemical composition of sediments is
significantly affected by the intensity of agricultural use of catchments, by elution of
residues of fertilizers and plant protection products from fields and meadows,
transportation, dust emissions and sewage discharge, which leads to the increase in the
heavy metal concentration in sediments [2–5]. Despite the temporary immobilization of
metals in sediments, they are a potential threat to the aquatic environment.
Geochemical composition of sediments accumulated on the bottom of rivers and
reservoirs is a good indicator of surface water purity [6, 7]. Observation of changes in
sediments allows to determine the changes occurring in watercourses.
Properties of sediments from running waters are different than those from stagnant
water sediments. Sediments from artificial reservoirs, which are intermediate between
rivers and lakes, are characterized by yet other qualities. Dam reservoirs are strongly
influenced by the catchment’s morphology, hydrological conditions, chemical com-
position of water, as well as by flora and fauna of the supplying streams [8].
Hydrological conditions, especially changes in water flow velocity in the dammed river
section affect the diversity of heavy metal content in the reservoir’s sediments [9]. High
water levels in rivers and streams flowing directly into reservoirs cause significant
leaching of chemicals, removing of soil material from catchments and introducing of
nutrients. The deposition of heavy metal-contaminated slurry onto floodplain soils
during floods or due to excavation of sediments during dredging of reservoirs
constitutes a threat to the terrestrial environment [10].
Silting of reservoirs is one of the main limiting factors for their proper operation.
Small objects are particularly exposed to rapid loss of capacity in favor of the
fine-grained mineral material accumulated in the reservoir bowl [11, 12]. The analysis
of the heavy metal concentration accumulated in bottom sediments allows to identify
the source, speed and the route of distribution of elements in the reservoir and is the
basis for determining the secondary water pollution . This is particularly important in
the case of small reservoirs, due to the rapid rate of silting and the necessity of periodic
dredging of these reservoirs [13].
This study was aimed to investigate the variability of the selected heavy metal
concentration in bottom sediments from the dam reservoir in Krempna, located in the
upper part of the river Wisloka.
Material and methods
Bottom sediments were collected 4 times in the period of 1996–2005 from the dam
reservoir located in Krempna. Bottom sediment samples were collected within three
zones of the reservoir: at the inlet, in the middle and at the outlet (near-dam zone). The
sampling sites were located outside the flow riverbed and three samples from each zone
were collected (Fig. 1). The material was sampled from under the water table using the
Ekman’s bottom sediment probe. In order to average the sampled material, 6
subsamples were collected, which then were mixed to form the final sample. The
sediments were collected from the 0–15 cm layer.
1296 Marek Tarnawski and Natalia Florencka
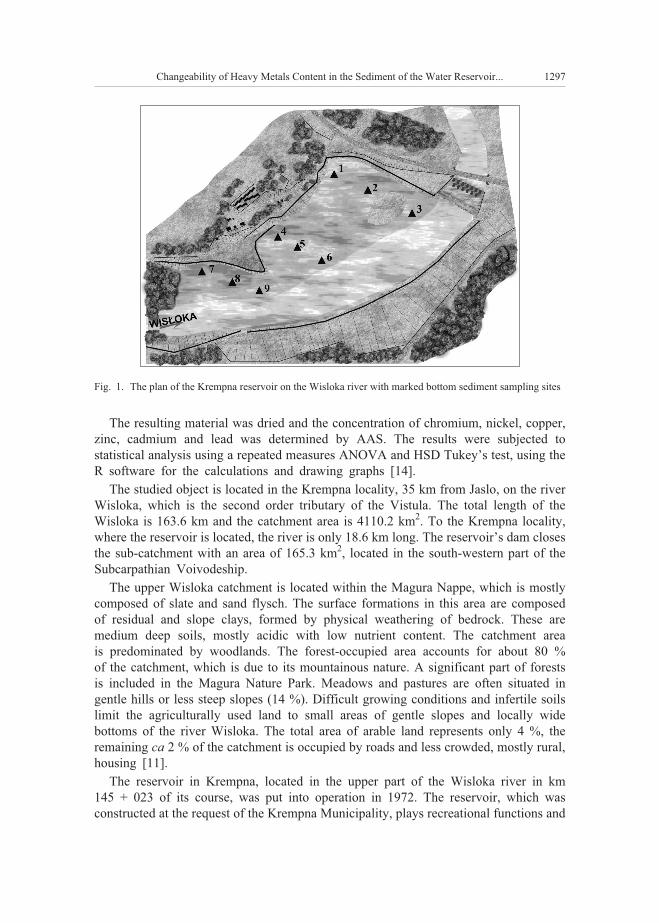
The resulting material was dried and the concentration of chromium, nickel, copper,
zinc, cadmium and lead was determined by AAS. The results were subjected to
statistical analysis using a repeated measures ANOVA and HSD Tukey’s test, using the
R software for the calculations and drawing graphs [14].
The studied object is located in the Krempna locality, 35 km from Jaslo, on the river
Wisloka, which is the second order tributary of the Vistula. The total length of the
Wisloka is 163.6 km and the catchment area is 4110.2 km2. To the Krempna locality,
where the reservoir is located, the river is only 18.6 km long. The reservoir’s dam closes
the sub-catchment with an area of 165.3 km2, located in the south-western part of the
Subcarpathian Voivodeship.
The upper Wisloka catchment is located within the Magura Nappe, which is mostly
composed of slate and sand flysch. The surface formations in this area are composed
of residual and slope clays, formed by physical weathering of bedrock. These are
medium deep soils, mostly acidic with low nutrient content. The catchment area
is predominated by woodlands. The forest-occupied area accounts for about 80 %
of the catchment, which is due to its mountainous nature. A significant part of forests
is included in the Magura Nature Park. Meadows and pastures are often situated in
gentle hills or less steep slopes (14 %). Difficult growing conditions and infertile soils
limit the agriculturally used land to small areas of gentle slopes and locally wide
bottoms of the river Wisloka. The total area of arable land represents only 4 %, the
remaining ca 2 % of the catchment is occupied by roads and less crowded, mostly rural,
housing [11].
The reservoir in Krempna, located in the upper part of the Wisloka river in km
145 + 023 of its course, was put into operation in 1972. The reservoir, which was
constructed at the request of the Krempna Municipality, plays recreational functions and
Changeability of Heavy Metals Content in the Sediment of the Water Reservoir... 1297
Fig. 1. The plan of the Krempna reservoir on the Wisloka river with marked bottom sediment sampling sites
enables the operation of a small hydropower plant. A 145 m long earth dam, with a
four-span concrete weir, acts as the damming element. Below the existing reservoir
there will be a designed large Katy-Myscowa reservoir. The reservoir in Krempna will
serve as the preliminary reservoir.
In the first period of operation, the flooding area was about 3.2 ha and the volume
was 119.1 thousand m3. In 1987–1988 and in 2005 renovation works were carried out,
because of the significant silting of the reservoir. Bottom material was partially
deposited in the reservoir bowl, forming a left-bank beach and was disposed of on local
farms.
Results and discussion
The examined sediments were characterized by varying concentration of the
analyzed heavy metals (Fig. 2). The concentration of copper over the study period
ranged from 8.4 to 49.16 mg � kg–1. The least variable concentrations of copper in all
analyzed samples were recorded in 2002. The lowest content was recorded in 1996 in
the section located at the inlet to the reservoir. Within ten years of the study, the
concentration of zinc was 28–98 mg � kg–1. The concentration of this metal was the
highest in 2002, particularly in the sites located near the inlet and the mainstream. These
values were about 40 % higher than those obtained in 1996. The smallest amounts of
zinc were found in the sediment samples collected in the first year of the study. The
content of chromium ranged from 8.7 to 70 mg � kg–1. The smallest amounts of
chromium, recorded in 1999, were over twice lower than the ones obtained in 2002 and
1996, and over 4-times lower than the values recorded in 2005. Accumulation of this
metal increased at the outlet from the reservoir. The nickel content ranged from 20.53 to
74.5 mg � kg–1 over the whole study period. The highest concentrations were recorded in
2002 in all samples, while a significant decrease was observed in 2005. The
concentrations of lead ranged from 7.7 mg � kg–1 to 64.3 mg � kg–1 over the study period.
The highest value (about 60 mg � kg–1) was observed in the first year of the study at the
outlet from the reservoir. The remaining results were similar to each other. The
cadmium concentrations ranged from 0.1 to 0.6 mg � kg–1. The cadmium concentration
was even over the 9-year period in the examined sediment samples at the outlet of the
reservoir. The highest cadmium concentration was recorded in 2002 at the inlet – it was
almost 2–4-times higher than in 1996.
The repeated measures ANOVA test was performed, in order to show statistically
significant differences between the values detected in each year of the study for the
selected heavy metals. The calculated test statistics (F) and probability values (p)
(Fig. 2) indicate a rejection of the null hypothesis for all analyzed groups of elements
(Cu, Zn, Ni, Cr, Pb, Cd) in favor of the alternative hypothesis and thus demonstrate the
differences between the groups in different years. Moreover, a HSD Tukey’s test was
performed – a so-called post-hoc test, used when the analysis of variance (ANOVA)
showed that the groups are significantly different. HSD is used to indicate the differing
groups. The test involves the calculation of a “p” value for each pair of groups, which
indicates the significantly different pairs, when it is lower than 0.05 (Table 1).
1298 Marek Tarnawski and Natalia Florencka
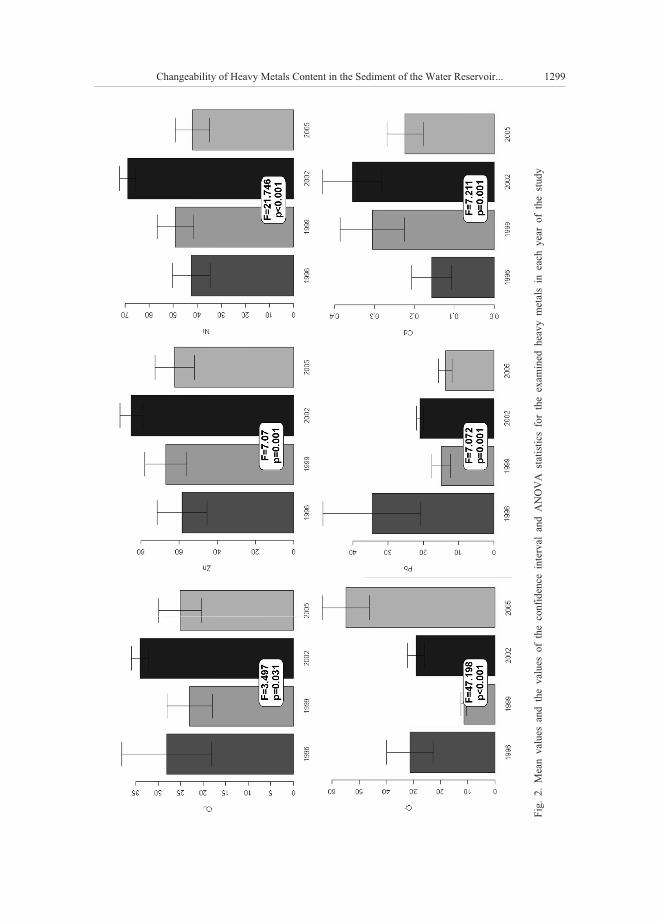
Changeability of Heavy Metals Content in the Sediment of the Water Reservoir... 1299
Fig
.2.
Mea
nval
ues
and
the
val
ues
of
the
confi
den
cein
terv
alan
dA
NO
VA
stat
isti
csfo
rth
eex
amin
edhea
vy
met
als
inea
chyea
rof
the
study
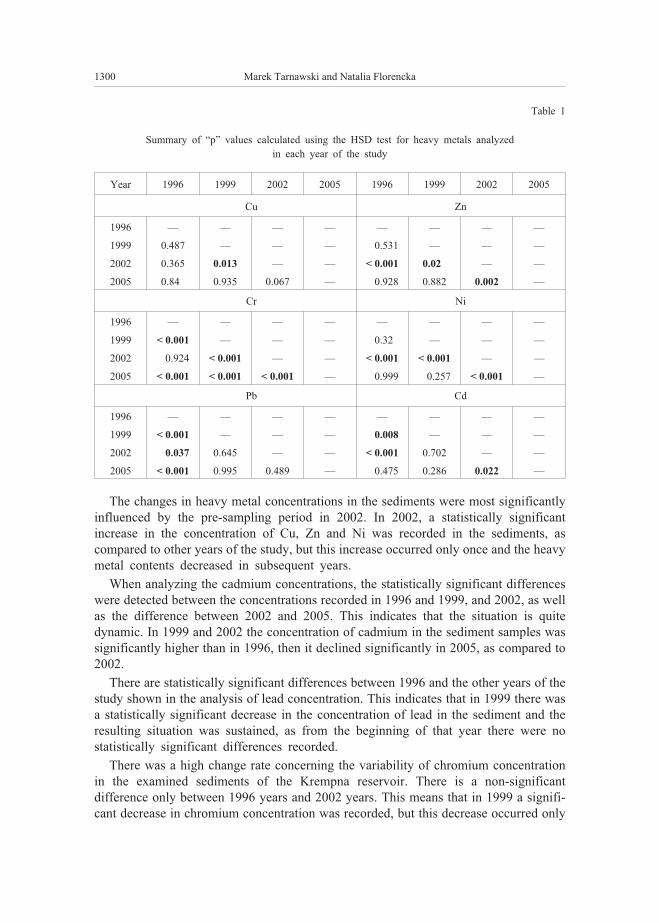
Table 1
Summary of “p” values calculated using the HSD test for heavy metals analyzed
in each year of the study
Year 1996 1999 2002 2005 1996 1999 2002 2005
Cu Zn
1996 — — — — — — — —
1999 0.487 — — — < 0.531 — — —
2002 0.365 0.013 — — < 0.001 0.02 — —
2005 0.84 0.935 0.067 — < 0.928 0.882 0.002 —
Cr Ni
1996 — — — — — — — —
1999 < 0.001 — — — < 0.32 — — —
2002 < 0.924 < 0.001 — — < 0.001 < 0.001 — —
2005 < 0.001 < 0.001 < 0.001 — < 0.999 < 0.257 < 0.001 —
Pb Cd
1996 — — — — — — — —
1999 < 0.001 — — — < 0.008 — — —
2002 < 0.037 0.645 — — < 0.001 0.702 — —
2005 < 0.001 0.995 0.489 — < 0.475 0.286 0.022 —
The changes in heavy metal concentrations in the sediments were most significantly
influenced by the pre-sampling period in 2002. In 2002, a statistically significant
increase in the concentration of Cu, Zn and Ni was recorded in the sediments, as
compared to other years of the study, but this increase occurred only once and the heavy
metal contents decreased in subsequent years.
When analyzing the cadmium concentrations, the statistically significant differences
were detected between the concentrations recorded in 1996 and 1999, and 2002, as well
as the difference between 2002 and 2005. This indicates that the situation is quite
dynamic. In 1999 and 2002 the concentration of cadmium in the sediment samples was
significantly higher than in 1996, then it declined significantly in 2005, as compared to
2002.
There are statistically significant differences between 1996 and the other years of the
study shown in the analysis of lead concentration. This indicates that in 1999 there was
a statistically significant decrease in the concentration of lead in the sediment and the
resulting situation was sustained, as from the beginning of that year there were no
statistically significant differences recorded.
There was a high change rate concerning the variability of chromium concentration
in the examined sediments of the Krempna reservoir. There is a non-significant
difference only between 1996 years and 2002 years. This means that in 1999 a signifi-
cant decrease in chromium concentration was recorded, but this decrease occurred only
1300 Marek Tarnawski and Natalia Florencka
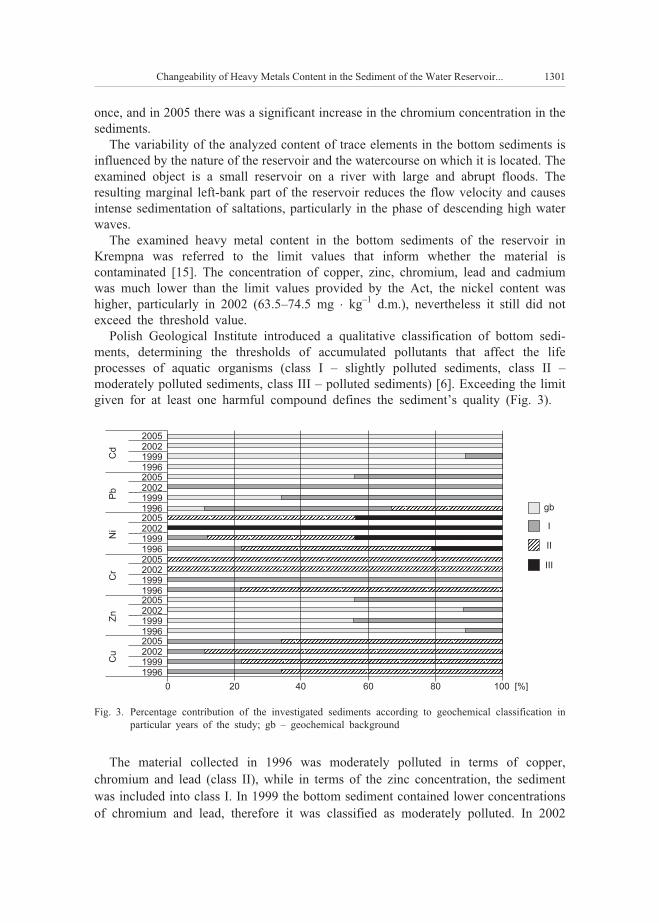
once, and in 2005 there was a significant increase in the chromium concentration in the
sediments.
The variability of the analyzed content of trace elements in the bottom sediments is
influenced by the nature of the reservoir and the watercourse on which it is located. The
examined object is a small reservoir on a river with large and abrupt floods. The
resulting marginal left-bank part of the reservoir reduces the flow velocity and causes
intense sedimentation of saltations, particularly in the phase of descending high water
waves.
The examined heavy metal content in the bottom sediments of the reservoir in
Krempna was referred to the limit values that inform whether the material is
contaminated [15]. The concentration of copper, zinc, chromium, lead and cadmium
was much lower than the limit values provided by the Act, the nickel content was
higher, particularly in 2002 (63.5–74.5 mg � kg–1 d.m.), nevertheless it still did not
exceed the threshold value.
Polish Geological Institute introduced a qualitative classification of bottom sedi-
ments, determining the thresholds of accumulated pollutants that affect the life
processes of aquatic organisms (class I – slightly polluted sediments, class II –
moderately polluted sediments, class III – polluted sediments) [6]. Exceeding the limit
given for at least one harmful compound defines the sediment’s quality (Fig. 3).
The material collected in 1996 was moderately polluted in terms of copper,
chromium and lead (class II), while in terms of the zinc concentration, the sediment
was included into class I. In 1999 the bottom sediment contained lower concentrations
of chromium and lead, therefore it was classified as moderately polluted. In 2002
Changeability of Heavy Metals Content in the Sediment of the Water Reservoir... 1301
0 20 40 60 80 100 [%]
200520021999199620052002199919962005200219991996200520021999199620052002199919962005200219991996
Cd
Pb
Ni
Cr
Zn
Cu
gb
I
II
III
Fig. 3. Percentage contribution of the investigated sediments according to geochemical classification in
particular years of the study; gb – geochemical background
the amounts of chromium increased to the level of the class II of pollution, while
copper, zinc and lead remained at the same level. This trend was sustained in 2005.
The concentration of nickel in the sediment collected over the period of 1996–2005 was
very high, therefore it was evaluated as the class III. The cadmium content was low –
of all collected samples only one was characterized by the exceeded geological
background.
Conclusions
1. The examined bottom material showed no clear tendency to excessive ac-
cumulation of the analyzed elements during the period of 1996–2005. Metal con-
centrations fluctuated in different years, there were no clear decreasing or increasing
trends, though.
2. The sediment from the examined reservoir was characterized by excessive content
of copper, chromium, nickel and lead.
3. Due to the significant excess of nickel, the sediment was qualified as class III, ie as
polluted.
4. Research on bottom sediments should be continued because of the potential risk to
the running water, as this material is the best indicator of environmental risk. This will
also allow to control the chemical composition of the material, which is disposed of by
farmers on nearby agricultural lands.
References
[1] Helios-Rybicka E. Geologia. Zesz Nauk AGH. 1986;1050:32.
[2] Helios-Rybicka E, Sikora WS, Wójcik R, Wardas M, Strzeboñska M, Adamiec E, £agan £. Gosp Wod.
2000;8:300-304.
[3] Manigani G, Berloni A, Bellucci F, Tatano F, Maione M. Water Air Soil Pollut. 2005;160(1):213-228.
DOI: 10.1007/s11270-005-2887-9.
[4] Reiss D, Rihm B, Thöni C, Faller M. Water Air Soil Pollut. 2004;159(1):101-113.
DOI: 10.1023/B:WATE.0000049163.18416.ec.
[5] Rocher V, Azimi S, Gasperi J, Beuvin L, Muller M, Moilleron R, Chebbo G. Water Air Soil Pollut.
2004;159(1): 67-86. DOI: 10.1023/B:WATE.0000049165.12410.98.
[6] Bojakowska I, Soko³owska G. PIG. 1998;46(1):49-54.
[7] Kabata-Pendias A. Trace Elements in Soils and Plants. Boca Raton, FL USA: CRC Press Taylor &
Francis Group; 2010.
[8] Florencka N. Proceedings: T&S 10th International Conference on Transport and Sedimentation of Solid
Particles. Wroc³aw, Poland; 2000:263-268.
[9] Mielnik L, Czeka³a J, Piotrowicz R, Klimaszyk P. Ecol Chem Eng. 2011;18(9-10):1293-1300.
[10] Bojakowska I. Wyniki monitoringu geochemicznego osadów wodnych Polski w latach 1994–1995.
Bibliot Monit Œrodow. Warszawa: PIOŒ; 1996.
[11] Madeyski M, Michalec B, Tarnawski M. Infrastruk i Ekol Teren Wiejs. 2008:76 pp.
[12] Kasperek R, Mokwa M, Wiatkowski M. Arch Environ Prot. 2013;39(2):29-43.
DOI: 10.2478/aep-2013-0017.
[13] Tarnawski M, Michalec B. Infrastruk i Ekol Teren Wiejs. 2006;3(1):31-43.
[14] R Development Core Team; 2009. http://www.R-project.org.
[15] Rozporz¹dzenie Ministra Œrodowiska z 16 kwietnia 2002 roku w sprawie rodzajów oraz stê¿eñ
substancji powoduj¹cych ¿e urobek jest zanieczyszczony. DzU Nr 55, poz 498.
1302 Marek Tarnawski and Natalia Florencka
ZMIENNOŒÆ ZAWARTOŒCI METALI CIʯKICH W OSADACH DENNYCH
WYBRANEGO ZBIORNIKA WODNEGO W LATACH 1996-2005
1 Katedra In¿ynierii Wodnej i Geotechniki
Uniwersytet Rolniczy im. Hugona Ko³³¹taja w Krakowie2 Katedra Kszta³towania i Ochrony Œrodowiska
Akademia Górniczo-Hutnicza im. Stanis³awa Staszica w Krakowie
Abstrakt: W pracy badano zmiennoœæ zawartoœci wybranych metali ciê¿kich w osadach dennych pocho-
dz¹cych ze zbiornika zaporowego w Krempnej, zlokalizowanego w górnym odcinku rzeki Wis³oki, w wo-
jewództwie podkarpackim. W latach 1996–2005 osad pobierano 4-krotnie. W uzyskanym materiale
oznaczono zawartoœci chromu, niklu, miedzi, cynku, kadmu i o³owiu metod¹ ASA. Badane osady
charakteryzowa³y siê zmiennym stê¿eniem analizowanych metali ciê¿kich. Zawartoœæ miedzi by³a w zakresie
8,4–49,16 mg � kg–1, cynku 28–98 mg � kg–1, chromu 8,7–70 mg � kg–1, niklu 20,53–74,5 mg � kg–1, o³owiu
7,7–64,3 mg � kg–1, kadmu 0,1–0,6 mg � kg–1. Stê¿enia badanych metali ciê¿kich w osadzie dennym zbiornika
w Krempnej odniesiono do wartoœci dopuszczalnych, które powoduj¹, ¿e urobek jest zanieczyszczony.
Zawartoœci metali ciê¿kich nie przekracza³y zawartoœci dopuszczalnych.
Analizowany materia³ wykazywa³ podwy¿szone stê¿enia miedzi, chromu, niklu i o³owiu, znacznie
przekraczaj¹ce t³o geochemiczne osadów Polski wg PIG. Szczególnie wysokie stê¿enie niklu kwalifikuj¹ osad
do III klasy jako zanieczyszczony. W analizowanym okresie badawczym 1996–2005 materia³ denny nie
wykazywa³ wyraŸnych sk³onnoœci do nadmiernej kumulacji oznaczonych pierwiastków. Stê¿enia metali
ciê¿kich ulega³y wahaniom w poszczególnych latach badañ, stwierdzono brak jednoznacznych trendów
malej¹cych czy rosn¹cych.
S³owa kluczowe: osad denny, metale ciê¿kie, zbiornik zaporowy
Changeability of Heavy Metals Content in the Sediment of the Water Reservoir... 1303

Bartosz SZEL¥G1*, Jaros³aw GÓRSKI1,
£ukasz B¥K1 and Katarzyna GÓRSKA1
MODELLING OF STORMWATER QUANTITY
AND QUALITY ON THE EXAMPLE
OF URBANISED CATCHMENT IN KIELCE
MODELOWANIE ILOŒCI I JAKOŒCI ŒCIEKÓW DESZCZOWYCH
NA PRZYK£ADZIE ZLEWNI ZURBANIZOWANEJ
W KIELCACH
Abstract: Due to the stochastic character of precipitation phenomena, and also the accumulation of pollutants
in the catchment area and their washoff, predicting the stormwater quantity and quality is a very complex task.
That can lead to massive calculation errors at selection and design stages of technological lines in stormwater
treatment plants. For hydraulic sewerage systems, the guideline ATV A-118 and the PN-EN 752 standard
recommend using hydrodynamic modelling for the catchment area of more than 200 ha, but also for cases
when surface flooding caused by excess stormwater occurs, which happens quite often in urban areas. As
a majority of computational software tools (SWMM, Mouse, Mike Urban, Civil Storm), in addition to
modules for runoff simulations also have those dedicated to wastewater quality assessment, it is justifiable to
conduct complex analyses. The paper aims to discuss the results of stormwater quality and quantity numerical
simulations obtained with the SWMM software for Si9 sewer catchment located in the area of Kielce. For the
paper, hydrogram computations were made for the catchment runoff and the suspension concentrations at the
assumption of constant intensity of the rainfall of the duration of td = 15–180 min and the precipitation
occurrence probability of p = 20 %. In addition, a mathematical model of stormwater treatment plant was
developed. That allowed the determination of the pollutant load of the existing technological line, and of
volume and load of suspended solids discharged by the stormwater overflow structure directly into the
receiver. The computations that were conducted showed a limited impact of a specific runoff on the mass of
suspended solids delivered from the catchment under consideration.
Keywords: hydrodynamic modelling, SWMM, stormwater, suspended solids
Evaluating the amount of pollutant load in the stormwater discharged to the receiver
is of key importance for sizing the stormwater treatment plant (STP). Both the quality
DOI: 10.2428/ecea.2013.20(11)118 ECOL CHEM ENG A. 2013;20(11):1305-1316
1 Faculty of Environmental Engineering, Geomatics and Power Engineering, Kielce University of
Technology, al. Tysi¹clecia Pañstwa Polskiego 7, 25–314 Kielce, Poland, phone: +48 41 342 47 33, email:
[email protected], [email protected], [email protected], [email protected]
* Corresponding author: [email protected]
and quantity of stormwater from the catchment determine the type and capacity of the
devices used. In a majority of cases, the systems comprise a sedimentation tank or a grit
chamber and a separator. At the design stage, it is necessary to account for the
maximum rate of stormwater flow. When sizing the separator, the permissible
concentration of suspensions at the device inlet also needs to be taken into account [1].
The basic criterion for an adequate selection of technological tools is the correct
determination of the amount of stormwater delivered to the treatment facility. Although
the Regulation of the Minister of Environment of 24 July 2006 [2] specifies the
minimum value of runoff that must be treated (q = 15 dm3 � (s � ha)–1), the document
does not state whether constant or varied rainfall intensity should be assumed. The issue
is relevant because when the quantity of runoff from the catchment is larger than the
value of specific runoff stipulated in the Regulation [2], the stormwater can be directly
discharged into the receiver, which can be done no more than five times a year. The
Regulation [2] also gives the maximum permissible pollutant concentration in the
discharge from the treatment plant. For suspensions, pollutant concentration cannot
exceed 100 mg � dm–3, and for oil-derived substances – 15 mg � dm–3.
The methods commonly used in Poland for calculating the runoff hydrograms (limit
rain intensity, time delay factor) involve very simplified models, and they do not
account for many contributing factors. Those include, among others, variation in the
catchment soil moisture during the rain event, the length of the rainless period, uneven
distribution of rainfall intensity, direction of the precipitation front movement [3].
Disregarding those factors may lead to substantial computational errors [3–5], and thus
to inadequate sizing of the technological devices.
In view of the foregoing, it is advisable to determine the quantity and quality of
stormwater through mathematical modelling [6–9]. The existing stochastic models
[10–12], however, are usually local in nature, and the parameters defined in those will
be significantly changed for each catchment, which leads to erroneous predictions.
Deterministic models [7, 13], which provide the opportunity to examine the effect of
various parameters on the results obtained, constitute another group. In those models,
however, it is necessary to know many input data describing the accumulation of
pollutants on the catchment surface and the washoff of pollutants in precipitation
events. The Storm Water Management Model (SWMM) is a widely used deterministic
tool. It offers the possibility of determining the surface runoff and the pattern of
pollutant (eg, suspensions, heavy metals and biogenic compounds) variation during the
rain event [14].
Expotential and exponential models are often used to calculate pollutant depositions
and washoff. The models are described by the respective equations:
B = C1 � (1 – e C t� �2 ) (1)
W = C3 � qC4 � B (2)
Literature data [6, 12, 15, 16] indicate that the values of parameters Ci employed in
the equations above range as follows: C1 = 12.4–225.0 kg � ha–1, C2 = 0.01–5.50, C3 =
0.025–0.130, C4 = 1.0–2.2. Those data confirm enormous variation, with respect to
1306 Bartosz Szel¹g et al
suspended solids, in quality and quantity of stormwater flowing from the catchment. In
order to describe the random character of phenomena that affect the prediction of
stormwater quality, the authors [17–21] developed probabilistic models, in which the
stochastic character of the analysed phenomena is often accounted for by means of the
Monte Carlo method.
The aim of the paper is to analyse, on the example of urbanised catchment in Kielce,
the possibility of applying the SWMM software to the modelling of the quantity and
quality of stormwater. The degree to which the existing STP is loaded with pollutants
was evaluated. Also, the volumes of stormwater flowing from the catchment and
transported to the STP, and discharged, via the stormwater overflow structure, directly
to the receiver were determined. Additionally, the content of suspended solids load
delivered to the STP relative to the total content of pollutants washed off the catchment
surface was determined in the study.
Materials and methods
Facility description
The object of analysis is the sewer Si9 catchment, located in the central – eastern part
of the city of Kielce with a total area of F = 62 ha. The sewer of concern receives
stormwater and snowmelt from the part of the city lying in the left-hand side basin of
the river Silnica. The total length of the sewer network is 5583 m, including the main
collector (�600–1250 mm) 1569 m, and lateral sewers (�300–1000 mm) 4014 m in
length. The slope of the collector ranges from 0.04 to 3.90 %, and that of lateral sewers
is up to 2.61 %. In this area, housing estates, public buildings, main and side streets are
predominant. A detailed description of the catchment can be found in studies by
Dabkowski et al [22], Gorska and Sikorski [23], and Bak et al [24].
Stormwater delivered by the sewer Si9 is directed to the stormwater treatment plant,
which consists of a separation chamber (SC), two-chamber settling tank (ST) and
coalescence separator (SEP), which remove suspended solids and oil derivatives. When
the SC is filled below 0.42 m (overflow height) the stormwater is transported via four
sewers �400 mm exclusively to the longitudinal settling tank, which has a length of
30 m. The stormwater from the treatment facility flows simultaneously through the
sewer �200 mm to the SEP, and through two sewers �500 mm to the connection
chamber (CC), to which stormwater is also delivered after it has gone through the
separator (via the sewer �350 mm). In the final stage, from the CC, the stormwater
flows through the sewer �650 mm to the receiver. However, when the filling of the
separation chamber exceeds 0.42 m, a part of the stromwater is discharged through the
overflow structure, via the collector �1250 mm, directly into the receiver, which is river
Silnica.
The ultrasonic flow meter (TELEDYNE ISCO 2150) measuring the stormwater flow
rate is installed in the sewer Si9, at a distance of about 7 m above the separation
chamber. The stormwater samples were collected using ISCO 6712 automatic sampler.
Modelling of Stormwater Quantity and Quality... 1307
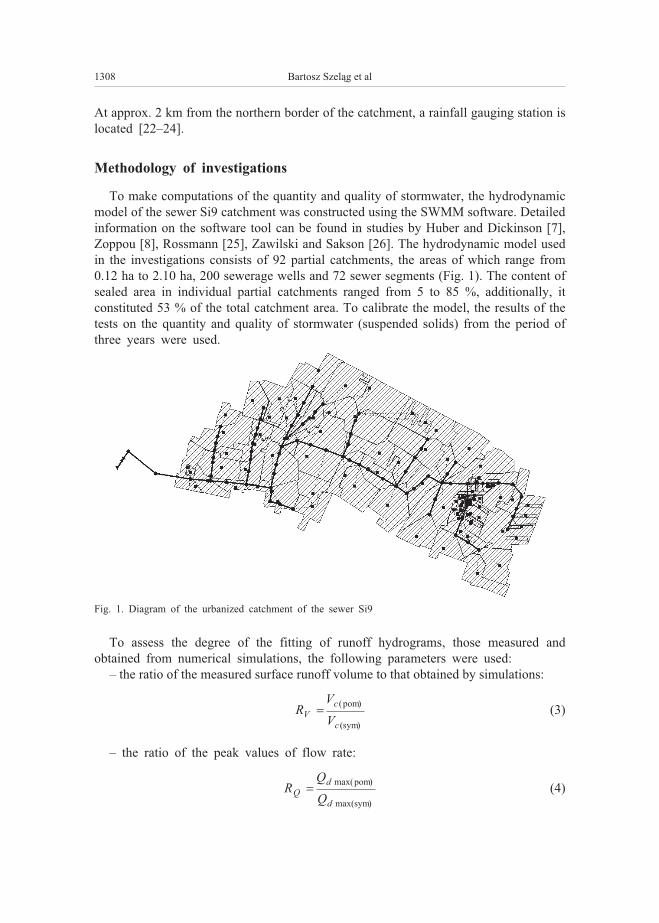
At approx. 2 km from the northern border of the catchment, a rainfall gauging station is
located [22–24].
Methodology of investigations
To make computations of the quantity and quality of stormwater, the hydrodynamic
model of the sewer Si9 catchment was constructed using the SWMM software. Detailed
information on the software tool can be found in studies by Huber and Dickinson [7],
Zoppou [8], Rossmann [25], Zawilski and Sakson [26]. The hydrodynamic model used
in the investigations consists of 92 partial catchments, the areas of which range from
0.12 ha to 2.10 ha, 200 sewerage wells and 72 sewer segments (Fig. 1). The content of
sealed area in individual partial catchments ranged from 5 to 85 %, additionally, it
constituted 53 % of the total catchment area. To calibrate the model, the results of the
tests on the quantity and quality of stormwater (suspended solids) from the period of
three years were used.
To assess the degree of the fitting of runoff hydrograms, those measured and
obtained from numerical simulations, the following parameters were used:
– the ratio of the measured surface runoff volume to that obtained by simulations:
RV
VV
c
c
�( )
( )
pom
sym
(3)
– the ratio of the peak values of flow rate:
RQ
d
d
�max( )
max( )
pom
sym
(4)
1308 Bartosz Szel¹g et al
Fig. 1. Diagram of the urbanized catchment of the sewer Si9
– Nash coefficient:
NC
pom sym
sym sr, pom
�
�
�
�
�
� ( )
( )
( ) ( )
( ) ( )
Q Q
Q Q
i ii
n
i ii
2
1
2
1
n
�
(5)
To describe the process of pollutant accumulation and washoff from the surface of
the catchment of concern, the respective equations (1) and (2) were employed.
Parameters C1, C2, C3 and C4 in the equations were determined by the model
calibration. The model of stormwater treatment plant was constructed and the values of
local resistances at inlets and outlets of the sewers were provided on the basis of field
measurements, the planning document, and photographic images. Due to the fact that
the sewers connecting different objects of the facility may be pressurised, the main
force model was employed for analyses. The model makes it possible to determine the
flow resistances in the sewers on the basis of indicated surface roughness. In the model,
the settling tank and the separator are defined as detention tanks.
Pollutant loads
On the basis of computations performed with the SWMM software, the mass of
suspended solids (pollutant load given in kg) delivered from the catchment was
obtained from the following formula:
M³
ti i�
��
�( )³ 1
2� [kg] (6)
Additionally, the percentage content of the following quantities was calculated: the
volume of stormwater flowing to the STP (VSTP) relative to the total volume the high
water stage (Vc), mass of the suspension transported to the STP (MSTP) relative to the
total mass of mineral pollutants delivered by the sewerage system (Mc). Those
parameters were computed on the basis of the dependence:
�VOWD
c
V
V� (7)
� MOWD
c
M
M� (8)
Model calibration
The developed quantitative hydrodynamic model was calibrated on the basis of
selected seven rainfall-runoff events of the period from July 2009 to July 2011. The
characteristics of the events are presented in Table 1.
Modelling of Stormwater Quantity and Quality... 1309
Table 1
Characteristics of the rainfall events and fitting parameters for measured and simulated hydrograms
DateP
[mm]
td
[min]
Vc
[m3]
RQ
[-]
RV
[-]
NC[-]
08 July 2011 8.6 60 1733 0.95 0.92 0.84
15 Sept. 2010 9.2 286 2221 0.83 0.90 0.90
30 July 2010 12.5 107 1908 0.90 0.93 0.80
08 July 2009 16.5 270 3415 0.92 0.98 0.75
03 July 2009 4.2 26 2133 0.95 0.95 0.72
31 May 2010 5.4 56 684 0.90 0.90 0.70
26 April 2010 3.6 92 327 0.80 0.82 0.67
The qualitative model was calibrated using data on the 13 precipitation events
measured in the time interval from 9 May 2009 until 4 June 2010. For 10 events, the
ratio of the measured suspension mass to the one obtained from computations ranged
0.20–0.52, for three events (26 April 2010, 30 May 2010, 31 May 2010), the ratio was
0.97, 0.88 and 0.67, respectively. Parameters of the quantitative and qualitative models
obtained by means of calibration are presented in Table 2.
Table 2
Summary of hydrodynamics model (quantitative and qualitative) parameters for the analyzed catchment
Model Parameter Unit Value
Surface
runoff
runoff width W m 1.35 � F0.50
retention of sealed areas dimp mm 1.50
retention of unsealed areas dper mm 6.0
roughness coefficient for sealed areas nimp m–1/3� s 0.015
roughness coefficient for unsealed areas nper m–1/3� s 0.15
roughness coefficient of the sewer nsewer m–1/3� s 0.015
maximum infiltration rate fmax mm � h–1 90
minimum infiltration rate fmin mm � h–1 15
coefficient of infiltration decrease � h–1 3.0
the total time of drying out d 3.0
Qualitative
deposition
maximum amount of pollutants accumulated
in the catchment area C1imp kg � ha–1 100
minimum amount of pollutants accumulated
in the catchment area C1per kg � ha–1 35
rate of pollutant loss C2 d–1 0.07
washoffwashoff coefficient C3 — 0.10
power exponent C4 — 1.73
In the model, constant rainfall intensity was assumed for hydrodynamic simulation.
The maximum precipitation amount was determined using the Bogdanowicz and Stachy
1310 Bartosz Szel¹g et al
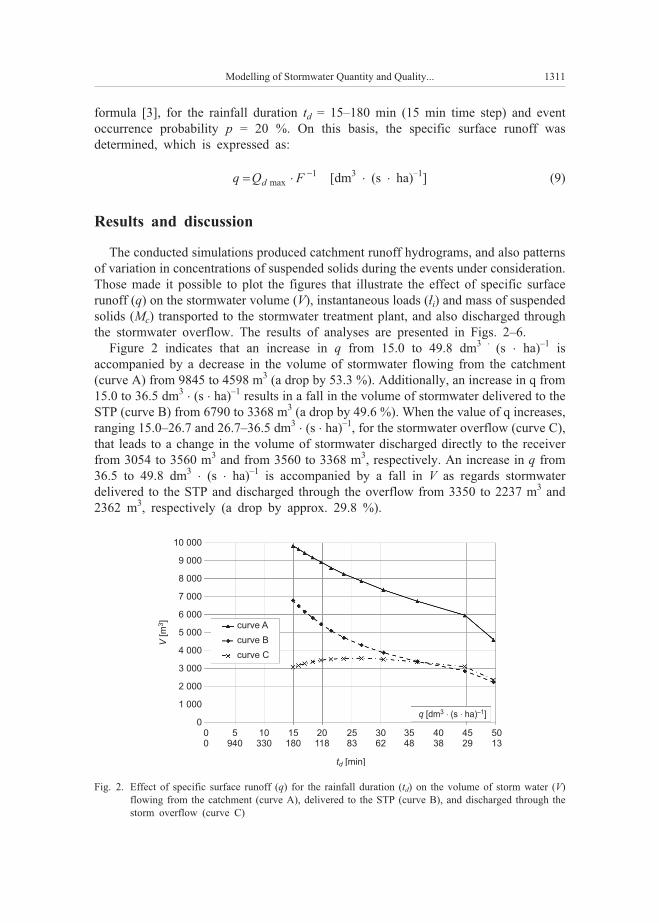
formula [3], for the rainfall duration td = 15–180 min (15 min time step) and event
occurrence probability p = 20 %. On this basis, the specific surface runoff was
determined, which is expressed as:
q Q Fd� ��
max1 [dm3
� (s � ha)–1] (9)
Results and discussion
The conducted simulations produced catchment runoff hydrograms, and also patterns
of variation in concentrations of suspended solids during the events under consideration.
Those made it possible to plot the figures that illustrate the effect of specific surface
runoff (q) on the stormwater volume (V), instantaneous loads (³i) and mass of suspended
solids (Mc) transported to the stormwater treatment plant, and also discharged through
the stormwater overflow. The results of analyses are presented in Figs. 2–6.
Figure 2 indicates that an increase in q from 15.0 to 49.8 dm3 � (s � ha)–1 is
accompanied by a decrease in the volume of stormwater flowing from the catchment
(curve A) from 9845 to 4598 m3 (a drop by 53.3 %). Additionally, an increase in q from
15.0 to 36.5 dm3� (s � ha)–1 results in a fall in the volume of stormwater delivered to the
STP (curve B) from 6790 to 3368 m3 (a drop by 49.6 %). When the value of q increases,
ranging 15.0–26.7 and 26.7–36.5 dm3� (s � ha)–1, for the stormwater overflow (curve C),
that leads to a change in the volume of stormwater discharged directly to the receiver
from 3054 to 3560 m3 and from 3560 to 3368 m3, respectively. An increase in q from
36.5 to 49.8 dm3� (s � ha)–1 is accompanied by a fall in V as regards stormwater
delivered to the STP and discharged through the overflow from 3350 to 2237 m3 and
2362 m3, respectively (a drop by approx. 29.8 %).
Modelling of Stormwater Quantity and Quality... 1311
10 000
9 000
8 000
7 000
6 000
5 000
4 000
3 000
2 000
1 000
0
V[m
]3 curve A
curve B
curve C
00
5940
10330
15180
20118
2583
3062
3548
4038
4529
5013
td [min]
q [dm (s ha) ]3 –1� �
Fig. 2. Effect of specific surface runoff (q) for the rainfall duration (td) on the volume of storm water (V)
flowing from the catchment (curve A), delivered to the STP (curve B), and discharged through the
storm overflow (curve C)
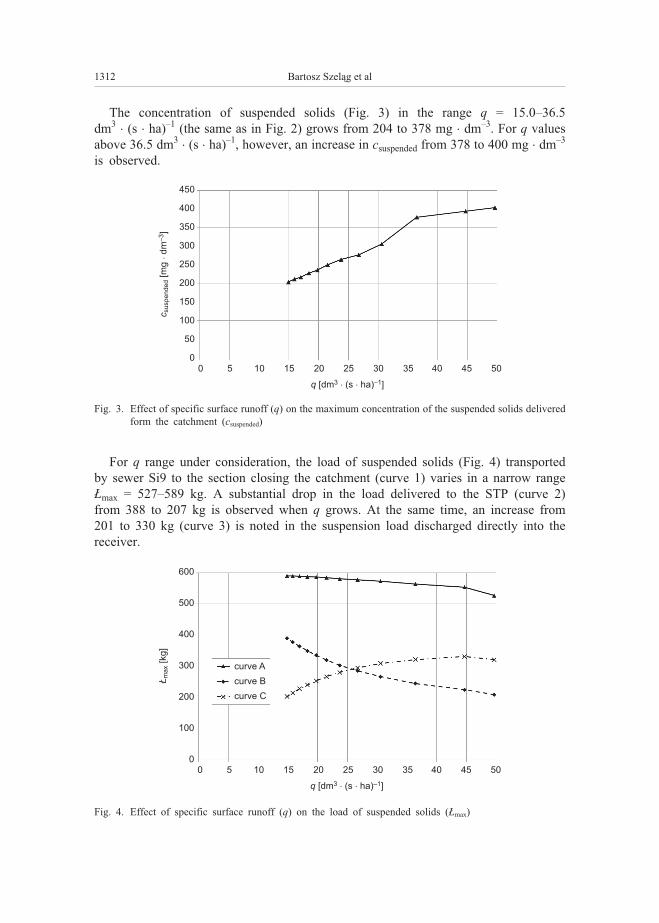
The concentration of suspended solids (Fig. 3) in the range q = 15.0–36.5
dm3� (s � ha)–1 (the same as in Fig. 2) grows from 204 to 378 mg � dm–3. For q values
above 36.5 dm3� (s � ha)–1, however, an increase in csuspended from 378 to 400 mg � dm–3
is observed.
For q range under consideration, the load of suspended solids (Fig. 4) transported
by sewer Si9 to the section closing the catchment (curve 1) varies in a narrow range
£max = 527–589 kg. A substantial drop in the load delivered to the STP (curve 2)
from 388 to 207 kg is observed when q grows. At the same time, an increase from
201 to 330 kg (curve 3) is noted in the suspension load discharged directly into the
receiver.
1312 Bartosz Szel¹g et al
450
400
350
300
250
200
150
100
50
0
csu
sp
en
de
d–
3[m
gd
m]
�
0 5 10 15 20 25 30 35 40 45 50
q [dm (s ha) ]3 –1� �
Fig. 3. Effect of specific surface runoff (q) on the maximum concentration of the suspended solids delivered
form the catchment (csuspended)
600
500
400
300
200
100
0
£m
ax
[kg
]
0 5 10 15 20 25 30 35 40 45 50
q [dm (s ha) ]3 –1� �
curve A
curve B
curve C
Fig. 4. Effect of specific surface runoff (q) on the load of suspended solids (£max)
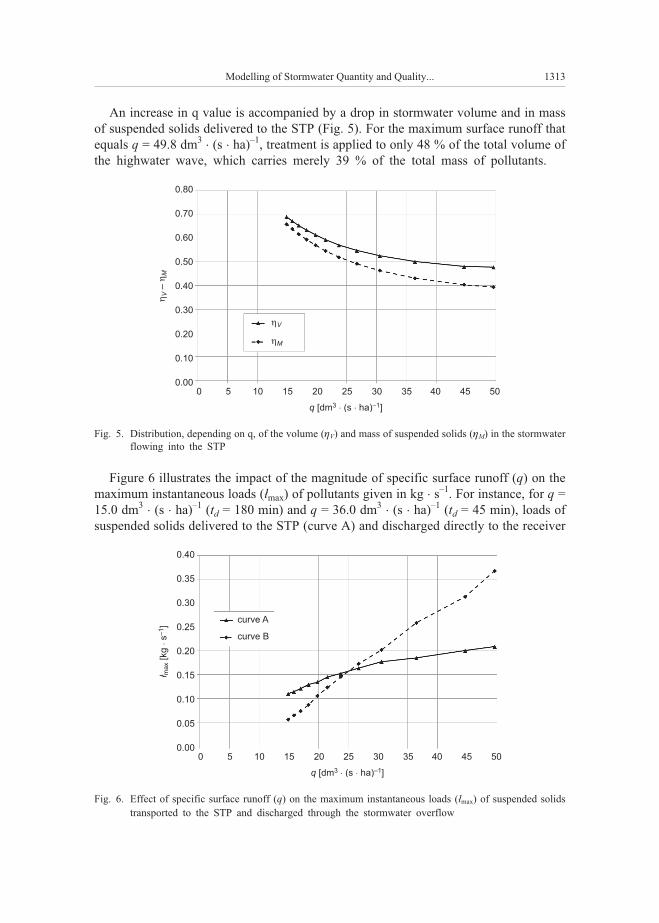
An increase in q value is accompanied by a drop in stormwater volume and in mass
of suspended solids delivered to the STP (Fig. 5). For the maximum surface runoff that
equals q = 49.8 dm3� (s � ha)–1, treatment is applied to only 48 % of the total volume of
the highwater wave, which carries merely 39 % of the total mass of pollutants.
Figure 6 illustrates the impact of the magnitude of specific surface runoff (q) on the
maximum instantaneous loads (³max) of pollutants given in kg � s–1. For instance, for q =
15.0 dm3� (s � ha)–1 (td = 180 min) and q = 36.0 dm3
� (s � ha)–1 (td = 45 min), loads of
suspended solids delivered to the STP (curve A) and discharged directly to the receiver
Modelling of Stormwater Quantity and Quality... 1313
0.80
0.70
0.60
0.50
0.40
0.30
0.20
0.10
0.00
��
VM
–
0 5 10 15 20 25 30 35 40 45 50
q [dm (s ha) ]3 –1� �
�
�
V
M
Fig. 5. Distribution, depending on q, of the volume (�V) and mass of suspended solids (�M) in the stormwater
flowing into the STP
0.40
0.35
0.30
0.25
0.20
0.15
0.10
0.05
0.000 5 10 15 20 25 30 35 40 45 50
q [dm (s ha) ]3 –1� �
³ ma
x[k
g]
s�
–1
curve A
curve B
Fig. 6. Effect of specific surface runoff (q) on the maximum instantaneous loads (³max) of suspended solids
transported to the STP and discharged through the stormwater overflow
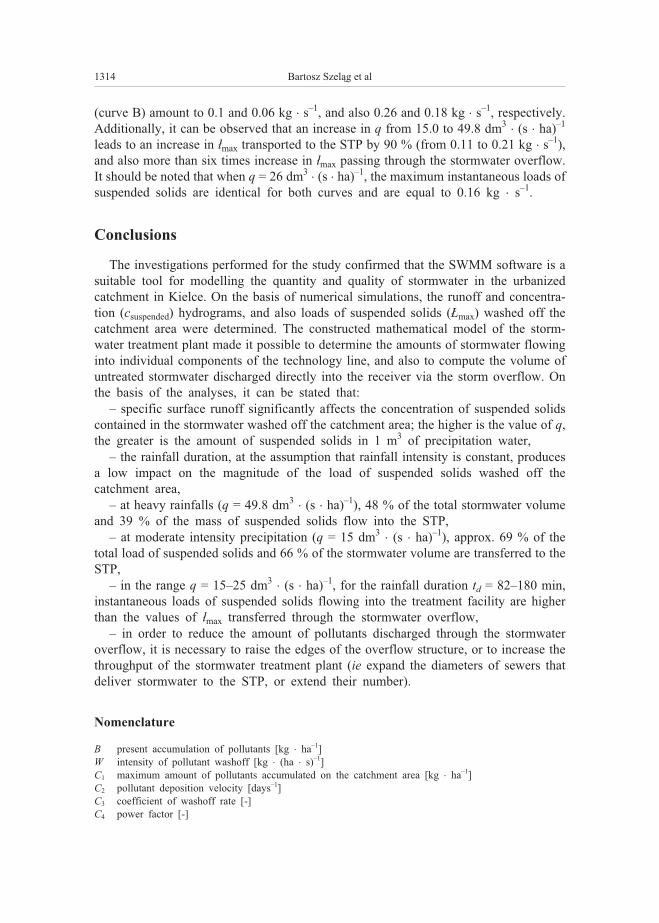
(curve B) amount to 0.1 and 0.06 kg � s–1, and also 0.26 and 0.18 kg � s–1, respectively.
Additionally, it can be observed that an increase in q from 15.0 to 49.8 dm3� (s � ha)–1
leads to an increase in ³max transported to the STP by 90 % (from 0.11 to 0.21 kg � s–1),
and also more than six times increase in ³max passing through the stormwater overflow.
It should be noted that when q = 26 dm3� (s � ha)–1, the maximum instantaneous loads of
suspended solids are identical for both curves and are equal to 0.16 kg � s–1.
Conclusions
The investigations performed for the study confirmed that the SWMM software is a
suitable tool for modelling the quantity and quality of stormwater in the urbanized
catchment in Kielce. On the basis of numerical simulations, the runoff and concentra-
tion (csuspended) hydrograms, and also loads of suspended solids (£max) washed off the
catchment area were determined. The constructed mathematical model of the storm-
water treatment plant made it possible to determine the amounts of stormwater flowing
into individual components of the technology line, and also to compute the volume of
untreated stormwater discharged directly into the receiver via the storm overflow. On
the basis of the analyses, it can be stated that:
– specific surface runoff significantly affects the concentration of suspended solids
contained in the stormwater washed off the catchment area; the higher is the value of q,
the greater is the amount of suspended solids in 1 m3 of precipitation water,
– the rainfall duration, at the assumption that rainfall intensity is constant, produces
a low impact on the magnitude of the load of suspended solids washed off the
catchment area,
– at heavy rainfalls (q = 49.8 dm3� (s � ha)–1), 48 % of the total stormwater volume
and 39 % of the mass of suspended solids flow into the STP,
– at moderate intensity precipitation (q = 15 dm3� (s � ha)–1), approx. 69 % of the
total load of suspended solids and 66 % of the stormwater volume are transferred to the
STP,
– in the range q = 15–25 dm3� (s � ha)–1, for the rainfall duration td = 82–180 min,
instantaneous loads of suspended solids flowing into the treatment facility are higher
than the values of ³max transferred through the stormwater overflow,
– in order to reduce the amount of pollutants discharged through the stormwater
overflow, it is necessary to raise the edges of the overflow structure, or to increase the
throughput of the stormwater treatment plant (ie expand the diameters of sewers that
deliver stormwater to the STP, or extend their number).
Nomenclature
B present accumulation of pollutants [kg � ha–1]
W intensity of pollutant washoff [kg � (ha � s)–1]
C1 maximum amount of pollutants accumulated on the catchment area [kg � ha–1]
C2 pollutant deposition velocity [days–1]
C3 coefficient of washoff rate [-]
C4 power factor [-]
1314 Bartosz Szel¹g et al
t time step [s]
q specific surface runoff [mm � h–1]
Rv ratio of the measured surface runoff volume to that obtained by simulations [-]
RQ ratio of the peak values of flow rate [-]
Vc(pom) measured volume of runoff hydrogram [m3]
Vc(sym) volume of the runoff hydrogram obtained from simulations [m3]
Qdmax(pom) measured peak flow [m3� s–1]
Qdmax(sym) peak flow received from computations using the SWMM software [m3� s–1]
NC Nash coefficient [-]
Qi(pom) measured flow rate [m3� s–1]
Qi(sym) flow rate obtained from simulations [m3� s–1]
Qi(sr,pom) mean value of measured flow rate [m3� s–1]
³i, i+1 instantaneous load of pollutants [kg � s–1]
Vc total volume of stormwater determined from catchment runoff hydrogram [m3]
VSTP volume of stormwater delivered to the STP determined on the basis of simulations
with the SWMM software [m3]
M, Mc mass of suspended solids delivered from the catchment [kg]
MSTP mass of suspended solids transported to the STP [kg]
�V content of the volume of stormwater flowing to the STP relative to Vc [-]
�M content of the mass of transported suspended solids relative to Mc [-]
Qdmax maximum stormwater runoff rate [dm3� s–1]
F runoff area [ha]
P total amount of precipitation [mm]
td rainfall duration [min]
References
[1] Królikowska J, Królikowski A. Wody opadowe. Odprowadzanie, zagospodarowanie, podczyszczanie i
wykorzystanie. Piaseczno: Seidel-Przywecki; 2012.
[2] Rozporz¹dzenie Ministra Œrodowiska z dnia 24 lipca 2006 roku w sprawie warunków, jakie nale¿y
spe³niæ przy wprowadzeniu œcieków do wód lub do ziemi, oraz w sprawie substancji szkodliwych dla
œrodowiska wodnego. DzU Nr 137, poz 984 z póŸn zm.
[3] Mrowiec M. Efektywne wymiarowanie i dynamiczna regulacja kanalizacyjnych zbiorników reten-
cyjnych. Czêstochowa: Wyd Politechniki Czêstochowskiej; 2009.
[4] B³aszczyk P. Ochr Œrodow. 1998;3-4(36-37):9-14.
[5] Osmólska-Mróz B, Fidala-Szope M, Kierzenkowska M. Ochr Œrodow. 1984;434/3-4(20-21):29-32.
[6] Cambez MJ, Pinho J, David LM. Using SWMM in continuous modelling of stormwater hydraulics and
quality. 11th International Conference on Urban Drainage. Edinburgh, Scotland; 2008.
[7] Huber WC, Dickinson RE. Stormwater Management Model. User’s Manual. Version 4,0. Environmental
Research Laboratory. US Environmental Protection Agency. Athens, Georgia; 1992.
[8] Zoppou C. Review of stormwater models. Technical Report 52/99. Canberra: CSiRO Land and Water;
1999.
[9] Berretta C, Gnecco J, Lanza LG, Bernera P. Water Sci & Technol. 2007;56(12):77-84.
DOI:10.2166/wst.2007.756.
[10] Sharifi S, Massoudich A, Kayhamian M. Water Environ Res. 2011;83(11):2025-2035.
DOI:10.2175/106143011X2989211.
[11] Adams BJ, Papa F. Urban stormwater management planning with analytical probabilistic models. Wiley;
2000.
[12] Liu A, Goonetilleke A, Egodawatta P. Ecol Eng. 2012;47:110-114.
DOI: 10.1016/j.ecoleng.2012.06.008.
[13] Deletic A, Maksimovic C, Loughreit F, Butler D. Modelling the management of street surface sediments
in urban runoff. Proceedings of the 3rd International Conference on Innovative Technologies in Urban
Storm Drainage. Lyon, France; 1998:415-422.
[14] Widomski M, Musz A, Gajuk D, £agód G. Ecol Chem Eng A. 2012;19(4-5):471-481.
Modelling of Stormwater Quantity and Quality... 1315
[15] Egodawatta P, Miguntanna NS, Goonetileke A. Water Sci & Technol. 2012;66(7):1527-1533.
DOI: 10.2166/wst.2012.348.
[16] Zawilski M. Gaz Woda Tech Sanit. 2010;6:28-32.
[17] Avellaneda PM, Ballestreo T, Roseen R, Houle J, Linder E. J Environ Eng. 2011;137(7):541-550.
DOI: 10.1061/(ASCE)EE.1943-7870.0000360.
[18] Bolognesi A, Maglinico M. Long term simulation analysis under two different regimes as an aid to gully
pot management. NOVATECH, 7th International Conference on Sustainable Techniques for Urban
Water Management. Lyon, France; 2010.
[19] Kleidorfer M, Deletic A, Fletcher TD, Rauch W. Impact of input data uncertainties an stormwater model
parameters. 11th International Conference on Urban Drainage. Edinburgh, Scotland; 2008.
[20] Mailhot A, Gaume E, Villeneuve JP. Water Sci & Technol. 1997;36(5):141-148.
DOI: 10.1016/So273-1223(97).
[21] Kanso A, Tassin B, Chebo G. Managing uncertainties in urban runoff quality models: A benchmarking
methodology. NOVATECH, 5th International Conference on Sustainable Techniques for Urban Water
Management, Lyon, France; 2004.
[22] D¹bkowski SL, Górska K, Górski J, Szel¹g B. Gaz Woda Tech Sanit. 2010;10:20-24.
[23] Górska K, Sikorski M. Proc of ECOpole. 2013;7(1):333-341. DOI: 10.2429/proc.2013.7(1)045.
[24] B¹k £, Górski J, Górska K, Szel¹g B. Ochr Œrodow. 2012;34(2):49-52.
[25] Rossmann LA. Storm Water Management Model. User’s Manual. Version 5,0. National Risk
Management Research Laboratory. Office of Research and Development. US Environmental Protection
Agency. Cincinnati; 2004.
[26] Zawilski M, Sakson G. Ochr Œrodow. 2013;35(2):33-39.
MODELOWANIE ILOŒCI I JAKOŒCI ŒCIEKÓW DESZCZOWYCH
NA PRZYK£ADZIE ZLEWNI ZURBANIZOWANEJ W KIELCACH
Wydzia³ In¿ynierii Œrodowiska, Geomatyki i Energetyki
Politechnika Œwiêtokrzyska
Abstrakt: Ze wzglêdu na stochastyczny charakter zjawisk opadowych, a tak¿e akumulacji oraz zmywania
zanieczyszczeñ zgromadzonych na powierzchni zlewni, prognoza jakoœci i iloœci œcieków deszczowych jest
bardzo z³o¿ona, co mo¿e prowadziæ do znacznych b³êdów obliczeniowych na etapie doboru i projektowania
ci¹gów technologicznych oczyszczalni wód deszczowych. Wytyczna ATV A-118 oraz norma PN-EN 752
zalecaj¹ do obliczeñ hydraulicznych systemów kanalizacyjnych, zastosowanie modelowania hydrodyna-
micznego dla zlewni o powierzchni przekraczaj¹cej 200 ha, ale równie¿ w przypadku wystêpowania w sieci
zjawiska wylania œcieków na powierzchniê terenu, co zdarza siê na terenach miejskich stosunkowo czêsto.
Ponadto, ze wzglêdu na to, ¿e w wiêkszoœci opracowane programy obliczeniowe (SWMM, Mouse, Mike
Urban, Civil Storm) maj¹ oprócz zaimplementowanych modu³ów do symulacji sp³ywu, tak¿e modu³y
okreœlania jakoœci œcieków, wydaje siê wskazane przeprowadzenie kompleksowych analiz w tym kierunku.
Celem artyku³u jest omówienie wyników symulacji numerycznych jakoœci i iloœci œcieków uzyskanych przy
pomocy programu SWMM dla zlewni kana³u Si9 zlokalizowanej na terenie Kielc. W artykule wykonano
obliczenia hydrogramów odp³ywu ze zlewni i stê¿eñ zawiesiny przy za³o¿eniu sta³ego natê¿enia deszczu dla
czasu trwania td = 15–180 min i prawdopodobieñstwa wyst¹pienia opadu p = 20 %. Ponadto opracowano
model matematyczny oczyszczalni œcieków deszczowych, który pozwoli³ okreœliæ obci¹¿enia ³adunkiem
zanieczyszczeñ istniej¹cego ci¹gu technologicznego oraz ustaliæ objêtoœæ i ³adunek zawiesiny ogólnej
zrzucanej przelewem burzowym bezpoœrednio do odbiornika. Przeprowadzone obliczenia wykaza³y nie-
znaczny wp³yw jednostkowego sp³ywu na masê zawiesiny ogólnej odp³ywaj¹cej z przedmiotowej zlewni
zurbanizowanej.
S³owa kluczowe: modelowanie hydrodynamiczne, SWMM, œcieki deszczowe, zawiesina ogólna
1316 Bartosz Szel¹g et al
Piotr GODYÑ1,2, Maria ZIELIÑSKA1,2,
Agnieszka DO£HAÑCZUK-ŒRÓDKA1*,
Zbigniew ZIEMBIK1 and Tadeusz MAJCHERCZYK1
STUDY OF THE EXCESSIVE Pb-210 CONTENT IN SOIL
BADANIE ZAWARTOŒCI NADMIAROWEGO Pb-210 W GLEBIE
Abstract: The aim of the study was the analysis of soil contamination in the area in vicinity of metalworking
plants located in the district Opole-Metalchem (PL). Pb-210 was used as pollution indicator because its
increased concentration of activity may indicate the presence of other contaminants in the studied area. On the
base of the obtained results, the activity concentration of the excessive lead was calculated. Its biggest value
was observed in soil in a forest area. In areas with increased excessive lead content also elevated values of
Cs-137 activity concentrations were recorded. Atmospheric source of Pbex and Cs-137 deposition was
supposed.
Keywords: pollution indicator, Pb-210, soil contamination
Introduction
Industrial metalwork is one of the major sources of environmental pollution. It deals
with the treatment of ores, obtaining pure metals, creating specific shapes of metal
pieces and production of alloys [1]. The result of these processes is emission of
a number of substances harmful to the environment and to human health [2]. One of
these processes is welding, in which dust is released which contains, for example, iron
oxides, manganese oxides, magnesium oxides, zinc, lead and volatile products,
including sulfur oxides and carbon monoxide [3]. These substances can be dangerous
for human health causing, among others, damage in neural system or induce asthma [4].
Lead and zinc alloys are one of the most important raw materials for welding. They
may pose a significant threat to the health of workers and to environment. Excess
amount of lead can stop production of heme and it can change routes of important
biochemical processes in living organisms [5].
DOI: 10.2428/ecea.2013.20(11)119 ECOL CHEM ENG A. 2013;20(11):1317-1325
1 Independent Chair of Biotechnology and Molecular Biology, Opole University, ul. kard. B. Kominka 6,
45–032 Opole, Poland, phone: +48 77 401 60 46, email: [email protected] Scholarship holder from the mayor of Opole.
* Corresponding author: [email protected]
Lead release during activity of various works is followed by its accumulation in soil,
and then also in plants [6]. Lead accumulates in the surface layers of soil rich in humus,
because it is easily incorporated into organic matter [7]. Availability of lead for living
organisms depends on its chemical form in soil. Easily leached from the surface layers
of soil are chlorides, nitrates, acetates, while the lead oxides are practically insoluble in
water, hence immobile [8].
Lead, in particular the isotope Pb-210, may be an indicator of pollution of industrial
origin. Detection of pollution is possible because its activity concentration consists of
the autogenous (of natural origin) and the allogeneic (anthropogenic) part. Significant
amounts of the allogeneic lead in a sample likely indicates deposition of undesired
environmental pollutants [9].
The vapors produced during metallurgical processes contain, besides lead, many
other heavy metals. Among them chromium, copper, lead, manganese, nickel, zinc, iron
or cadmium can be listed [4–16].
In Opole-Metalchem district in the late 80. and 90. of 20th century was located great
industrial center with several welding plants. The symbol of those times was
Metalurgic-Chemical Plant “Metalchem” in which armaments was produced. Several
thousand people were employed there and they had a housing estate specially built for
them. Up to now in this area there are many welding, galvanizing and tinning works.
Due to their waste production the periodic analyses of water, soil and air, are desired.
In 2013 an analysis of heavy metals content in the Odra River was carried out [17].
The object of this study was the 8.5 km section of the river, which ran among others, by
Metalchem. The biggest heavy metals concentration was found in water sample
collected at the river harbor on the Metalchem estate. It could be a result of the
continuous pollutant rinsing from machines moored there. These are old, rusty barges
and ships used formerly in transport of steel and welded structures. But it is possible
that contaminants were washed out from upper soil layers by atmospheric and ground
water. Determination of actual pollution sources is critical for selection of appropriate
mitigation strategies which would limit impact of contaminants on environment and life
quality of local population.
The aim of the study was estimation of soil contamination in the area of Metalchem.
In the study Pb-210 was used as an index of pollution. The isotope Pb-210 is a natural
radioactive isotope and represents the disintegration series of radioactive uranium
U-238. This radionuclide may also be artificially introduced into the environment by
human activities. The difference between concentrations of allogenic and autogenous
Pb-210 can be regarded as a measure of total contamination of the site.
Materials and methods
The soil samples were collected at 6 places located in the south east direction from
the area occupied by metalworking companies (Fig. 1).
Places No.1 and 3 were located on a meadow not far from the nearby forest. Place
No. 2 was located in this forest. The remaining sampling sites were located in cornfield.
The soil samples were collected from the depth of 0–15, 15–30 and 0–30 cm. The
1318 Piotr Godyñ et al
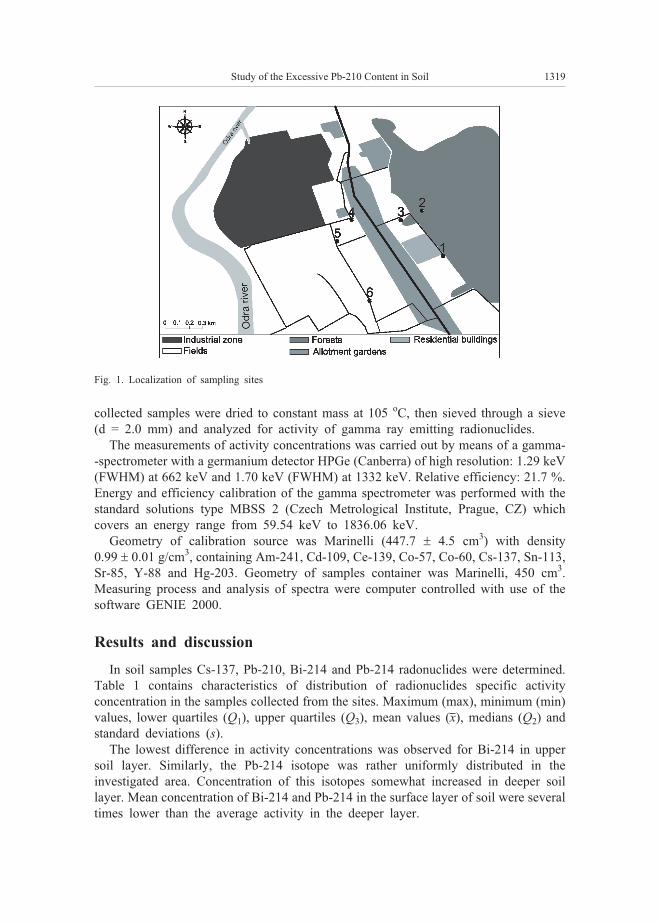
collected samples were dried to constant mass at 105 oC, then sieved through a sieve
(d = 2.0 mm) and analyzed for activity of gamma ray emitting radionuclides.
The measurements of activity concentrations was carried out by means of a gamma-
-spectrometer with a germanium detector HPGe (Canberra) of high resolution: 1.29 keV
(FWHM) at 662 keV and 1.70 keV (FWHM) at 1332 keV. Relative efficiency: 21.7 %.
Energy and efficiency calibration of the gamma spectrometer was performed with the
standard solutions type MBSS 2 (Czech Metrological Institute, Prague, CZ) which
covers an energy range from 59.54 keV to 1836.06 keV.
Geometry of calibration source was Marinelli (447.7 � 4.5 cm3) with density
0.99 � 0.01 g/cm3, containing Am-241, Cd-109, Ce-139, Co-57, Co-60, Cs-137, Sn-113,
Sr-85, Y-88 and Hg-203. Geometry of samples container was Marinelli, 450 cm3.
Measuring process and analysis of spectra were computer controlled with use of the
software GENIE 2000.
Results and discussion
In soil samples Cs-137, Pb-210, Bi-214 and Pb-214 radonuclides were determined.
Table 1 contains characteristics of distribution of radionuclides specific activity
concentration in the samples collected from the sites. Maximum (max), minimum (min)
values, lower quartiles (Q1), upper quartiles (Q3), mean values (x), medians (Q2) and
standard deviations (s).
The lowest difference in activity concentrations was observed for Bi-214 in upper
soil layer. Similarly, the Pb-214 isotope was rather uniformly distributed in the
investigated area. Concentration of this isotopes somewhat increased in deeper soil
layer. Mean concentration of Bi-214 and Pb-214 in the surface layer of soil were several
times lower than the average activity in the deeper layer.
Study of the Excessive Pb-210 Content in Soil 1319
Fig. 1. Localization of sampling sites
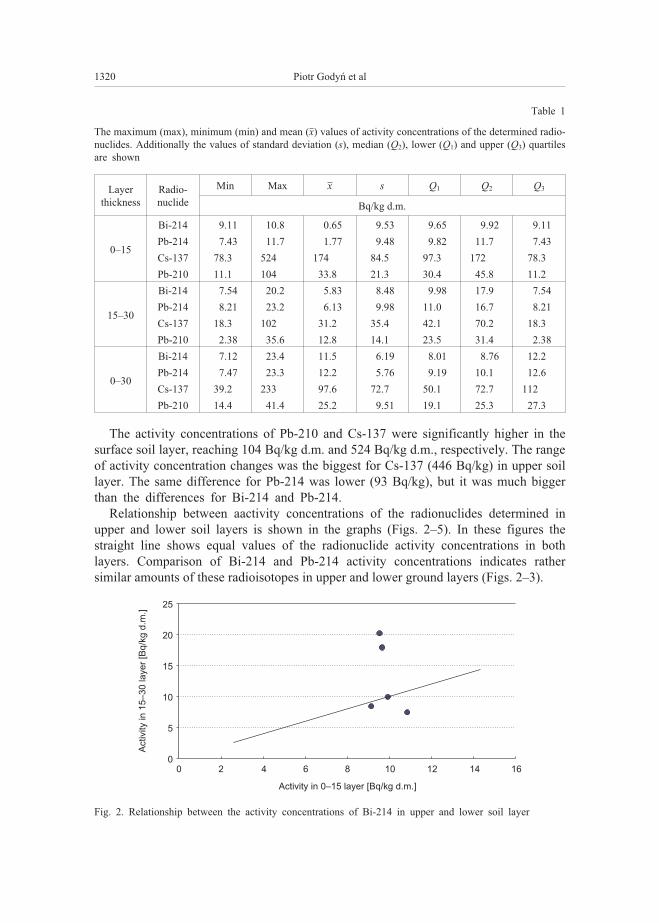
Table 1
The maximum (max), minimum (min) and mean (x) values of activity concentrations of the determined radio-
nuclides. Additionally the values of standard deviation (s), median (Q2), lower (Q1) and upper (Q3) quartiles
are shown
Layer
thickness
Radio-
nuclide
Min Max x s Q1 Q2 Q3
Bq/kg d.m.
0–15
Bi-214 9.11 10.8 0.65 9.53 9.65 9.92 9.11
Pb-214 7.43 11.7 1.77 9.48 9.82 11.7 7.43
Cs-137 78.3 524 174 84.5 97.3 172 78.3
Pb-210 11.1 104 33.8 21.3 30.4 45.8 11.2
15–30
Bi-214 7.54 20.2 5.83 8.48 9.98 17.9 7.54
Pb-214 8.21 23.2 6.13 9.98 11.0 16.7 8.21
Cs-137 18.3 102 31.2 35.4 42.1 70.2 18.3
Pb-210 2.38 35.6 12.8 14.1 23.5 31.4 2.38
0–30
Bi-214 7.12 23.4 11.5 6.19 8.01 8.76 12.2
Pb-214 7.47 23.3 12.2 5.76 9.19 10.1 12.6
Cs-137 39.2 233 97.6 72.7 50.1 72.7 112
Pb-210 14.4 41.4 25.2 9.51 19.1 25.3 27.3
The activity concentrations of Pb-210 and Cs-137 were significantly higher in the
surface soil layer, reaching 104 Bq/kg d.m. and 524 Bq/kg d.m., respectively. The range
of activity concentration changes was the biggest for Cs-137 (446 Bq/kg) in upper soil
layer. The same difference for Pb-214 was lower (93 Bq/kg), but it was much bigger
than the differences for Bi-214 and Pb-214.
Relationship between aactivity concentrations of the radionuclides determined in
upper and lower soil layers is shown in the graphs (Figs. 2–5). In these figures the
straight line shows equal values of the radionuclide activity concentrations in both
layers. Comparison of Bi-214 and Pb-214 activity concentrations indicates rather
similar amounts of these radioisotopes in upper and lower ground layers (Figs. 2–3).
1320 Piotr Godyñ et al
25
20
15
10
5
0
Activity
in1
5–
30
laye
r[B
q/k
gd
.m.]
Activity in 0–15 layer [Bq/kg d.m.]
0 2 4 6 8 10 12 14 16
Fig. 2. Relationship between the activity concentrations of Bi-214 in upper and lower soil layer
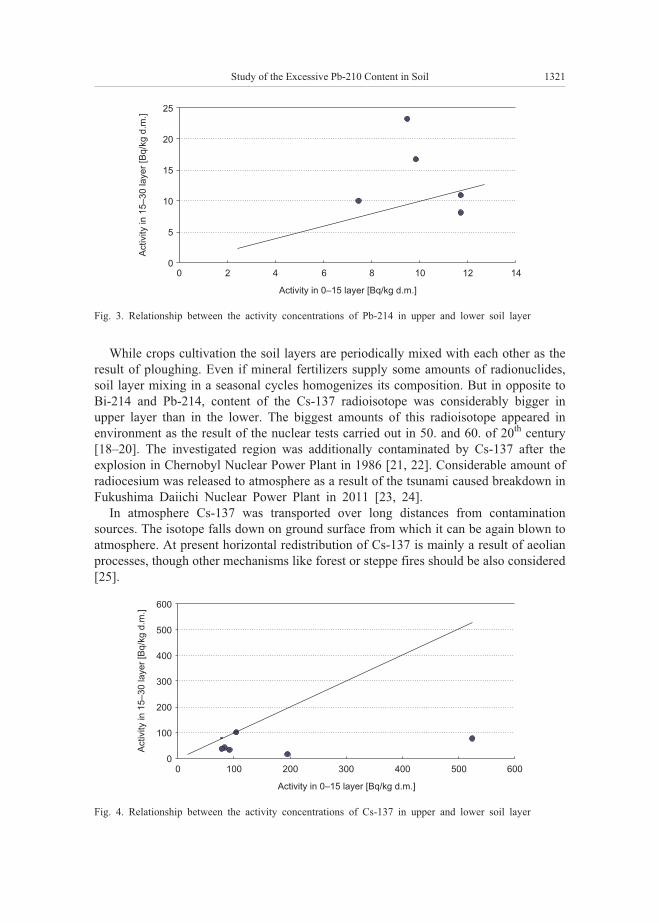
While crops cultivation the soil layers are periodically mixed with each other as the
result of ploughing. Even if mineral fertilizers supply some amounts of radionuclides,
soil layer mixing in a seasonal cycles homogenizes its composition. But in opposite to
Bi-214 and Pb-214, content of the Cs-137 radioisotope was considerably bigger in
upper layer than in the lower. The biggest amounts of this radioisotope appeared in
environment as the result of the nuclear tests carried out in 50. and 60. of 20th century
[18–20]. The investigated region was additionally contaminated by Cs-137 after the
explosion in Chernobyl Nuclear Power Plant in 1986 [21, 22]. Considerable amount of
radiocesium was released to atmosphere as a result of the tsunami caused breakdown in
Fukushima Daiichi Nuclear Power Plant in 2011 [23, 24].
In atmosphere Cs-137 was transported over long distances from contamination
sources. The isotope falls down on ground surface from which it can be again blown to
atmosphere. At present horizontal redistribution of Cs-137 is mainly a result of aeolian
processes, though other mechanisms like forest or steppe fires should be also considered
[25].
Study of the Excessive Pb-210 Content in Soil 1321
25
20
15
10
5
0
Activity
in1
5–
30
laye
r[B
q/k
gd
.m.]
Activity in 0–15 layer [Bq/kg d.m.]
0 2 4 6 8 10 12 14
Fig. 3. Relationship between the activity concentrations of Pb-214 in upper and lower soil layer
600
500
400
300
200
100
0
Activity
in1
5–
30
laye
r[B
q/k
gd
.m.]
Activity in 0–15 layer [Bq/kg d.m.]
0 100 200 300 400 500 600
Fig. 4. Relationship between the activity concentrations of Cs-137 in upper and lower soil layer
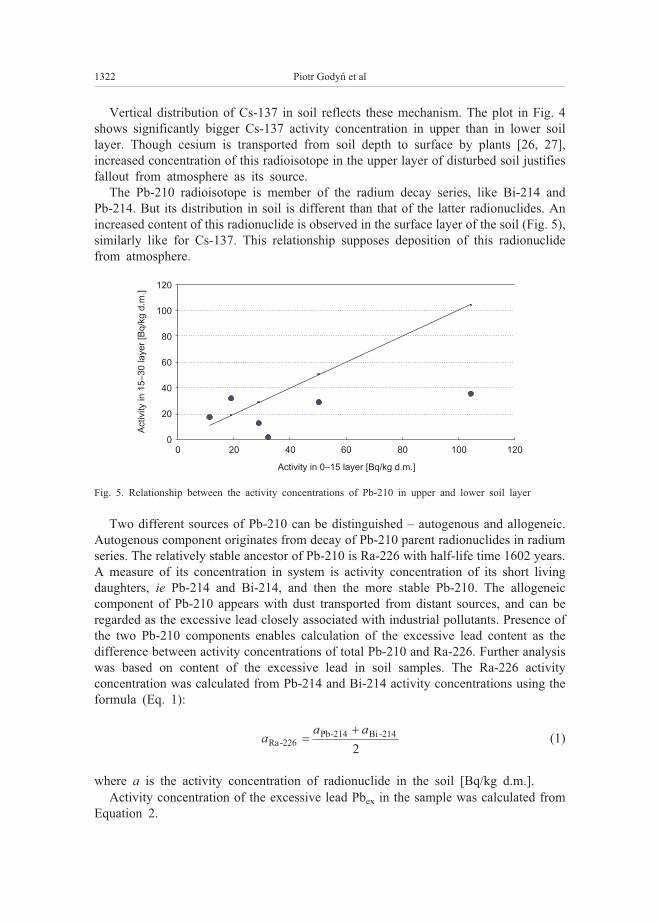
Vertical distribution of Cs-137 in soil reflects these mechanism. The plot in Fig. 4
shows significantly bigger Cs-137 activity concentration in upper than in lower soil
layer. Though cesium is transported from soil depth to surface by plants [26, 27],
increased concentration of this radioisotope in the upper layer of disturbed soil justifies
fallout from atmosphere as its source.
The Pb-210 radioisotope is member of the radium decay series, like Bi-214 and
Pb-214. But its distribution in soil is different than that of the latter radionuclides. An
increased content of this radionuclide is observed in the surface layer of the soil (Fig. 5),
similarly like for Cs-137. This relationship supposes deposition of this radionuclide
from atmosphere.
Two different sources of Pb-210 can be distinguished – autogenous and allogeneic.
Autogenous component originates from decay of Pb-210 parent radionuclides in radium
series. The relatively stable ancestor of Pb-210 is Ra-226 with half-life time 1602 years.
A measure of its concentration in system is activity concentration of its short living
daughters, ie Pb-214 and Bi-214, and then the more stable Pb-210. The allogeneic
component of Pb-210 appears with dust transported from distant sources, and can be
regarded as the excessive lead closely associated with industrial pollutants. Presence of
the two Pb-210 components enables calculation of the excessive lead content as the
difference between activity concentrations of total Pb-210 and Ra-226. Further analysis
was based on content of the excessive lead in soil samples. The Ra-226 activity
concentration was calculated from Pb-214 and Bi-214 activity concentrations using the
formula (Eq. 1):
aa a
Ra-226Pb-214 Bi -214
��
2(1)
where a is the activity concentration of radionuclide in the soil [Bq/kg d.m.].
Activity concentration of the excessive lead Pbex in the sample was calculated from
Equation 2.
1322 Piotr Godyñ et al
120
100
80
60
40
20
0
Activity
in1
5–
30
laye
r[B
q/k
gd
.m.]
Activity in 0–15 layer [Bq/kg d.m.]
0 20 40 60 80 100 120
Fig. 5. Relationship between the activity concentrations of Pb-210 in upper and lower soil layer
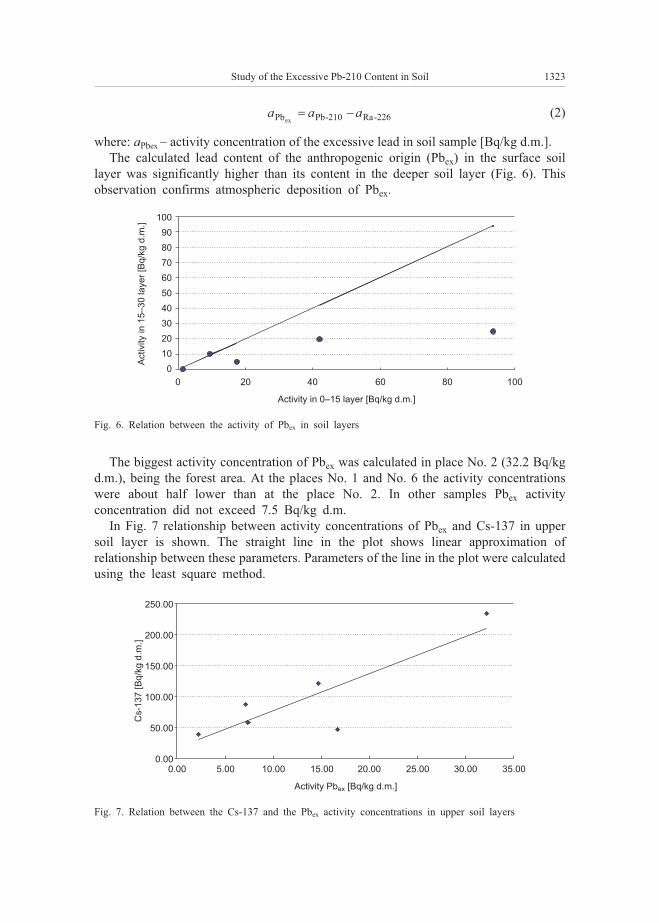
a a aPb Pb-210 Ra-226ex� � (2)
where: aPbex – activity concentration of the excessive lead in soil sample [Bq/kg d.m.].
The calculated lead content of the anthropogenic origin (Pbex) in the surface soil
layer was significantly higher than its content in the deeper soil layer (Fig. 6). This
observation confirms atmospheric deposition of Pbex.
The biggest activity concentration of Pbex was calculated in place No. 2 (32.2 Bq/kg
d.m.), being the forest area. At the places No. 1 and No. 6 the activity concentrations
were about half lower than at the place No. 2. In other samples Pbex activity
concentration did not exceed 7.5 Bq/kg d.m.
In Fig. 7 relationship between activity concentrations of Pbex and Cs-137 in upper
soil layer is shown. The straight line in the plot shows linear approximation of
relationship between these parameters. Parameters of the line in the plot were calculated
using the least square method.
Study of the Excessive Pb-210 Content in Soil 1323
100
90
80
70
60
50
40
30
20
10
0
Activity
in1
5–
30
laye
r[B
q/k
gd
.m.]
Activity in 0–15 layer [Bq/kg d.m.]
0 20 40 60 80 100
Fig. 6. Relation between the activity of Pbex in soil layers
250.00
200.00
150.00
100.00
50.00
0.00
Cs-1
37
[Bq/k
gd.m
.]
Activity Pb [Bq/kg d.m.]ex
0.00 5.00 10.00 15.00 20.00 25.00 30.00 35.00
Fig. 7. Relation between the Cs-137 and the Pbex activity concentrations in upper soil layers
Well outlined linear relationship between Pbex content and Cs-137 activity concentra-
tion could be observed in Fig. 7. The calculated correlation coefficient was 0.87. Such
a high correlation coefficient indicates a decisive influence of the local weather
conditions on the accumulation of pollutants of atmospheric origin in a certain location.
Though the investigated area was not big, atmospheric deposition of pollutants was
highly differentiated. Inhomogeneity of soil pollution could be also a result of
horizontal transport of fine matter which was floated with rain water or water from
melted snow. Secondary pollutants deposition could be much more inhomogeneous than
the initial pattern of atmospheric precipitation.
Conclusions
The gamma spectrometric method analysis allowed determination of two Pb-210
isotope components, the allogeneic (Pbex) and autogenous, in soil samples. Because in
upper soil layer contents of Pbex and Cs-137 were well correlated, the atmospheric
origin of allogeneic lead can be supposed.
The excessive lead is a good indicator of the local pollution related to dry or wet
atmospheric deposition. It can be used for estimation of distribution pattern of
contaminants in an area. The allogeneic lead can be used also as an indicator of
pollution transport from distant sources.
Acknowledgements
The Project received financial assistance from the funds of the National Science Centre, granted by force
of the decision no. DEC-2011/03/D/ST10/05392.
References
[1] Habashi F. A review. Pollution problems of the metallurgical industry. RIIGEO. 2003;15(29):49-60.
[2] Paladyna J, Krasnodebska-Ostrega B, Kregielewska K, Kowalska J, Jedynak L, Golimowski J, Grobelski T,
et al. The assessment of environmental pollution caused by mining and metallurgy wastes from highly
polluted post-industrial regions in Southern Poland. Environ Earth Sci. 2013;68:439-450.
DOI: 10.1007/s12665-012-1750-8.
[3] Metallurgical industries. www.inece.org (accessed 11.01.2014).
[4] Balkhyour MA, Goknil MK. Total fume and metal concentrations during welding in selected factoried in
Jeddah, Saudi Arabia. Int J Environ Res Public Heath. 2010;7:2978-2987. DOI: 10.3390/ijerph7072978.
[5] Dartey E, Adimado AA, Agyarko K. Evaluation of airborne lead levels in storage battery workshops and
some welding environments in Kumasi metropolis in Ghana. Environ Monit Assess. 2010;164:1-8.
DOI: 10.1007/s10661-009-0869-x.
[6] Yang Y, Li S, Bi X, Wu P, Liu T, Li F, Liu C. Lead, Zn and Cd in slags, stream sediments and soils in
an abandoned Zn smelting region , southwest of China, and Pb and S isotopes as source tracers. J Soils
Sediments. 2010;10:1527-1539. DOI: 10.1007/s11368-010-0253-z.
[7] Safari Sinegani AA, Araki HM. Changes in chemical forms of lead in temperate and semiarid soils in
sterile and unsterile conditions. Environ Chem Lett. 2010;8:323-330. DOI: 10.1007/s10311-009-0227-9.
[8] Demetriades A, Li X, Ramsey MH, Thornton I. Chemical speciation and bioaccessibility of lead in
surface soil and house dust, Lavrion urban area, Attiki, Hellas. Environ Geochem Heath.
2010;32:529-552. DOI: 10.1007/s10653-010-9315-9.
[9] Clark JS, Patterson WA. Pollen, Pb-210, and opaque spherules; an integrated approach to dating and
sedimentation in the itertidal environment. J Sed Res. 1984;54(4):1251-1265.
DOI: 10.1306/212F85B2-2B24-11D7-8648000102C1865D.
1324 Piotr Godyñ et al
[10] Ellingsen DG, Zibarev E, Kusraeva Z, Berlinger B, Chashchin M, Bast-Pettersen R, Chashchin V,
Thomassen Y. The bioavailability of manganese in welders in relation to its solubility in welding Fusem.
Environ Sci: Processes Impacts. 2013;15:357-365. DOI: 10.1039/c2em30750b.
[11] Ellingsen DG, Dubeikovskaya L, Dahl K, Chashchin M, Cashchin V, Zibarev E, Thomassen Y. Air
exposure assessment and biological monitoring of manganese and Rother majors welding fume
components in welders. J Environ Monit. 2006;8:1078-1086. DOI: 10.1039/B605549D.
[12] Kuo CH, Wang KC, Tian TF, Tsai MH, Chiung YM, Siech CM, Tsai SJ, et al. Metabolomic
characterization of laborers exposed to welding fumes. Chem Res Toxicol. 2012;25:676-686.
DOI: 10.1021/tx200465e.
[13] Herranz M, Roza S, Pérez C, Idoeta R, Núñez-Lagos R, Legarda F. Effective dose in the manufacturing
process of rutile covered welding electrodes. J Radiol Prot. 2013;33:213.
DOI: 10.1088/0952-4746/33/1/213.
[14] Murphy AB. The effects of metal vapour in arc welding. J Phys D: Appl Phys. 2010;43:434001. DOI:
10.1088/0022-3727/43/43/434001.
[15] Hoffmeyer F, Ralf-Heimsoth M, Weiss T, Lehnert M, Gawrych K, Kendzia B, Harth V, et al. Relation
between biomarkers in exhaled breath condensate and internal exposure to metals from gas metal arc
welding. J Breath Res. 2012;6:1-8. DOI: 10.1088/1752-7155/6/2/027105.
[16] Antonini JM. Health effects of welding. Crit Rev Toxicol. 2003;33(1):61-103.
[17] Zieliñska M, Rajfur M, Koz³owski R, K³os A. Active biomonitoring of the Odra river using Palmaria
palmata algae. Proc of ECOpole. 2013;7(2):754-763. DOI: 10.2429/proc.2013.7(2)099.
[18] Bem EM, Bem H, Wieczorkowski P. Studies of radionuclide concentrations in surface soils in and
around fly ash disposal sites. Sci Total Environ. 1998;220:215-222.
[19] UNSCEAR 1977 Report. Sources And Effects Of Ionizing Radiation. Annex C: Radioactive con-
tamination due to nuclear explosions.
[20] Izrael YA. Radioactive fallout after nuclear explosions and accidents. Vol 3. Radioactivity in the
environment. Amsterdam: Elsevier; 2002.
[21] UNSCEAR 1988 REPORT. Sources, Effects And Risks Of Ionizing Radiation. Annex D: Exposures
from the Chernobyl accident.
[22] Korobova EM, Romanov SL. A Chernobyl 137Cs contamination study as an example for the spatial
structure of geochemical fields and modeling of the geochemical field structure. Chemometr Intell Lab.
2009;99(1):1-8. DOI: 10.1016/j.chemolab.2009.07.009.
[23] Bossew P, Kirchner G, de Cort M, de Vries G, Nishev A, de Felice L. Radioactivity from Fukushima
Dai-ichi in air over Europe. Part 1: Spatio-temporal analysis. J Environ Radioactiv. 2012;114:22-34.
DOI: 10.1016/j.jenvrad.2011.11.019.
[24] Kirchner G, Bossew P, de Cort M. Radioactivity from Fukushima Dai-ichi in air over Europe. Part 2:
What can it tell us about the accident? J Environ Radioactiv. 2012;114:35-40.
DOI: 10.1016/j.jenvrad.2011.12.016.
[25] Yablokov AV, Nesterenko VB, Nesterenko AV. Chernobyl. Ann NY Acad Sci. 2009;1181:221-286.
DOI: 10.1111/j.1749-6632.2009.04830.x.
[26] Dushenkov S. Trends in phytoremediation of radionuclides. Plant and Soil. 2003;249(1):167-175.
DOI: 10.1023/A:1022527207359.
[27] Nimis PL. Radiocesium in plants of forest ecosystems. Studia Geobotan. 1996;15:3-49.
BADANIE ZAWARTOŒCI O£OWIU NADMIAROWEGO W GLEBIE
Samodzielna Katedra Biotechnologii i Biologii Molekularnej
Uniwersytet Opolski
Abstrakt: Celem badañ by³a analiza zanieczyszczenia gleby w rejonie zak³adów metalurgicznych w dzielnicy
Opole-Metalchem. Jako wskaŸnika u¿yto Pb-210, poniewa¿ podwy¿szona jego aktywnoœæ mo¿e wskazywaæ
na obecnoœæ innych zanieczyszczeñ na badanym terenie. Na podstawie uzyskanych wyników obliczono
aktywnoœæ o³owiu nadmiarowego. Najwiêksze jego aktywnoœci zaobserwowano w glebie na terenie leœnym.
W miejscach z podwy¿szon¹ aktywnoœci¹ o³owiu nadmiarowego odnotowano tak¿e wy¿sze wartoœci
aktywnoœci Cs-137.
S³owa kluczowe: wskaŸnik, Pb-210, zanieczyszczenie gleby
Study of the Excessive Pb-210 Content in Soil 1325

Ryszard MAZUREK1* and Pawe³ ZADRO¯NY1
SULPHUR IN THE FOREST SOILS
OF THE OJCOW NATIONAL PARK
SIARKA W GLEBACH LEŒNYCH
OJCOWSKIEGO PARKU NARODOWEGO
Abstract: The aim of this study was to determine the effect of the pedogenesis on the sulfur content in the
forest soils of the Ojcow National Park (OPN). The study was carried out on soils representing the main units
of OPN soil cover: brown rendzinas and soils lessives. Studied soils were characterized by a high variability
of sulphate sulfur content within the profiles. The surface Ol horizons contained the highest amount of SO4-S
(in rendzinas 104.2–248.0 mg � kg–1, in soils lessives 101.0–232.0 mg � kg–1) and a significantly higher than
deeper horizons. The concentration of sulfur in the humus A horizons was lower (in rendzinas 14.1–91.4
mg � kg–1, in soils lessives 16.5–35.5 mg � kg–1) and similar to the values in the horizons of parent rock (in
rendzinas 12.5–26.9 mg � kg–1, in soils lessives 9.1–67.5 mg � kg–1). Content of SO4-S was not varied between
the Et eluvial horizons (15.9–47.3 mg kg–1) and illuvial Bt horizons (12.3–49.8 mg � kg–1). The direction of
pedogenesis had no effect on the vertical distribution of sulfur. This set was caused probably by a high
variability of relief and profiles diversity within a type unit. Moreover, the content of the analyzed component
was determined by a geographical location of soils and specific microclimatic conditions of the Ojcow
National Park.
Keywords: sulphur, soils, the Ojcow National Park
Introduction
The Ojcow National Park (OPN) is considered as one of the most polluted national
parks in Poland for more than last three decades [1–5]. The location in the
neighborhood of Silesian and Cracow agglomeration and specific climate conditions,
associated with the local terrain relief, is the main reason of the high concentration of
pollutants in the OPN [4, 6].
Atmospheric sulfur infiltrates into the soil with precipitation and occurs in soil in the
form of sulphides and sulphates or is bound with soil organic matter. Sulphate ions may
be leached from the soil or adsorbed by humic and fulvic acids, sesquioxides, clay
DOI: 10.2428/ecea.2013.20(11)120 ECOL CHEM ENG A. 2013;20(11):1327-1333
1 Department of Soil Science and Soil Protection, University of Agriculture in Krakow, al. Mickiewicza
21, 31–120 Kraków, Poland, phone +48 12 662 4370, email: [email protected], [email protected]
* Corresponding author: [email protected]
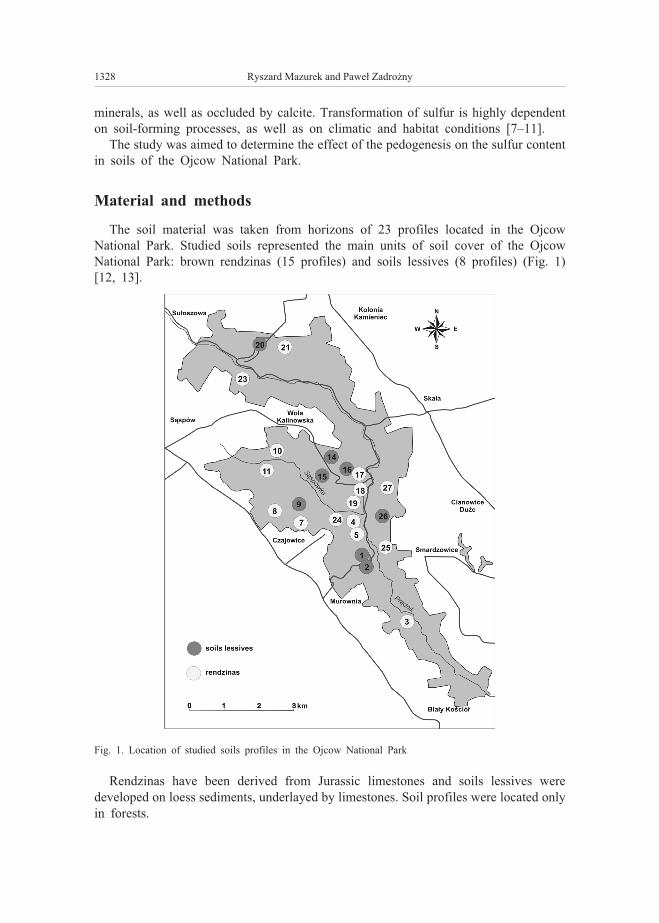
minerals, as well as occluded by calcite. Transformation of sulfur is highly dependent
on soil-forming processes, as well as on climatic and habitat conditions [7–11].
The study was aimed to determine the effect of the pedogenesis on the sulfur content
in soils of the Ojcow National Park.
Material and methods
The soil material was taken from horizons of 23 profiles located in the Ojcow
National Park. Studied soils represented the main units of soil cover of the Ojcow
National Park: brown rendzinas (15 profiles) and soils lessives (8 profiles) (Fig. 1)
[12, 13].
Rendzinas have been derived from Jurassic limestones and soils lessives were
developed on loess sediments, underlayed by limestones. Soil profiles were located only
in forests.
1328 Ryszard Mazurek and Pawe³ Zadro¿ny
Fig. 1. Location of studied soils profiles in the Ojcow National Park
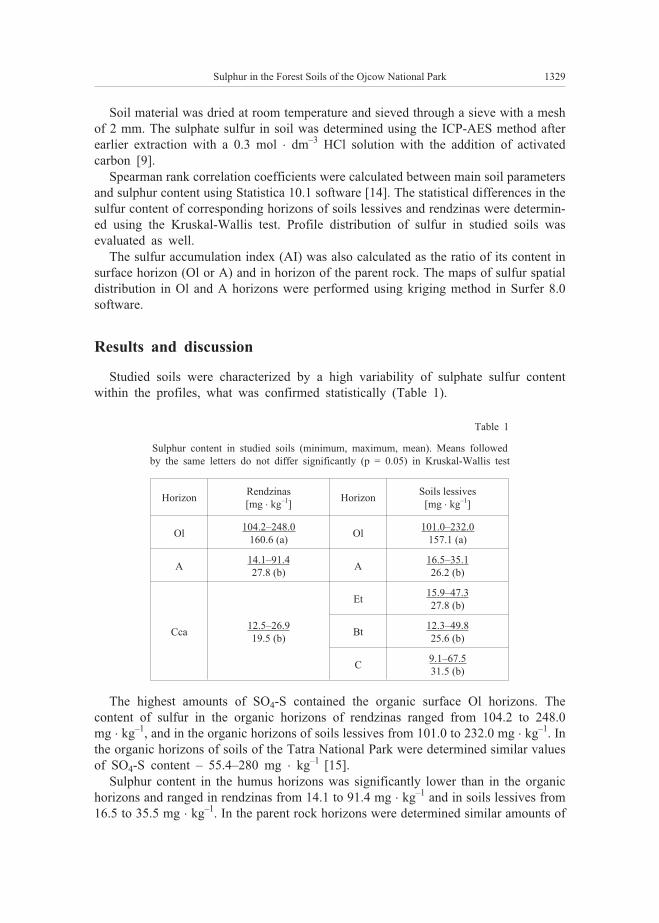
Soil material was dried at room temperature and sieved through a sieve with a mesh
of 2 mm. The sulphate sulfur in soil was determined using the ICP-AES method after
earlier extraction with a 0.3 mol � dm–3 HCl solution with the addition of activated
carbon [9].
Spearman rank correlation coefficients were calculated between main soil parameters
and sulphur content using Statistica 10.1 software [14]. The statistical differences in the
sulfur content of corresponding horizons of soils lessives and rendzinas were determin-
ed using the Kruskal-Wallis test. Profile distribution of sulfur in studied soils was
evaluated as well.
The sulfur accumulation index (AI) was also calculated as the ratio of its content in
surface horizon (Ol or A) and in horizon of the parent rock. The maps of sulfur spatial
distribution in Ol and A horizons were performed using kriging method in Surfer 8.0
software.
Results and discussion
Studied soils were characterized by a high variability of sulphate sulfur content
within the profiles, what was confirmed statistically (Table 1).
Table 1
Sulphur content in studied soils (minimum, maximum, mean). Means followed
by the same letters do not differ significantly (p = 0.05) in Kruskal-Wallis test
HorizonRendzinas
[mg � kg–1]Horizon
Soils lessives
[mg � kg–1]
Ol104.2–248.0
160.6 (a)Ol
101.0–232.0
157.1 (a)
A14.1–91.4
27.8 (b)A
16.5–35.1
26.2 (b)
Cca12.5–26.9
19.5 (b)
Et15.9–47.3
27.8 (b)
Bt12.3–49.8
25.6 (b)
C9.1–67.5
31.5 (b)
The highest amounts of SO4-S contained the organic surface Ol horizons. The
content of sulfur in the organic horizons of rendzinas ranged from 104.2 to 248.0
mg � kg–1, and in the organic horizons of soils lessives from 101.0 to 232.0 mg � kg–1. In
the organic horizons of soils of the Tatra National Park were determined similar values
of SO4-S content – 55.4–280 mg � kg–1 [15].
Sulphur content in the humus horizons was significantly lower than in the organic
horizons and ranged in rendzinas from 14.1 to 91.4 mg � kg–1 and in soils lessives from
16.5 to 35.5 mg � kg–1. In the parent rock horizons were determined similar amounts of
Sulphur in the Forest Soils of the Ojcow National Park 1329
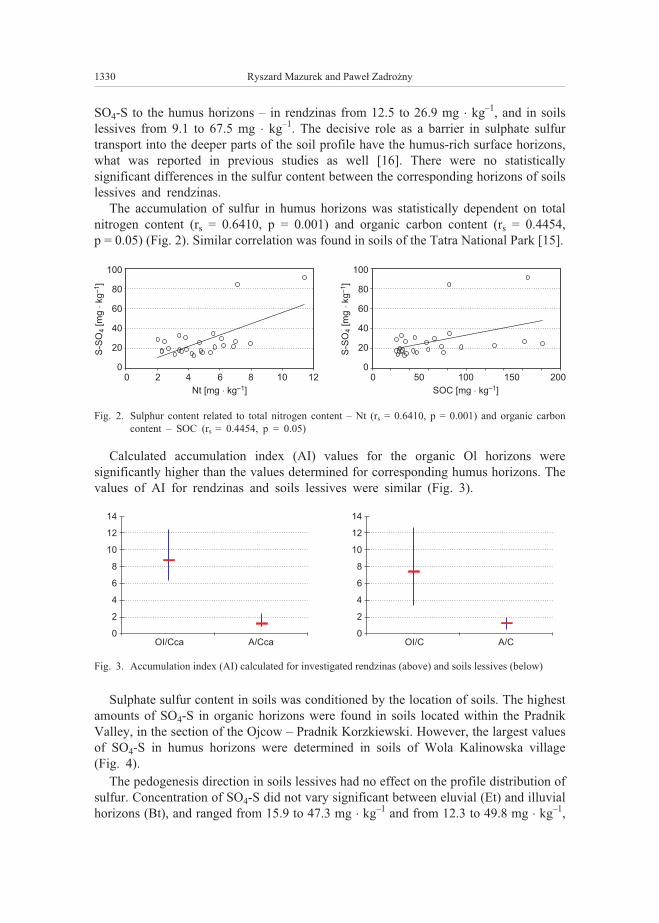
SO4-S to the humus horizons – in rendzinas from 12.5 to 26.9 mg � kg–1, and in soils
lessives from 9.1 to 67.5 mg � kg–1. The decisive role as a barrier in sulphate sulfur
transport into the deeper parts of the soil profile have the humus-rich surface horizons,
what was reported in previous studies as well [16]. There were no statistically
significant differences in the sulfur content between the corresponding horizons of soils
lessives and rendzinas.
The accumulation of sulfur in humus horizons was statistically dependent on total
nitrogen content (rs = 0.6410, p = 0.001) and organic carbon content (rs = 0.4454,
p = 0.05) (Fig. 2). Similar correlation was found in soils of the Tatra National Park [15].
Calculated accumulation index (AI) values for the organic Ol horizons were
significantly higher than the values determined for corresponding humus horizons. The
values of AI for rendzinas and soils lessives were similar (Fig. 3).
Sulphate sulfur content in soils was conditioned by the location of soils. The highest
amounts of SO4-S in organic horizons were found in soils located within the Pradnik
Valley, in the section of the Ojcow – Pradnik Korzkiewski. However, the largest values
of SO4-S in humus horizons were determined in soils of Wola Kalinowska village
(Fig. 4).
The pedogenesis direction in soils lessives had no effect on the profile distribution of
sulfur. Concentration of SO4-S did not vary significant between eluvial (Et) and illuvial
horizons (Bt), and ranged from 15.9 to 47.3 mg � kg–1 and from 12.3 to 49.8 mg � kg–1,
1330 Ryszard Mazurek and Pawe³ Zadro¿ny
100
80
60
40
20
0
100
80
60
40
20
0
S-S
O[m
gkg
]4
–1
�
S-S
O[m
gkg
]4
–1
�
0 02 504 1006 1508 20010 12
Nt [mg kg ]� –1 SOC [mg kg ]� –1
Fig. 2. Sulphur content related to total nitrogen content – Nt (rs = 0.6410, p = 0.001) and organic carbon
content – SOC (rs = 0.4454, p = 0.05)
14
12
10
8
6
4
2
0
14
12
10
8
6
4
2
0OI/Cca OI/CA/Cca A/C
Fig. 3. Accumulation index (AI) calculated for investigated rendzinas (above) and soils lessives (below)
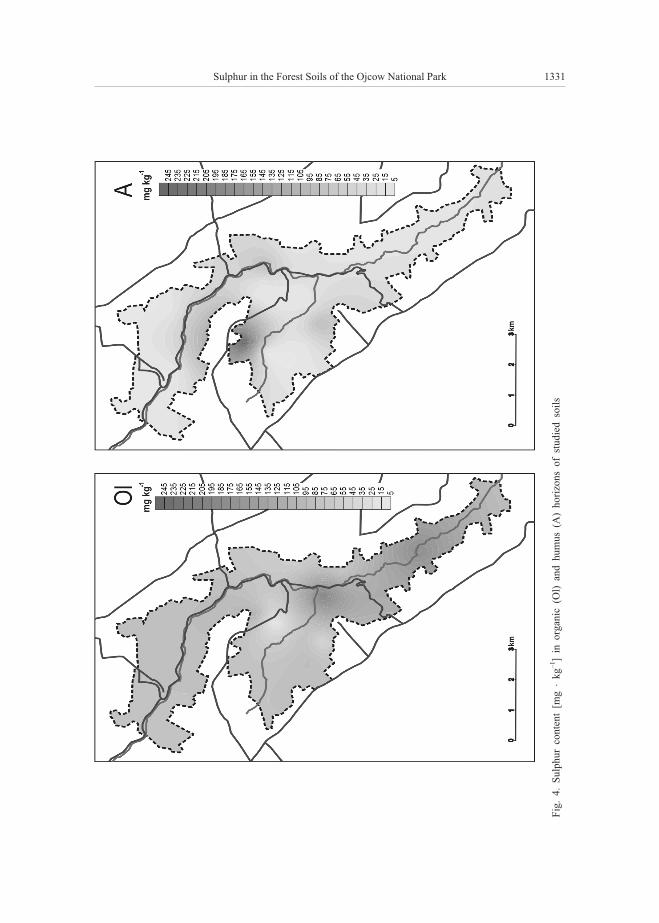
Sulphur in the Forest Soils of the Ojcow National Park 1331
Fig
.4.
Sulp
hur
conte
nt
[mg
�kg
–1]
inorg
anic
(Ol)
and
hum
us
(A)
hori
zons
of
studie
dso
ils
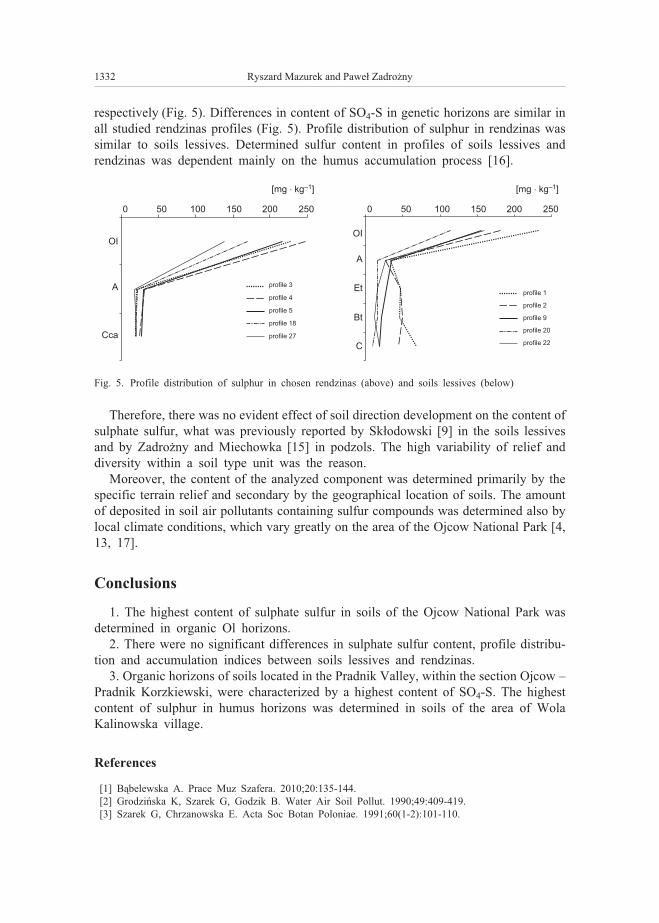
respectively (Fig. 5). Differences in content of SO4-S in genetic horizons are similar in
all studied rendzinas profiles (Fig. 5). Profile distribution of sulphur in rendzinas was
similar to soils lessives. Determined sulfur content in profiles of soils lessives and
rendzinas was dependent mainly on the humus accumulation process [16].
Therefore, there was no evident effect of soil direction development on the content of
sulphate sulfur, what was previously reported by Sk³odowski [9] in the soils lessives
and by Zadro¿ny and Miechowka [15] in podzols. The high variability of relief and
diversity within a soil type unit was the reason.
Moreover, the content of the analyzed component was determined primarily by the
specific terrain relief and secondary by the geographical location of soils. The amount
of deposited in soil air pollutants containing sulfur compounds was determined also by
local climate conditions, which vary greatly on the area of the Ojcow National Park [4,
13, 17].
Conclusions
1. The highest content of sulphate sulfur in soils of the Ojcow National Park was
determined in organic Ol horizons.
2. There were no significant differences in sulphate sulfur content, profile distribu-
tion and accumulation indices between soils lessives and rendzinas.
3. Organic horizons of soils located in the Pradnik Valley, within the section Ojcow –
Pradnik Korzkiewski, were characterized by a highest content of SO4-S. The highest
content of sulphur in humus horizons was determined in soils of the area of Wola
Kalinowska village.
References
[1] B¹belewska A. Prace Muz Szafera. 2010;20:135-144.
[2] Grodziñska K, Szarek G, Godzik B. Water Air Soil Pollut. 1990;49:409-419.
[3] Szarek G, Chrzanowska E. Acta Soc Botan Poloniae. 1991;60(1-2):101-110.
1332 Ryszard Mazurek and Pawe³ Zadro¿ny
0 050 50100 100150 150200 200250 250
OIOI
A
A
Et
Bt
Cca
C
[mg kg ]� –1 [mg kg ]� –1
profile 1
profile 2
profile 9
profile 20
profile 22
profile 3
profile 4
profile 5
profile 18
profile 27
Fig. 5. Profile distribution of sulphur in chosen rendzinas (above) and soils lessives (below)
[4] Sawicka-Kapusta K., Zakrzewska M. Œlusarski G. Pr¹dnik. Prace Muz Szafera. 2006;16:39-48.
[5] Leœniok M. Pr¹dnik. Prace Muz. Szafera. 2009;19:109-118.
[6] Ma³ek S. Water Air Soil Pollut. 2001;130(1-4):505-510.
[7] Camps Arbestain M, Barreal ME, Macías F. Sci Total Environ. 1999;241:181-195.
[8] Mayer B, Prietzel J, Krause HR. Appl Geochem. 2001;16:103-1019.
[9] Sk³odowski P. Rocz Glebozn. 1968;19(1):99-119.
[10] Motowicka-Terelak T, Terelak H. Siarka w glebach Polski – stan i zagro¿enie. Bibl Monit Œrodow.
Warszawa: PIOŒ; 1998: 105 pp.
[11] Szopka K, Karczewska A, Kaba³a C, Kulczyk K. Ochr Œrodow Zasob Natural. 2011;50:61-70.
[12] Systematyka gleb Polski. Wyd 5. Rocz Glebozn. 2011;62(3):5-193.
[13] Zalewa S. Gleby Ojcowskiego Parku Narodowego. In: Monografia Ojcowskiego Parku Narodowego.
Przyroda. Klasa A, Partyka J, editors. Ojców National Park, Muzeum im. Prof. W³adys³awa Szafera;
2008:137-146.
[14] Mazurek R, Zadro¿ny P. Ecol Chem Eng A. 2011;18(5-6):771-776.
[15] Zadro¿ny P, Miechówka A. Rocz Glebozn. 2008;59(3-4):297-301.
[16] Mayer B, Krouse HR, Fritz P, Prietzel J, Rehfuess K-E. Tracers in Hydrology. 1993;215:65-72.
[17] £¹cki E. Pr¹dnik. Prace Muz Szafera. 1994/95;9:67-74.
SIARKA W GLEBACH LEŒNYCH OJCOWSKIEGO PARKU NARODOWEGO
Katedra Gleboznawstwa i Ochrony Gleb
Uniwersytet Rolniczy im. Hugona Ko³³¹taja w Krakowie
Abstrakt: Celem pracy by³o okreœlenie wp³ywu kierunku pedogenezy na zawartoœæ siarki w glebach leœnych
Ojcowskiego Parku Narodowego (OPN). Badaniami objêto gleby reprezentuj¹ce g³ówne jednostki pokrywy
glebowej OPN: rêdziny brunatne i gleby p³owe. Badane gleby charakteryzowa³y siê du¿¹ zmiennoœci¹
zawartoœci siarki siarczanowej w obrêbie profilu. Najwiêksze iloœci S-SO4 zawiera³y powierzchniowe
poziomy organiczne Ol (rêdziny 104,2–248,0 mg � kg–1, gleby p³owe 101,0–232,0 mg � kg–1). W poziomach
próchnicznych A zawartoœæ siarki by³a ni¿sza (rêdziny 14,1–91,4 mg � kg–1, gleby p³owe 16,5–35,5 mg � kg–1)
i zbli¿ona do wartoœci w poziomach sp¹gowych analizowanych profilów (rêdziny 12,5–26,9 mg � kg–1, gleby
p³owe 9,1–67,5 mg � kg–1). W glebach p³owych stwierdzono ma³e zró¿nicowanie pomiêdzy poziomami
eluwialnymi (Et, 15,9–47,3 mg � kg–1) a iluwialnymi (Bt, 12,3–49,8 mg � kg–1).W badanych glebach nie
stwierdzono wp³ywu kierunku pedogenezy i ich rozwoju na zawartoœæ siarki siarczanowej. By³o to
prawdopodobnie spowodowane du¿¹ zmiennoœci¹ rzeŸby i zró¿nicowaniem badanych profilów w obrêbie
danego typu. Ponadto wydaje siê zasadne stwierdzenie, ¿e zawartoœæ analizowanego sk³adnika by³a
najbardziej determinowana specyfik¹ ukszta³towania terenu i po³o¿eniem geograficznym badanych gleb.
S³owa kluczowe: siarka, gleby, Ojcowski Park Narodowy
Sulphur in the Forest Soils of the Ojcow National Park 1333

Katarzyna SO£EK-PODWIKA1
SOIL ENZYMATIC ACTIVITY IN THE IMPACT ZONE
OF SULPHUR COMPOUNDS EMISSION
AKTYWNOή ENZYMATYCZNA GLEB
W STREFIE ODDZIA£YWANIA EMISJI ZWI¥ZKÓW SIARKI
Abstract: Activity of various enzymes is used for the assessing the effect of anthropogenic fsctors on soil
microbiological activity. Dehydrogenase activity is considered a measurement of total soil microbiological
activity. A crucial element of anthropogenic transformations of the natural environment is acid soil
degradation caused by the storage of acid forming substances, such as eg elementary sulphur and atmospheric
pollution with its compounds. In Poland the largest areas strongly polluted with sulphur are situated in the
Tarnobrzeg Sulphur Basin, where pulverized sulphur (transported by wind from the minefields and places of
storage) and the products of its oxidation, such as acid rains or dry deposit have found its way not only to the
soils covering the mining area but also to the soils beyond the boundary of the mine area.
The research aimed to assess the influence of pollution emitted during the thirty-year-long exploitation of
sulphur deposits on the microbiological activity of soils situated in the vicinity of “Grzybow” Sulphur Mine.
The investigated soils taken from the areas situated in neighbouring of mine are characterized by low, as a
rule below 1, level of degydrogenase activity and acid soil reaction and generally a high share of sulphate
sulphur in the total sulphur content. The conducted assessment of the activity of studied enzymes shows, that
the pollution of the soil environment around the mine remains on the level which may pose a threat to living
organisms. The cause of the considerable decrease of the level of dehydrogenase activity of studied soils may
be their acid reaction which is the result of long-term emission of sulphur compounds. In the surface soil layer
sulphur is oxidized to sulphuric acid, which cause a strong soil acidification.
Keywords: dehydrogenase activity, acid soils, sulphur mine
Activity of various enzymes is used for determining the effect of anthropogenic
factors on soil microbiological activity [1, 2]. Dehydrogenase activity is considered a
measure of total microbiological activity in soils and it is often determined in order to
assess the soil anthropogenic transformations. A crucial element of anthropogenic
transformations of the natural environment is acid soil degradation caused by the
storage of acid forming substances, such as eg elementary sulphur and atmospheric
pollution with its compounds. In Poland the largest areas strongly polluted with sulphur
DOI: 10.2428/ecea.2013.20(11)121 ECOL CHEM ENG A. 2013;20(11):1335-1341
1 Soil Science and Soil Protection Department, Agricultural University in Krakow, al. A. Mickiewicza 21,
31–120 Kraków, Poland, phone: +48 12 6624370, fax: +48 12 633 62 45, email: [email protected]
are situated in the Tarnobrzeg Sulphur Basin, where extraction and processing of
sulphur have led to a considerable pollution of the atmosphere, soils, surface and
underground waters. Pulverized sulphur (transported by wind from the minefields and
places of storage) and the products of its oxidation, such as acid rains or dry deposit
have found its way not only to the soils covering the mining area but also to the soils
beyond the boundary of the mine area. In the soil surface layer sulphur is oxidized to
sulphuric acid, which causes strong soil acidification [3–5].
The research aimed to assess the influence of pollution emitted during the
thirty-year-long exploitation of sulphur deposits on the microbiological activity of soils
situated in the vicinity of “Grzybow” Sulphur Mine.
Materials and methods
The material for analyses was collected from mineral surface and subsurface
horizons of 9 representative surfaces located about 3 km from the boundaries of the
former “Grzybow” sulphur mine, which was the first mine in Poland as well in Europe
where sulphur deposits were exploited using the borehole Frash method. Later,
exploitation with the borehole Frash method was also led on areas of mines “Jeziorko”,
“Osiek” and “Basznia”. Although the method of underground smelting of sulphur was
regarded less harmful to the environment than an opencast mining, geochemical,
hydrological and chemical transformations are spread through not only areas where
mining works were led but also on areas occurring beyond borders of mine. The cause
of chemical transformations (acidity) of these areas was a significant degree of the
atmospheric air pollution by sulphur compounds entering different components of
ecosystems. As Levyk and Brzezinska [5] say mining activity within Roztocze region
contributed to impoverishment of the species, landscape and ecosystems diversities.
Soils of areas beyond the border of Sulphur Mine “Grzybow”, in contrast with the soil
of mining fields weren’t subjected to reclamation treatments aiming at an improvement
of their physical and chemical properties.
On selected surfaces (wastelands, overgrown with grasses) remaining under impact
of long-lasting emission of sulphur compounds field research was carried on during
which soil was sampled for laboratory analyses,
In air dried soil material pH in H2O and in 1 mol � dm–3 KCl solution was estimated
potentiometrically, soil texture using the Casagrande areometric method in Proszynski’s
modification, organic C content by means of the Tiurin method modified by Oleksy-
nowa, total N using the Kjeldahl method and total S and S-SO4 using the modified
Barsley-Lancaster methods [6]. Sulphur forms were determined in the obtained extracts
using the gravimetric method according to Polish standards PN-75 C-04566/21 and
PN-74 C-04566/09. The soil dehydrogenase activity was assessed by colorimeter after
24 hour incubation of the soil samples at 37 oC with TTC solution (2,3,5-Tri-
phenyltetrazolium Chloride) used a substrate for measuring the investigated enzymes
with the Casidy et al [7] method and stated in cubic centimeters of hydrogen per
1 kilogram of soil per day [cm3H2 � kg–1� d–1].The intensity of colouration was
measured using the Beckman DU 600 spectrophotometer at the wavelength 485 nm.
1336 Katarzyna So³ek-Podwika
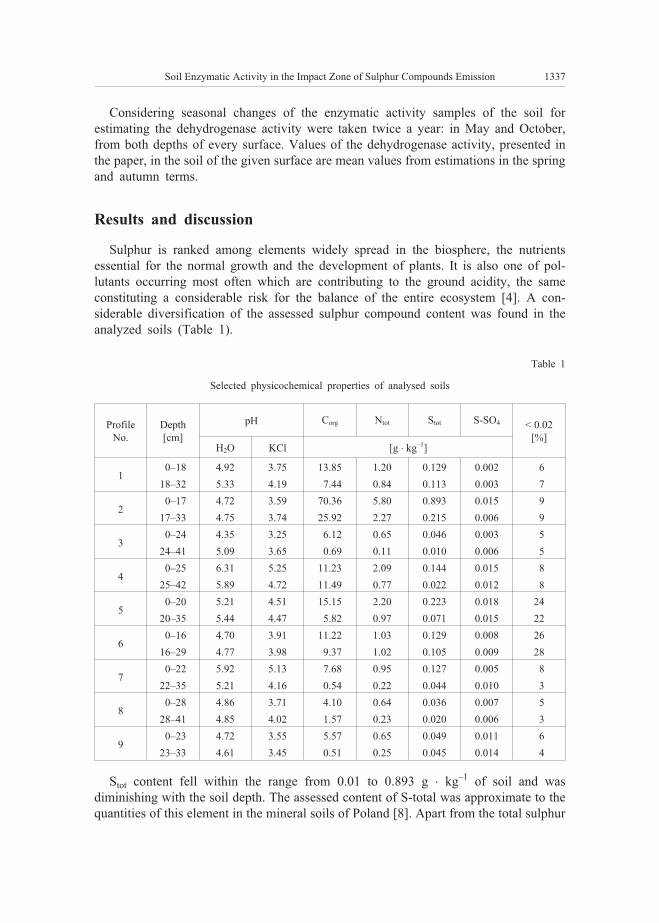
Considering seasonal changes of the enzymatic activity samples of the soil for
estimating the dehydrogenase activity were taken twice a year: in May and October,
from both depths of every surface. Values of the dehydrogenase activity, presented in
the paper, in the soil of the given surface are mean values from estimations in the spring
and autumn terms.
Results and discussion
Sulphur is ranked among elements widely spread in the biosphere, the nutrients
essential for the normal growth and the development of plants. It is also one of pol-
lutants occurring most often which are contributing to the ground acidity, the same
constituting a considerable risk for the balance of the entire ecosystem [4]. A con-
siderable diversification of the assessed sulphur compound content was found in the
analyzed soils (Table 1).
Table 1
Selected physicochemical properties of analysed soils
Profile
No.
Depth
[cm]
pH Corg Ntot Stot S-SO4 < 0.02
[%]H2O KCl [g � kg–1]
10–18 4.92 3.75 13.85 1.20 0.129 0.002 6
18–32 5.33 4.19 7.44 0.84 0.113 0.003 7
20–17 4.72 3.59 70.36 5.80 0.893 0.015 9
17–33 4.75 3.74 25.92 2.27 0.215 0.006 9
30–24 4.35 3.25 6.12 0.65 0.046 0.003 5
24–41 5.09 3.65 0.69 0.11 0.010 0.006 5
40–25 6.31 5.25 11.23 2.09 0.144 0.015 8
25–42 5.89 4.72 11.49 0.77 0.022 0.012 8
50–20 5.21 4.51 15.15 2.20 0.223 0.018 24
20–35 5.44 4.47 5.82 0.97 0.071 0.015 22
60–16 4.70 3.91 11.22 1.03 0.129 0.008 26
16–29 4.77 3.98 9.37 1.02 0.105 0.009 28
70–22 5.92 5.13 7.68 0.95 0.127 0.005 8
22–35 5.21 4.16 0.54 0.22 0.044 0.010 3
80–28 4.86 3.71 4.10 0.64 0.036 0.007 5
28–41 4.85 4.02 1.57 0.23 0.020 0.006 3
90–23 4.72 3.55 5.57 0.65 0.049 0.011 6
23–33 4.61 3.45 0.51 0.25 0.045 0.014 4
Stot content fell within the range from 0.01 to 0.893 g � kg–1 of soil and was
diminishing with the soil depth. The assessed content of S-total was approximate to the
quantities of this element in the mineral soils of Poland [8]. Apart from the total sulphur
Soil Enzymatic Activity in the Impact Zone of Sulphur Compounds Emission 1337
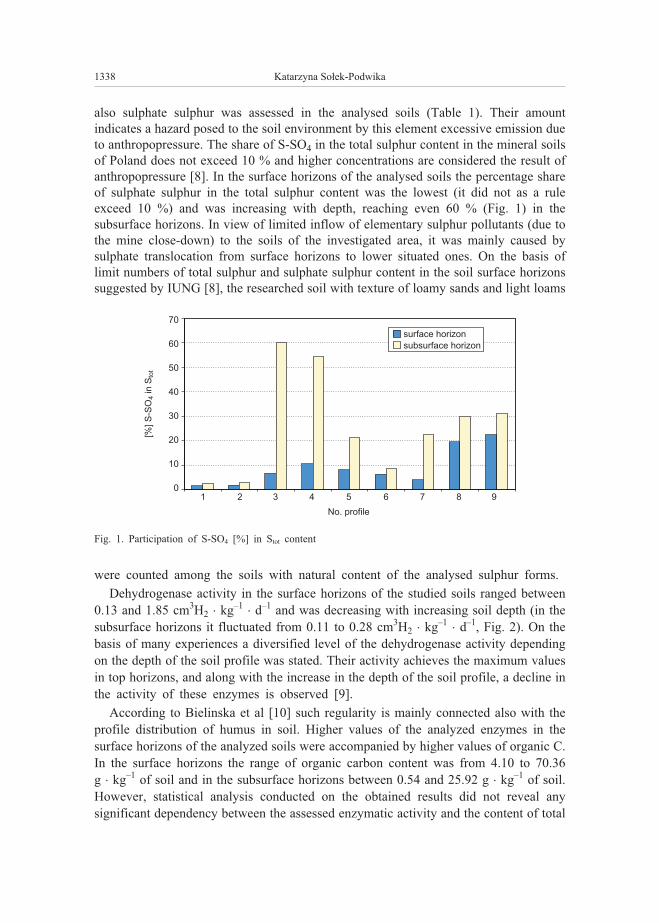
also sulphate sulphur was assessed in the analysed soils (Table 1). Their amount
indicates a hazard posed to the soil environment by this element excessive emission due
to anthropopressure. The share of S-SO4 in the total sulphur content in the mineral soils
of Poland does not exceed 10 % and higher concentrations are considered the result of
anthropopressure [8]. In the surface horizons of the analysed soils the percentage share
of sulphate sulphur in the total sulphur content was the lowest (it did not as a rule
exceed 10 %) and was increasing with depth, reaching even 60 % (Fig. 1) in the
subsurface horizons. In view of limited inflow of elementary sulphur pollutants (due to
the mine close-down) to the soils of the investigated area, it was mainly caused by
sulphate translocation from surface horizons to lower situated ones. On the basis of
limit numbers of total sulphur and sulphate sulphur content in the soil surface horizons
suggested by IUNG [8], the researched soil with texture of loamy sands and light loams
were counted among the soils with natural content of the analysed sulphur forms.
Dehydrogenase activity in the surface horizons of the studied soils ranged between
0.13 and 1.85 cm3H2 � kg–1� d–1 and was decreasing with increasing soil depth (in the
subsurface horizons it fluctuated from 0.11 to 0.28 cm3H2 � kg–1� d–1, Fig. 2). On the
basis of many experiences a diversified level of the dehydrogenase activity depending
on the depth of the soil profile was stated. Their activity achieves the maximum values
in top horizons, and along with the increase in the depth of the soil profile, a decline in
the activity of these enzymes is observed [9].
According to Bielinska et al [10] such regularity is mainly connected also with the
profile distribution of humus in soil. Higher values of the analyzed enzymes in the
surface horizons of the analyzed soils were accompanied by higher values of organic C.
In the surface horizons the range of organic carbon content was from 4.10 to 70.36
g � kg–1 of soil and in the subsurface horizons between 0.54 and 25.92 g � kg–1 of soil.
However, statistical analysis conducted on the obtained results did not reveal any
significant dependency between the assessed enzymatic activity and the content of total
1338 Katarzyna So³ek-Podwika
Fig. 1. Participation of S-SO4 [%] in Stot content
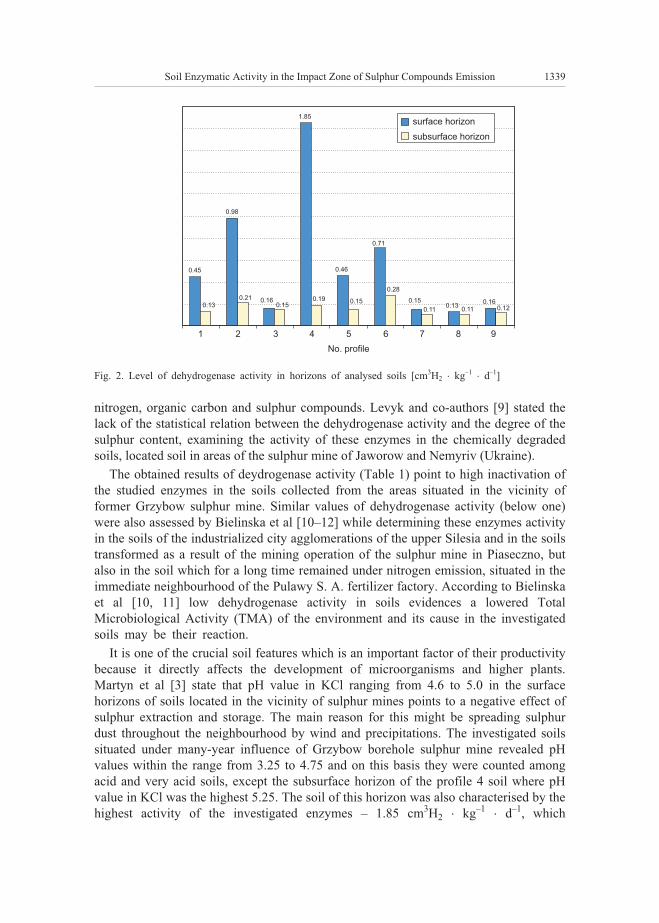
nitrogen, organic carbon and sulphur compounds. Levyk and co-authors [9] stated the
lack of the statistical relation between the dehydrogenase activity and the degree of the
sulphur content, examining the activity of these enzymes in the chemically degraded
soils, located soil in areas of the sulphur mine of Jaworow and Nemyriv (Ukraine).
The obtained results of deydrogenase activity (Table 1) point to high inactivation of
the studied enzymes in the soils collected from the areas situated in the vicinity of
former Grzybow sulphur mine. Similar values of dehydrogenase activity (below one)
were also assessed by Bielinska et al [10–12] while determining these enzymes activity
in the soils of the industrialized city agglomerations of the upper Silesia and in the soils
transformed as a result of the mining operation of the sulphur mine in Piaseczno, but
also in the soil which for a long time remained under nitrogen emission, situated in the
immediate neighbourhood of the Pulawy S. A. fertilizer factory. According to Bielinska
et al [10, 11] low dehydrogenase activity in soils evidences a lowered Total
Microbiological Activity (TMA) of the environment and its cause in the investigated
soils may be their reaction.
It is one of the crucial soil features which is an important factor of their productivity
because it directly affects the development of microorganisms and higher plants.
Martyn et al [3] state that pH value in KCl ranging from 4.6 to 5.0 in the surface
horizons of soils located in the vicinity of sulphur mines points to a negative effect of
sulphur extraction and storage. The main reason for this might be spreading sulphur
dust throughout the neighbourhood by wind and precipitations. The investigated soils
situated under many-year influence of Grzybow borehole sulphur mine revealed pH
values within the range from 3.25 to 4.75 and on this basis they were counted among
acid and very acid soils, except the subsurface horizon of the profile 4 soil where pH
value in KCl was the highest 5.25. The soil of this horizon was also characterised by the
highest activity of the investigated enzymes – 1.85 cm3H2 � kg–1� d–1, which
Soil Enzymatic Activity in the Impact Zone of Sulphur Compounds Emission 1339
Fig. 2. Level of dehydrogenase activity in horizons of analysed soils [cm3H2 � kg–1� d–1]
corroborates the results obtained by Frankenberger and Johanson [13], who on the basis
of conducted research found that even small changes of pH values may considerably
change the activity of soil enzymes. The influence of the soil reaction on the enzymatic
activity was noted also by Levyk and collaborators [9] when comparing the dehydro-
genase activity of the anthropogenic soil transformed as a result of the exploitation of
sulphur deposits. On the basis of conducted estimations authors stated several times
lower the level of the activity of examined enzymes in acid soils than in alkaline ones.
According to many authors, the most beneficial reaction conditions for the activity of
dehydrogenases are close to neutral [14, 15].
Conclusions
1. Many-year extraction and storage of sulphur in the area of “Grzybow” Sulphur
Mine had a negative influence on the state of the natural environment of the
neighbouring areas including the analysed soils. These soils are characterized by a low,
as a rule below one, level of soil dehydrogenase activity and acid reaction, and
a generally high share of sulphate sulphur in total sulphur content.
2. The cause of the considerable decrease of the level of dehydrogenase activity of
studied soils may be their acid reaction which is the result of long-term emission of
sulphur compounds.
References
[1] Margesin R, ZimmerbauerA, Schinner F. Chemosphere. 2000;40:339-346.
DOI: 10.1016/S0045-6535(99)00218-0.
[2] Aon MA, Colaneri AC. Applied Soil Ecology. 2001;18(3):255-270.
DOI: 10.1016/S0929-1393(01)00161-5.
[3] Martyn W, Joñca M. Acta Agrophys. 2006;8:689-698.
[4] Melgar-Ramirez R, González V, Antonio Sánchez J, García I. Water Air Soil Pollut. 2012;223:6123-6131.
DOI 10.1007/s11270-012-1345-8.
[5] Levyk V, Brzeziñska M. Acta Agrophys. 2007;10(1):149-157.
[6] Ostrowska A, Gawliñski S, Szczubia³ka Z. Katalog. Warszawa: Inst Ochr Œrod; 1991.
[7] Casida LE, Klein DA, Santoro T. Soil Sci. 1964;98:371-376.
[8] Kabata-Pendias A, Motowicka-Terelak T, Piotrowska M, Terelak H, Witek T. IUNG Pu³awy.
1993;P(53):1-20.
[9] Levyk V, Maryskevych O, Brzeziñska M, W³odarczyk T. Int Agrophys. 2007;21(3):255-260.
[10] Bieliñska EJ, Wêgorek T, Ligêza S, Futa B. Rocz Glebozn. 2004;55(2):69-75.
[11] Bieliñska EJ. Rocz Glebozn. 2006;57(1/2):32-40.
[12] Bieliñska EJ. J Res Appl Agricult Eng. 2007;52(3):10-14.
[13] Frankenberger WT, Johanson JB. Soil Biol Biochem. 1982;14:433-437.
[14] Brzeziñska M, Stêpniewska Z, Stêpniewski W. Soil Biol Biochem. 1998; 30(13):1783-1790.
DOI: 10.1016/S0038-0717(98)00043-1.
[15] W³odarczyk T, Stêpniewski W, Brzeziñska M. Biol Fertil Soils. 2002;36:200-206.
DOI: 10.1007/s00374-002-0513-1.
1340 Katarzyna So³ek-Podwika
AKTYWNOή ENZYMATYCZNA GLEB
W STREFIE ODDZIA£YWANIA EMISJI ZWI¥ZKÓW SIARKI
Katedra Gleboznawstwa i Ochrony Gleb
Uniwersytet Rolniczy im. Hugona Ko³³ataja w Krakowie
Abstrakt: Aktywnoœæ ró¿nych enzymów wykorzystuje siê do oszacowania wp³ywu antropogenicznych czyn-
ników stresowych na aktywnoœæ mikrobiologiczn¹ gleb. Za miarê ca³kowitej aktywnoœci mikrobiologicznej
w glebie uznaje siê aktywnoœæ dehydrogenaz, których oznaczenie jest czêsto stosowane jako ocena stopnia
antropogenicznych przekszta³ceñ gleb. Istotnym elementem antropogenicznych przekszta³ceñ œrodowiska
przyrodniczego jest kwasowa degradacja gleb, której przyczyn¹ jest sk³adowanie kwasotwórczych substancji,
np. siarki elementarnej i zanieczyszczenie atmosfery jej zwi¹zkami. W Polsce najwiêksze obszary gleb silnie
zasiarczonych wystêpuj¹ w Tarnobrzeskim Zag³êbiu Siarkowym, gdzie rozpylona siarka (transportowana
eolicznie z pól górniczych i miejsc sk³adowania) oraz produkty jej utlenienia w postaci kwaœnych deszczy lub
suchego opadu dostawa³a siê nie tylko do gleb po³o¿onych na terenie kopalñ, ale tak¿e do gleb znajduj¹cych
siê poza ich granicami.
Celem badañ by³a ocena wp³ywu zanieczyszczeñ emitowanych podczas 30-letniej eksploatacji z³ó¿ siarki
na aktywnoœæ mikrobiologiczn¹ gleb po³o¿onych w s¹siedztwie Kopalni Siarki Grzybów. Badane gleby,
pobrane z terenów po³o¿onych w s¹siedztwie kopalni charakteryzuj¹ siê niskim, z regu³y poni¿ej jednoœci,
poziomem aktywnoœci dehydrogenaz glebowych oraz kwaœnym odczynem i z regu³y wysokim udzia³em siarki
siarczanowej w zawartoœci siarki ogó³em. Aktywnoœæ dehydrogenaz w poziomach powierzchniowych
badanych gleb mieœci³a siê w granicach od 0,13 do 1,85 cm3H2 � kg–1� d–1 i zmniejsza³a siê wraz ze wzrostem
g³êbokoœci gleby (w poziomach podpowierzchniowych kszta³towa³a siê w zakresie od 0,11 do 0,28
cm3H2 � kg–1� d–1). Przeprowadzone oznaczenia aktywnoœci badanych enzymów wskazuj¹, ¿e wielkoœæ
zanieczyszczenia œrodowiska glebowego wokó³ kopalni pozostaje na poziomie, który mo¿e zagra¿aæ
organizmom ¿ywym. Przyczyn¹ znacznego obni¿enia poziomu aktywnoœci dehydrogenaz badanych gleb
mo¿e byæ ich kwaœny odczyn, który jest wynikiem d³ugoletnich emisji zwi¹zków siarki. Siarka w po-
wierzchniowej warstwie gleby ulega utlenieniu do kwasu siarkowego, który powoduje silne zakwaszenie gleb.
Badane gleby znajduj¹ce siê w zasiêgu d³ugoletniego oddzia³ywania otworowej kopalni siarki Grzybów
charakteryzowa³y siê wartoœciami pH w KCl w zakresie od 3,25 do 4,75 i na tej podstawie zosta³y zaliczone
do gleb kwaœnych i bardzo kwaœnych.
S³owa kluczowe: aktywnoœæ dehydrogenaz, gleby kwaœne, kopalnia siarki
Soil Enzymatic Activity in the Impact Zone of Sulphur Compounds Emission 1341

Janusz Ryszard MROCZEK1* and Joanna KOSTECKA1
EFFECT OF SAPONIN EXTRACT ON VERMICOMPOSTING
OF SELECTED ORGANIC WASTE
WP£YW EKSTRAKTU SAPONINOWEGO NA WERMIKOMPOSTOWANIE
WYBRANYCH ODPADÓW ORGANICZNYCH
Abstract: Vermicomposting of livestock manure and organic kitchen refuse is a possible way of utilizing this
type of waste. The study was designed to assess the impact of saponin extract on the characteristics of the
earthworm Eisenia fetida used for vermicomposting of swine manure with added organic kitchen refuse and
cellulose, as well as its effect on the chemical composition of the produced vermicomposts. During the study,
extract of Quillaja saponaria added to the waste did not affect the size and mass of the population or
reproduction of the earthworms, yet it adversely modified the mass of adult specimens. The vermicomposts
obtained had varied composition. Significant differences were shown in the contents of sodium, calcium,
copper and zinc.
Keywords: swine manure, organic kitchen refuse, cellulose, Eisenia fetida (Sav.), saponins, vermicompost
Introduction
An increasing volume of municipal waste, including organic kitchen refuse,
generated in rural areas is not utilized or processed, which is directly linked with a
change in lifestyle leading to greater consumption of goods. In addition to organic
kitchen waste, the volume and quality of biomass wastes produced in rural areas
are connected with crop and animal production. At present, livestock farming is
a particularly expansive type of agricultural operation leading to production of such
waste as farmyard manure, slurry, urine manure, and poultry droppings. All these types
of waste inadequately utilized can pose hazards for the environment; alternatively they
are a valuable source of nutrients for crops.
Highly concentrated pig farming leads to excessive size of stock in relation to the
area designated for plant production and is the reason why animal manure is
DOI: 10.2428/ecea.2013.20(11)122 ECOL CHEM ENG A. 2013;20(11):1343-1350
1 Department of Natural Theories of Agriculture and Environmental Education, Faculty of Agriculture and
Biology, University of Rzeszów, ul. M. Æwikliñskiej 2/D3, 35-601 Rzeszów, Poland, email: [email protected];
* Corresponding author: [email protected]
increasingly burdensome for the surroundings [1]. This is caused by ammonia, which is
produced during decomposition of nitrogen compounds contained in excrements, and is
harmful for people, animals and the natural environment. It is estimated that livestock
farming is responsible for approximately 50 % of global ammonia emissions. Penetrat-
ing the soil along with rainwater, ammonia adversely affects the nitrogen balance
leading to changes in natural ecosystems and agrocoenoses. Excessive amounts of
ammonia derivatives causes deactivation of biological life in specific components of the
environment, which then leads to a loss in its capacity for self-purification and gradual
degradation [2–6].
Methods of reducing ammonia emissions from animal excrements, which have been
used for years, include the use of deodorizing agents (eg microbiological, humic and
chemical). Due to the fact that synthetic agents frequently cause allergic reactions in
animals, increasingly popular are formulas containing saponin substances obtained from
extract of such plants as Yucca schidigera and Quillaja saponaria.
Most saponin substances show strong biotic activity. For instance saponins promote
growth of beneficial microflora in the digestive system of animals and hinder activity of
urease, the enzyme which is responsible for disintegration of urea into ammonia [7–9].
Supplementing livestock fodder with saponin agents contributes to reduced ammonia
emission in the animals’ immediate surroundings, and as a result improves their
productivity and health [10]. Because of their natural origin, saponin agents secreted
into the environment with excrements should biodegrade. Yet, no research has been
conducted to investigate their impact on biological diversity, including soil macrofauna
and earthworms, as significant elements of trophic chains.
Earthworms, commonly occurring in various types of soil, are not only good
bioindicators showing the state of the environment (they are used in monitoring of the
soil environment because they come into contact with soil via their skin and, internally,
through their digestive system) [11], but they are also used in organic waste utilization
and vermicompost production [12, 13].
Numerous studies [14–18] have shown evidence that vermicomposting can be
applied to kitchen refuse, as well as waste generated by paper plants, distilleries and
other types of industry.
The purpose of the study was to assess the impact of saponin extract on the
characteristics of earthworms used in the vermicomposting process, based on swine
manure with added organic kitchen waste and cellulose as well as the effect on chemical
composition of the vermicompost obtained.
Materials and methods
The experiment was conducted in plastic containers with the capacity of 3 dm3, filled
with selected organic waste (swine manure, kitchen refuse and cellulose, in the
proportion of 1:1:1 calculated per dry mass). The process of vermicomposting was
conducted with earthworms of the species Eisenia fetida (Sav.) following the pattern
shown in Table 1.
1344 Janusz Ryszard Mroczek and Joanna Kostecka
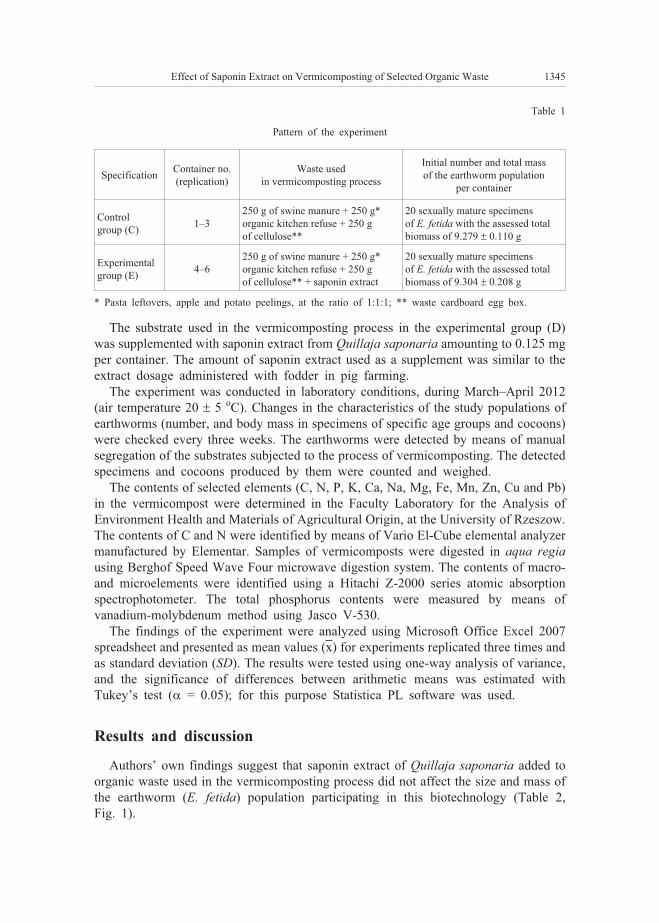
Table 1
Pattern of the experiment
SpecificationContainer no.
(replication)
Waste used
in vermicomposting process
Initial number and total mass
of the earthworm population
per container
Control
group (C)1–3
250 g of swine manure + 250 g*
organic kitchen refuse + 250 g
of cellulose**
20 sexually mature specimens
of E. fetida with the assessed total
biomass of 9.279 � 0.110 g
Experimental
group (E)4–6
250 g of swine manure + 250 g*
organic kitchen refuse + 250 g
of cellulose** + saponin extract
20 sexually mature specimens
of E. fetida with the assessed total
biomass of 9.304 � 0.208 g
* Pasta leftovers, apple and potato peelings, at the ratio of 1:1:1; ** waste cardboard egg box.
The substrate used in the vermicomposting process in the experimental group (D)
was supplemented with saponin extract from Quillaja saponaria amounting to 0.125 mg
per container. The amount of saponin extract used as a supplement was similar to the
extract dosage administered with fodder in pig farming.
The experiment was conducted in laboratory conditions, during March–April 2012
(air temperature 20 � 5 oC). Changes in the characteristics of the study populations of
earthworms (number, and body mass in specimens of specific age groups and cocoons)
were checked every three weeks. The earthworms were detected by means of manual
segregation of the substrates subjected to the process of vermicomposting. The detected
specimens and cocoons produced by them were counted and weighed.
The contents of selected elements (C, N, P, K, Ca, Na, Mg, Fe, Mn, Zn, Cu and Pb)
in the vermicompost were determined in the Faculty Laboratory for the Analysis of
Environment Health and Materials of Agricultural Origin, at the University of Rzeszow.
The contents of C and N were identified by means of Vario El-Cube elemental analyzer
manufactured by Elementar. Samples of vermicomposts were digested in aqua regiausing Berghof Speed Wave Four microwave digestion system. The contents of macro-
and microelements were identified using a Hitachi Z-2000 series atomic absorption
spectrophotometer. The total phosphorus contents were measured by means of
vanadium-molybdenum method using Jasco V-530.
The findings of the experiment were analyzed using Microsoft Office Excel 2007
spreadsheet and presented as mean values (x) for experiments replicated three times and
as standard deviation (SD). The results were tested using one-way analysis of variance,
and the significance of differences between arithmetic means was estimated with
Tukey’s test (� = 0.05); for this purpose Statistica PL software was used.
Results and discussion
Authors’ own findings suggest that saponin extract of Quillaja saponaria added to
organic waste used in the vermicomposting process did not affect the size and mass of
the earthworm (E. fetida) population participating in this biotechnology (Table 2,
Fig. 1).
Effect of Saponin Extract on Vermicomposting of Selected Organic Waste 1345
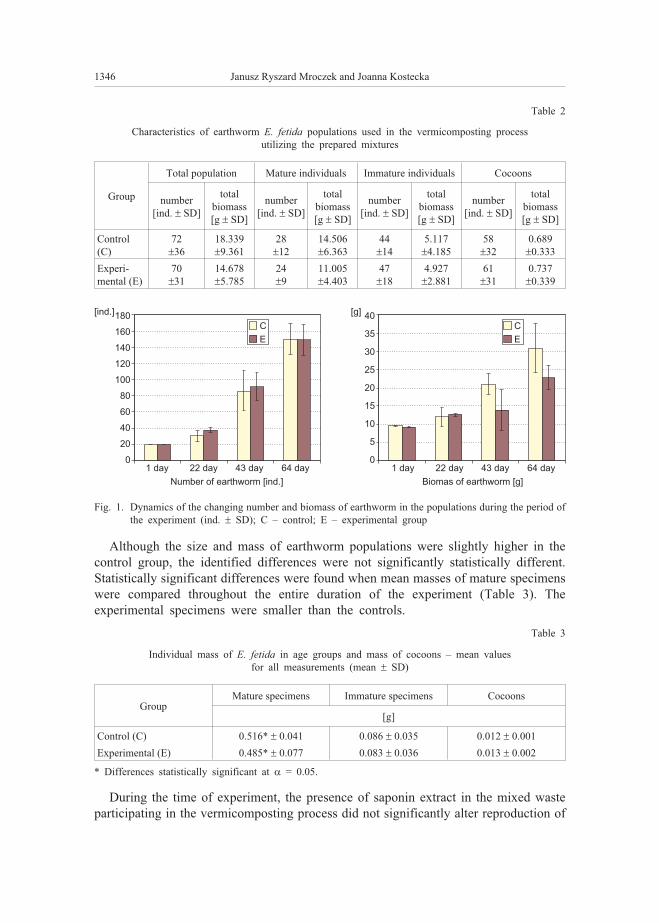
Table 2
Characteristics of earthworm E. fetida populations used in the vermicomposting process
utilizing the prepared mixtures
Group
Total population Mature individuals Immature individuals Cocoons
number
[ind. � SD]
total
biomass
[g � SD]
number
[ind. � SD]
total
biomass
[g � SD]
number
[ind. � SD]
total
biomass
[g � SD]
number
[ind. � SD]
total
biomass
[g � SD]
Control
(C)
72
�36
18.339
�9.361
28
�12
14.506
�6.363
44
�14
5.117
�4.185
58
�32
0.689
�0.333
Experi-
mental (E)
70
�31
14.678
�5.785
24
�9
11.005
�4.403
47
�18
4.927
�2.881
61
�31
0.737
�0.339
Although the size and mass of earthworm populations were slightly higher in the
control group, the identified differences were not significantly statistically different.
Statistically significant differences were found when mean masses of mature specimens
were compared throughout the entire duration of the experiment (Table 3). The
experimental specimens were smaller than the controls.
Table 3
Individual mass of E. fetida in age groups and mass of cocoons – mean values
for all measurements (mean � SD)
GroupMature specimens Immature specimens Cocoons
[g]
Control (C) 0.516* � 0.041 0.086 � 0.035 0.012 � 0.001
Experimental (E) 0.485* � 0.077 0.083 � 0.036 0.013 � 0.002
* Differences statistically significant at � = 0.05.
During the time of experiment, the presence of saponin extract in the mixed waste
participating in the vermicomposting process did not significantly alter reproduction of
1346 Janusz Ryszard Mroczek and Joanna Kostecka
C
E
C
E
180
160
140
120
100
80
60
40
20
0
[ind.] 40
35
30
25
20
15
10
5
0
[g]
1 day 1 day22 day 22 day43 day 43 day64 day 64 day
Number of earthworm [ind.] Biomas of earthworm [g]
Fig. 1. Dynamics of the changing number and biomass of earthworm in the populations during the period of
the experiment (ind. � SD); C – control; E – experimental group
the populations (Tables 2 and 3), although the number and mass of cocoons produced in
the substrate supplemented with saponins were slightly higher. This may have been
caused by a modified life strategy adopted by the more actively reproducing population
staying in the substrates with saponins and the resulting greater loss of mass in the
earthworms multiplying in slightly higher numbers in the experimental containers.
The experiment made it possible to successfully utilize biodegradable waste mixed at
the ratio of 1:1:1, ie: swine manure (code 02 01 06), selected organic kitchen refuse
(20 01 08) and waste cellulose (03 03 08), whose improper storage and utilization may
lead not only to loss of fertilizing components but also to hazards such as spreading
diseases and pollution of ground water and air.
According to projections included in the National Waste Management Plan 2014
(KPGO) [19], the amount of waste generated by agriculture, fruit farming and
hydroponic crops and other biodegradable waste other than municipal waste classified
in group 02, will increase from 6,052 thousand Mg in 2011 to 6900 thousand Mg in
2022. In the case of municipal organic waste KPGO predicts an increase from 6,088
thousand Mg in 2011 to 7,761 thousand Mg in 2022. An equally significant increase is
expected for cellulose pulp, as a component of the group of waste with 03 code, which
will grow from 3,028 thousand Mg to 3,444 thousand Mg in the period from 2011 to
2022.
Monitoring of existing waste management in rural areas, particularly related to
municipal waste, including biodegradable waste (code 20 01), shows that the situation is
becoming similar to that existing in urban areas.
In accordance with the objectives envisaged by KPGO (2014) (* provide organized
municipal waste collection schemes for 100 % of the population by 2015, at the latest;
** ensure that services under selective waste collection schemes are provided to all
inhabitants by 2015, at the latest; *** reduce quantities of municipal biodegradable
waste deposited at landfills, so that by 2013 the amount of waste deposited at landfills
does not exceed 50 % and by 2020 it is no more than 35 % of the volume of waste
generated this way in 1995), the long-term road towards the strategy for building
a national waste management system is equivalent to achieving compliance with the
principles of sustainability.
Similar objectives are imposed on decision makers and citizens by the current Act on
waste, which strictly implements the EU directive 2008/98/EC on waste. The Act of 14
December 2012 on waste [20] replaces the previously binding Act of 27 April 2001 on
waste (consolidated text: Journal of Laws, 2010, No 185, item 1243, as amended) and
became effective on 23 January 2013.
Recycling and organic recycling are very significant components of sustainable
waste management systems. Organic recycling is understood as treatment of bio-
degradable waste by means of aerobic (eg composting) or anaerobic (fermentation)
processes conducted in controlled conditions using microorganisms. As a result of
composting one can obtain fertilizers which have significant content of crop nutrients
and are currently in high demand. Approval of composts for commercial use is strictly
regulated by applicable laws.
Effect of Saponin Extract on Vermicomposting of Selected Organic Waste 1347
Trends and perspectives for municipal waste composting systems have been
discussed eg by Goscinski [21], who described both simple compost heaps located on
the ground and complex bioreactors utilizing municipal waste in large cities. Potential
applications and the importance of vermicomposting to be used for biodegradable waste
treatment under community waste management programmes have been outlined by
Kasprzak [22] and Bozym [23] while other studies have demonstrated that vermi-
composting is an effective method of neutralizing both farmyard manure [24–26],
organic kitchen refuse [27, 28] and cellulose [13, 15].
It should be emphasized that the process of neutralization carried out for 64 days
using quantities described in the methodology, where swine manure was supplemented
with kitchen refuse and cellulose, was successful both in the control group and in the
containers with added contents of saponin extract. The vermicomposts produced had
visibly different organoleptic properties; unlike the input material they had uniform
crumb structure, dark colour, and had no unpleasant smell.
Chemical composition of vermicomposts based on mixtures of selected organic
materials with and without saponin extract is shown in Table 4.
Table 4
The content of selected elements in vermicomposts produced (mean � SD)
SpecificationVermicomposts
Control (C) With saponin extract (E)
Carbon
[g � kg–1]
241.9 � 30.1 279.7 � 22.8
Nitrogen 71.524 � 14.322 75.322 � 15.834
Phosphorus 2.150 � 0.487 2.151 � 0.850
Potassium
[mg � g–1]
3.107 � 0.517 3.707 � 0.323
Sodium 0.384* � 0.094* 0.220* � 0.085*
Calcium 47.214* � 2.899 * 38.783* � 2.608 *
Magnesium 1.669 � 0.181 1.471 � 0.117
Iron 13.526 � 1.692 13.770 � 1.411
Copper 0.025* � 0.004* 0.015* � 0.001*
Zinc 0.036* � 0.004* 0.028* � 0.002*
Manganese 0.263 � 0.020 0.266 � 0.015
Lead 0.018 � 0.002 0.016 � 0.008
* Differences statistically significant at � = 0.05.
The most pronounced differences between these vermicomposts were found in the
content of calcium (8.43 mg � g–1� 5.57), sodium (0.16 mg � g–1
� 0.04), copper
(0.01 mg � g–1� 0.004) and zinc (0.008 mg � g–1
� 0.005). They were confirmed
statistically (p � 0.05). In the case of the remaining mineral elements the differences
between the experimental and control group were much smaller and statistically
insignificant.
Kostecka and Paczka [29] conducted another experiment in which the same mixture
of organic kitchen refuse was used and the chemical composition of the vermicomposts
differed depending on the applied technology of vermicomposting. Significantly higher
1348 Janusz Ryszard Mroczek and Joanna Kostecka
contents of nitrate nitrogen NO3-N (differences of value 558 g � dm–3), assimilable
phosphorus (of 195 g � dm–3), potassium (of 710 g � dm–3), magnesium (of 170 g � dm–3)
and calcium (of 166 g � dm–3) were found when, in accordance with the applied
technology, the substrate and the earthworm populations were not frequently divided.
On the other hand the method based on frequent division of the substrate and earthworm
populations promoted reduction of NaCl contents in vermicompost.
Vermicomposts obtained by Kostecka and Kolodziej [25], based on cattle manure
had extremely high contents of nutrients. In that case the vermicomposting process
contributed to increased contents of nitrogen and total phosphorus, in comparison with
their average contents observed in cattle manure. By contrast, Gasior et al [24] reported
that the contents of most elements in vermicompost based on swine manure was similar
to those found in cattle and sheep manure vermicomposts.
As a conclusion, taking into account other studies [30–32], it can be assumed that
products of vermicomposting process are characterized by high contents of nitrogen and
other nutrient elements used by plants, therefore they can be applied for purposes
related to crop cultivation. The speed of producing vermicompost from waste depends
on the nature of waste materials, and their fraction in addition to the earthworm species
and concentration [33].
Conclusion
1. The study has shown that addition of saponin extract to waste participating in the
vermicomposting process did not impact the size and mass of earthworm (E. fetida)
populations, yet it negatively modified mature specimens in terms of their mass. Their
reproduction was not affected for the duration of the experiment.
2. Addition of saponin extract to the mixture of waste used for vermicomposting
process did not impact the contents of nitrogen, phosphorus, potassium, iron, and
manganese, but it promoted reduced contents of sodium, calcium, copper and zinc in the
fertilizers obtained.
References
[1] Mroczek JR. In¿ Ekol. 2010;22:63-70.
[2] Bartecki P, Tymczyna L. Przegl Hodowl. 2005;3:27-31.
[3] Mroczek JR. Hazards for the Natural Environment Originating from Intensive Animal Production. In:
Practical applications of environmental research. Kostecka J, Kaniuczak J, editors. Nauka dla
Gospodarki. 2012;3:115-124,
http://www.univ.rzeszow.pl/wydzialy/biologiczno-rolniczy/monografie-wydzialowe.
[4] Pawlak J. Probl In¿ Roln. 2008;4:85-91.
[5] Szymañska E. Zesz Nauk AR we Wroc³awiu LXXXVII, Rolnictwo. 2006;540:531-535.
[6] Vidal C. A high-performance pigment industry with an environmental impact. Statistics in focus.
European Communities. 2002;5:1-7.
[7] Cheeke PR. J Animal Sci. 2000;77:1-10.
[8] Lessire M, Etienne M. Biul Pol Zwi¹zku Producent Pasz. 2007;1:19-24.
[9] Stefanowicz-Hajduk JR. Ochocka R. Post Fitoterapii. 2006;1:36-40.
[10] Mroczek JR. ¯ycie Weterynaryjne. 2011;1:47-48.
[11] Kostecka J, P³ytycz B, Mazur-P¹czka A, Podolak-Machowska A. Soil Fauna in Biomonitoring of the
Environment. In: Practical applications of environmental research. Nauka dla gospodarki. Kostecka J,
Effect of Saponin Extract on Vermicomposting of Selected Organic Waste 1349
Kaniuczak J, editors. 2012;3:303-322, http://www.univ.rzeszow.pl/wydzialy/biologiczno-rolniczy/mo-
nografie-wydzialowe.
[12] Kostecka J. Selected aspects of the significance of earthworms in the context of sustainable waste
management. In: Contemporary problems of management and environmental protection. S¹dej W,
editor. Sevages and waste materials in environment, Olsztyn. 2009:153-170.
[13] Kostecka J, Mazur A, Górecki W. Zesz Nauk PTIE i PTG Oddz w Rzeszowie. 2010;12:35-40,
http://www2.univ.rzeszow.pl/wbr/zeszyty/pl/index.html.
[14] Adi AJ, Noor ZM. Bioresource Technol. 2009;100:1027-1030.
[15] Butt KR. Bioresource Technol. 1993;44:105-107.
[16] Ceccanti B, Masciandaro G. BioCycle. 1999;40(6):71-72.
[17] Nair J, Okamitsu K. Waste Manage. 2010;30:977-982.
[18] Seenappa SN, Rao J, Kale R. Journal of IAEM. 1995;22(1):244-246.
[19] Krajowy plan gospodarki odpadami 2014. Monitor Polski, 2010, nr 101, poz 1183,
http://dokumenty.rcl.gov.pl/M2010101118301.pdf.
[20] Ustawa z dnia 14 grudnia 2012 roku o odpadach. DzU 2013, nr 0, poz 21.
[21] Goœciñski J. Przegl Komunalny. 2007;1:58-60.
[22] Kasprzak K. Kompostowanie w programach gospodarki odpadami w gminie – potencjalny udzia³ i zna-
czenie wermikultur. In: Mat konf nauk „Ekologiczne i gospodarcze znaczenie d¿d¿ownic”, Rzeszów.
Zesz Nauk AR w Krakowie. 2001;75:13-22.
[23] Bo¿ym M. Prace Instytutu Ceramiki i Materia³ów Budowlanych. 2012;10:335-349.
[24] G¹sior J, Kaniuczak J, Kostecka J. Sk³ad chemiczny wermikompostów z obornika bydlêcego, owczego
i trzody chlewnej. In: Mat konf nauk „Ekologiczne i gospodarcze znaczenie d¿d¿ownic”, Rzeszów. Zesz
Nauk AR w Krakowie. 1998;58:143-148.
[25] Kostecka J, Ko³odziej M. Post Nauk Roln. 1995;2:35-45.
[26] Zaj¹c J. Roczn Nauk Zootechniki. 2002;2:161-173.
[27] Kostecka J, P¹czka G. Ecol Chem Eng A. 2011;18(12):1683-1689.
[28] Kostecka J, Garczyñska M. Ecol Chem Eng A. 2011;18(19-10):1263-1270.
[29] Kostecka J, Garczyñska M, Paczka G, Mroczek JR. Contemporary Problems of Management and
Environmental Protection “Some Aspects of Environmental Impact of Waste Dumps”.
2011;9(ch 10):143-156.
[30] Boruszko D. Roczniki Ochr Œrodow. 2001;13:1417-1428.
[31] P¹czka G, Kostecka J. J Ecol Eng. 2013;14(2):49-53. DOI:10.5604/2081139X.1043183.
[32] Wac³owicz R, Zimny L, Kuc P. Post Ochr Roœlin. 2011;51(4):1716-1719.
[33] Dominguez J, Aira M, Gomez-Brandon M. Vermicomposting: earthworms enhance the work of
microbes. In: Microbes at work: from wastes to resources. Insam H, Franke-Whittle I, Goberna M,
editors. Berlin, Heildelberg: Springer-Verlag; 2010:93-114.
DOI: 10.1371/journal.pone.0016354.
WP£YW EKSTRAKTU SAPONINOWEGO NA WERMIKOMPOSTOWANIE
WYBRANYCH ODPADÓW ORGANICZNYCH
Katedra Biologicznych Podstaw Rolnictwa i Edukacji Œrodowiskowej
Uniwersytet Rzeszowski
Abstrakt: Wermikompostowanie odchodów zwierzêcych i organicznych odpadów kuchennych stanowi jeden
ze sposobów ich utylizacji. Celem badañ by³o okreœlenie wp³ywu ekstraktu saponinowego na cechy d¿d¿ow-
nic E. fetida u¿ytych do wermikompostowania obornika od trzody chlewnej z dodatkiem organicznych
odpadów kuchennych i celulozy oraz na sk³ad chemiczny wyprodukowanych wermikompostów. W okresie
prowadzonych badañ, ekstrakt z Quillaja saponaria dodany do odpadów nie wp³yn¹³ na liczebnoœæ, masê
populacji i rozmna¿anie d¿d¿ownic, ale modyfikowa³ niekorzystnie masê osobników dojrza³ych. Sk³ad
uzyskanych wermikompostów by³ zró¿nicowany. Istotne ró¿nice wykazano w zawartoœci sodu, wapnia,
miedzi i cynku.
S³owa kluczowe: obornik od trzody chlewnej, organiczne odpady kuchenne, celuloza, Eisenia fetida (Sav.),
saponiny, wermikompost
1350 Janusz Ryszard Mroczek and Joanna Kostecka
Barbara FILIPEK-MAZUR1, Andrzej LEPIARCZYK2
and Monika TABAK1*
NITROGEN AND SULPHUR FERTILIZATION
ON YIELDING AND ZINC CONTENT
IN SEEDS OF WINTER RAPE ‘BALDUR’ CULTIVAR
WP£YW NAWO¯ENIA AZOTEM I SIARK¥
NA PLONOWANIE I ZAWARTOή CYNKU
W NASIONACH RZEPAKU OZIMEGO ODMIANY ‘BALDUR’
Abstract: The research was conducted in order to determine the yield of winter rape seeds and zinc content in
seeds as a result of fertilization with different doses of nitrogen and sulphur. A three-year field experiment
was conducted according to the following scheme (9 treatments): 1. control – without fertilization; 2–4.
nitrogen fertilization with doses of 134, 180, and 225 kgN � ha–1 in the form of ammonium nitrate (34 % N);
5–7. nitrogen fertilization with doses of 134, 180, and 225 kgN � ha–1 in the form of Saletrosan 26 Makro
(26 % N and 13 % S); 8. sulphur fertilization with a dose of 60 kgS � ha–1 in the form of Saletrosan 26 Makro
along with nitrogen complementation with ammonium nitrate to a dose of 180 kgN � ha–1; 9. sulphur
fertilization with a dose of 60 kgS � ha–1 in the form of Saletrosan 26 Makro along with nitrogen
complementation with ammonium nitrate to a dose of 225 kgN � ha–1. Sulphur application led to an increase in
the yield of rape seeds and seed zinc content (and, as a result, also in the element uptake with yield), in
comparison with the yield and zinc content in seeds collected from treatments without sulphur application.
Keywords: zinc, nitrogen fertilization, sulphur fertilization
Introduction
Optimal growth and development of cultivated plants requires access to indispens-
able macronutrients and microelements. Winter rape has high nutrient requirements,
mainly for nitrogen and sulphur [1, 2]. It is cultivated, above all, as raw material for oil
DOI: 10.2428/ecea.2013.20(11)123 ECOL CHEM ENG A. 2013;20(11):1351-1358
1 Department of Agricultural and Environmental Chemistry, University of Agriculture in Krakow,
al. A. Mickiewicza 21, 31–120 Kraków, Poland, phone: +48 12 662 4344, fax: +48 12 662 4341, email:
2 Department of Agrotechnology and Agricultural Ecology, University of Agriculture in Krakow,
al. A. Mickiewicza 21, 31–120 Kraków, Poland, phone: +48 12 662 4364, fax: +48 12 662 4366, email:
* Corresponding author: [email protected]
production, and the obtained waste products (extracted meal, oil cake, pomace) are used
in animal feeding. In connection with the introduction of cultivars of double improved
rape to cultivation as well as the introduction of changes in the technological process of
acquisition of oil, it is intended to monitor changes in the level of mineral components
in seeds of this plant. Zinc, which is a component of many enzymes and which is
responsible for forming chelate bonds between enzyme and substrate, is one of micro-
elements indispensable for proper development of plants [3, 4]. What is more, zinc parti-
cipates in transformations of carbohydrates, proteins and phosphates [4]. Optimum zinc
content in rape seeds is important when using them as a seed material, because this element
is extremely important for proper plant growth in the first developmental stages [5, 6].
The aim of the research was to evaluate what effect nitrogen and sulphur, used in
various doses, have on the yield and zinc content in winter rape, ‘Baldur’ cultivar, seeds.
Material and methods
The field experiment was conducted in the years 2009–2012 at the Experimental
Station of the Department of Agrotechnology and Agricultural Ecology of the
University of Agriculture in Krakow-Mydlniki. Brown earth soil, type – Luvisol,
subtype – Stagnic Luvisol, textural group – silt, genus – formed from loess, is ranked
among good wheat complex. Each year, spring barley was the forecrop for the double
improved hybrid (Baldur) cultivar of rape.
Pre-sowing phosphorus fertilization in the form of superphosphate (40 % P2O5)
amounted to 100 kgP2O5 � ha–1, and potassium fertilization in the form of potassium salt
(60 % K2O) amounted to 198 kgK2O � ha–1. Doses of nitrogenous fertilizers, including
the ones containing sulphur, were used according to the experiment scheme that
included the following treatments: 1. control – without fertilization; 2–4. nitrogen
fertilization in doses 134, 180, and 225 kgN � ha–1 in the form of ammonium nitrate
(34 % N); 5–7 nitrogen fertilization in doses 134, 180, and 225 kgN � ha–1 in the form of
Saletrosan 26 Makro (26 % N and 13 % S; this fertilizer is a mixture of ammonium
nitrate and ammonium sulphate); 8. sulphur fertilization in a dose of 60 kgS � ha–1 in the
form of Saletrosan 26 Makro complemented with nitrogen (ammonium nitrate) to a
dose of 180 kgN � ha–1; 9. sulphur fertilization in a dose of 60 kgS � ha–1 in the form of
Saletrosan 26 Makro complemented with nitrogen (ammonium nitrate) to a dose of 225
kgN � ha–1. Nitrogen in doses 134 kgN � ha–1 and 180 kgN � ha–1 was used three times,
and in a dose of 225 kgN � ha–1 it was used four times. Each year in autumn, a starting
dose of 30 kgN � ha–1 was applied to all the fertilization treatments, except the control
(without fertilization).
The experiment was set up using the method of random blocks in 4 replications, and
the area of each plot was 28 m2 (15 m2 for harvest).
Total precipitation in the period from sowing to inhibition of vegetation (VIII–XI)
was between 119 mm in the season 2011/2012 and 281 mm in the season 2010/2011
(Table 1), and it was higher than the optimal total precipitation for rape in this period [7].
During the period of winter rest (XII–III), total precipitation was less diversified and
it was between 93 mm in the season 2010/2011 and 143 mm in the season 2009/2010.
1352 Barbara Filipek-Mazur et al
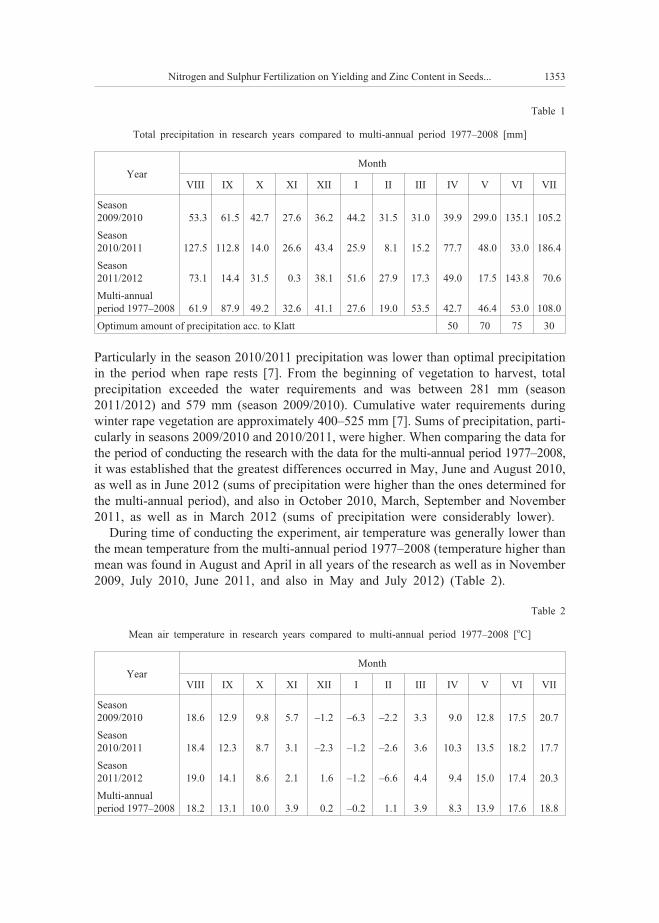
Table 1
Total precipitation in research years compared to multi-annual period 1977–2008 [mm]
YearMonth
VIII IX X XI XII I II III IV V VI VII
Season
2009/2010 53.3 61.5 42.7 27.6 36.2 44.2 31.5 31.0 39.9 299.0 135.1 105.2
Season
2010/2011 127.5 112.8 14.0 26.6 43.4 25.9 8.1 15.2 77.7 48.0 33.0 186.4
Season
2011/2012 73.1 14.4 31.5 0.3 38.1 51.6 27.9 17.3 49.0 17.5 143.8 70.6
Multi-annual
period 1977–2008 61.9 87.9 49.2 32.6 41.1 27.6 19.0 53.5 42.7 46.4 53.0 108.0
Optimum amount of precipitation acc. to Klatt 50 70 75 30
Particularly in the season 2010/2011 precipitation was lower than optimal precipitation
in the period when rape rests [7]. From the beginning of vegetation to harvest, total
precipitation exceeded the water requirements and was between 281 mm (season
2011/2012) and 579 mm (season 2009/2010). Cumulative water requirements during
winter rape vegetation are approximately 400–525 mm [7]. Sums of precipitation, parti-
cularly in seasons 2009/2010 and 2010/2011, were higher. When comparing the data for
the period of conducting the research with the data for the multi-annual period 1977–2008,
it was established that the greatest differences occurred in May, June and August 2010,
as well as in June 2012 (sums of precipitation were higher than the ones determined for
the multi-annual period), and also in October 2010, March, September and November
2011, as well as in March 2012 (sums of precipitation were considerably lower).
During time of conducting the experiment, air temperature was generally lower than
the mean temperature from the multi-annual period 1977–2008 (temperature higher than
mean was found in August and April in all years of the research as well as in November
2009, July 2010, June 2011, and also in May and July 2012) (Table 2).
Table 2
Mean air temperature in research years compared to multi-annual period 1977–2008 [oC]
YearMonth
VIII IX X XI XII I II III IV V VI VII
Season
2009/2010 18.6 12.9 9.8 5.7 –1.2 –6.3 –2.2 3.3 9.0 12.8 17.5 20.7
Season
2010/2011 18.4 12.3 8.7 3.1 –2.3 –1.2 –2.6 3.6 10.3 13.5 18.2 17.7
Season
2011/2012 19.0 14.1 8.6 2.1 –1.6 –1.2 –6.6 4.4 9.4 15.0 17.4 20.3
Multi-annual
period 1977–2008 18.2 13.1 10.0 3.9 –0.2 –0.2 –1.1 3.9 8.3 13.9 17.6 18.8
Nitrogen and Sulphur Fertilization on Yielding and Zinc Content in Seeds... 1353
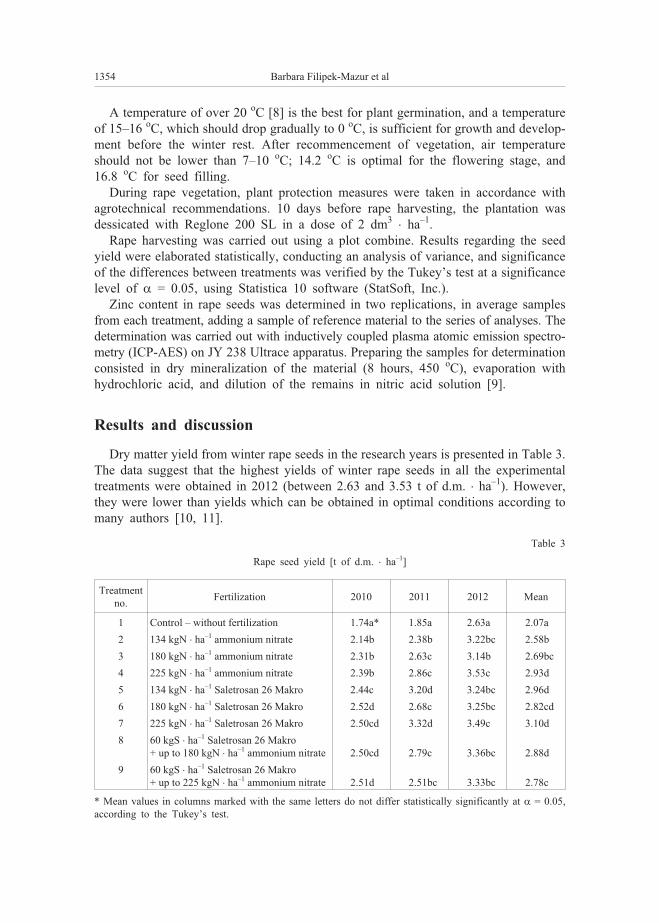
A temperature of over 20 oC [8] is the best for plant germination, and a temperature
of 15–16 oC, which should drop gradually to 0 oC, is sufficient for growth and develop-
ment before the winter rest. After recommencement of vegetation, air temperature
should not be lower than 7–10 oC; 14.2 oC is optimal for the flowering stage, and
16.8 oC for seed filling.
During rape vegetation, plant protection measures were taken in accordance with
agrotechnical recommendations. 10 days before rape harvesting, the plantation was
dessicated with Reglone 200 SL in a dose of 2 dm3� ha–1.
Rape harvesting was carried out using a plot combine. Results regarding the seed
yield were elaborated statistically, conducting an analysis of variance, and significance
of the differences between treatments was verified by the Tukey’s test at a significance
level of � = 0.05, using Statistica 10 software (StatSoft, Inc.).
Zinc content in rape seeds was determined in two replications, in average samples
from each treatment, adding a sample of reference material to the series of analyses. The
determination was carried out with inductively coupled plasma atomic emission spectro-
metry (ICP-AES) on JY 238 Ultrace apparatus. Preparing the samples for determination
consisted in dry mineralization of the material (8 hours, 450 oC), evaporation with
hydrochloric acid, and dilution of the remains in nitric acid solution [9].
Results and discussion
Dry matter yield from winter rape seeds in the research years is presented in Table 3.
The data suggest that the highest yields of winter rape seeds in all the experimental
treatments were obtained in 2012 (between 2.63 and 3.53 t of d.m. � ha–1). However,
they were lower than yields which can be obtained in optimal conditions according to
many authors [10, 11].
Table 3
Rape seed yield [t of d.m. � ha–1]
Treatment
no.Fertilization 2010 2011 2012 Mean
1 Control – without fertilization 1.74a* 1.85a 2.63a 2.07a
2 134 kgN � ha–1 ammonium nitrate 2.14b 2.38b 3.22bc 2.58b
3 180 kgN � ha–1 ammonium nitrate 2.31b 2.63c 3.14b 2.69bc
4 225 kgN � ha–1 ammonium nitrate 2.39b 2.86c 3.53c 2.93d
5 134 kgN � ha–1 Saletrosan 26 Makro 2.44c 3.20d 3.24bc 2.96d
6 180 kgN � ha–1 Saletrosan 26 Makro 2.52d 2.68c 3.25bc 2.82cd
7 225 kgN � ha–1 Saletrosan 26 Makro 2.50cd 3.32d 3.49c 3.10d
8 60 kgS � ha–1 Saletrosan 26 Makro
+ up to 180 kgN � ha–1 ammonium nitrate 2.50cd 2.79c 3.36bc 2.88d
9 60 kgS � ha–1 Saletrosan 26 Makro
+ up to 225 kgN � ha–1 ammonium nitrate 2.51d 2.51bc 3.33bc 2.78c
* Mean values in columns marked with the same letters do not differ statistically significantly at � = 0.05,
according to the Tukey’s test.
1354 Barbara Filipek-Mazur et al
Lower yields are caused mainly by the course of weather conditions during winter
rape vegetation. It can be inferred from the amount and distribution of precipitation
(Table 1) as well as the height of temperature (Table 2) during vegetation, which were
most favorable for development of this species in the season 2011/2012 in comparison
to the season 2009/2010 that was the least suitable.
In all years of the research, the lowest, significantly proven yields of rape seeds were
found in the treatment without fertilization. On the other hand, fertilization of winter
rape with various doses of nitrogen without sulphur in 2010 did not cause significant
diversification of dry matter yield of seeds, whereas in the years 2011–2012 a tendency
to a higher yield in the treatments with a higher nitrogen dose was found. In comparison
with the yield from treatments fertilized with nitrogen without sulphur, introduction of
this element along with Saletrosan 26 Makro resulted in an increase in mass of rape
seeds, particularly in the years 2010 and 2011. Based on the amount of dry matter yield
of rape seeds it was established that in order to satisfy plant demand for nitrogen it is
better to use Saletrosan 26 Makro than ammonium nitrate.
There is no uniform position in the available literature regarding the effect of
nitrogen and sulphur doses on the amount of rape seed yield. Wielebski and Wojtowicz
[12] did not show that increase in sulphur doses had an effect on rape seed yield,
whereas Sattar et al [13] established that the amount of yield increased along with the
increase in nitrogen and sulphur doses. Wielebski [14] determined that rape seed yield
increases under the influence of sulphur fertilization only in the case of a low content of
the element in soil, whereas in conditions where plants have optimum supply of this
element there is no effect of yield increase. On the basis of the own research it can be
stated that nitrogen together with sulphur had a beneficial effect on the mean yield of
dry matter from rape seeds from 3 years of the research, although differences among the
treatments were not always statistically significant (Table 3). The seed yield from plants
fertilized with Saletrosan 26 Makro in the smallest dose (134 kgN � ha–1 and 67
kgS � ha–1) was by 15 % higher than the seed yield from plants fertilized only with
ammonium nitrate in which the same dose of nitrogen was introduced. At the same
time, this yield, at a dose of 225 kgN � ha–1 in the form of ammonium nitrate was in the
same homogenous group as in the case of fertilization with 134 and 225 N � ha–1 applied
in the form of Saletrosan 26 Makro, as well as with 60 kgS in the form of Saletrosan 26
Makro + 180 kgN in the form of ammonium nitrate.
Depending on the fertilization treatment, weighted mean of zinc content was within a
range from 37.4 to 42.9 mgZn � kg–1 of d.m. (Table 4). These values are in accordance
with the ones given by Banaszkiewicz [15] and Filipek and Harasim [16].
The zinc content in rape seeds in no treatment exceed the permissible value for rape
intended for consumption or fodder, which is, respectively 50 mgZn and 100
mgZn � kg–1 of d.m. [17]. In own research, the highest zinc contents were found in rape
seeds from treatments in which nitrogen and sulphur fertilization was used in doses 180
and 225 kgN � ha–1, as well as 90 and 112.5 kgS � ha–1. Such dependence occurred
particularly in 2010 and 2011 (moreover, in 2011, sulphur fertilization in a dose of 60
kgS � ha–1 and nitrogen fertilization in a dose of 180 and 225 kgN � ha–1 had similar
effect), and also in the case of mean values from 3 years.
Nitrogen and Sulphur Fertilization on Yielding and Zinc Content in Seeds... 1355
Table 4
Zinc content in dry matter of rape seeds [mgZn � kg–1 of d.m.]
Treatment
no.Fertilization 2010 2011 2012
Weighted
mean
1 Control – without fertilization 49.9 24.8 38.9 37.78
2 134 kgN � ha–1 ammonium nitrate 48.5 28.0 37.0 37.41
3 180 kgN � ha–1 ammonium nitrate 53.4 30.4 38.9 40.28
4 225 kgN � ha–1 ammonium nitrate 53.2 31.5 37.3 39.74
5 134 kgN � ha–1 Saletrosan 26 Makro 50.9 30.0 38.6 38.88
6 180 kgN � ha–1 Saletrosan 26 Makro 56.9 34.2 36.2 41.74
7 225 kgN � ha–1 Saletrosan 26 Makro 58.0 35.5 39.2 42.93
8 60 kgS � ha–1 Saletrosan 26 Makro
+ up to 180 kgN � ha–1 ammonium nitrate 51.9 34.1 37.3 40.49
9 60 kgS � ha–1 Saletrosan 26 Makro
+ up to 225 kgN � ha–1 ammonium nitrate 51.8 35.7 38.0 41.46
Similarly to own research, Kozlowska-Strawska [18] showed that rape plants
fertilized with sulphur, particularly in sulphatic form, had the highest zinc content. In
own research, sulphur was introduced to soil along with the Saletrosan 26 Makro
fertilizer in the form of ammonium sulphate. In this context, the significance of soil
reaction in the uptake of zinc by rape cannot be excluded.
Zinc amount uptaken along with dry matter yield from rape seeds is presented in
Fig. 1. Since this amount is a product of seed yield mass and zinc content in it, the
1356 Barbara Filipek-Mazur et al
450
400
350
300
250
200
150
100
50
0
[gZ
nha
]�
–1
1* 2 3 4 5 6 7 8 9
Number of treatment
2012
2011
2010
Fig. 1. Zinc amount [g Zn � ha–1] uptaken along with dry matter yield from rape seeds: * 1. Control – without
fertilization; 2–4. 134, 180 and 225 kgN � ha–1 in the form of ammonium nitrate, respectively; 5–7.
134, 180 and 225 kgN � ha–1 in the form of Saletrosan 26 Makro, respectively; 8. 60 kgS � ha–1 in the
form of Saletrosan 26 Makro complemented with nitrogen (ammonium nitrate) to a dose of 180
kgN � ha–1; 9. 60 kgS � ha–1 in the form of Saletrosan 26 Makro complemented with nitrogen
(ammonium nitrate) to a dose of 225 kgN � ha–1
differences among the research years are in accordance with the diversity in yielding
and in the content of the component in yield. In the period of the experiment, rape from
the non-fertilized soil took up the least zinc. At the same time, uptake of zinc with seed
yield from plants fertilized with nitrogen with an addition of sulphur was higher than
from plants fertilized only with nitrogen.
Rape is a plant that is relatively tolerant to zinc deficiency, but for proper growth and
development this element is indispensable. Physiological role of zinc is connected with
its function as an enzyme activator, particularly the ones participating in carbohydrate
transformations and in synthesis of proteins. What is more, zinc guarantees a high level
of protein in rape seeds [19], which is particularly important when the plants are
intended for consumption or fodder.
Conclusions
1. The yields of rape seeds varied between the research years due to differences in
weather conditions.
2. Application of sulphur in the fertilization contributed to an increase in the rape
seed yields in comparison to yields from treatments without sulphur participation.
3. As a rule, the highest sulphur contents were determined in rape seeds from
treatments where nitrogen and sulphur fertilization was used.
4. Uptake of zinc with seed yield from plants fertilized with nitrogen with an addition
of sulphur was higher than from plants fertilized only with nitrogen.
Acknowledgements
The research was financed by the science fund of the Polish Ministry of Science and Higher Education, as
a research project No. 3101.
References
[1] Ho³ubowicz-Kliza G. Technologia uprawy rzepaku. Instrukcja upowszechnieniowa nr 171. Pu³awy:
Wyd IUNG-PIB; 2010.
[2] Pepó P. Acta Agron Hung. 2013;61(3):195-205. DOI: 10.1556/AAgr.61.2013.3.3.
[3] Andreini C, Bertini I. J Inorg Biochem. 2012;111:150-156. DOI: 10.1016/j.jinorgbio.2011.11.020.
[4] Kopcewicz J, Lewak S. Fizjologia roœlin. Warszawa: Wyd Nauk PWN; 2002.
[5] Grewal HS, Graham RD. Plant Soil. 1997;192:191-197.
[6] Pandey N, Pathak GCh, Sharma ChP. J Trace Elem Med Biol. 2006;20:89-96.
DOI: 10.1016/j.jtemb.2005.09.006.
[7] Dzie¿yc J, Nowak L, Panek K. Zesz Probl Post Nauk Roln. 1987;314:11-33.
[8] Budzyñski W, Zaj¹c T. Roœliny oleiste. Uprawa i zastosowanie. Poznañ: PWRiL; 2010.
[9] Ostrowska A, Gawliñski S, Szczubia³ka Z. Metody analizy i oceny w³aœciwoœci gleb i roœlin. Katalog.
Warszawa: Instytut Ochrony Œrodowiska; 1991.
[10] Rathke GW, Behrens YT, Diepenbrock W. Agric Ecosyst Environ. 2006;117:80-108.
DOI: 10.1016/j.agee.2006.04.006.
[11] Rathke GW, Christen O, Diepenbrock W. Field Crops Res. 2005;94:103-113.
DOI: 10.1016/j.fcr.2004.11.010.
[12] Wielebski F, Wojtowicz M. Roœliny Oleiste. 2003;24(1):109-120.
[13] Sattar A, Cheema MA, Wahid MA, Saleem MF, Hassan M. Crop Environ. 2011;2(1):32-37.
Nitrogen and Sulphur Fertilization on Yielding and Zinc Content in Seeds... 1357
[14] Wielebski F. Roœliny Oleiste. 2008;29(1):91-104.
[15] Banaszkiewicz T. Ecol Chem Eng A. 2008;15(1-2):9-13.
[16] Filipek T, Harasim P. Acta Agrophys 2007;9(3):591-602.
[17] Kabata-Pendias A, Motowicka-Terelak T, Piotrowska M, Terelak H, Witek T. Ocena stopnia zanieczysz-
czenia roœlin metalami ciê¿kimi i siark¹. Ramowe wytyczne dla rolnictwa. Pu³awy: IUNG; 1993.
[18] Koz³owska-Strawska J. Ochr Œrodow Zasob Natur. 2009;40:254-261.
[19] Orlovius K. Fertilizing for high yield and quality. Oilseed rape. International Potash Institute; 2003.
http://ipipotash.org/udocs/No%2016%20Oilseed%20rape.pdf [08.01.2014].
WP£YW NAWO¯ENIA AZOTEM I SIARK¥ NA PLONOWANIE I ZAWARTOŒÆ CYNKU
W NASIONACH RZEPAKU OZIMEGO ODMIANY ‘BALDUR’
1 Katedra Chemii Rolnej i Œrodowiskowej2 Katedra Agrotechniki i Ekologii Rolniczej
Uniwersytet Rolniczy im. Hugona Ko³³¹taja w Krakowie
Abstrakt: Badania wykonano w celu okreœlenia wielkoœci plonu nasion rzepaku ozimego oraz zawartoœci
w nich cynku w efekcie nawo¿enia zró¿nicowanymi dawkami azotu i siarki. Doœwiadczenie polowe prowa-
dzone w latach 2009–2012 obejmowa³o 9 obiektów: 1. kontrola – bez nawo¿enia; 2–4. nawo¿enie azotem
w dawkach 134, 180 i 225 kgN � ha–1 w postaci saletry amonowej (34 % N); 5–7. nawo¿enie azotem
w dawkach 134, 180 i 225 kgN � ha–1 w postaci Saletrosanu 26 Makro (26 % N i 13 % S); 8. nawo¿enie siark¹
w dawce 60 kgS � ha–1 w postaci Saletrosanu 26 Makro uzupe³nione azotem (saletra amonowa) do dawki 180
kgN � ha–1; 9. nawo¿enie siark¹ w dawce 60 kgS � ha–1 w postaci Saletrosanu 26 Makro uzupe³nione azotem
(saletra amonowa) do dawki 225 kgN � ha–1. Wykazano, ¿e zastosowanie siarki prowadzi³o do zwiêkszenia
masy nasion rzepaku i zawartoœci w nich cynku (a w rezultacie tak¿e pobrania tego sk³adnika z plonem),
w porównaniu z plonem i zawartoœci¹ cynku w nasionach zebranych z obiektów bez siarki.
S³owa kluczowe: cynk, nawo¿enie azotem, nawo¿enie siark¹
1358 Barbara Filipek-Mazur et al
Antoni ROGÓ¯1*, Barbara WIŒNIOWSKA-KIELIAN1
and Monika TABAK1
LITHIUM CONTENT
IN SELECTED ROOT VEGETABLES
AGAINST ITS CONTENT IN SOIL
ZAWARTOή LITU
W WYBRANYCH WARZYWACH KORZENIOWYCH
NA TLE JEGO ZAWARTOŒCI W GLEBIE
Abstract: In the first half of September 2003, 44 samples of cultivated root vegetables ie carrot, parsley,
celery and beetroot at their consumption maturity, were collected from arable lands in the Miechowski county.
Samples were gathered from the fields of considerable area (0.5–2.0 ha) vegetable cultivation. The collected
plant material was subjected to dry mineralization, ash was dissolved in HNO3 and obtained mineralizat was
analysed. Soil samples were taken from the same locations as vegetables, from the depth of 0–25 cm. Basic
physicochemical properties of the soil samples were determined by means of methods universally applied in
agricultural chemistry. Total lithium content in the soils was determined after mineralization at a temperature
of 450 oC, then digestion with a mixture of acids (HClO4 and HNO3) and dissolving in HCl. Content of this
element soluble forms was determined after extraction with 0.1 mol � dm–3 HCl solution.
The total lithium content in the examined soils varied widely (2.79 to 12.20 mg � kg–1), with a geometric
mean of 7.78 mg � kg–1. The content of the soluble forms of lithium extracted with 0.1 mol � dm–3 HCl solution
varied from 0.057 to 0.251 mg � kg–1, with a geometric mean of 0.119 mgLi � kg–1. It was fund significant
correlation between total lithium content and share of floatable fraction and colloidal clay in studied soils, as
well as between content of soluble lithium forms and share of colloidal clay in soil. The lithium content in the
vegetables varied depending on species and part of the plant. A geometric mean of lithium content in roots
varied from 0.206 mgLi � kg–1 (parsley) to 0.365 mgLi � kg–1 (beetroot). Tops of vegetables contained 3–5
times more lithium than their roots. It was stated, that physicochemical properties of studied soils not
uniformly affected lithium content in vegetables, what demonstrated values of simple correlation coefficients.
Lithium content in roots of all vegetables and tops of beetroot and parsley depended on soluble forms of
lithium content in soil. Moreover, lithium content in carrot roots as well as parsley roots and tops was affected
DOI: 10.2428/ecea.2013.20(11)124 ECOL CHEM ENG A. 2013;20(11):1359-1368
1 Department of Agricultural and Environmental Chemistry, University of Agriculture in Krakow,
al. A. Mickiewicza 21, 31–120 Kraków, Poland, phone: +48 12 662 43 48, fax +48 12 662 43 41, email:
* Corresponding author: [email protected]
by total lithium content in the soil. However, soil reaction had no significant effect on lithium content in
organs of studied root vegetables.
Keywords: root vegetables, soil, lithium content
Introduction
Among trace elements microelements present in the natural environment are crucial
for the correct growth and development of plants, as well as for the proper functioning
of human and animal organisms. Usefulness of some elements (eg lithium) has not been
fully recognized.
Lithium salts are relatively readily soluble in the soil water, therefore this cation is
absorbed by plants proportionately to its concentration in the substratum [1]. The
content and uptake of nutrients, including lithium, are determined by the content and
form of a given element in soil, soil pH value, soil moistness and organic matter
content, but also by heavy metal contents, the temperature and insolation, the kind and
amount of applied mineral fertilizers and pesticides, number and composition of
microflora present in the soil, the species and variety of plants and finally by other
factors [2–6].
Currently, there is a growing interest in possibilities including waste materials of
biological origin to the balance of organic fertilization [7]. These materials may be used
for fertilization of some plants on condition that they do not contain heavy metals, nor
are burdened with sanitary pollutants [8, 9].
Bioavailability of trace elements more or less determines consumptive or fodder
value of agricultural products. Lithium salts are widely used in various industries and by
modern technologies, so they may cause local pollution with this element and therefore
affect plant chemical composition.
The investigations aimed at determining lithium content in root vegetables cultivated
for consumption against its content in soil.
Materials and methods
The subject of investigations was selected root vegetables and soils from under their
cultivation. In the first half of September 2003, 44 samples of cultivated root vegetables
ie carrot, parsley, celery and beetroot at their consumption maturity, were collected
from arable lands in the Miechowski county. Samples were gathered from the fields of
considerable area (0.5–2.0 ha) vegetable cultivation, situated at the distance of more
than 50 m from the main traffic routes. The analysed plant sample was an average of 12
individual ones (ca 1 kg of fresh mass). The collected plant material, after removing
earthy parts, was washed and divided into roots and tops. After drying the examined
samples were crushed and dry-mineralized. The obtained ashes were dissolved in nitric
acid diluted with water (1 : 2, v/v ratio) and obtained solution was analysed.
From the same places as vegetables, soil samples were collected from the depth of
0–25 cm of arable lands. Each soil sample was an average of individual samples
(0.5–1.0 kg of soil). Basic physicochemical properties were determined in the soil
1360 Antoni Rogó¿ et al
material by means of methods universally applied in agricultural chemistry [10].
Analyses comprised: soil texture by aerometric Bouyoucose and Casagrande’s method
in Proszynski’s modification, pH by potentiometer in soil suspension in H2O and in
1 mol � dm–3 KCl solution, and organic carbon content by Tiurin’s method.
Total lithium content in the collected soil samples was assessed after previous
mineralization at 450 oC and subsequent digestion in mineral acids mixture (HClO4 and
HNO3) and dissolving in HCl [11]. The content of soluble forms of lithium was
assessed after extraction with 0.1 mol � dm–3 HCl solution.
Lithium content was assessed in obtained plant and soil mineralizats and soil extracts
by means of ICP AES method on JY 238 Ultrace apparatus.
The obtained results referring to lithium content in soils, plants and physicochemical
soil properties were used for statistical computations, ie arithmetic and geometric
means, standard deviation (SD), relative standard deviation (RSD) and linear correlation
coefficients (r).
Results and discussion
Soil properties
The places of vegetable and soil samples collection were described in the first part of
the paper [12].
The examined soils differed in respect of their texture, pH value, organic carbon
content and the lithium content. pH value, assessed in water suspension fluctuated from
5.14 to 7.64, whereas in 1 mol � dm–3 KCl solution from 4.13 to 7.23. On the five degree
acidification scale (pHKCl), collected soil samples were divided into two groups: 11
samples were acid and slightly acid soils (pHKCl < 6.6 ), whereas 33 samples were
neutral ones (pHKCl � 6.6).
On the basis of texture, collected soil samples were classified to the following
agronomic categories: 5 represented medium soils with floatable particles content from
21 to 35 %, 36 samples were heavy soils with floatable particles content from 35 to
50 % and 3 – very heavy soils with over 50 % of floatable particles.
Total lithium content in the tested soils ranged from 2.79 mg � kg–1 to 12.20
mgLi � kg–1, its geometric mean amounts 7.78 mg � kg–1, and RSD = 27 %. The content
of lithium soluble forms extracted in 1 mol � dm–3 HCl solution ranged from 0.057
mgLi � kg–1 to 0.250 mgLi � kg–1, with geometric mean amounting 0.119 mgLi � kg–1
and RSD = 62 %. The share of these soluble lithium forms in total lithium content
fluctuated from 0.83 to 3.05 %.
Ammari et al [13] revealed that the content of water extracted (soluble) lithium in the
topsoil (0–20 cm) ranged from 0.95 to 1.04 mgLi � kg–1, whereas in 20–40 cm layer from
1.06 to 2.68 mgLi � kg–1 depending on the region situated along the Jordan River valley.
Total content of lithium and its soluble forms extracted with 1 mol � dm–3 HCl
solution in the studied neutral soils (pHKCl � 6.6) was higher than in the acid and
slightly acid ones (pHKCl < 6.6 ) (Table 1).
Lithium Content in Selected Root Vegetables against Its Content in Soil 1361
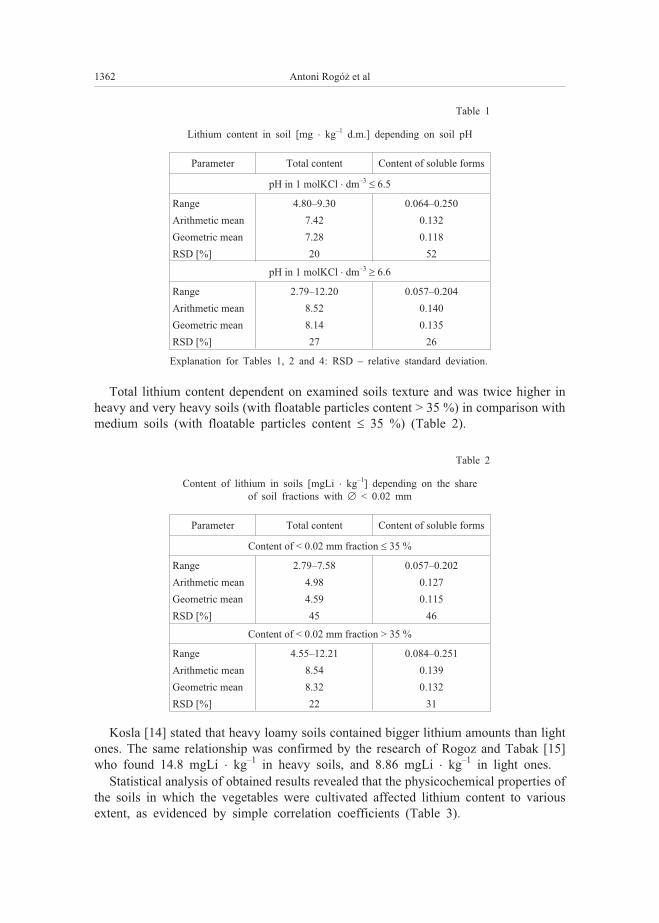
Table 1
Lithium content in soil [mg � kg–1 d.m.] depending on soil pH
Parameter Total content Content of soluble forms
pH in 1 molKCl � dm–3� 6.5
Range 4.80–9.30 0.064–0.250
Arithmetic mean 7.42 0.132
Geometric mean 7.28 0.118
RSD [%] 20 52
pH in 1 molKCl � dm–3� 6.6
Range 2.79–12.20 0.057–0.204
Arithmetic mean 8.52 0.140
Geometric mean 8.14 0.135
RSD [%] 27 26
Explanation for Tables 1, 2 and 4: RSD – relative standard deviation.
Total lithium content dependent on examined soils texture and was twice higher in
heavy and very heavy soils (with floatable particles content > 35 %) in comparison with
medium soils (with floatable particles content � 35 %) (Table 2).
Table 2
Content of lithium in soils [mgLi � kg–1] depending on the share
of soil fractions with � < 0.02 mm
Parameter Total content Content of soluble forms
Content of < 0.02 mm fraction � 35 %
Range 2.79–7.58 0.057–0.202
Arithmetic mean 4.98 0.127
Geometric mean 4.59 0.115
RSD [%] 45 46
Content of < 0.02 mm fraction > 35 %
Range 4.55–12.21 0.084–0.251
Arithmetic mean 8.54 0.139
Geometric mean 8.32 0.132
RSD [%] 22 31
Kosla [14] stated that heavy loamy soils contained bigger lithium amounts than light
ones. The same relationship was confirmed by the research of Rogoz and Tabak [15]
who found 14.8 mgLi � kg–1 in heavy soils, and 8.86 mgLi � kg–1 in light ones.
Statistical analysis of obtained results revealed that the physicochemical properties of
the soils in which the vegetables were cultivated affected lithium content to various
extent, as evidenced by simple correlation coefficients (Table 3).
1362 Antoni Rogó¿ et al
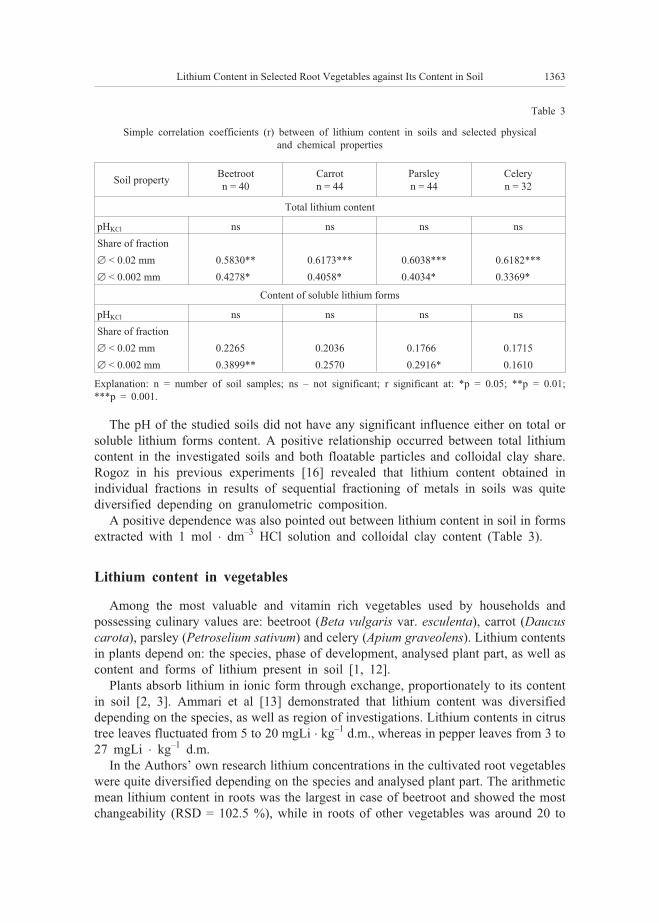
Table 3
Simple correlation coefficients (r) between of lithium content in soils and selected physical
and chemical properties
Soil propertyBeetroot
n = 40
Carrot
n = 44
Parsley
n = 44
Celery
n = 32
Total lithium content
pHKCl ns ns ns ns
Share of fraction
� < 0.02 mm 0.5830** 0.6173*** 0.6038*** 0.6182***
� < 0.002 mm 0.4278** 0.4058*** 0.4034*** 0.3369***
Content of soluble lithium forms
pHKCl ns ns ns ns
Share of fraction
� < 0.02 mm 0.2265** 0.2036 0.1766* 0.1715
� < 0.002 mm 0.3899** 0.2570 0.2916* 0.1610
Explanation: n = number of soil samples; ns – not significant; r significant at: *p = 0.05; **p = 0.01;
***p = 0.001.
The pH of the studied soils did not have any significant influence either on total or
soluble lithium forms content. A positive relationship occurred between total lithium
content in the investigated soils and both floatable particles and colloidal clay share.
Rogoz in his previous experiments [16] revealed that lithium content obtained in
individual fractions in results of sequential fractioning of metals in soils was quite
diversified depending on granulometric composition.
A positive dependence was also pointed out between lithium content in soil in forms
extracted with 1 mol � dm–3 HCl solution and colloidal clay content (Table 3).
Lithium content in vegetables
Among the most valuable and vitamin rich vegetables used by households and
possessing culinary values are: beetroot (Beta vulgaris var. esculenta), carrot (Daucuscarota), parsley (Petroselium sativum) and celery (Apium graveolens). Lithium contents
in plants depend on: the species, phase of development, analysed plant part, as well as
content and forms of lithium present in soil [1, 12].
Plants absorb lithium in ionic form through exchange, proportionately to its content
in soil [2, 3]. Ammari et al [13] demonstrated that lithium content was diversified
depending on the species, as well as region of investigations. Lithium contents in citrus
tree leaves fluctuated from 5 to 20 mgLi � kg–1 d.m., whereas in pepper leaves from 3 to
27 mgLi � kg–1 d.m.
In the Authors’ own research lithium concentrations in the cultivated root vegetables
were quite diversified depending on the species and analysed plant part. The arithmetic
mean lithium content in roots was the largest in case of beetroot and showed the most
changeability (RSD = 102.5 %), while in roots of other vegetables was around 20 to
Lithium Content in Selected Root Vegetables against Its Content in Soil 1363
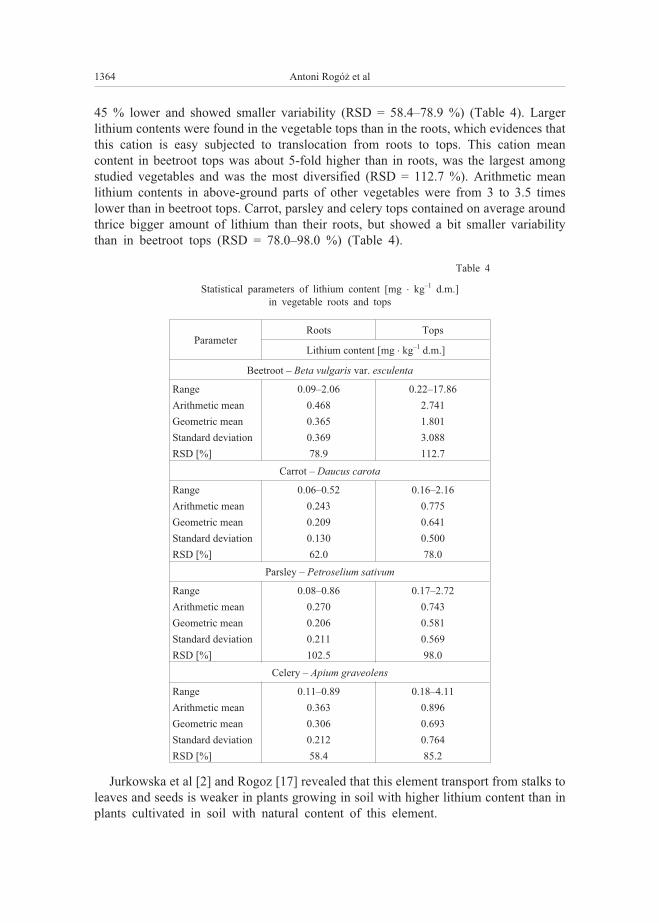
45 % lower and showed smaller variability (RSD = 58.4–78.9 %) (Table 4). Larger
lithium contents were found in the vegetable tops than in the roots, which evidences that
this cation is easy subjected to translocation from roots to tops. This cation mean
content in beetroot tops was about 5-fold higher than in roots, was the largest among
studied vegetables and was the most diversified (RSD = 112.7 %). Arithmetic mean
lithium contents in above-ground parts of other vegetables were from 3 to 3.5 times
lower than in beetroot tops. Carrot, parsley and celery tops contained on average around
thrice bigger amount of lithium than their roots, but showed a bit smaller variability
than in beetroot tops (RSD = 78.0–98.0 %) (Table 4).
Table 4
Statistical parameters of lithium content [mg � kg–1 d.m.]
in vegetable roots and tops
ParameterRoots Tops
Lithium content [mg � kg–1 d.m.]
Beetroot – Beta vulgaris var. esculenta
Range 0.09–2.06 0.22–17.86
Arithmetic mean 0.468 2.741
Geometric mean 0.365 1.801
Standard deviation 0.369 3.088
RSD [%] 78.9 112.7
Carrot – Daucus carota
Range 0.06–0.52 0.16–2.16
Arithmetic mean 0.243 0.775
Geometric mean 0.209 0.641
Standard deviation 0.130 0.500
RSD [%] 62.0 78.0
Parsley – Petroselium sativum
Range 0.08–0.86 0.17–2.72
Arithmetic mean 0.270 0.743
Geometric mean 0.206 0.581
Standard deviation 0.211 0.569
RSD [%] 102.5 98.0
Celery – Apium graveolens
Range 0.11–0.89 0.18–4.11
Arithmetic mean 0.363 0.896
Geometric mean 0.306 0.693
Standard deviation 0.212 0.764
RSD [%] 58.4 85.2
Jurkowska et al [2] and Rogoz [17] revealed that this element transport from stalks to
leaves and seeds is weaker in plants growing in soil with higher lithium content than in
plants cultivated in soil with natural content of this element.
1364 Antoni Rogó¿ et al
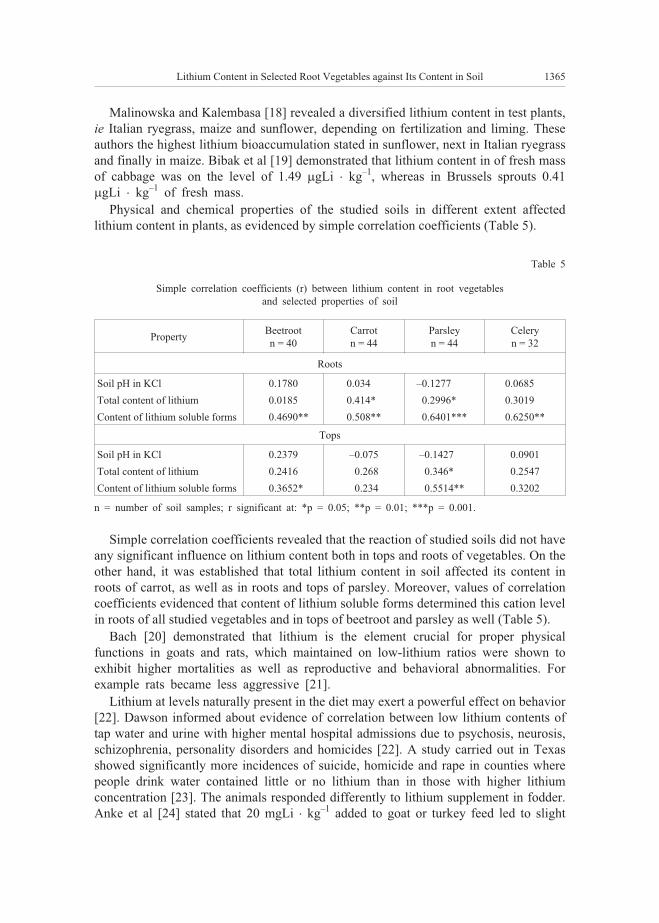
Malinowska and Kalembasa [18] revealed a diversified lithium content in test plants,
ie Italian ryegrass, maize and sunflower, depending on fertilization and liming. These
authors the highest lithium bioaccumulation stated in sunflower, next in Italian ryegrass
and finally in maize. Bibak et al [19] demonstrated that lithium content in of fresh mass
of cabbage was on the level of 1.49 �gLi � kg–1, whereas in Brussels sprouts 0.41
�gLi � kg–1 of fresh mass.
Physical and chemical properties of the studied soils in different extent affected
lithium content in plants, as evidenced by simple correlation coefficients (Table 5).
Table 5
Simple correlation coefficients (r) between lithium content in root vegetables
and selected properties of soil
PropertyBeetroot
n = 40
Carrot
n = 44
Parsley
n = 44
Celery
n = 32
Roots
Soil pH in KCl 0.1780 0.034** –0.1277***– 0.0685**
Total content of lithium 0.0185 0.414** 0.2996*** 0.3019**
Content of lithium soluble forms **0.4690** 0.508** 0.6401*** 0.6250**
Tops
Soil pH in KCl 0.2379 –0.075 –0.1427–** 0.0901
Total content of lithium 0.2416 –0.268 0.346** 0.2547
Content of lithium soluble forms *0.3652* –0.234 0.5514** 0.3202
n = number of soil samples; r significant at: *p = 0.05; **p = 0.01; ***p = 0.001.
Simple correlation coefficients revealed that the reaction of studied soils did not have
any significant influence on lithium content both in tops and roots of vegetables. On the
other hand, it was established that total lithium content in soil affected its content in
roots of carrot, as well as in roots and tops of parsley. Moreover, values of correlation
coefficients evidenced that content of lithium soluble forms determined this cation level
in roots of all studied vegetables and in tops of beetroot and parsley as well (Table 5).
Bach [20] demonstrated that lithium is the element crucial for proper physical
functions in goats and rats, which maintained on low-lithium ratios were shown to
exhibit higher mortalities as well as reproductive and behavioral abnormalities. For
example rats became less aggressive [21].
Lithium at levels naturally present in the diet may exert a powerful effect on behavior
[22]. Dawson informed about evidence of correlation between low lithium contents of
tap water and urine with higher mental hospital admissions due to psychosis, neurosis,
schizophrenia, personality disorders and homicides [22]. A study carried out in Texas
showed significantly more incidences of suicide, homicide and rape in counties where
people drink water contained little or no lithium than in those with higher lithium
concentration [23]. The animals responded differently to lithium supplement in fodder.
Anke et al [24] stated that 20 mgLi � kg–1 added to goat or turkey feed led to slight
Lithium Content in Selected Root Vegetables against Its Content in Soil 1365
changes in its consumption and in body weight gains. Ruminants are more sensitive to
lithium burden than monogastric animals.
As presented Gupta et al [25] there are evidences that lithium plays an important role
during the early fetal development because the high lithium contents were found in the
embryo during the early gestational period. Lithium depletion causes low lithium status
has a negative impact on homeostasis of glucose and insulin sensitivity in diabetic
patients and lithium supplementation may manage this disease [22]. Moreover, 72 % of
diabetic patients had low lithium content in serum, and of control ones only 10 % of
population.
So far there have been few data on lithium content in food products or its
consumption by people available in the literature. For this reason investigation of
lithium content in vegetables is very important and may be useful for elucidation this
issue.
D³ugaszek et al [26] suggested allowable lithium contents in 6 groups of food
products, ie cereals 4.405 mgLi � kg–1, vegetables 2.327 mgLi � kg–1, potatoes 1.305
mgLi � kg–1, dairy products 0.5 mgLi � kg–1 and fish 3.15 mg Li � kg–1. Schrauzer [27]
determined considerable amounts of lithium in yeast Saccharomyces cerevisiae, ie115–400 mgLi � kg–1.
Daily requirement for lithium of an adult weighing 70 kg is 1000 �g, ie 14.4
�g � kg–1 of body weight. D³ugaszek et al [25] demonstrated also that the results
obtained are approximate to results published by Belgian authors. Van Cauwenbergh et
al [28] provided that average daily lithium consumption by a group of students
participating in the investigations fluctuated from 3.9 in Brussels to 12.2 �g � d–1 in
Antwerp and Vilwoorde. Lithium intake ranged from 1.2 to 15.2 �g � d–1, and mean
value for adult amounted 8.6 � 4.6 �g � d–1 and was lower than in other countries. In the
paper are also presented data concerned daily lithium consumption in various countries,
eg Canada 21.6 �g, Germany 182–546 �g and Great Britain 107 �g � d–1. According to
Schrauzer [27] considerable quantities of this element are consumed by the citizens of
China (1560 � 1009 �g � d–1).
Conclusions
1. Lithium content in vegetable roots depended on the species and analysed plant
part. Mean geometric lithium content in beetroot was 0.365 mgLi � kg–1, in the roots of
carrot 0.209 mgLi � kg–1, parsley 0.206 mgLi � kg–1 and celery 0.306 mgLi � kg–1.
Lithium content in the cultivated vegetables was determined by the content and form in
which it occurred in soil.
2. Larger lithium contents were registered in the tops than in roots of the analysed
vegetables, what indicates an easy translocation of this element from roots to
above-ground parts.
3. It was demonstrated that physical and chemical properties of the studied soils to
various extent influenced lithium content in vegetables as evidenced by values of simple
correlation coefficients.
1366 Antoni Rogó¿ et al
4. Determining lithium contents in food products and its consumption is crucially
important because this element participates in many important life processes of humans
and animals.
References
[1] Jurkowska H. Z badañ nad litem (synteza z okresu 1990–1996). Zesz Probl Post Nauk Roln.
1997;448b:101-111.
[2] Jurkowska H, Rogó¿ A, Wojciechowicz T. Dynamika pobierania litu podczas wegetacji owsa. Zesz
Nauk AR w Krakowie Nr 265, Rolnictwo 1992;30:121-127.
[3] Jurkowska H, Rogó¿ A, Wojciechowicz T. Porównanie toksycznego dzia³ania litu na niektóre gatunki
roœlin. Acta Agr Silv, ser Agr. 1997;35:45-50.
[4] Kabata-Pendias A, Pendias H. Biogeochemia pierwiastków œladowych. Warszawa: Wyd PWN; 1999.
[5] Motowicka-Terelak T, Terelak H, Pietruch Cz. ZawartoϾ litu w glebach. Rocz Glebozn.
1997;31(I):1-25.
[6] Wiœniowska-Kielian B. Zawartoœæ Cd, Ni i Li w liœciach tytoniu papierosowego jasnego w zale¿noœci od
formy nawo¿enia azotem. Zesz Probl Post Nauk Roln. 1997;448a:361-368.
[7] Symonowicz B, Kalembasa S. Zmiany zawartoœci Fe, Li, i Ti w kukurydzy pod wp³ywem stosowania
odpadowych materia³ów organicznych, popio³u i nawo¿enia mineralnego. Zesz Probl Post Nauk Roln.
2009;538:257-265.
[8] Rozporz¹dzenia Ministra Œrodowiska z dnia 13 lipca 2010 roku w sprawie komunalnych osadów
œciekowych. DzU 2010, Nr 137, poz 924.
[9] Ustawa z dnia 14 grudnia 2012 roku o odpadach. DzU 2013, Nr 0, poz 21.
[10] Lityñski T, Jurkowska H, Gorlach E. Analiza Chemiczno-Rolnicza. Warszawa: PWN; 1976.
[11] Ostrowska A, Gawliñski S, Szczubia³ka Z. Metody analizy i oceny w³aœciwoœci gleb i roœlin. Katalog.
Warszawa: Instytut Ochrony Œrodowiska; 1991:105-107.
[12] Rogó¿ A, Urbaniak A. Zawartoœæ pierwiastków œladowych w glebie i warzywach przy zmiennym
odczynie. Czêœæ I. Zawartoœæ Cu, Zn w glebie i warzywach. Zesz Probl Post Nauk Roln.
2007;520:695-702.
[13] Ammari TG, Al-Zu Bi Y, Abu-Baker S, Dababneh B, Gnemat W, Tahboub A. The occurrence of lithium
in the environment of the Jordan Valley and its transfer into the food chain. Environ Geochem Health.
2010;33(5):427-437. DOI: 10.1007/s10653-010-9343-5.
[14] Koœla T. Ocena zawartoœci biopierwiastków oraz metali toksycznych w glebie i roœlinnoœci rezerwatu
Jeziorko Czerniakowskie. Ochr Œrod Zas Natural. 2009;40:301-306.
[15] Rogó¿ A, Tabak M. Zawartoœæ pierwiastków œladowych w chwastach zbó¿ na tle ich zawartoœci
w glebie. Czêœæ IV. Zawartoœæ litu w glebie oraz wybranych chwastach. Zesz Nauk Uniwersytetu
Przyrodniczego we Wroc³awiu. 2012;589:189-197.
[16] Rogó¿ A. Badania nad formami litu w glebie. Czêœæ I. Formy litu a w³aœciwoœci fizykochemiczne gleb.
J Element. 2004;9(4):717-726.
[17] Rogó¿ A. Effect of soil properties on lithium phytoavilability. Part 1. Lithium content and uptake by
maize and rye. Ecol Chem Eng A. 2010;17(4-5):473- 481.
[18] Malinowska E, Kalembasa S. Wp³yw dawek osadu œciekowego oraz wapnowania na zawartoœæ Li, Ti,
Ba, Si As w roœlinach testowych. In¿ Ekol. 2011;27:110-118.
[19] Bibak A, Stümp S, Knudsen L, Gundersen. Concentrations of 63 elements in cabbage and sprouts in
Denmark. Commun Soil Sci Plant Anal. 1999;30(17-18):2409-2418.
DOI: 10.1080/00103629909370382.
[20] Bach RO. Some Aspects of Lithium in Living Systems. In: Lithium and Cell Physiology. Bach RO,
Gallicchio VS, editors. Springer-Verlag New York Inc; 1990:1-15.
[21] Klemfuss H, Schrauzer GN. Effects of nutritional lithium deficiency on behavior in rats. Biol Trace
Elem Res. 1995;48(2):131-139.
[22] Dawson EB. The relationship of tap water and physiological levels of lithium to mental hospital
admission and homicide in Texas. In: Lithium in Biology and Medicine, Schrauzer GN, Klippel KF,
editors. Cambridge: VCH; 1991: 169-188.
Lithium Content in Selected Root Vegetables against Its Content in Soil 1367
[23] Schrauzer GN, Shrestha KP. Lithium in drinking water and the incidences of crimes, suicides, and
arrests related to drug addictions. Biol Trace Elem Res. 1990;25(2):105-113.
[24] Anke M, Arnhold W, Groppel B, Krause U. The Biological importance of lithium. In: Lithium in
Biology and Medicine. Schrauzer GN, Klippel KF, editors. Weinheim: VCH Verlag; 1991: 149-167.
[25] Gupta SK, Arun A, Tiwari S, Sehgal S, Khan F, Khan MM, Khan MF. A study to establish co-relation
between lithium levels in blood and type 2 diabetes mellitus in Northern India. J Biol Chem Res.
2013;30(2):717-723.
[26] D³ugaszek M, K³oœ A, Bertrandt J. Poda¿ litu w ca³odziennych racjach pokarmowych studentów. Probl
Hig Epidemiol. 2012;93(4):867-870.
[27] Schrauzer GN. Lithium: occurrence, dietary intakes, nutritional essentiality. J Am Coll Nutr.
2002;21(1):14-21.
[28] Van Cauwenbergh R, Hendrix P, Robberecht H, Deelstra H. Daily dietary lithium intake in Belgium
using duplicate portion sampling. Lebensm Unters Forsh A. 1999;208(3): 153-155.
DOI: 10.1007/s002170050393.
ZAWARTOή LITU W WYBRANYCH WARZYWACH KORZENIOWYCH
NA TLE JEGO ZAWARTOŒCI W GLEBIE
Katedra Chemii Rolnej i Œrodowiskowej
Uniwersytet Rolniczy im. Hugona Ko³³¹taja w Krakowie
Abstrakt: W pierwszej po³owie wrzeœnia 2003 r. na terenie powiatu miechowskiego pobrano 44 próbki
warzyw korzeniowych, tj. marchwi, pietruszki, selera oraz buraka czerwonego. Próbki pobierano z pól
o znacz¹cym areale (0,5–2,0 ha) uprawy warzyw z przeznaczeniem na cele konsumpcyjne. Zebrane próbki
warzyw poddano mineralizacji na sucho, popió³ roztworzono w HNO3, a uzyskane mineralizaty poddano
analizie. Z tych samych miejsc, na których uprawiano warzywa korzeniowe, pobrano próbki glebowe
z g³êbokoœci 0–25 cm. W próbach glebowych oznaczono podstawowe w³aœciwoœci fizykochemiczne
metodami standardowymi stosowanymi w chemii rolnej. Ca³kowit¹ zawartoœci litu w glebach oznaczono po
ich wczeœniejszej mineralizacji w temperaturze 450 oC, a nastêpnie wytrawieniu w mieszaninie kwasów
(HClO4 i HNO3) i roztworzeniu w HCl. ZawartoϾ rozpuszczalnych form tego pierwiastka oznaczono po ich
wyekstrahowaniu roztworem HCl (0,1 mol � dm–3).
Ca³kowita zawartoœæ litu w badanych glebach waha³a siê w szerokim zakresie (2,79–12,20 mgLi � kg–1),
a œrednia geometryczna wynosi³a 7,78 mgLi � kg–1. Natomiast zawartoœæ rozpuszczalnych form litu
wyekstrahowanych HCl o stê¿eniu 0,1 mol � dm–3 waha³a siê od 0,057 do 0,251 mgLi � kg–1 (ze œredni¹
geometryczn¹ 0,119 mgLi � kg–1). Stwierdzono istotn¹ dodatni¹ korelacje pomiêdzy ca³kowit¹ zawartoœci¹ litu
a zawartoœci¹ czêœci sp³awianych oraz i³u koloidalnego w badanych glebach, a tak¿e pomiêdzy zawartoœci¹
rozpuszczalnych form litu a zawartoœci¹ i³u koloidalnego.
Zawartoœæ litu w zebranych warzywach by³a zró¿nicowania w zale¿noœci od gatunku i organu roœliny.
Œrednia geometryczna zawartoœæ litu w korzeniach wynosi³a od 0,206 mgLi � kg–1 (pietruszka) do 0,365
mgLi � kg–1 (burak czerwony). Czêœci nadziemne warzyw zawiera³y 3–5 razy wiêcej litu ni¿ korzenie.
Wykazano, ¿e w³aœciwoœci fizykochemiczne badanych gleb w niejednakowym stopniu wp³ywa³y na
zawartoœæ litu w warzywach, czego dowodz¹ wartoœci wspó³czynników korelacji prostej. O zawartoœæ litu
w korzeniach wszystkich badanych warzyw oraz naci buraka i pietruszki decydowa³a zawartoœæ rozpusz-
czalnych form litu w glebie. Ponadto zawartoϾ litu w korzeniach marchwi oraz korzeniach i naci pietruszki
zale¿a³a od ca³kowitej zawartoœæ tego pierwiastka w glebie. Natomiast odczyn gleb nie mia³ istotnego wp³ywu
na zawartoϾ litu w organach badanych warzyw korzeniowych.
S³owa kluczowe: warzywa korzeniowe, gleba, zawartoœæ litu
1368 Antoni Rogó¿ et al
Ma³gorzata KOSTECKA1 and Monika BOJANOWSKA1*
MOLD CONTAMINATION
OF COMMERCIALLY AVAILABLE HERBAL PRODUCTS
AND DIETARY SUPPLEMENTS OF PLANT ORIGIN
ZAGRO¯ENIE ZANIECZYSZCZENIA GRZYBAMI PLEŒNIOWYMI
ZIÓ£ ORAZ SUPLEMENTÓW DIETY POCHODZENIA ROŒLINNEGO
DOSTÊPNYCH NA RYNKU
Abstract: Recent years have witnessed a rapid development of the dietary supplement market and a revived
interest in herbal products used for therapeutic purposes. Herbs and medicinal plants have been used in
traditional medicine for centuries. The concentrations of active substances in industrially processed plant
extracts are many times lower than those found in the original plant material. For this reason, long-term of use
herbal preparations is safe, and it does not require medical consultation. Herbs and medicinal plants have
a complex composition, and recent research indicates that they may produce adverse reactions with food
ingredients or pharmaceuticals. Molds, mainly fungi of the genera Fusarium, Penicillium and Aspergilluswhich colonize growing plants, are thermophilous organisms that can survive drying and heat processing, and
they can find their way to the final product. Those fungi produce mycotoxins, metabolites which are toxic for
humans.
In our study, fungi of the genera Aspergillus and Fusarium were determined in commercially available
fresh herbs, herbal teas and herbal dietary supplements in the form of tablets.
Keywords: molds, herbs, dietary supplements, Aspergillus, Fusarium
Introduction
Herbs constitute a large group of plants containing active substances which may
deliver health benefits for consumers. In addition to herbs, this category of plants also
includes trees and shrubs which have been used as spices and medicinal products since
antiquity. The therapeutic properties of herbs are determined by their chemical
composition, mainly the presence of alkaloids, anthra-compounds, azulenes, phenols,
flavonoids, tannins, cardiac glycosides, glucosinolates, pectins, saponins and mucila-
DOI: 10.2428/ecea.2013.20(11)125 ECOL CHEM ENG A. 2013;20(11):1369-1379
1 Department of Chemistry, University of Life Science, ul. Akademicka 15, 20–950 Lublin, Poland,
phone: +48 81 445 68 46.
* Corresponding author: [email protected]
ginous compounds [1, 2]. Despite the predominance of chemical medications on the
contemporary market, there has been a revived interest in medicinal plants which are
easily available and pose an alternative to synthetic drugs. There are two categories of
medicinal herbs:
– herbal medicines – herb plants (mint leaves, lemon balm leaves, dandelion root)
and herbal mixes;
– herbal formulations – herbs in the form of tablets, dragées, capsules and liquids
(dry extracts, condensed extracts, infusions, essential oils) [3].
Fresh and dried herbs are also used to bring out and enhance the natural flavor and
aroma of food [4]. Owing to their medicinal properties, herbs ease digestion, increase
nutrient availability and boost natural immunity. Herbs fortify hair, nails and skin, and
they are widely used in the cosmetics industry.
Poland has been a significant supplier and exporter of herbs for decades. Campaigns
promoting natural foods and cosmetics have turned the consumers’ attention to products
containing herbs and spices [5]. Herbal raw materials are subject to strict control which
contributes to the quality of the final product and promotes the development of new
formulations. Herbs are used as fresh and dried plants (whole or ground plant
fragments, mixes containing several plants), essential oils, extracts and microcapsules
[6]. Dried herbs are highly popular due to their long shelf-life. Dried herbs and spices
can, however, be colonized by fungi which produce harmful mycotoxins [7].
Raw herbs can act as hosts for microorganisms which colonize plants, soil, water and
air. Plant communities are popularly colonized by molds of the genera Alternaria,
Fusarium, Cladosporium, Penicillium and, less frequently, Aspergillus, Trichoderma,
Mucor and Rhizopus. The size of fungal populations in fresh plant matter may exceed
106 CFU/g. Microbiological soil pollutants may also be introduced during the
harvesting, transport and storage of plants when the number and abundance of mold
communities, in particular of the genera Penicillium, Fusarium, Alternaria, Clado-sporium and Verticillium, grows rapidly [8, 9]. Molds representing the genera
Alternaria, Aspergillus, Cladosporium and Penicillium are transferred from the air to
herbal raw materials [10, 11]. The composition of the microflora from this source is
determined mainly by the degree of urban development in the herb growing area, and it
increases considerably in the vicinity of cities.
Dried herbs may undergo microbiological contamination at nearly every stage of
production, beginning from harvesting and drying to packaging which should protect
the final product from adverse environmental impacts [5, 11, 12]. Molds colonizing raw
herbs produce mycotoxins, secondary metabolites which pose a health hazard for
humans and animals. Those low-molecular weight compounds are weakly polar, and
they are not damaged by pasteurization or high temperature. They are degraded in an
alkaline environment and under exposure to UV radiation [13]. The most prevalent
mycotoxins include aflatoxins, ochratoxin A, patulin, trichothecenes, sterigmatocystin
and vomitoxin. Subject to fungal species and their habitat conditions, the produced
mycotoxins may deliver mutagenic, teratogenic, neurotoxic and nephrotoxic effects
[14–16]. Herbal plants are most often colonized by the following mold genera and
species: Alternaria sp., Aspergillus sp. (A. amstelodami, A. sydowii), Chaetomium sp.,
1370 Ma³gorzata Kostecka and Monika Bojanowska
Cladosporium sp., Fusarium sp., Mucor sp., Penicillium sp., Rhizopus sp., Trichodermasp. and Verticillium sp. The size of fungal populations is estimated at 101–106 CFU/g
[5, 8, 17].
Herbal ingredients are found in foods, spice mixes and dietary supplements, and their
microbiological purity is a highly important criterion while evaluating their processing
suitability. Herbs, in particularly dried plants, are often carriers of microorganisms
which are introduced into the final product. Evaluations of the medicinal properties and
sensory attributes of herbs should, therefore, be accompanied by microbial and fungal
analyses.
The objective of this study was to evaluate the degree of mold contamination in
commercially available fresh herbs, herbal teas and herbal dietary supplements in the
form of tablets.
Materials and methods
The experimental material comprised fresh basil, lemon balm and mint, as well as
dried herbs, herbal teas and dietary supplements. Herbs were harvested from an organic
farm, a farm where plants were sprayed with Topsin M 500SC fungicide, and pots:
– Basil I – pot, Santa Maria (Swedoponic, Polska),
– Basil II – pot, “Pokarm ¿ycia” horticultural-breeding farm, Poland,
– Basil III – treated with fungicide,
– Basil IV – organic farm,
– Lemon balm I – pot, Santa Maria (Swedoponic, Polska),
– Lemon balm II – pot, “Pokarm ¿ycia” horticultural-breeding farm, Poland,
– Lemon balm III – treated with fungicide,
– Lemon balm IV – organic farm,
– Mint I – pot, “Pokarm ¿ycia” horticultural-breeding farm, Poland,
– Mint II – organic farm.
Dried herbs and herbal teas were purchased in grocery stores and the Tesco
supermarket, and dietary supplements (herbal tablets) were acquired from pharmacies in
the city of Lublin.
Mycological evaluation
Fresh herbs: Mycological analyses were performed on 7–8 leaves from mature
shoots without flower buds. The leaves were washed, dried and chopped. Two samples
of 5 g each were placed on Petri dishes lined with moistened filter paper and incubated
at 23 oC. After 7 days, fungal cultures were transferred to potato dextrose agar (PDA)
with the addition of chloramphenicol (100 mg/dm3) and incubated at 28 oC for 5 days.
Dried herbs and herbal teas: Three samples of 5 g each were placed on Petri dishes
lined with moistened filter paper. The procedure was identical to that applied to fresh
herbs.
Mold Contamination of Commercially Available Herbal Products... 1371
Herbal tablets: Five tablets were randomly selected from the package. They were
ground in a ceramic mortar, and three samples of 5 g each were incubated on moistened
filter paper at 23 oC. After 7 days, fungal cultures were transferred to a PDA medium.
Fungal strains were identified based on mycological keys [18, 19].
Results
Molds are common in the environment, they are characterized by low sensitivity to
external factors and the ease of propagation. Molds develop at a temperature of 18 to
32 oC, and they can survive in a wide temperature range of 6 to 60 oC (in particular in
aerobic habitats, but also under anaerobic conditions) and at pH of 2–8.5 [20]. Molds
remain stable in environments with relative humidity of 20 to 75 %, and they are
thermophilous and thermotolerant organisms [21]. Food contamination with molds,
their spores and toxic metabolites is difficult to control, and it poses a significant health
risk for consumers.
Herbal teas and tables have a very low moisture content in the range of 7–12 %,
therefore, they do not offer a supporting habitat for microbial growth. Most molds
produce spores which can survive in highly unsupportive environments. Spores are
resistant to drying temperatures (the optimal temperature for drying herbal products is
35–50 oC) and low humidity levels. They remain dormant under the above conditions,
but when the moisture content of plant material increases to 30 % due to inadequate
storage, spores begin to germinate and grow. Molds can develop in much drier habitats
than bacteria, therefore dried plants and herbs are more likely to be colonized by molds
than bacteria.
Most fungi isolated from herbs and herbal teas belong to the genera Fusarium and
Aspergillus, pathogens which are commonly found in the environment. Those molds are
generally harmless, but selected species produce toxic metabolites. Food products offer
a highly supportive habitat for microbial growth, and molds colonizing food ingredients
are often a source of secondary contamination. Molds observed in the examined
material (Table 1) were members of 7 genera, and the presence of Aspergillus and
Fusarium was observed in all studied herbs. Representatives of the genera Alternariaand Penicillium, followed by Mucor, Rhizopus and Uclodium sp. were less frequently
noted. Molds of the genera Cladosporium and Trichoderma were not determined.
Similar results were reported by Wojcik-Stopczynska et al [22, 23] in whose study,
herbs were most frequently colonized by fungal genera of Alternaria, Botrytis,
Penicillium, Fusarium and Aspergillus. Our results corroborate the findings of Halt and
Klapec [24] who evaluated the contamination of herbal teas with microbial pathogens.
In the cited study, a prevalence of the genera Penicillium, Aspergillus, Cladosporiumand Alternaria was determined in experimental material, and none of the analyzed
samples were free of molds.
Rizzo et al [25] found 56 strains of toxin-producing fungi in dried herbaceous plants
grown in Argentina. More than half of the samples contained strains of the genus
Aspergillus, and 16 % of the samples were contaminated by the genus Fusarium. The
above authors observed that the number of toxin-producing fungi varied depending on
1372 Ma³gorzata Kostecka and Monika Bojanowska
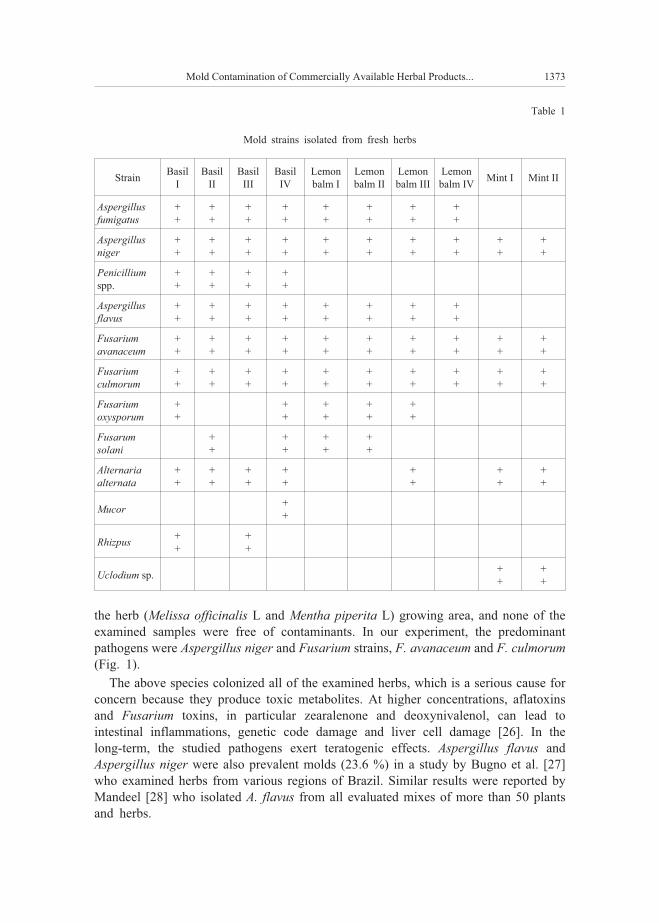
Table 1
Mold strains isolated from fresh herbs
StrainBasil
I
Basil
II
Basil
III
Basil
IV
Lemon
balm I
Lemon
balm II
Lemon
balm III
Lemon
balm IVMint I Mint II
Aspergillusfumigatus
+
+
+
+
+
+
+
+
+
+
+
+
+
+
+
+
Aspergillusniger
+
+
+
+
+
+
+
+
+
+
+
+
+
+
+
+
+
+
+
+
Penicilliumspp.
+
+
+
+
+
+
+
+
Aspergillusflavus
+
+
+
+
+
+
+
+
+
+
+
+
+
+
+
+
Fusariumavanaceum
+
+
+
+
+
+
+
+
+
+
+
+
+
+
+
+
+
+
+
+
Fusariumculmorum
+
+
+
+
+
+
+
+
+
+
+
+
+
+
+
+
+
+
+
+
Fusariumoxysporum
+
+
+
+
+
+
+
+
+
+
Fusarumsolani
+
+
+
+
+
+
+
+
Alternariaalternata
+
+
+
+
+
+
+
+
+
+
+
+
+
+
Mucor+
+
Rhizpus+
+
+
+
Uclodium sp.+
+
+
+
the herb (Melissa officinalis L and Mentha piperita L) growing area, and none of the
examined samples were free of contaminants. In our experiment, the predominant
pathogens were Aspergillus niger and Fusarium strains, F. avanaceum and F. culmorum(Fig. 1).
The above species colonized all of the examined herbs, which is a serious cause for
concern because they produce toxic metabolites. At higher concentrations, aflatoxins
and Fusarium toxins, in particular zearalenone and deoxynivalenol, can lead to
intestinal inflammations, genetic code damage and liver cell damage [26]. In the
long-term, the studied pathogens exert teratogenic effects. Aspergillus flavus and
Aspergillus niger were also prevalent molds (23.6 %) in a study by Bugno et al. [27]
who examined herbs from various regions of Brazil. Similar results were reported by
Mandeel [28] who isolated A. flavus from all evaluated mixes of more than 50 plants
and herbs.
Mold Contamination of Commercially Available Herbal Products... 1373
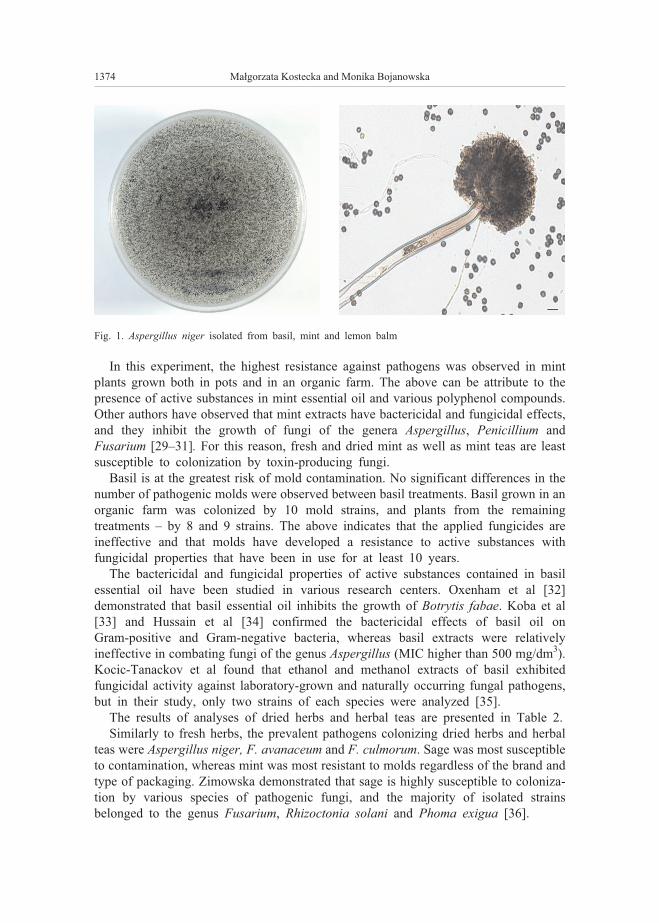
In this experiment, the highest resistance against pathogens was observed in mint
plants grown both in pots and in an organic farm. The above can be attribute to the
presence of active substances in mint essential oil and various polyphenol compounds.
Other authors have observed that mint extracts have bactericidal and fungicidal effects,
and they inhibit the growth of fungi of the genera Aspergillus, Penicillium and
Fusarium [29–31]. For this reason, fresh and dried mint as well as mint teas are least
susceptible to colonization by toxin-producing fungi.
Basil is at the greatest risk of mold contamination. No significant differences in the
number of pathogenic molds were observed between basil treatments. Basil grown in an
organic farm was colonized by 10 mold strains, and plants from the remaining
treatments – by 8 and 9 strains. The above indicates that the applied fungicides are
ineffective and that molds have developed a resistance to active substances with
fungicidal properties that have been in use for at least 10 years.
The bactericidal and fungicidal properties of active substances contained in basil
essential oil have been studied in various research centers. Oxenham et al [32]
demonstrated that basil essential oil inhibits the growth of Botrytis fabae. Koba et al
[33] and Hussain et al [34] confirmed the bactericidal effects of basil oil on
Gram-positive and Gram-negative bacteria, whereas basil extracts were relatively
ineffective in combating fungi of the genus Aspergillus (MIC higher than 500 mg/dm3).
Kocic-Tanackov et al found that ethanol and methanol extracts of basil exhibited
fungicidal activity against laboratory-grown and naturally occurring fungal pathogens,
but in their study, only two strains of each species were analyzed [35].
The results of analyses of dried herbs and herbal teas are presented in Table 2.
Similarly to fresh herbs, the prevalent pathogens colonizing dried herbs and herbal
teas were Aspergillus niger, F. avanaceum and F. culmorum. Sage was most susceptible
to contamination, whereas mint was most resistant to molds regardless of the brand and
type of packaging. Zimowska demonstrated that sage is highly susceptible to coloniza-
tion by various species of pathogenic fungi, and the majority of isolated strains
belonged to the genus Fusarium, Rhizoctonia solani and Phoma exigua [36].
1374 Ma³gorzata Kostecka and Monika Bojanowska
Fig. 1. Aspergillus niger isolated from basil, mint and lemon balm
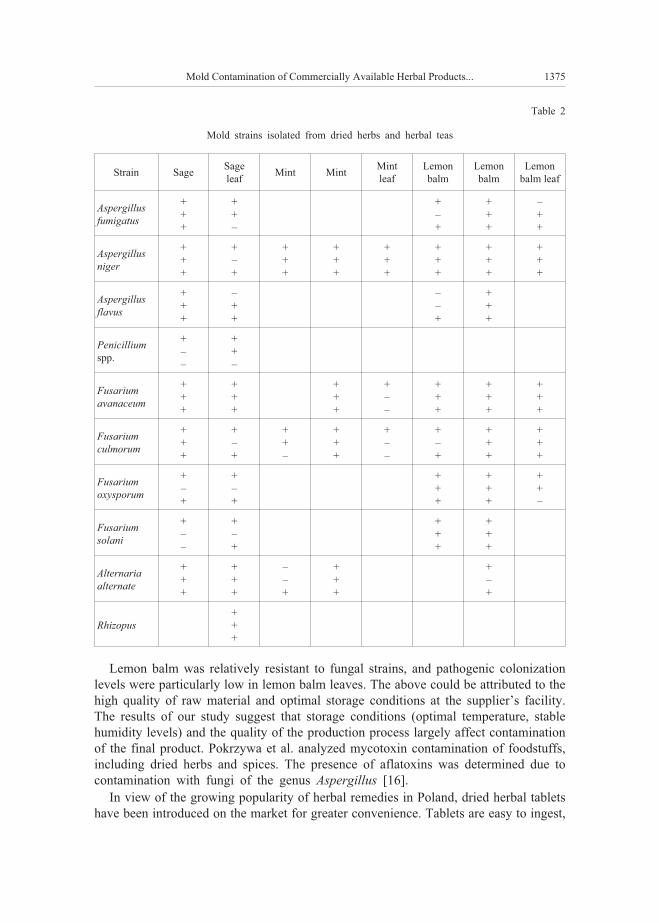
Table 2
Mold strains isolated from dried herbs and herbal teas
Strain SageSage
leafMint Mint
Mint
leaf
Lemon
balm
Lemon
balm
Lemon
balm leaf
Aspergillusfumigatus
+
+
+
+
+
–
+
–
+
+
+
+
–
+
+
Aspergillusniger
+
+
+
+
–
+
+
+
+
+
+
+
+
+
+
+
+
+
+
+
+
+
+
+
Aspergillusflavus
+
+
+
–
+
+
–
–
+
+
+
+
Penicilliumspp.
+
–
–
+
+
–
Fusariumavanaceum
+
+
+
+
+
+
+
+
+
+
–
–
+
+
+
+
+
+
+
+
+
Fusariumculmorum
+
+
+
+
–
+
+
+
–
+
+
+
+
–
–
+
–
+
+
+
+
+
+
+
Fusariumoxysporum
+
–
+
+
–
+
+
+
+
+
+
+
+
+
–
Fusariumsolani
+
–
–
+
–
+
+
+
+
+
+
+
Alternariaalternate
+
+
+
+
+
+
–
–
+
+
+
+
+
–
+
Rhizopus+
+
+
Lemon balm was relatively resistant to fungal strains, and pathogenic colonization
levels were particularly low in lemon balm leaves. The above could be attributed to the
high quality of raw material and optimal storage conditions at the supplier’s facility.
The results of our study suggest that storage conditions (optimal temperature, stable
humidity levels) and the quality of the production process largely affect contamination
of the final product. Pokrzywa et al. analyzed mycotoxin contamination of foodstuffs,
including dried herbs and spices. The presence of aflatoxins was determined due to
contamination with fungi of the genus Aspergillus [16].
In view of the growing popularity of herbal remedies in Poland, dried herbal tablets
have been introduced on the market for greater convenience. Tablets are easy to ingest,
Mold Contamination of Commercially Available Herbal Products... 1375
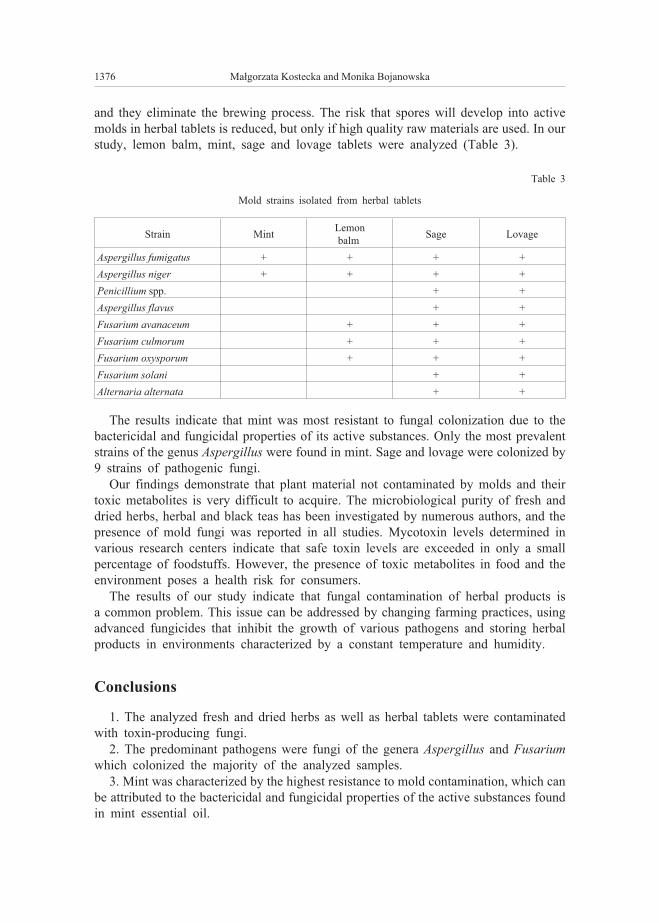
and they eliminate the brewing process. The risk that spores will develop into active
molds in herbal tablets is reduced, but only if high quality raw materials are used. In our
study, lemon balm, mint, sage and lovage tablets were analyzed (Table 3).
Table 3
Mold strains isolated from herbal tablets
Strain MintLemon
balmSage Lovage
Aspergillus fumigatus + + + +
Aspergillus niger + + + +
Penicillium spp. + +
Aspergillus flavus + +
Fusarium avanaceum + + +
Fusarium culmorum + + +
Fusarium oxysporum + + +
Fusarium solani + +
Alternaria alternata + +
The results indicate that mint was most resistant to fungal colonization due to the
bactericidal and fungicidal properties of its active substances. Only the most prevalent
strains of the genus Aspergillus were found in mint. Sage and lovage were colonized by
9 strains of pathogenic fungi.
Our findings demonstrate that plant material not contaminated by molds and their
toxic metabolites is very difficult to acquire. The microbiological purity of fresh and
dried herbs, herbal and black teas has been investigated by numerous authors, and the
presence of mold fungi was reported in all studies. Mycotoxin levels determined in
various research centers indicate that safe toxin levels are exceeded in only a small
percentage of foodstuffs. However, the presence of toxic metabolites in food and the
environment poses a health risk for consumers.
The results of our study indicate that fungal contamination of herbal products is
a common problem. This issue can be addressed by changing farming practices, using
advanced fungicides that inhibit the growth of various pathogens and storing herbal
products in environments characterized by a constant temperature and humidity.
Conclusions
1. The analyzed fresh and dried herbs as well as herbal tablets were contaminated
with toxin-producing fungi.
2. The predominant pathogens were fungi of the genera Aspergillus and Fusariumwhich colonized the majority of the analyzed samples.
3. Mint was characterized by the highest resistance to mold contamination, which can
be attributed to the bactericidal and fungicidal properties of the active substances found
in mint essential oil.
1376 Ma³gorzata Kostecka and Monika Bojanowska
4. Foodstuff contamination with molds which produce mycotoxins harmful for
humans and animals poses a serious epidemiological risk.
References
[1] Kazimierczak R, Hallmann E, Ardasiñska B, £oœ B. The impact of organic and conventional crop
production systems on phenolic compounds content in medicinal plants. J Res Appl Agricult Eng.
2012;56(3):200-205 (in Polish).
[2] ŒledŸ M, Witrowa-Rajchert D. Biologically active components in dried herbs – still active? Kosmos.
Post Nauk Biol. 2012;61(2)319-329 (in Polish).
[3] Meena AK, Sinha A, Verma SC, Gupta MD, Padhi MM. HPTLC Profile of Important Indian Spices used
in Ayurvedic Formulations. Research Journal of Pharmacognosy and Phytochemistry. 2013;5(4),188-193.
[4] Wójcik-Stopczyñska B, Jakubowska B, Reichelt M. Microbiological contamination of dried culinary
herbs. Herba Polonica. 2009;55(3):206-213.
[5] Rynek zió³ w Polsce i w Unii Europejskiej. „Stan i perspektywy rozwoju upraw zielarskich oraz kierunki
ich wykorzystania”. Instytut Roœlin i Przetworów Zielarskich, Polski Komitet Zielarski,
http://www.zodr.pl/download/technologia/rynekziol.pdf.
[6] Kunicka-Styczyñska A, Œmigielski K. Microbiological safety of herbal raw material. Przem Spo¿.
2011;65:50-53 (in Polish).
[7] Janda K, Ulfig K, Szczupak-Markowska A. Further studies of extracellular enzyme profiles of xerophilic
fungi isolates from dried medicinal plants. Polish J Environ Stud. 2009;18(4):627-633.
[8] Guédon D, Brum M, Taoubi K, Bizet D, Bizot S, Bourny E, Compagnon PA, Kergosien H, Quintelas
LG, Respaud J, Saperas O, Seigneuret JM, Urizzi P. Impurities in herbal substances, herbal preparations
and herbal medicinal products. Part II: Mycotoxins. STP Pharma Pratiques. 2007;17:209-223.
[9] Jordan SA, Cunningham DG, Marles RJ. Assessment of herbal medicinal products: Challenges, and
opportunities to increase the knowledge base for safety assessment. Toxicol Appl Pharmacol.
2010:243(2):198-216. http://dx.doi.org/10.1016/j.taap.2009.12.005.
[10] Guédon D, Brum M, Bizet D, Bizot S, Bourny E, Compagnon PA, Kergosien H, Quintelas LG, Respaud
J, Saperas O, Seigneuret JM, Taoubi K, Urizzi P. Impurities in herbal substances, herbal preparations and
herbal medicinal products. Part I: Microbial contamination. STP Pharma Pratiques. 2007;17:183-208.
[11] Kneifel W, Czech E, Kopp B. Microbial contamination of medicinal plants – a review. Planta Med.
2002;68(1):5-15. DOI: 10.1055/s-2002-20060.
[12] Banerjee M, Sarkar PK. Microbiological quality of some retail spices in India. Food Res Int.
2003;36:469-474. DOI: 10.1016/S0963-9969(02)00194-1.
[13] Kolenda M, Mroczkowski S. Fusarium mycotoxins and methods of assessing the mycotoxicity: review.
J Central Europ Agr. 2013;14(1):169-180. DOI: 10.5513/JCEA01/14.1.1177.
[14] Hussein SH, Brasel JM. Toxicity, metabolism and impact of mycotoxins on human and animals.
Toxicology. 2001;167:101-134. http://dx.doi.org/10.1016/S0300-483X(01)00471-1.
[15] Grajewski J, editor. Mikotoksyny i grzyby pleœniowe zagro¿enie dla cz³owieka i zwierz¹t. Bydgoszcz:
Wyd UKW; 2006.
[16] Pokrzywa P, Cieœlik E, Topolska K. The evaluation of mycotoxins content in selected food product.
¯ywnoœæ – Nauka – Technologia – Jakoœæ. 2007;3(52):139-146 (in Polish).
[17] Machowicz-Stefaniak Z, Zalewska E. The pathogenicity of Fusarium spp to thyme (Thymus vulgaris L).
Acta Sci Pol, Hortorum Cultus. 2004;3(1):115-123 (in Polish).
[18] Kwaœna H, Che³kowski J, Zajkowski P. Flora of Poland, Fungi (Mycota). Institute of Botany Polish
Academy of Science. Vol XXII; 1991.
[19] Marcinkowska J. Oznaczanie rodzajów grzybów wa¿nych w patologii roœlin. Warszawa: Fundacja
Rozwój SGGW; 2003.
[20] Socha K, Waszewska M. Organic producersin 2012. Knowledge and quality. Agricultural and Food
Quality Inspection. 2012:14-15 (in Polish).
[21] Baran E. Zarys mikologii lekarskiej. Wroc³aw: Wyd Volumed; 1998:21-37.
[22] Wójcik-Stopczyñska B, Jadczak D. The effect of freezing storage on microbiological quality of some
spice plants. Res Vegetable Crops. 2007;66:85-93.
Mold Contamination of Commercially Available Herbal Products... 1377
[23] Wójcik-Stopczyñska B, Jakowienko P, Jadczak D. Assessing microbiological contamination of fresh
basil and mint. ¯ywnoœæ – Nauka – Technologia – Jakoœæ. 2010;4(71):122-131 (in Polish).
[24] Halt M, Klapec T. Microbial populations in medical and aromatic plants and herbal teas from Croatia.
Italian J Food Sci. 2005;17:349-354.
[25] Rizzo I, Vedoya G, Maurutto S, Haidukowski M, Varsavsky E. Assessment of toxigenic fungion
Argentinean medicinal plants. Microbiol Res. 2008;159(2):113-120.
http://dx.doi.org/10.1016/j.micres.2004.01.013.
[26] Stanis³awczyk R, Rudy M, Œwi¹tek B. The occurrence of mycotoxins in cereals and cereal products in
retail outlets in the province of Podkarpacie. ¯ywnoœæ – Nauka – Technologia – Jakoœæ.
2010;6(73):58-66 (in Polish).
[27] Bugno A, Almodovar AA, Pereira TC, Sabino M. Occurrence of toxigenic fungi in herbal drugs.
Brazilian J Microbiol. 2006;37:47-51. http://dx.doi.org/10.1590/S1517-83822006000100009.
[28] Mandeel QA. Fungal contamination of some important species. Mycopathol. 2005;159:291-298.
[29] Inouye S, Takahashi M, Abe S. Inhibitory activity of hydrosols, herbal teas and related essential oils
against filament formation and the growth of Candida albicans. Jpn J Med Mycol. 2009;50:243-51.
[30] Arango MC, Ruscitti MF, Ronco MG, Beltrano J. Mycorrhizal fungi inoculation and phosphorus
fertilizer on growth, essential oil production and nutrient uptake in peppermint (Mentha piperita L). Rev
Bras Plantas Med. 2012;14(4):692-699. doi.org/10.1590/S1516-05722012000400018.
[31] Gulluce M, Sahin F, Sokmen M, Ozer H, Daferera D, Sokmen A, Polissiou M, Adiguzel A, Ozkan H.
Antimicrobial and antioxidant properties of the essential oils and methanol extract from Mentha
longifolia L ssp longifolia. Food Chem. 2007;103(4):1449-56.
http://dx.doi.org/10.1016/j.foodchem.2006.10.061.
[32] Oxenham SK, Svoboda KP. Altered growth and polyamine catabolism following exposure of the
chocolate spot pathogen Botrytis fabae to the essential oil of Ocimum basilicum. Mycologia 2005;
97(3):576-579. DOI: 10.3852/mycologia.97.3.576.
[33] Koba K, Poutouli PW, Raynaud Ch, Chaumont JP, Sanda K. Chemical composition and antimicrobial
properties of different basil essential oils chemotypes from Togo. Bangladesh J Pharmacol. 2009;4:1-8.
[34] Hussain AI, Anwar F, Hussain ST, Przybylski R. Chemical composition, antioxidant and antimicrobial
activities of basil (Ocimum basilicum L) essential oils depends on seasonal variations. Food Chem.
2008;108(3):986-995. http://dx.doi.org/10.1016/j.foodchem.2007.12.010.
[35] Kociæ-Tanackov S, Dimiæ G, Leviæ J, Tanackov I, Tuco D. Antifungal activities of basil (Ocimum
basilicum L) extract on Fusarium species. Afr J Biotechnol. 2011;10(50):10188-10195.
DOI: 10.5897/AJB11.1330.
[36] Zimowska B. Fungi threatening the cultivation of sage (Salvia officinalis L) in south-eastern Poland.
Herba Polonica. 2008;54(1):15-24.
ZAGRO¯ENIE ZANIECZYSZCZENIA GRZYBAMI PLEŒNIOWYMI ZIÓ£
ORAZ SUPLEMENTÓW DIETY POCHODZENIA ROŒLINNEGO DOSTÊPNYCH NA RYNKU
Katedra Chemii, Wydzia³ Nauk o ¯ywnoœci i Biotechnologii
Uniwersytet Przyrodniczy w Lublinie
Abstrakt: W ostatnich latach nast¹pi³ szybki rozwój rynku suplementów diety i powrót do preparatów
zio³owych stosowanych w profilaktyce i w lecznictwie. Ma to swoje uzasadnienie tym, ¿e zio³a i roœliny
lecznicze by³y od lat stosowane z powodzeniem w medycynie tradycyjnej. U¿ywane w przemyœle
farmaceutycznym wyci¹gi z roœlin zawieraj¹ w swoim sk³adzie stê¿enia substancji aktywnych wielokrotnie
ni¿sze od tych zawartych w samych roœlinach. Gwarantuje to bezpieczeñstwo d³ugotrwa³ego stosowania bez
konsultacji z lekarzem. Jednak zio³a i inne roœliny o w³aœciwoœciach leczniczych maj¹ bardzo z³o¿ony sk³ad
i coraz czêœciej okazuje siê, ¿e mog¹ ³atwo reagowaæ w sposób niekorzystny ze sk³adnikami ¿ywnoœci czy
innymi farmaceutykami. Dodatkowo du¿ym zagro¿eniem okazuj¹ siê grzyby pleœniowe, g³ównie z rodzaju
Fusarium, Penicillium i Aspergillus, które kolonizuj¹ roœliny w stanie naturalnego wzrostu, a w procesie
suszenia i przetwarzania ze wzglêdu na swoj¹ termofilnoœæ przechodz¹ do produktu gotowego. S¹ one
szczególnie niebezpieczne, poniewa¿ maj¹ zdolnoœæ wytwarzania toksycznych dla cz³owieka produktów
przemiany materii, mikotoksyn.
1378 Ma³gorzata Kostecka and Monika Bojanowska

Jak wynika z przeprowadzonych badañ w³asnych, grzyby z rodzaju Aspergillus i Fusarium wystêpuj¹ nie
tylko na œwie¿ych zio³ach dostêpnych w sprzeda¿y, ale równie¿ w herbatkach zio³owych oraz w zio³owych
suplementach diety w postaci tabletek.
S³owa kluczowe: pleœnie, zio³a, suplementy diety, Aspergillus, Fusarium
Mold Contamination of Commercially Available Herbal Products... 1379


Varia

INVITATION FOR
ECOpole ’14 CONFERENCE
CHEMICAL SUBSTANCES IN ENVIRONMENT
We have the honour to invite you to take part in the 23rd annual Central European
Conference ECOpole ’14, which will be held in 15–18.10.2014 (Wednesday–Saturday)
in Hotel Ziemowit in Jarnoltowek, PL.
The Conference Programme includes oral presentations and posters and will be
divided into four sections:
– SI Chemical Pollution of Natural Environment and Its Monitoring
– SII Environment Friendly Production and Use of Energy
– SIII Forum of Young Scientists and Environmental Education in Chemistry
– SIV Impact of Environment Pollution on Food and Human Health
The Conference language is English.
Contributions to the Conference will be published as:
– abstracts on the CD-ROM (0.5 page of A4 paper sheet format),
– extended Abstracts (6–8 pages) in the semi-annual journal Proceedings of ECOpole,
– full papers will be published in successive issues of the Ecological Chemistry andEngineering/Chemia i In¿ynieria Ekologiczna (Ecol. Chem. Eng.) ser. A or S.
The deadline for sending the Abstracts is 15th
July 2014 and for the Extended
Abstracts: 1st
October 2014. The actualized list (and the Abstracts) of the Conference
contributions accepted for presentation by the Scientific Board, one can find (starting
from 31st
July 2014) on the Conference website:
ecopole.uni.opole.pl
The papers must be prepared according to the Guide for Authors on Submission of
Manuscripts to the Journals.
At the Reception Desk each participant will obtain abstracts of the Conference
contributions as well as the Conference Programme recorded on electronic media (the
Programme will be also published on the Conference website).
After the ECOpole ’14 Conference it will be possible to publish electronic
version of presented contributions (oral presentations as well as posters) on this
site.
Further information is available from:
Prof. dr hab. in¿. Maria Wac³awek
Chairperson of the Organising Committee
of ECOpole ’14 Conference
Opole University
email: [email protected]
phone: +48 77 401 60 42
fax +48 77 401 60 51
Conference series
1. 1992 Monitoring ’92 Opole
2. 1993 Monitoring ’93 Turawa
3. 1994 Monitoring ’94 Pokrzywna
4. 1995 EKO-Opole ’95 Turawa
5. 1996 EKO-Opole ’96 Kêdzierzyn KoŸle
6. 1997 EKO-Opole ’97 Duszniki Zdrój
7. 1998 CEC ECOpole ’98 Kêdzierzyn-KoŸle
8. 1999 CEC ECOpole ’99 Duszniki Zdrój
9. 2000 CEC ECOpole 2000 Duszniki Zdrój
10. 2001 CEC ECOpole ’01 Duszniki Zdrój
11. 2002 CEC ECOpole ’02 Duszniki Zdrój
12. 2003 CEC ECOpole ’03 Duszniki Zdrój
13. 2004 CEC ECOpole ’04 Duszniki Zdrój
14. 2005 CEC ECOpole ’05 Duszniki Zdrój
15. 2006 CEC ECOpole ’06 Duszniki Zdrój
16. 2007 CEC ECOpole ’07 Duszniki Zdrój
17. 2008 CEC ECOpole ’08 Piechowice
18. 2009 CEC ECOpole ’09 Piechowice
19. 2010 CEC ECOpole ’10 Piechowice
20. 2011 CEC ECOpole ’11 Zakopane
21. 2012 CEC ECOpole ’12 Zakopane
22. 2013 CEC ECOpole ’13 Jarno³tówek
1384 Varia
ZAPRASZAMY DO UDZIA£U
W ŒRODKOWOEUROPEJSKIEJ KONFERENCJI ECOpole ’14
W DNIACH 15–18 X 2014 r.
SUBSTANCJE CHEMICZNE
W ŒRODOWISKU PRZYRODNICZYM
Bêdzie to dwudziesta trzecia z rzêdu konferencja poœwiêcona badaniom podstawo-
wym oraz dzia³aniom praktycznym dotycz¹cym ró¿nych aspektów ochrony œrodowiska
przyrodniczego. Odbêdzie siê ona w Hotelu Ziemowit w Jarno³tówku.
Doroczne konferencje ECOpole maj¹ charakter miêdzynarodowy i za takie s¹ uznane
przez Ministerstwo Nauki i Szkolnictwa Wy¿szego. Obrady konferencji ECOpole ’14
bêd¹ zgrupowane w czterech Sekcjach:
– Chemiczne substancje w œrodowisku przyrodniczym oraz ich monitoring
– SII Odnawialne Ÿród³a energii i jej oszczêdne pozyskiwanie oraz u¿ytkowanie
– SIII Forum M³odych (FM) i Edukacja proœrodowiskowa
– SIV Wp³yw zanieczyszczeñ œrodowiska oraz ¿ywnoœci na zdrowie ludzi
Materia³y konferencyjne bêd¹ opublikowane w postaci:
– abstraktów (0,5 strony formatu A4) na CD-ROM-ie,
– rozszerzonych streszczeñ o objêtoœci 6–8 stron w pó³roczniku Proceedingsof ECOpole,
– artyku³ów: w abstraktowanych czasopismach: Ecological Chemistry and Engineering/
Chemia i In¿ynieria Ekologiczna (Ecol. Chem. Eng.) ser. A i S oraz w pó³roczniku
Chemistry – Didactics – Ecology – Metrology (Chemia – Dydaktyka – Ekologia –Metrologia).
Termin nadsy³ania angielskiego i polskiego streszczenia o objêtoœci 0,5–1,0 stro-
ny (wersja cyfrowa) planowanych wyst¹pieñ up³ywa w dniu 15 lipca 2014 r. Lista
prac zakwalifikowanych przez Radê Naukow¹ Konferencji do prezentacji bêdzie sukce-
sywnie publikowana od 31 lipca 2014 r. na tej stronie. Aby praca (dotyczy to tak¿e
streszczenia, które powinno mieæ tytu³ w jêzyku polskim i angielskim, s³owa kluczowe
w obydwu jêzykach) przedstawiona w czasie konferencji mog³a byæ opublikowana, jej
tekst winien byæ przygotowany zgodnie z wymaganiami stawianymi artyku³om druko-
wanym w czasopismach Ecological Chemistry and Engineering ser. A oraz S, które s¹
dostêpne w wielu bibliotekach naukowych w Polsce i za granic¹. Zalecenia te s¹ rów-
nie¿ umieszczone na stronie webowej Towarzystwa Chemii i In¿ynierii Ekologicznej
tchie.uni.opole.pl
Po konferencji zostan¹ wydane 6–8-stronicowe rozszerzone streszczenia wyst¹pieñ
w pó³roczniku Proceedings of ECOpole. Artyku³y te winny byæ przes³ane do 1 paŸdzier-
nika 2014 r. Wszystkie nadsy³ane prace podlegaj¹ zwyk³ej procedurze recenzyjnej.
Streszczenia oraz program konferencji zostan¹ wydane na CD-ROM-ie, który
otrzyma ka¿dy z uczestników podczas rejestracji. Program bêdzie tak¿e zamieszczony
na stronie webowej konferencji:
ecopole.uni.opole.pl
Po konferencji bêdzie mo¿liwoœæ opublikowania elektronicznej wersji prezen-
towanego wyst¹pienia (wyk³adu, a tak¿e posteru) na tej stronie webowej.
Prof. dr hab. in¿. Maria Wac³awek
Przewodnicz¹ca Komitetu Organizacyjnego
Konferencji ECOpole ’14
Wszelkie uwagi i zapytania mo¿na kierowaæ na adres:
[email protected] lub [email protected]
tel. 77 401 60 42
fax 77 401 60 51
1386 Varia
GUIDE FOR AUTHORS
A digital version of the manuscript should be sent to:
Prof dr hab. Witold Wac³awek,
Editor-in-Chief of Ecological Chemistry and Engineering A
Uniwersytet Opolski
ul. kard. B. Kominka 6
45–032 Opole
Poland
phone +48 77 401 60 42, +48 77 455 91 49
fax +48 77 401 60 51
email: [email protected]
The Editor assumes, that an Author submitting a paper for publication has been
authorised to do that. It is understood the paper submitted to be original and
unpublished work, and is not being considered for publication by another journal. After
printing, the copyright of the paper is transferred to Towarzystwo Chemii i In¿ynieriiEkologicznej (Society for Ecological Chemistry and Engineering).
“Ghostwriting” and “guest authorship” are a sign of scientific misconduct. To
counteract them, please provide information, for the Editor, on the percentage
contribution of individual Authors in the creation of publications (including the
information, who is the author of concepts, principles, methods, etc.). Editorial Board
believes that the main responsibility for those statements bears the Author sending the
manuscript.
In preparation of the manuscript please follow the general outline of papers published
in Ecological Chemistry and Engineering A, available on the website:
tchie.uni.opole.pl
a sample copy can be sent, if requested.
Papers submitted are supposed to be written in English language and should include
a summary and keywords, if possible also in Polish language.
Generally, a standard scientific paper is divided into:
– Introduction: you present the subject of your paper clearly, indicate the scope of the
subject, present state of knowledge on the paper subject and the goals of your paper;
– Main text (usually divided into: Experimental – you describe methods used;
Results and Discussion);
– Conclusions: you summarize your paper;
– References.
The first page should include the author’s (authors’) given name(s) without titles or
scientific degrees like Prof., Ph.D., etc., their affiliations, phone and fax numbers and
their email addresses however, with the corresponding author marked by an asterisk.
It is urged to follow the units recommended by the Systéme Internationale d’Unites(SI). Graph axis labels and table captions must include the quantity units.
Symbols recommended by the International Union of Pure and Applied Chemistry
(Pure and Appl Chem. 1979;51:1-41) are to be followed. Graphics (drawings, plots)
should be supplied in the form of digital vector-type files, eg CorelDraw v.9, Excel,
Inkscape or at least in a bitmap format (TIF, JPG) 600 DPI. In the case of any query
please feel free to contact with the Editorial Office. Footnotes, tables and graphs should
be prepared as separate files. References cited chronologically should follow the
examples given below:
[1] Lowe DF, Oubre CL, Ward CH. Surfactants and cosolvents for NAPL
remediation. A technology practices manual. Boca Raton: Lewis Publishers;
1999.
[2] Fasino CR, Carino M, Bombelli F. Oxidant profile of soy standardized extract.
In: Rubin R, Stryger CS, editors. Joint Meeting 2001 – Book Abstracts ‘2001
Year of Natural Products Research’. New York: Harper and Row; 2001.
[3] Wosiñski S. Effect of composition and processing conditions of ceramic and
polymer composites on the electric field shielding ability [PhD Thesis]. Poznañ:
Poznan University of Technology; 2010.
[4] Trapido M, Kulik N, Veressinina Y, Munter R. Water Sci Technol.
2009;60:1795-1801. DOI: 10.2166/wst.2009.585.
[5] Cañizares P, Lobato J, Paz R, Rodrigo MA, Sáez C. Chemosphere.
2007;67:832-838. DOI: 10.1016/j.chemosphere.2006.10.064.
[6] Hakala M, Nygård K, Manninen S, Huitari S, Buslaps T, Nilsson A, et al. J
Chem Phys. 2006:125:084504-1-7. DOI: 10.1063/1.2273627.
[7] Simeonov D, Spasov L, Simeonova P. Statistical calibration of model solution of
analytes. Ecol Chem Eng A. Forthcoming 2014.
Journal titles should preferably follow the Chem. Abst. Service recommended
abbreviations.
Each publication is evaluated by at least two independent reviewers from outside of
the unit.
Receipt of a paper submitted for publication will be acknowledged by email. If no
acknowledgement has been received, please check it with the Editorial Office by email,
fax, letter or phone.
1388 Varia

TECHNICAL EDITOR
Halina Szczegot
LAYOUT
Jolanta Brodziak
COVER DESIGN
Jolanta Brodziak
Druk: „Drukarnia Smolarski”, Józef Smolarski, 45–326 Opole, ul. Sandomierska 1. Objêtoœæ: ark. wyd. 11,50,
ark. druk. 9,00. Nak³ad: 350 egz. + 5 nadb. aut.