ECO 120 Macroeconomics Week 2 Aggregate Expenditures Model Lecturer Dr. Rod Duncan.
Upload
trace-ginnCategory
view
222download
2
ECO120 MacroeconomicsRod Duncan
Lecture 3- Measuring GDP

Announcements
• Tutorials start this week. Tutorial allocations are on the Interact website under Resources.
• The assignment for Tutorial 1 is to print out your registration on the Course Compass webpage.
• Tuesday tutorials changed to C3-401 (upstairs in the Library).

What are the big questions?
• What drives people to study macroeconomics? They want solutions to problems such as:– Can we avoid fluctuations in the economy?– How can we make the economy grow faster?– Can we lower the unemployment rate?– Why do we have inflation?– How can we manage interest rates?– Is the foreign trade deficit a problem?

Economic output
• Gross domestic product- The total market value of all final goods and services produced in a period (usually the year).– “Market value”- so we use the prices in
markets to value things– “Final”- we only value goods in their final form
(so we don’t count sales of milk to cheese-makers- “intermediate goods”)
– “Goods and services”- both count as output

Nominal versus real GDP
• We use prices to value output in calculating GDP, but prices change all the time. And over time, the average level of prices generally has risen (inflation). – Nominal GDP: value of output at current
prices– Real GDP: value of output at some fixed set
of prices
Measuring GDP
• Are we 40 times (655/16) better off than our grandparents?
– Australian GDP in 1960- $15.6 billion– Australian GDP in 2000- $655.6 billion
• What are we forgetting to adjust for?
Measuring GDP
• Population- Australia’s population was 10 million in 1960 and 19 million in 2000.– GDP per person in 1960 = $15.6 bn / 10m
= $1,560– GDP per person in 2000 = $655.6 bn / 19m
= $34,500
• Prices- $1,000 in 1960 bought a better life-style than $1,000 in 2000.

Nominal versus real GDP
• So how to correct for rising prices over time?– Measure average prices over time (GDP
deflator, Consumer Price Index, Producer Price Index, etc)
– Deflate nominal GDP by the average level of prices to find real GDP
Real GDP = Nominal GDP / GDP Deflator

Some Australian economic historyAustralian GDP 1950-1995
0
100 000
200 000
300 000
400 000
500 000
600 000
1950 1960 1970 1980 1990 2000
Mil
lio
n A
$
GDP
GDP Change
Real GDP

Measuring GDP
• Real GDP -If we instead use 1996-1997 prices to calculate GDP then Australia GDP in 1960 was $138 billion while Australian GDP in 2000 was $631 billion.
• Real GDP per person– 1960: $138bn/10m = $13,800– 2000: $631bn/19m = $33,200
• So we are 2.5 times better off than our grandparents.

Measures of economic output
• Gross domestic product- The total market value of all final goods and services produced in a period (usually the year) within a country.
• Gross national product- The total market value of all final goods and services produced in a period (usually the year) by Australians. – So an Australian lawyer working overseas for 6
months would include his overseas earnings as Aussie GNP but not Aussie GDP.
• Important: GDP/GNP figures use “market prices” to value things and do not count intermediate goods.

Why measure GDP?
• What are the goals of economics?– Answer: Achieve the greatest happiness (welfare or
utility) for individuals in society.– Problem: We can’t measure happiness.
• Second best: We measure the resources and opportunities available to members of society.– We assume that happiness is related to the range of
choices individuals have within society. The more choices people have, the more likely they are to find a choice they are happy with.
Why measure GDP?
• We can’t measure the range of choices, so we measure the value of what we produce and assume that a greater value of production meant that we had more opportunities.
• Paradox of happiness: Richer people report themselves as happier than poorer people around them. But average happiness in rich societies is not greater than average happiness in poor societies.– So how can we say we are measuring happiness
when more GDP does not make people happier?

Rod’s holiday snaps
• Rod was hired to write an economic survey of the Solomon Islands and Vanuatu.
• AusAID, which is a department of the Australian government (paid for by the Australian taxpayers), partly paid for the surveys.

Actually Madang (but reasonably close to Solomons/Vanuatu)
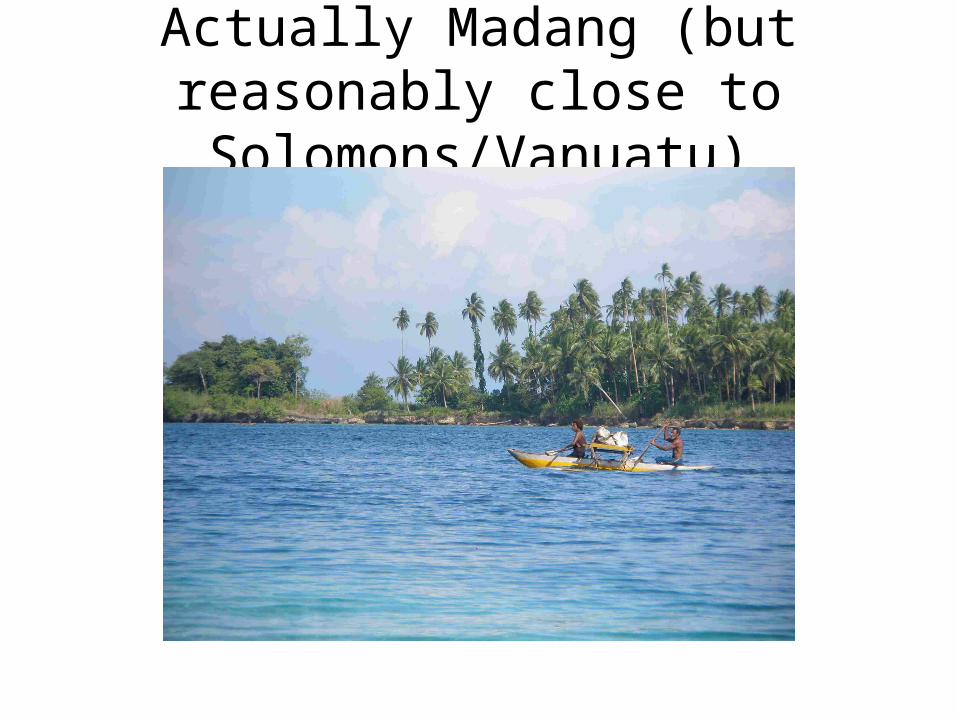
Actually Madang (but reasonably close to Solomons/Vanuatu)
So how do people fare living on an island paradise?
• Most of the population is subsistence farmers. Small garden plots can feed a whole family. There is no evidence of starvation and limited malnutrition.
• Survival is very easy. Food is relatively plentiful, and housing does not need to be sophisticated.
• However domestic, clan and political violence can be common- depending on the area.
• Political corruption is rampant. Public services- hospitals and education- are very limited.

How to describe an island paradise?
• We might talk about the number of people on the island. (Actually each country is made up of lots of little islands.)
• We might talk about the size of the island (land area).
• How crowded is it? We might talk about number of people per square km.
• Are people crowded into the city? We might talk about what fraction of the population lives in the urban areas.

Population and geography (in 2006)
Pop. Area (in sq. km)
Pop. / Area
Urban. (%)
SI 521,000 28,900 18 17%
Vanuatu 213,000 12,200 17.5 23%
Australia 20,700,000 7,741,200 2.7 Over 70%
Belgium 10,540,000 30,500 345.5 Over 70%
How well off are people in an island paradise? (income)
• We might measure the income of the people. We are assuming that more income means a population that is better cared for.
• We ask “how much do you earn?”• But are we really interested in how much a
country earns? What we want is how much the average person earns- “per capita”.

Gross national income (GNI)
Pop. GNI (in US$) GNI/Pop (in US$)
SI 521,000 $330,000,000 $690
Vanuatu 213,000 $370,000,000 $1,690
Australia 20,700,000 $742,250,000,000 $35,860
China 1,311,800,000 $2,620,950,000,000 $2,000

But where would you rather live?
• China has the largest GNI at $2.6 trillion US$.
• But Australia has a larger per capita GNI at $35,860 per person. Why?– Because Australia’s total GNI is split over 20
million people versus China’s 1.3 billion people.
• Is this the whole story?

Does income equal quality of life?
• One problem with using income per person is that money won’t buy the same things in different places.
• $500,000 will buy a spacious 5 bedroom house with a large lot in the best suburb in Bathurst. The same $500,000 will buy a small house in a poor suburb in Sydney.
• The same fact holds across countries. Economists try to correct for this by calculating “purchasing power parity” (PPP) GNI.

HDI Ranking
HDI Rank
Country Life expect. (years)
Adult Literacy (%)
Enrolment (%)
PPP GDP per capita (US$)
1 Iceland 81.5 99%+ 95% $36,510
3 Australia 80.9 99%+ 113% $31,794
81 China 72.5 91% 69% $6,757
120 Vanuatu 69.3 74% 63% $3,225
129 SI 63 77% 48% $2,031
177 Sierra Leone
41.8 35% 45% $860

Health statistics
Infant mortality (per 1,000 live births)
Under-five mortality (per 1,000 live births)
Probability of survival to age 65 (Fem/Male)
Maternal mortality (per 100,000 live births)
Australia 5 6 F: 92% M: 86%
4
China 23 27 F: 81% M: 74%
45
Vanuatu 31 38 F: 76% M: 68%
68*
SI 24 29 F: 64% M: 60%
220
Sierra Leone 165 282 F: 38% M: 30%
2,100

Does GDP = happiness?
• Citizens of richer countries generally:– Lead longer, healthier lives;– Are better educated and spend more years in
education;– Have more leisure time and opportunities;– Have greater levels of political participation;– Lead less risky lives from natural or man-made
disasters;– Breathe cleaner air and drink cleaner water;– …
• So perhaps asking people about their “happiness” is not the right question.
Does GDP = happiness?
• Principle of revealed preference– Definition: If I see someone choosing option A over
Option B, I assume that person is at least as happy with option A as option B.
• Fact: I observe millions of people risking their lives, their health and their wealth to leave low GDP countries to move to high GDP countries. I observe very, very few people moving in the opposite direction to better their lives.
• So does revealed preference tell us life is better in high GDP than in low GDP countries?