Eco Process Assistance - Melissa Foundation
15
Eco Process Assistance IIC-Universiteit Gent Technologiepark 3 - 9052 Gent (Zwijnaarde) Tel. (09) 241.56.18 Fax (09) 221.82.18 MELISSA ESTECKONTRACT ECT/FG/CB/95.205 TN 26.3 Optimisation of the Melissa substrate biodegradation II: Process control and optimisation March 1996 ir. Dries Demey Ing. Peter Van Meenen H.R. Gent 165.321 - BTW BE 447.422.101 - KB 441-0619121-21
Transcript of Eco Process Assistance - Melissa Foundation
Eco Process Assistance
IIC-Universiteit Gent
Technologiepark 3 - 9052 Gent (Zwijnaarde)
Tel. (09) 241.56.18
Fax (09) 221.82.18
MELISSA ESTECKONTRACT ECT/FG/CB/95.205
TN 26.3
Optimisation of the Melissa substrate biodegradation II:
Process control and optimisation
March 1996
ir. Dries Demey Ing. Peter Van Meenen
H.R. Gent 165.321 - BTW BE 447.422.101 - KB 441-0619121-21
TABLE OF CONTENTS
1. INTRODUCTION 1
2. EXPERIMENTS 1
2.1. Methanogenesis inhibition 1
2.2. Fed-batch experiments 2
2.3. Separation tests 5
2.4. Pathogenic organisms 5
2.4.1. Introduction 5
2.4.2. Determination procedure 5
3. RESULTS 6
3.1. Methane inhibition
3.2. Fed-batch experiments
3.3. Separation tests
3.4. Pathogenic organisms
4. CONCLUSIONS 10

LIST OF TABLES
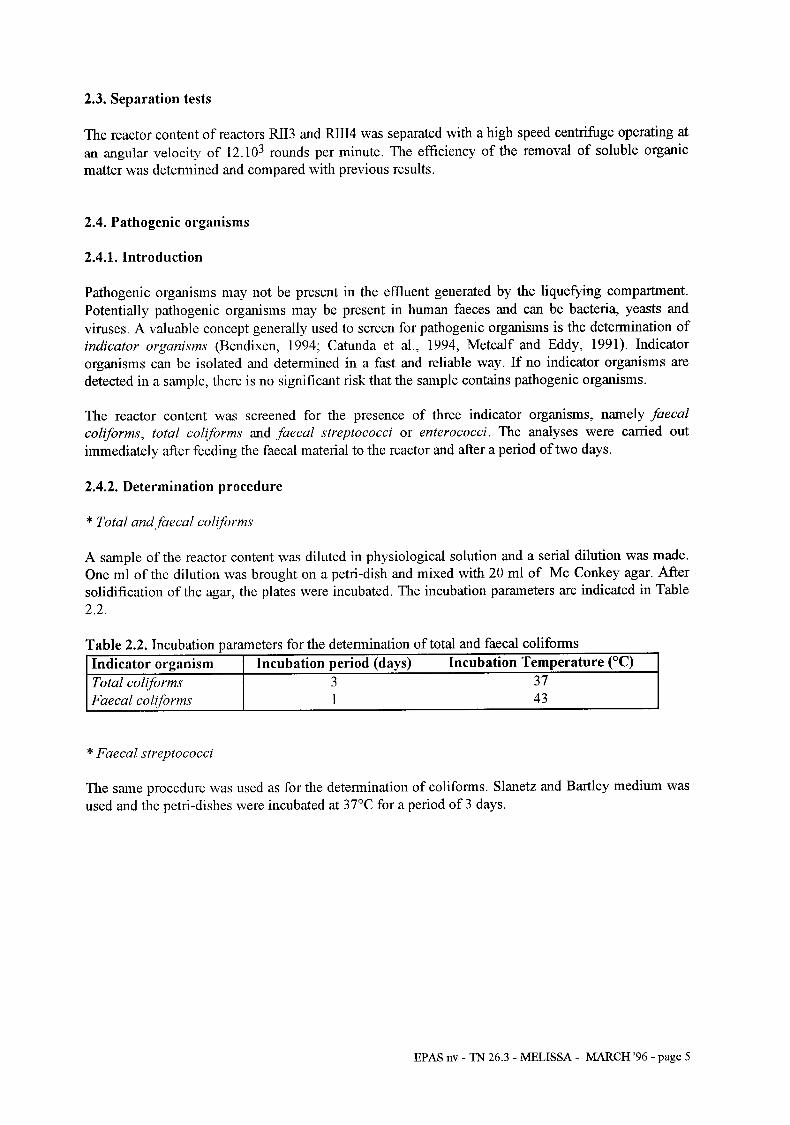
Table 2.1. Process conditions during the fed-batch experiments 3
Table 2.2. Incubation parameters for the determination of total and faecal coliforms 5
Table 3.1. Influence of ammonia on methanogenesis at pH = 7.5 and temp. = 55°C 7
Table 3.2. Process conditions and results obtained during the different process runs 8
Table 3.3. Partition of the centrifilged reactor content and removal effkiency of soluble compounds
by centrifkging 9
Table 3.4. Die-off of pathogenic organisms in a thermophilic (55°C) anaerobic reactor 9
LIST OF FIGURES
Figure 2.1. Schematic overview of the experiments 4
Figure 3.1. Relative amount of produced biogas and the methane and hydrogen content of the biogas
in function of the total ammonium and free ammonia concentration 6
Figure 3.2. Fatty acid composition of the four different reactor contents and human faeces. 8

Eco Process Assistance
IIC-Universiteit Gent
Technologiepark 3 - 9052 Gent (Zwijnaarde)
Tel. (09) 241.56.18
Fax (09) 221.82.18
1. INTRODUCTION
TECHNICAL NOTE 26.3
MARCH 1996
ir. Dries Demey
Ing. Peter Van Meenen
Based on the results retrieved during the first process run, reported in the technical notes TN 26.1 & TN 26.2, a preliminary mass balance was calculated. The biodegradation efficiency of proteins and total carbohydrates + lipids was equal to respectively 59 % and 40 %. Assuming that one third of the organic matter consists out of bacterial biomass, the biodegradation efficiency of non-bacterial
proteins and non-bacterial carbohydrates + lipids was equal to 89 % and 61 %, respectively.
The separation test described in TN 26.1 & TN 26.2 demonstrated the positive effect of the dilution of the reactor content on the separation efficiency of ammonia and volatile fatty acids. The separation efficiency of the centrifuging step was 62 % for ammonia and 74 % for volatile fatty acids. During the ultrafiltration step, 80 % of the ammonium and organic nitrogen passed the 8 urn membrane and 100 % of the volatile fatty acids. It wasn’t possible to separate the ammonium-nitrogen and the volatile fatty acids without remaining fractions of organic nitrogen.
The fed-batch and separation experiments were continued and results are reported in this technical note. Furthermore the inhibitive effect of free ammonia on the methanogenesis was studied by closed
bottle tests.
Some preliminary tests on the die-off of pathogenic organisms were also performed.
2. EXPERIMENTS
2.1. Methanogenesis inhibition
Closed bottle tests were performed to determine the concentration range at which ammonia-inhibition of the methanogenesis occurs. A thermophilic methauogenic inoculum obtained from reactor RI2 was fed with starch (1 g/l) and ammonium (as NH4Cl) in increasing concentrations up to 14 grams per liter. The pH was set at 7.5. Gas production and gas composition were measured.
The corresponding free ammonia concentration was calculated, using following equation:
[NJ531 = [ NH;+NHj 1
[ 1 H+
L 1 l+--
Ka
At 50°C K, equals 38.1 x lo-lo
H.R. Gent 165.321 - BTW BE 447.422.101 - KB 441-0619121-21
2.2 Fed-batch experiments
The experiments were performed in stirred fed-batch reactors as described in TN 26.1 & 26.2. Several steps can be distinguished in the fed-batch experiments, as summarised in Figure 2.1.
Reactors were fed every two days.
*Process run 1 (Reactor RU)
During the first process run, reported in TN 26.1 & 26.2, a microbial consortium was cultivated by
natural selection. After an acclimatisation period of two weeks, the reactor was fed with undiluted
human faeces. Biogas production and fermentation products were monitored in order to calculate a preliminary mass balance. The analytical dry matter content (DMA) of the reactor was equal to 12.9 %.
*Process run 2 (Reactor R12)
The reactor from process run 1 was diluted to 5.2 % analytical dry matter and fed with human faeces
which were diluted with water (ratio water/human faeces = 1.75). The dilution was necessary to
obtain an optimal separation of volatile fatty acids and ammonium using a centrifuge during process
run 3.
*Process Run 3 (Reactor RI3 + Reactor RII3)
The reactor content of the first reactor was divided over two reactors. Reactor RI13 was inoculated with an inoculum obtained from a thermophilic anaerobic reactor digesting garden, fruit and vegetable waste, in order to stimulate the cellulolytic activity. Reactor RI3 had the same reactor content as reactor lU2. Before feeding, 10 to 20 % of the reactor content of both reactors was centrifuged to
separate the soluble end products. The settled particulate material was fed again to the reactor together
with the human faeces, thus the residence time of the particulate material will be infinite.
*Process Run 4
A third mesophillic reactor (Reactor RL114) was set-up and is still in operation. Preliminary results are
reported. At the end of Process Run 3, the reactor content of reactor RI3 was divided in two reactors (Reactor RZ4 and Reactor RW4). Both reactors were fed with human faeces and the ammonium concentration of reactor IV was increased by adding urea. The reactors are still in operation and results will be reported in the next technical note.
The process conditions during the experiments are summarised in Table 2.1.
EPAS nv - TN 26.3 - MELISSA - MARCH ‘96 - page 2
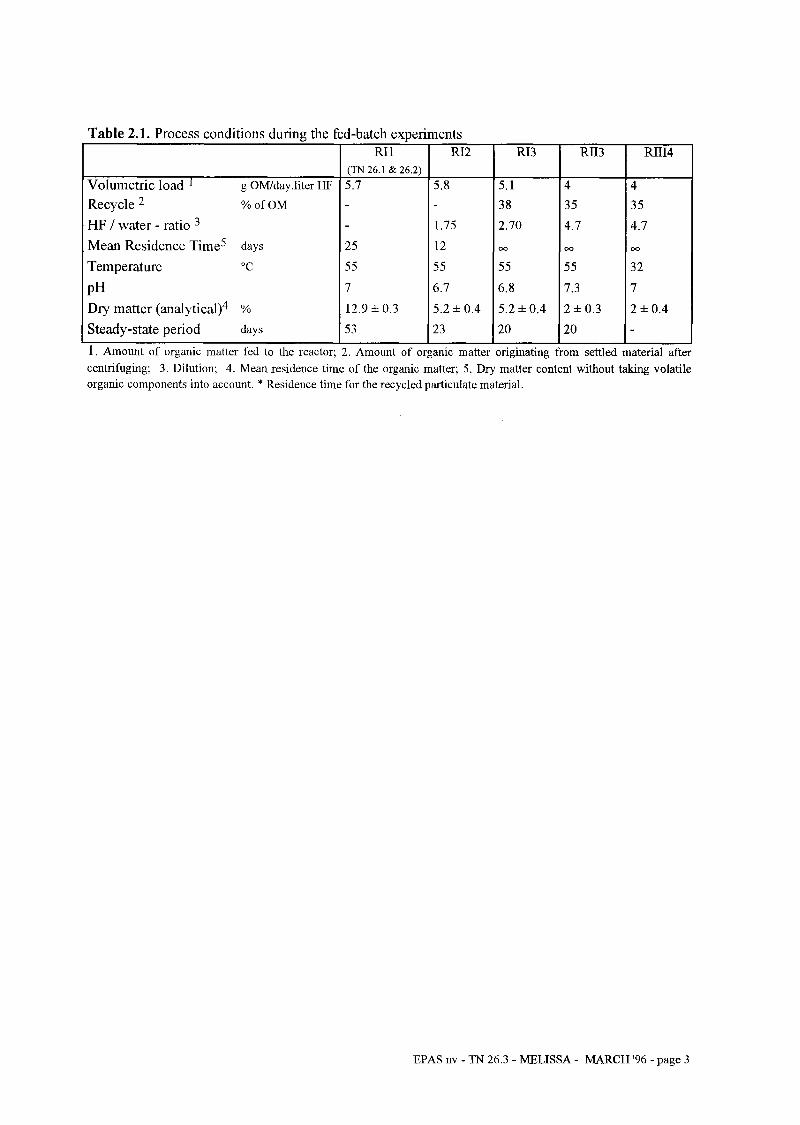
Table 2.1. Process conditions during the fed-batch experiments RI1 RI2 RI3 RI13 RI114
(TN 26.1 & 26.2)
Volumetric load 1 g OM/day.liter HF 5.7 5.8 5.1 4 4
Recycle 2 % of OM 38 35 35
HF / water - ratio 3 1.75 2.70 4.7 4.7
Mean Residence Time5 days 25 12 Co 00 00
Temperature “C 55 55 55 55 32
PH 7 6.7 6.8 7.3 7
Dry matter (analytical)4 % 12.9 f 0.3 5.2 f 0.4 5.2 f 0.4 2 f 0.3 2 f 0.4
Steady-state period days 53 23 20 20 - . 1. Amount of organic matter fed to the reactor; 2. Amount of organic matter originating from settled material after
centrifuging; 3. Dilution; 4. Mean residence time of the organic matter; 5. Dry matter content without taking volatile
organic components into account. * Residence time for the recycled particulate material.
EPAS nv - TN 26.3 - MELISSA - MARCH ‘96 - page 3

PROCESS RUN 1
(TN 26.1 & 26.2)
PROCESS RUN 2
(TN 26.1, 26.2 & 26.3)
PROCESS RUN 3
DILUTION
.:.:q::::::::\\ ,:,:,:,:,:,,,,,,,, :; ~~~~ . . . . . . :j:i::::::::::::::::::::::::::::::::::: ,.,.,.,.,.,.,.,.,.,.,...,...,..............~...~.~.~,~,~,.,~,~,~,~,~,~, :.:,:.: ,,,,.,:,:,:,:,:,:,:,: j:‘:.:.:.:‘:.:.:.:.:.:.:.:.:.:.:.:.:.:.:.:.:.:.:.:.~..: .,.,...,,,,: ,.,,.,,,,,,,,,,,,,,,.,.,,, ,,, ,,:, :: - Thermophk : 55°C : * Diluted feed : DMA = 5.2 % :i z (Human faeces) ( - Inoculum: autochtonous ;: - Recycle : NO :: * Experimental period : 23 days $ ::. . . . . . . . . . . . . . . . . . . . . . . . . ,., ..,.,.....c. :.;.:.:q::::: :I:.:.:.:.:.:.:.:.:.: :.: : : : : : ::: :y: ;y: .:.:. . . . . . . . . . . . . . . . . . . . . . . . . . . . . . . . . ..~.~...~. . . . . . . . . . . ,,,,,,,,,,,,:, ~; ,:,:,:.,,,.,.,., ,::::::::: : : : : : : : : :: ::::::::::: ::::::::::::::::::::::::::::: .,:,:,:,:,,,,,,,, .(.,.,.(.,.,.,.,.,. :::j:j:j:j:::::::::::::;:::$ l~~~~~:~~ :::.:::::::::::::::::::$;:;: .P... :x.,,,,,,,.,. ,.,.,..., . . . . . . .:.:.:.: . . . . . . ..v..
(TN 26.3) RECYCLING INOCULATION + RECYCLING
jj * Diluted feed : DMA = 5.2 % ii (Human faeces) j; - Inoculum: autochtonous j: - Recycle : YES
PROCESS RUN 4
NO ADDITION OF UREA
ntal period : i .,.,.,.,.,.,
. Diluted feed : DMA = 5.2 % i / (Human faeces) ; - Inoculum: autochtonous
- Recycle : YES * Experimental period : xx days
Figure 2.1. Schematic overview of the experiments
. Diluted feed : DMA = .2 %
Experiments in progress
ADDITION OF UREA
: * Diluted feed : DMA = 5.2 % ~ (H uman faeces + urea) j - Inoculum: autochtonous i - Recycle : YES
EPAS nv - TN 26.3 - MELISSA - MARCH ‘96 - page 4
3. RESULTS
3.1. Methane inhibition
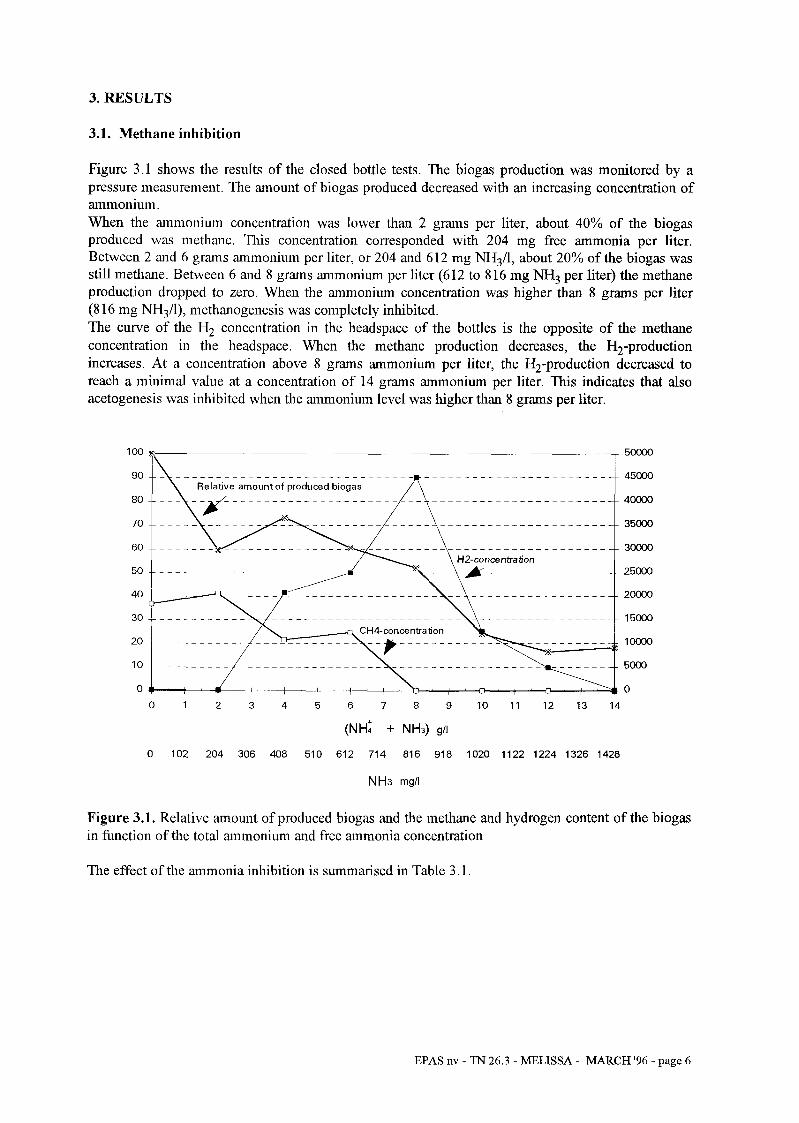
Figure 3.1 shows the results of the closed bottle tests. The biogas production was monitored by a pressure measurement. The amount of biogas produced decreased with an increasing concentration of ammonium.
When the ammonium concentration was lower than 2 grams per liter, about 40% of the biogas produced was methane. This concentration corresponded with 204 mg free ammonia per liter. Between 2 and 6 grams ammonium per liter, or 204 and 612 mg NH& about 20% of the biogas was still methane. Between 6 and 8 grams ammonium per liter (612 to 816 mg NH, per liter) the methane production dropped to zero. When the ammonium concentration was higher than 8 grams per liter (816 mg NH,& methanogenesis was completely inhibited.
The curve of the Hz concentration in the headspace of the bottles is the opposite of the methane
concentration in the headspace. When the methane production decreases, the Hz-production increases. At a concentration above 8 grams ammonium per liter, the Hz-production decreased to
reach a minimal value at a concentration of 14 grams ammonium per liter. This indicates that also acetogenesis was inhibited when the ammonium level was higher than 8 grams per liter.
H2-concentration
0 1 2 3 4 5 6 7 8 9 10 11 12 13 14
50000
45c00
4mo
35000
30000
25000
20000
15000
10000
5Om
0
(NH: + NH3) g/l
0 102 204 306 408 510 612 714 816 918 1020 1122 1224 1326 1428
NH3 mg/l
Figure 3.1. Relative amount of produced biogas and the methane and hydrogen content of the biogas
in function of the total ammonium and free ammonia concentration
The effect of the ammonia inhibition is summarised in Table 3.1.
EPAS nv - TN 26.3 - MELISSA - MARCH ‘96 - page 6

Table 3.1. Influence of ammonia on methanogenesis at pH = 7.5 and temp. = 55°C
Ammonium Ammonia Effect
< 2 g/l < 204 mg/l no inhibition 2 - 6 g/l 204 - 612 mg/l f 50 % inhibition 6 - 8 g/l 612 - X16mg/l 50 - 100 % inhibition
> 8 g/l > X16 mg/l 100 % inhibition
3.2. Fed-batch experiments
As reported in TN 26.1 and TN 26.2 reactor RI1 wra.s fed with undiluted faeces. It wasn’t possible to obtain an cfficicnt separation of the volatile fatty acids by centrifuging the reactor content. Therefore
the reactor content was diluted to 5.2 gram analytical dry matter per liter (Experiment R12). The biogas production during experiment RI2 was equal to 73 ml / gram organic matter fed. About 16 %
of the produced biogns was methane. The ammonium content ranged from 2.4 to 3.6 gram per liter.
After 20 days of stable processing. the reactor content was centrifuged (experiment R13) to separate successfully the volatile fatty acids and ammonium (see Point 3.3.). The mean ammonium
concentration in the reactor was equal to 2.2 gram per liter. About 50 ml of biogas per gram organic matter was produced. 28 % of the biogas was methane. Reactor RI13 which was inoculated with
thermophilic bacteria obtained from a organic waste digester, produced 180 ml gas per gram organic material fed. About 66 % of the biogas was methane. The ammonium content of the reactor was low,
namely 0.8 grams per liter. The production of biogas in the mesophilic reactor was equal to 35 ml per
gram organic matter fed.
About half of the organic matter present in the reactors RI1 and RI2 was soluble. Reactors RI3 and RI13 were containing a higher amount of particulate organic matter. This can be explained by the fact that the soluble material was separated by centrifilging and the non-hydrolysed material was recycled to the reactor. Only 35 % of the total organic matter present in reactor RI13 was soluble organic matter. This was due to the conversion of soluble organic matter into biogas. In spite of the inoculation with a consortium of bacteria with a high cellulolytic activity, the amount of particulate
organic matter present in this reactor stayed high. About 50 % of the organic matter present in the
mesophilic reactor was soluble.
The pH of the different reactors \vas very stable and no pH correction was needed. This can be explained by the fact that the reactor contents were strongly buffered.
In all cases volatile fatty acids \\crc formed. The composition of the volatile fatty acids of the four reactors and the human facccs is compared in Figure 3.2. The amount of each volatile fatty acid is expressed as a part of the total concentration (“A). About half of the total amount of volatile fatty acids present in faeces is acetic acid. Acetic acid is also the most important fatty acid in reactors RIl, RI2 and R13. R113 has a low amount of acetic acid, which can be explained by the conversion into methane. The second most important fatty acid in reactor RI1 is butyric acid, followed by iso-valeric and propionic acid. In the reactors RI2 and RI3, propionic acid, butyric acid and iso-valeric acid are the most important acids. The concentrations of valeric acid and capronic acid were low. The production pattern of volatile fatt! acids in the mesophilic reactor (RII14) was comparable with the thermophilic reactor R13. Tcmperaturc did not have any effect on the composition of the volatile fatty acids produced. The relative high amounts of propionic. butyric and valetic acid indicates that acetogenesis was not favoured.
EPAS nv - TN 26.3 - MELISSA - MARCH ‘96 - page 7

60
q Acetic
0 Propionic
q Iso-butyric
0 Butyric
n Iso-valeric
q Valerie
q Iso-capronic
Capronic
Faecal Reactor
material RI1
Reactor
RI2
Reactor
RI3
Reactor
RI13
Reactor
RI114
Figure 3.2. Fatty acid composition of the four different reactor contents and human faeces.
Table 3.2. Process conditions and results obtained during the different process runs.
RI1 RI2 RI3 RI13 RIII4 (TN 26.1 & 26.2) .,. .,. .,.,.,. ,.....,.,.... ,.,.....................................,.,., . . . . . . . . . . . . . . . . . . . . . . . . . . . . . . . . . . . . . . . . . . . . . . . . . . . . . . . . . . . . . . . . . . . . . ., ., ., ,., . .,., ,., ., ,., ,,,, ,.,
.~~;fS’c~~~::p~~~~~~~~~:::i., 5:: . . . . ” . . . . . . . . . . . . . . . . .:.::. . . . . . . ..,.,..,.,:,:,.::,:::::::::::::::::::::: :,::::,::‘:‘:.‘.‘:::‘:::::::::::::::: :.::.:.:.:.:.j:.:.:.:.:.: .,.,, ,........................ ..: ,j ,:,: :,, ,“:“““‘.‘y .:.:.:.:.............:...... .,.,.. . . . . :.:..: . . . . ./... ;, j .:;, ., ,:,.,.,.,.,.,. :.,.:.,.:.:.:.:.:.:.:.:.:.:.:.:.~~~~~~ .: .,...,.........................,.,......................... . . . . . . . . . . . . . ../.............. ..I
:~~~~~~~ri~~oad I ,, ‘.. ..:.. g OM/day. ,.v:.:.: .,.,. :.:.: .,.,.,,:: .,., .,.::.:. . . . . :. :‘.“‘::::,:,:,: ,.,.,.,.,, ,,,, ,, ,,, ,,,,,,,,,,,,,,,,,,,,:,:,:,:,: :‘,: : . . . . . . . . . . ::::::,. “‘.“.‘.:.‘.:.‘::::::::::::::::::::::::::::::::: ., ,..I.:.~:.:.:.:.:.:.:.:.:.:.:.:.:.:.:.:.:.:.:.:.~~: ..: ..,.,.,.,.,.,.,.,.,.,.,. j,7 :.:.::::::::::fi::... ..:.. . . . :: ,. 5,8 ., ,. . . . :.:.:.:.:.:.:.:.:.:.: 5.1 4 4
litcr HF Recycle 2 ‘%I of OM - 38 35 35
HF /water - ratio 3 1.75 2.70 4.7 4.7
Mean Residence Time days 45 X6 00 00 m
Temperature “C 55 55 55 55 32
PH 7 6.7 6.8 7.3 7
Dry matter (analytical) % 12.9 f 0.3 5.2 f 0.4 5.2 f 0.4 2 f 0.3 2 f 0.4 r: . ...//.... ,.,... iig&@F: :.;,,: Yijjj, ” :j:::“’ :‘:““““‘:;I::)X ; ,,::::; j;;z:j :, ,. : ,.,.,.,.,. . . . . . . . .:. ::. ..: ::. : . . ..: ,,,,,,,,,,,,,,,,,,,,,,,,,,’ ,.. ,. ,. ;. ,.,. ..,... ,.., .,.. ,.......(............ “.“.‘:‘.‘.‘.:.:.‘.‘.‘.‘.‘.‘.‘.‘.’.’.’.’. ,::,:., ,,, ,,:, ,..........,.,.,.,.,./,.,.,. ,.,.,.,.,.,.,.,.,.,.,.,.,.,.,.,.,.,.,.,.,.,.,.,.,............ ,. ,.,. ,.,. . . ., ,: ,:.:,.::,:... :.j:, ;, ,,, ,,,, j :,,:,,,, ,,,,,:, ,,, .i:: ..:..: .‘:j:~~.‘:‘.‘,:,:.:,:,:,:~: :.:,:,:,:,:,:::: :,: ,,,,:,:, .:.:.:.:.:.:.:.:.:.:. :.:.:.:.:.:.:.:.:.:.:.:.:.:.:.:.:.:.:.:.:.:.:.:.:.:.:.~~ ..:.....:.:.:.:.:.:.:.:.:.:.:.:.:.:.:.:.:.:.:.:.:.:.:.:.:.:. ,, . . . . . . . . . . . . . . . . . . . . . . . . . . . . . . . ..j.... :: ,,,:,: :,,::.’ ..:. . . . . .,., ,, ,, ,, ,,;: . . . . . . . ..A . . . . :.:.. . . . . . . . . . . . . . . . . . . . . . . . . . . . . . . . :.:.:,:.:.:(.:.:.:.:.~~~.~: ~j:.):.~:.:.:.::::::::::: .:. ..Y .,.,.,.,., . . . . . . . . . . .
ProductionS . . . . . ,.... .,.. .,.,. :.:.:.:.:.,.: .,.,.:, ~ .,.,... .,.,.,.,.,.,.,.,.,. :.,.: .j,.,.,.,.,.,.,.,.,.,(....... .::::::::::::::::::::::::::::::::::::::::::::::::::.:.:,:.~:
ml/g OM 30 73 f 13 51 f 15 1so*1s 35
Composition: CH4 ‘X, 0 16 f. 3 28 f 5 66 f 17 10 - 20
co2 ‘%, IO0 84 f 3 72 f 5 34 f 17 20 - 80
i~~~~~~~:~~.~centl:~~ ’ “I,:: ’ ,.,.,.,. .,. :. .‘: . ...:.:..: :.: ,.,., . . . . . . . . . . . . . . . . . . . . . . . . . . . . . . . . . . . . . . . . ,>, ,.: ,.,.,. :.: .,.,.,.,.,.,.,.,.,.,.,.,.,.,.,.,.,.,.,. . . . . . . . . . . . . . . . . . . . . . . . . . . . . . . . . . . . . . . ..:...:...: ,,, ,,,,,,,,:,,,:,.,.,. “““““.“’ : : ::. : :::
NH4+-Nitrogen
,,I 1, : ,::j; :;, .,,. fi~:y:::jlj::l~~~; I;j;;j;l;l;:;l:jj:ijiji:iiil;;iili::ji~~ jjji:jl:jljj~liiiiiiiiiiiiiiiiiii~~~ :iiii::i:.i.....jjj...j.i..:i...iiii..i~~
mg/l 6840 f 6&j 2460._ 3660 2240* .i”i’; ‘81’5..~.170 6 j3 * IO7
Organic Nitrogen q/l 3970 f 520 IX80 - 2780 1340 f 420 800 f 220 761+ 198
Total nitrogen ll@l I0450 f 790 5400 3580*430 1615h380 1394 f 225
Volatile Fatty Acids g/l 11.2 f 6.2 15 -20 13.1 f 1.6 2.3 f 0.60 5.1 f 1.2
% soluble OM6 ‘%, 50 54 45 35 52
NH4+-N / Total-N ‘%, 65 45 - 67 62 50 46 1 I ~~~~ Imrm ~~IIm L._,rm *lo- ‘ - Xm”Umo1 orgamc muuer 1eu 1” me reaLLor
2 Amount of organic matter originating from scttlcd material al’ter centrifuging
3 Dilution 4 Dry matter content without takin g volalilc 0rgunic components into account
5 Amount ofbiogas produced per amount ol’orgmlic matter fed
’ Percentage ol‘organic math \I liich is solrhlc
EPAS nv - TN 26.3 - MELISSA - MARCH ‘96 - page 8

3.3. Separation tests
Volatile fatty acids and the ammonia fomied in the anaerobic compartment must be separated from
the reactor content before these end products can flow to the second photoheterotrophic compartment. Reactors RI12 and RI113 had a analytical dry matter content equal to 2 %. The separation of ammonia
and volatile fatty acids was more eficient compared to the reactors with a higher dry matter content. The separation effkicncy of ammonium was equal to 73 % for reactor RI13 and 88 % for reactor RII14. Only 20 % of the organic nitrogen was separated from the reactor content. Volatile fatty acids were separated for 79 % from the reactor content of reactor RI13 and 88 % for reactor RII14.
Table 3.3. Partition of the centrifuged reactor content and removal efficiency of soluble compounds
RI1 RI3 RI13 Fun4
(TN 26.1 t 26.2) (TN 26.1 & 26.2)
54 68 84 87
by centrifuging
.A.. .A.. :j:: I :.:. :::.: 7 Volume supernatant 7
:.:.: . . . . :j:: 3 ..:. :.:.
1 27
I
Dry matter
WI4+-N
3rganic nitrogen
Volatile fatty acids
Acetic acid
Propionic acid
Iso-butyric acid
Butyric acid
Iso-valeric acid
9
46
45
48
70
50
39
40
35
21
62
24
74
76
74
74
73
73
73
24
79
81
79
81
77
72
25
88
17
89
88
60
56
86
60
Valerie acid 34 71 84 73
3.4. Pathogenic organisms
Table 3.4 shows the results of the experiment. Immediately after feeding total and faecal colifonns and faecal streptococci were determined in the reactor content. Afier a period of two days (without feeding) no indicator organisms were present anymore. This indicates that the reactor conditions were unfavourable for the survival of the indicator organisms. In future experiments more screenings will
be performed.
Table 3.4. Die-off of pathogenic organisms in a thermophilic (55°C) anaerobic reactor.
Indicator organism Sample immediately after 2 days after feeding
feeding Total coliforms 10” - lo> 0 Faecal coliforms lo2 - 10” 0 Faecal streptococci 10 - lo2 0
EPAS nv - TN 26.3 - MELISSA - MARCH ‘96 - page 9

4 CONCLUSIONS
Inhibitive concentrations of free ammonia towards methanogenesis were determined by closed-bottle experiments. Methanogenesis was completely inhibited at a concentration of 800 mg/l free ammonia. Based on the results received by the closed-bottle experiments, the ammonia concentration in the fed
batch reactors will be stepwise increased by adding urea to inhibit methanogenesis.
Several experiments with fed-batch reactors were performed. In a first step the reactor was fed with undiluted faeces (TN 26.1 & 26.2). The reactor had an analytical dry matter content of about 13 %. In steady-state conditions about 50 % of the organic matter was present in soluble form and about 65% of the total nitrogen was ammonium nitrogen. The soluble organic matter content of human faeces was equal to 30 “/o of the total organic matter and only 10 % of the total nitrogen was ammonia nitrogen. This means that in the reactor hydrolysis and acidification of the organic matter occurred. Proteins and carbohydrates and lipids were biodegraded for respectively 59 % and 89 %. Although it wasn’t possible to separate the produced volatile fatty acids and ammonia from the reactor content by
centritiging or filtration. In order to obtain an efficient separation of the biodegradation products, the
reactor content was diluted up to 5.2 % analytical dry matter content and fed with diluted human
faeces (Reactor R12). This had a positive effect on the separation efficiency of the end-products by means of a centrifuge. About 74 % of the volatile fatty acids and 62 % of the ammonium could be separated by centritiging the reactor content (Reactor R13). When the dry matter content of the reactor was equal to 2 %, the separation efficiency increased to about 85 % for volatile fatty acids and 80 % for ammonium. The settled material left after centrifuging was recycled to the reactor for further biodegradation. Besides volatile fatty acids and ammonium, also 24 % of the organic matter was still present in the supematant. At this moment it wasn’t possible yet to separate this fraction from the
supematant by filtration techniques. The soluble organic matter present in a reactor with recycling of
the settled material obtained after centritiging (reactor R13) was equal to 45 % which was lower than in the reactor without recycle (54 % in reactor R12). This indicates that the recycled material is slower biodegraded then the new fed human faeces. The ammonium nitrogen/total nitrogen-ratio in the thermophilic reactor with recycle was comparable with the undiluted rector and reactor without recycle (62 to 65 O/o). This indicates that proteins are better biodegraded than non-protein organic matter. Proteins are not accumulated in the reactor with recycle. In order to stimulate the biodegradation of carbohydrates and lipids, a reactor inoculated with an inoculum obtained from a thermophilic digester of fiuit, vegetable and garden waste was taken in operation (reactor RI13). In
this case a lower soluble organic matter content (35 %) was measured compared to the reactor without this inoculum (52 %). This was due to the higher conversion of volatile fatty acids to biogas (66 %
methane). The ammonium/total nitrogen-ratio was lower equal to 50 % and lower than the other reactors. This indicates that proteolysis was not that efficient as in the other reactors Besides the thermophilic reactors a mesophilic reactor was sttied. In the beginning the reactor was not operating
stable. After a period of three weeks a more steady state operation was reached. The reactor is still in operation. The percentage of soluble organic matter present in the mesophilic reactor was even higher than measured in the thermophilic reactor RlI3, but the ammonium/total nitrogen ration was lower. This indicates that biodegradation of carbohydrates was more efficient at mesophilic conditions, but that proteins are better biodegraded in themlophilic conditions. Further experiments are needed to confirm this hypothesis.
Reactors fed with human faeces and an increasing amount of urea in order to inhibit methanogenesis were started up.
EPAS nv - TN 26.3 - MELISSA - MARCH’96 - page 10
5 FUTURE ACTIVITIES
During the period April ‘95 - April ‘96 indicative information was obtained concerning the biodegradation efficiency of proteins, carbohydrates and lipids in thermophilic reactors fed with diluted and undiluted faeces and with or without recycling the material settled after centrifuging the
reactor content. It was proven that ammonium and volatile fatty acids were formed during the biodegradation of the human faeces.
The centrifuging experiments showed that it was possible to separate the formed biodegradation
products. Ultrafiltration of the supematant obtained from centrifuging was not successful up to this moment.
Preliminary experiments on the removal of pathogenic organisms showed that in thermophilic conditions, pathogenic indicator organisms were removed.
Based on the orientating tests obtained during the period April ‘95 - April ‘96, further research will be focused on following topics:
l The improvement of the biodegradation of the recalcitrant part of the human faeces present in the
recycle stream. l Effect of the addition of cellulose on the reactor feed l Evaluation of the pathogenity of the effluent from the anaerobic compartment l Separation of the end products formed during biodegradation
Improvement of the biodegradation
Based on the indicative results obtained from previous fed-batch experiments, the complete anaerobic biodegradation process will be designed using modelling techniques in order to predict and control the
operation of the fed-batch reactors. Important control parameters are the feeding rate, dilution ratio of
the feed, the recycle ratio and temperature.
Additionally treatments to improve the biodegradability of the recycled material will be taken in consideration. Finally a reactor will be designed to produce substrate which can be used for further characterisation and as a feeding substrate for the next compartments.
Addition qf cellulose
The biodegradation of the co-substrate cellulose together with human faeces will be first investigated
on small scale experiments (closed-bottle tests). Based on the results fed-batch experiments will be performed.
Evaluation of the pathogenity
The elimination of pathogenic organisms based on the screening of pathogenic indicator organisms will be studied in detail.
EPAS nv - TN 26.3 - MELISSA - MARCH ‘96 - page 11
ANGELIDAKI, I., ELLEGAARD, L., AHRING, B.K. (1993). A Mathematical Model for Dynamic Simulation of Anaerobic Digestion of Complex Substrates: Focusing on Ammonia Inhibition.
Biotechnology and Bioengineering, 42, 159-l 66.
ANGELIDAKI, I., AHRING B.K. (1993). Thermophilic anaerobic digestion of livestock waste: the effect of ammonia. Applied Microbiology and Biotechnology, 38, 560-564.
BENDIXEN, H. , J. (1994). Safeguards against pathogens in Danisch biogas plants. Water Science and Technology, 30-12, 171-180.
CATUNDA FRASSINEITI-CAVALCANTI P., VAN HAANDEL A., C., LETTINGA, G. (1994). Post treatment of anaerobically treated sewage in waste stabilization pocnds. In: Paper pre-prints of the Seventh International Symposium on Anaerobic Digestion, Cape Town, January 23-27, 1994,
South Africa, 405-4 15.
METCALF and EDDY (199 1). Wastewater engineering: treatment, disposal and reuse. McGraw-Hill, inc.
EPAS nv - TN 26.3 - MELISSA - MARCH ‘96 - page 12