Eco Dev 2 Summer 2011
28
The Development Gap and the Measurement of Poverty Chapter T wo
-
Upload
walid-mohamed-anwar -
Category
Documents
-
view
230 -
download
0
Transcript of Eco Dev 2 Summer 2011
7/26/2019 Eco Dev 2 Summer 2011
http://slidepdf.com/reader/full/eco-dev-2-summer-2011 1/28
The Development Gap and
the Measurement of Poverty
Chapter Two

7/26/2019 Eco Dev 2 Summer 2011
http://slidepdf.com/reader/full/eco-dev-2-summer-2011 2/28
Economic Growth versus Economic
Development:
1- Economic Growth:
• An increase in the real income (GDP) of an
economy.
• Economic growth has both benefits and costs.
• It can be measured by GDP growth rates or
GDP percapita growth rates.

7/26/2019 Eco Dev 2 Summer 2011
http://slidepdf.com/reader/full/eco-dev-2-summer-2011 3/28
Economic Growth Benefits and costs:
Benefits:Increases in economic growth should :
• enable more of everything to be produced.
•
Increases possibility of providing consumer goodsfor all.
• More consumer goods, etc. could be equated withan increase in living standards
• Wealth generated may eventually ‘trickle down’ tothose who are poor by means of incomedistribution – taxes and benefits, etc.
• Improvement in Welfare.
7/26/2019 Eco Dev 2 Summer 2011
http://slidepdf.com/reader/full/eco-dev-2-summer-2011 4/28
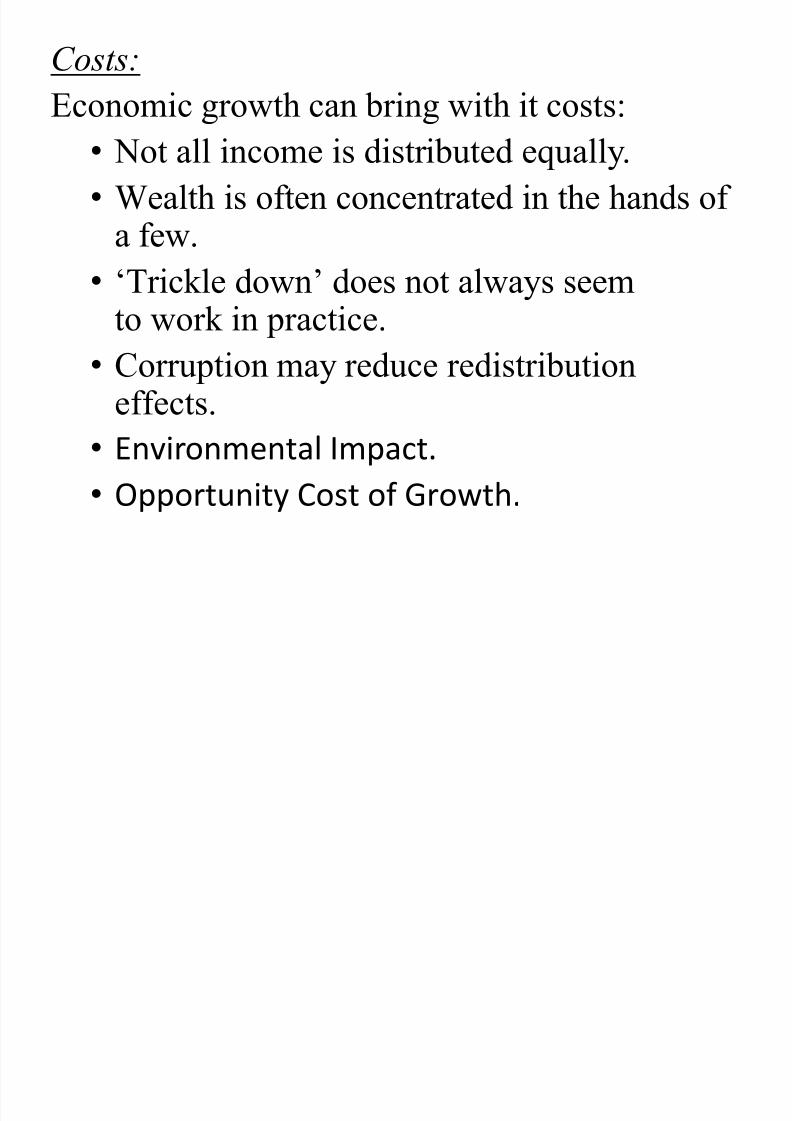
Costs:
Economic growth can bring with it costs:
• Not all income is distributed equally.
• Wealth is often concentrated in the hands ofa few.
• ‘Trickle down’ does not always seemto work in practice.
• Corruption may reduce redistribution
effects.• Environmental Impact.
• Opportunity Cost of Growth.

7/26/2019 Eco Dev 2 Summer 2011
http://slidepdf.com/reader/full/eco-dev-2-summer-2011 5/28
Opportunity Cost of Growth:
• Resource allocation
–Consumer Goods?
–
Capital Goods?• Necessity of generating growth through
allocating resources to the sources of growth –
capital goods.

7/26/2019 Eco Dev 2 Summer 2011
http://slidepdf.com/reader/full/eco-dev-2-summer-2011 6/28

7/26/2019 Eco Dev 2 Summer 2011
http://slidepdf.com/reader/full/eco-dev-2-summer-2011 7/28
http://www.bized.co.uk
Copyright 2007 – Biz/ed
Growth and Production Possibility
Frontiers
C1
Capital Goods
Consumer Goods
A
B
1. Economic growth when acountry is operating belowcapacity – more of both capital
and consumer goods are madeavailable as the economymoves from point A to point B
K1
K2
C2

7/26/2019 Eco Dev 2 Summer 2011
http://slidepdf.com/reader/full/eco-dev-2-summer-2011 8/28
http://www.bized.co.uk
Copyright 2007 – Biz/ed
Growth and Production Possibility Frontiers
C1
Consumer Goods
A
B
K1
K2
C2
2. Country operating at fullcapacity but discovers newresources or find ways ofimproving the efficiency of
existing resources, for example,education of the population toimprove the quality of humancapital.
Capital Goods
7/26/2019 Eco Dev 2 Summer 2011
http://slidepdf.com/reader/full/eco-dev-2-summer-2011 9/28
http://www.bized.co.uk
Copyright 2007 – Biz/ed
Growth and Production Possibility
Frontiers
C1 Consumer Goods
A B
K1
K2
C2
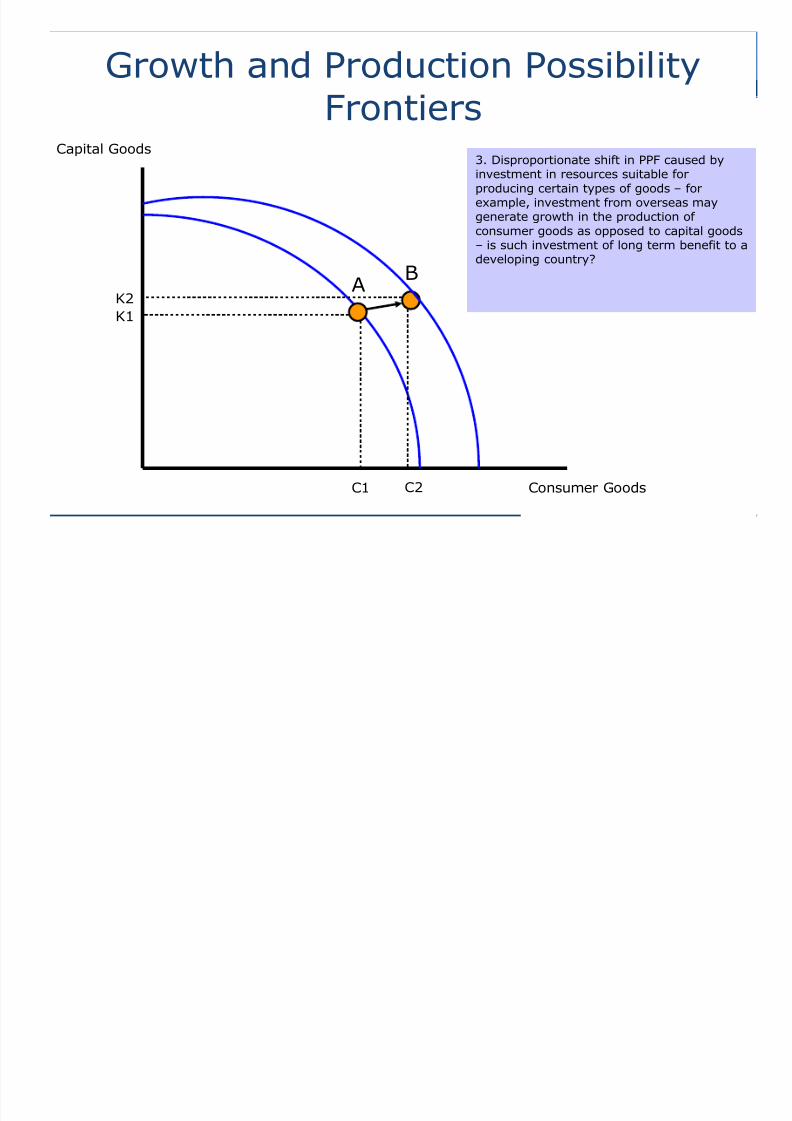
3. Disproportionate shift in PPF caused byinvestment in resources suitable for
producing certain types of goods – forexample, investment from overseas maygenerate growth in the production of
consumer goods as opposed to capital goods– is such investment of long term benefit to adeveloping country?
Capital Goods

7/26/2019 Eco Dev 2 Summer 2011
http://slidepdf.com/reader/full/eco-dev-2-summer-2011 10/28
http://www.bized.co.uk
Copyright 2007 – Biz/ed
Growth and Production PossibilityFrontiers
C2Consumer Goods
A
BK2
K1
C1
Capital Goods
4. Disproportionate shift in PPF as aresult of investment in resources thatfavour generation of capital goods –may not initially seem to have majorimpact on the standard of living of thecountry but may have long termbenefits in enabling more sustainablelong term growth.

7/26/2019 Eco Dev 2 Summer 2011
http://slidepdf.com/reader/full/eco-dev-2-summer-2011 11/28
Measurement of Economic Growth:
A- GDP or GDI:• The market value of all final goods and services
produced within a nation in a given year• basic measure of a country's economic performance .
i.e. the total value produced within a country
• GDP = private consumption + gross investment + government spending + ( exports − imports ),
• GDP = C + I + G + (X − M).• GDP = total output X market price

7/26/2019 Eco Dev 2 Summer 2011
http://slidepdf.com/reader/full/eco-dev-2-summer-2011 12/28
B- GDP or GPI percapita:
Per capita income means how much eachindividual receives, in monetary terms, of the
yearly income generated in the country.
GDP percapita = GDP/ population

7/26/2019 Eco Dev 2 Summer 2011
http://slidepdf.com/reader/full/eco-dev-2-summer-2011 13/28
When using per capita income (PCY)
figures to measure economic growth and
as an index of development in different
countries , we face 2 difficulties:
1. problem of national income accounting
in developing countries .
2. problem of converting each countries per capita income (PCY).

7/26/2019 Eco Dev 2 Summer 2011
http://slidepdf.com/reader/full/eco-dev-2-summer-2011 14/28
1- National income accounting :
• Only goods produced & sold in market are
included in the value of national income, most ofthe output in developing countries does not reach
the market particularly in rural sector , where
production for subsistence purposes .
• Growth rates is biased by using prices weights
when compiling national income totals from the
output statistics of different sectors of economy .
•
What price index to use as a deflator of moneynational income in order to obtain an index of real
income .
GDP deflator = nominal GDP / real GDP × 100

7/26/2019 Eco Dev 2 Summer 2011
http://slidepdf.com/reader/full/eco-dev-2-summer-2011 15/28
2- Problem of converting each countries
per capita income (PCY):
PCY in domestic currency has to be
converted into a common unit of account
( that is US $) so as to be able to makemeaningful international comparisons of
living standards . this lead to topic of
purchasing power parity (PPP) estimatesof (PCY).
7/26/2019 Eco Dev 2 Summer 2011
http://slidepdf.com/reader/full/eco-dev-2-summer-2011 16/28
Purchasing Power Parity:• A nation's GDP at purchasing power parity
(PPP) exchange rates is the sum value of allgoods and services produced in the countryvalued at prices prevailing in the United States.
• The most common way of constructing a PPPratio between two countries is to revalue thenational incomes of the two countries byselecting a comparable basket of goods andservices in each country and estimating thepurchasing -power equivalent of each item in
country A relative to country B.

7/26/2019 Eco Dev 2 Summer 2011
http://slidepdf.com/reader/full/eco-dev-2-summer-2011 17/28
Purchasing-Power Equivalent:
• IF “Pia “ is the price of item i in country “a”.
• “ Pib “ is the price of item i in country “b”.
• the purchasing power equivalent of item “i“ incountry “a” relative to country “b” is:
Pia/Pib

7/26/2019 Eco Dev 2 Summer 2011
http://slidepdf.com/reader/full/eco-dev-2-summer-2011 18/28
• By extending this calculation to all goods
and applying the price ratios to theaverage quantities consumed of each item
in the two countries, we obtain a formula
for the overall purchasing powerequivalent in country A relative to
country B.
∑QiPia / ∑QiPib

7/26/2019 Eco Dev 2 Summer 2011
http://slidepdf.com/reader/full/eco-dev-2-summer-2011 19/28
Suppose.....
• In the year 2008
– Turkish GNP=800 million TL
– Population=74 million
– Exchange rate:
1 USD = 1.6TL
National per capita income in USD =GNP/population ‚ exchange rate
7/26/2019 Eco Dev 2 Summer 2011
http://slidepdf.com/reader/full/eco-dev-2-summer-2011 20/28
Turkish real GNP per-cap in 2008 at
current US dollars will be;
800 / 74 ‚ 1.6 = 6,750

7/26/2019 Eco Dev 2 Summer 2011
http://slidepdf.com/reader/full/eco-dev-2-summer-2011 21/28
2- Economic Development:
A continuous and sustained rise in GDP of aneconomy in addition to major social and
political transformations in order to achieve
the three core values of development:• Life Sustenance.
• Self-Esteem.
• Freedom.

7/26/2019 Eco Dev 2 Summer 2011
http://slidepdf.com/reader/full/eco-dev-2-summer-2011 22/28
Measuring Economic Development:
United Nations Development Program(UNDP) has 2 alternative indexes tocompare the level of development & the
progress of countries :
• Human Development Index (HDI)
• Human Poverty Index ( HPI)

7/26/2019 Eco Dev 2 Summer 2011
http://slidepdf.com/reader/full/eco-dev-2-summer-2011 23/28
Human Development Index (HDI)
The HDI is a measure to summarize human
development.
It measures the average achievements in a
country, considering three basic dimensions of
human development (UNDP 2003):
• Health Indicator.
• Knowledge Indicator.
• Economic Growth Indicator.
7/26/2019 Eco Dev 2 Summer 2011
http://slidepdf.com/reader/full/eco-dev-2-summer-2011 24/28
A long and healthy life, as measured by lifeexpectancy at birth (Life Expectancy Index -LEI);
• Knowledge (Educational Attainment Index - EAI),as measured by the adult literacy rate (AdultLiteracy Index - ALI), which account for 2/3, and
the combined primary, secondary and tertiarygross enrolment ratio (ERI), which account for1/3 of the total amount;
• A decent standard of living, as measured by
GDPI (Gross Domestic Product per capita Index)given as Purchasing Power Parity US$ (PPPUS$).

7/26/2019 Eco Dev 2 Summer 2011
http://slidepdf.com/reader/full/eco-dev-2-summer-2011 25/28
• Before the HDI is calculated, an index needs to
be created for each of these dimensions. To
calculate these three dimension indices,minimum and maximum values are chosen for
each underlying indicator. Performance in
each dimension is expressed as a valuebetween 0 and 1.
•
The HDI is then calculated as a simple averageof each dimension indices.

7/26/2019 Eco Dev 2 Summer 2011
http://slidepdf.com/reader/full/eco-dev-2-summer-2011 26/28
• The life expectancy index (LEI ) measures the
relative achievement of a country in life
expectancy at birth.• The education index (EAI ) measures a
country’s relative achievement in both adult
literacy and combined primary, secondary andtertiary gross enrolment. First, an index for
adult literacy (ALI) and one for combined
gross enrolment (ERI) are calculated (data arereferred to the school year 2000/2001).

7/26/2019 Eco Dev 2 Summer 2011
http://slidepdf.com/reader/full/eco-dev-2-summer-2011 27/28
Then, these two indices are combined to create
the education index, adult literacy accounting
for 2/3 and the combined gross enrolmentaccounting for 1/3. For an example, with an
adult literacy rate of 85.3% and a combined
gross enrolment ratio of 69%, the education
index was 0.799.
Gross Domestic Product Index (GDPI)

7/26/2019 Eco Dev 2 Summer 2011
http://slidepdf.com/reader/full/eco-dev-2-summer-2011 28/28
Once the dimension indices have been
calculated, determining the HDI isstraightforward. It is a simple
average of the three dimension
indices