Echocardiographic Indices Do Not Reliably Track Changes in...
30
Echocardiographic Indices Do Not Reliably Track Changes in Left-Sided Filling Pressure in Healthy Subjects or Patients with Heart Failure with Preserved Ejection Fraction Bhella et al: E/E' & E/Vp Do Not Track Changes in PCWP in HFpEF Paul S. Bhella MD, John Peter Smith Health Network, Fort Worth, TX; Eric L. Pacini MD, Anand Prasad MD, Jeffrey L. Hastings MD, Beverley Adams-Huett MS, Univ of Texas-Southwestern, Dallas, TX; James D. Thomas MD, The Cleveland Clinic, Cleveland, OH; Paul A. Grayburn MD, Baylor University Medical Center, Dallas, TX; Benjamin D. Levine MD, Univ of Texas-Southwestern, Dallas, TX Correspondence to Benjamin D. Levine, MD Institute for Exercise and Environmental Medicine 7232 Greenville Ave, Suite 435, Dallas, TX 75231. Telephone: (214) 345-4619 Fax: (214) 345-4618 E-mail: [email protected] Journal Subject Codes: Congestive; Echocardiography Cl Cl Cl Cl Cl Cl Clev ev ev ev ev ev evel el el el el el elan an an an an an and, d, d, d, d, d, d, O O O O O O OH; H; H; H; H H H . Grayburn MD, Baylor University Medical Center, Dallas, T amin D. Levine MD, Univ of Texas-Southwestern, Dallas, T . Grayburn MD, Baylor University Medical Center, Dallas, T amin D. Levine MD, Univ of Texas-Southwestern, Dallas, T by guest on May 6, 2018 http://circimaging.ahajournals.org/ Downloaded from
-
Upload
dangkhuong -
Category
Documents
-
view
215 -
download
1
Transcript of Echocardiographic Indices Do Not Reliably Track Changes in...

Echocardiographic Indices Do Not Reliably Track Changes
in Left-Sided Filling Pressure in Healthy Subjects or Patients
with Heart Failure with Preserved Ejection Fraction
Bhella et al: E/E' & E/Vp Do Not Track Changes in PCWP in HFpEF
Paul S. Bhella MD, John Peter Smith Health Network, Fort Worth, TX;
Eric L. Pacini MD, Anand Prasad MD, Jeffrey L. Hastings MD,
Beverley Adams-Huett MS, Univ of Texas-Southwestern, Dallas, TX;
James D. Thomas MD, The Cleveland Clinic, Cleveland, OH;
Paul A. Grayburn MD, Baylor University Medical Center, Dallas, TX;
Benjamin D. Levine MD, Univ of Texas-Southwestern, Dallas, TX
Correspondence to Benjamin D. Levine, MD Institute for Exercise and Environmental Medicine 7232 Greenville Ave, Suite 435, Dallas, TX 75231. Telephone: (214) 345-4619 Fax: (214) 345-4618 E-mail: [email protected]
Journal Subject Codes: Congestive; Echocardiography
ClClClClClClClevevevevevevevelelelelelelelananananananand,d,d,d,d,d,d, O O O OOOOH;H;H;H;HHH
. Grayburn MD, Baylor University Medical Center, Dallas, T
amin D. Levine MD, Univ of Texas-Southwestern, Dallas, T
. Grayburn MD, Baylor University Medical Center, Dallas, T
amin D. Levine MD, Univ of Texas-Southwestern, Dallas, T
by guest on May 6, 2018
http://circimaging.ahajournals.org/
Dow
nloaded from
Abstract
Background In select patient populations, Doppler echocardiographic indices may be used to estimate left sided filling pressures. It is not known, however, whether changes in these indices track changes in left-sided filling pressures within individual healthy subjects or patients with heart failure with preserved ejection fraction (HFpEF). This knowledge is important as it would support, or refute, the serial use of these indices to estimate changes in filling pressures associated with the titration of medical therapy in patients with heart failure. Methods and Results Forty seven volunteers were enrolled: 11 highly screened elderly outpatients with a clear diagnosis of HFpEF, 24 healthy elderly subjects and 12 healthy young subjects. Each patient underwent right heart catheterization with simultaneous transthoracic echo. Pulmonary capillary wedge pressure (PCWP) and key echo indices (E/e’ & E/Vp) were measured at two baselines and during four preload altering maneuvers: lower body negative pressure (LBNP) -15 mmHg; LBNP -30 mmHg; rapid saline infusion of 10-15 ml/kg; and rapid saline infusion of 20-30 ml/kg. A random coefficient mixed model regression of PCWP vs. E/e’ and PCWP vs. E/Vp was performed for: 1) a composite of all data points; 2) a composite of all data points within each of the three groups. Linear regression analysis was performed for individual subjects. With this protocol, PCWP was manipulated from 0.8 to 28.8 mmHg. For E/e’, the composite random effects mixed model regression was PCWP = 0.58×E/e’+7.02 (p<0.001) confirming the weak but significant relationship between these two variables.Individual subject linear regression slopes (range: -6.76 to 11.03) and r2 (0.00 to 0.94) were highly variable and often very different than those derived for the composite and group regressions. For E/Vp, the composite random coefficient mixed model regression was PCWP = 1.95×E/Vp +7.48 (p=0.005); once again, individual subject linear regression slopes (range: -16.42 to 25.39) and r2 (range: 0.02 to 0.94) were highly variable and often very different than those derived for the composite and group regressions.Conclusions Within individual subjects the non-invasive indices E/e’ and E/Vp do not reliably track changes in left-sided filling pressures as these pressures vary, precluding the use of these techniques in research studies with healthy volunteers or the titration of medical therapy in patients with HFpEF. Key Words: echocardiography; pressure; ultrasonics; Doppler; heart failure
g; LBNP 30 mmmmmmmmm0-0-00000 30303030303030 mmmm m mml/l/l/l/l/l/l/kgkgkgkgkgkgkg. . A A A A A AA r rrrrrr
CWPPPPPPP v v v v v vvs.s.s.s.s.s.s E EEEEEE/V/V/V/V/V/V/Vp p p p ppp ww) a composite of ll d t i t 2)f ite of all data po
vh Hndom effects mixed model regression was PCWP = 0.58× /mc 0able and often very different than those derived for the comp
) a composite of all data points; 2) a composf ite of all data pogroups. Linear regression analysis was performed for indiv
his protocol, PCWP was manipulated from 0.8 to 28.8 mmHndom effects mixed model regression was PCWP = 0.58×E/ming the weak but significant relationship between these twct linear regression slopes (range: -6.76 to 11.03) and r2 (0.00able and often very different than those derived for the comp
by guest on May 6, 2018
http://circimaging.ahajournals.org/
Dow
nloaded from

Abbreviations:
CHF: congestive heart failure
EF: ejection fraction
E/e’: the ratio of the peak early mitral inflow velocity over the mean of the early diastolic
mitral annular velocity as measured at the septal and lateral mitral annulus
E/Vp: the ratio of the peak early mitral inflow velocity over the color M-mode Doppler
flow propagation velocity
HFpEF: heart failure with preserved ejection fraction
LAP: left atrial pressure
LBNP: lower body negative pressure
PCWP: pulmonary capillary wedge pressure
TDI: tissue Doppler imaging
r2: coefficient of determination
SE: standard error of the estimate
d
a
p
dy negative pressure
ary capillary wedge pressure
pler imaging
by guest on May 6, 2018
http://circimaging.ahajournals.org/
Dow
nloaded from

Several modalities of echocardiography including Doppler, tissue Doppler and color-M-
mode have shown promise in the estimation of left-sided filling pressures. Two indices:
a) the ratio of the peak early mitral inflow velocity over the early diastolic mitral annular
velocity (E/e’) 1; and b) the ratio of the peak early mitral inflow velocity over the color
M-mode Doppler flow propagation velocity (E/Vp) 2 have received recognition for their
utility in the one-time estimation of left sided filling pressures in healthy subjects 3 as
well as select patient populations with cardiovascular disease 4,5,6,7,8. Accordingly, their
application in the diagnosis of diastolic heart failure has been recommended by the
European Society of Cardiology 9. Conversely, these indices have proven to be less
reliable in alternate populations including primary mitral regurgitation 8, mitral stenosis 10,
symptomatic hypertrophic cardiomyopathy 11 and most recently, decompensated
advanced systolic heart failure 12, calling into question their broad applicability.
It has been proposed that non-invasive indices of left-sided filling pressures be used to
titrate medical therapy in patients with heart failure 4, 7, 13. Doing so would require
demonstration that changes in non-invasive indices accurately track changes in left-sided
filling pressures within individuals as filling pressures vary. To accomplish this goal, we
sought to make multiple, simultaneous measures within individual subjects as preload
was manipulated using lower body negative pressure and rapid saline infusion. Study
groups included healthy subjects across a broad age range and elderly outpatients with
heart failure with preserved ejection fraction (HFpEF).
n recommendededededededd
havevevevevevev p p p p p pprorororororooveveveveveveven n n n n n n ttttotott
a r
p a
c i
ate populations including primary mitral regurgitation 8, mitr
pertrophic cardiomyopathy 11 and most recently, decompensa
c heart failure 12, calling into question their broad applicabilia
by guest on May 6, 2018
http://circimaging.ahajournals.org/
Dow
nloaded from

Methods
Subjects
Three study groups were evaluated: 1) elderly outpatients with heart failure with
preserved ejection fraction (HFpEF) (n=11); 2) healthy elderly subjects (n=24); and 3)
healthy young subjects (n=12).
Patients over the age of 65 years with a discharge diagnosis of congestive heart failure
(CHF) were considered for the HFpEF group if they had a clear history of CHF by
Framingham criteria 14 with an ejection fraction (EF) > 50% documented at the time of
their index hospitalization. In addition, all HFpEF patients were required to have either
an elevated brain natriuretic peptide level (BNP), documented pulmonary congestion by
chest X-ray or evidence of elevated left sided filling pressures by right heart
catheterization at the time of their index hospitalization. Exclusion criteria included other
conditions that might explain the hospitalization, including the presence of atrial
fibrillation at the time of the hospitalization, prior coronary artery bypass grafting
(CABG), active myocardial ischemia, unrevascularized obstructive coronary disease
(>50% lesions by prior angiography), stable angina, recent (< 1 year) myocardial
infarction, renal failure (creatinine > 2.5 g/dl) or dialysis dependence, severe COPD/or
pulmonary disease, active malignancy, moderate or severe valvular heart disease, and
warfarin use. HFpEF patients enrolled in the study also participated in additional testing
beyond the scope of this manuscript; additional details regarding the screening of
HFpEF patients are available elsewhere15, 16.
documented aaaaaattttt t t t
were rererererererequququququququiririririririrededededededed t t t ttt to o
n n
v
t n
n natriuretic peptide level (BNP), documented pulmonary con
vidence of elevated left sided filling pressures by right heart t
t the time of their index hospitalization. Exclusion criteria in
by guest on May 6, 2018
http://circimaging.ahajournals.org/
Dow
nloaded from

The healthy elderly study group consisted of subjects over the age of 65 used previously
in our research 17, 18. All elderly subjects were carefully screened for hypertension and
cardiac disease, including structural heart disease and hemodynamically significant
obstructive coronary disease, using a history and physical examination as well as resting
and post-exercise transthoracic echocardiograms. Additional exclusion criteria for this
group included the presence of valvular heart disease, atrial flutter or fibrillation, renal
insufficiency, chronic lung disease, regular cigarette smoking within the past 10 years or
the use of cardiovascular medications. The healthy young study group consisted of
subjects under the age of 50 used previously in our research 18. These subjects underwent
a similar screening protocol as the healthy elderly subjects described above.
All subjects signed an informed consent approved by the institutional review boards of
the University of Texas-Southwestern Medical Center at Dallas, Medical City Hospital,
Dallas, Texas, Doctors Hospital Dallas, Texas or Presbyterian Hospital of Dallas.
Experimental Protocol
Subjects were studied in the resting supine or left lateral position. A 6 Fr balloon-tipped
fluid-filled catheter (Edwards Lifesciences, Irvine, California) was placed with
fluoroscopic guidance through an antecubital vein into the pulmonary artery. The
catheter was connected to a physiologic pressure transducer with the zero reference point
placed 5.0 cm below the sternal angle. The wedge position of the catheter tip was
confirmed fluoroscopically and by the presence of an appropriate pulmonary capillary
. These subjejejejejejejecc
escriribebebebebebebed d ddddd abababababababovovovovovovove.e.eeeee
e w
f t
ed an informed consent approved by the institutional review
f Texas-Southwestern Medical Center at Dallas, Medical Cit
by guest on May 6, 2018
http://circimaging.ahajournals.org/
Dow
nloaded from

wedge pressure (PCWP) waveform. The PCWP balloon was inflated during data
collection at each loading condition; in between data collections, the balloon was deflated.
After 30 minutes of quiet supine rest, baseline data were collected. Cardiac filling was
then decreased using lower body negative pressure (LBNP) as previously described 19.
The levels of LBNP used were -15 and -30 mm Hg. Due to large body habitus limiting
use of the LBNP apparatus in 2 of the HFpEF subjects, head-up tilt at (20 and 40 or 60
degrees) was used instead of LBNP, with the pressure transducer zero position carefully
adjusted to the level of the right atrium documented by flouroscopy and
echocardiography. Five minutes into each level of cardiac unloading, three measures of
the mean PCWP were obtained at end-expiration using a previously described technique
20. These measurements were then averaged; Doppler echocardiography immediately
followed.
After release of the negative pressure (or return to supine position) and confirmed return
to hemodynamic baseline, cardiac filling was increased through a rapid infusion of warm
(37°C) isotonic saline solution at 100-200 mL/min. The above measures were repeated
after the infusion of 10-15 mL/kg and 20-30 mL/kg with smaller volumes generally used
in the HFpEF patients to keep the PCWP < 25 mmHg and to avoid inducing pulmonary
edema.
oscopy and
nloadididididididingngngngngngng, ,, , , , , thththththththrererererereree e eeeee m
e
r m
were obtained at end-expiration using a previously describe
rements were then averaged; Doppler echocardiography imm
by guest on May 6, 2018
http://circimaging.ahajournals.org/
Dow
nloaded from

Echocardiography
For all subjects, at each level of cardiac loading and unloading, a transthoracic
echocardiogram was obtained using an ATL (Advanced Technology Laboratories,
Bothell, Washington) HDI 5000CV (software version 10.1) or an iE33 (Philips
Healthcare, Bothell, WA) ultrasound machine. Traditional apical 4- and 5- chamber
views were used for all measures. Care was taken to obtain all images in the traditional
imaging planes by an experienced echocardiographer. All images were evaluated blindly
offline by an experienced sonographer in the Cleveland Clinic echo core laboratory; this
reader was unaware of the resultant changes in PCWP associated with preload
manipulation.
Doppler Measurements
Similar to measurements of the PCWP, all Doppler indices were obtained at end-
expiration with three values averaged per stage of preload manipulation. Pulse-waved
Doppler, using a sample volume of 2.0 mm placed at the tips of the mitral
valve leaflets, was used to determine peak velocities of mitral inflow (E and A velocities).
For tissue Doppler measurements, the septal and lateral walls were highlighted in the
apical 4-chamber view. Using pulse-wave Doppler, a sample volume of 4.0 mm was
placed at the septal side of the mitral annulus; the resulting early diastolic waveform
velocity was recorded. This process was then repeated for the lateral side of the mitral
annulus. Values were averaged to obtain TDI emean21 which is abbreviated as e’
throughout the rest of the manuscript. A color M-mode image of left ventricular inflow
was obtained with the sampling area positioned to extend from mid-atrium to the apex,
ated with prelolooooooaa
r
u
rements
urements of the PCWP, all Doppler indices were obtained at
by guest on May 6, 2018
http://circimaging.ahajournals.org/
Dow
nloaded from

directly through the mitral valve orifice. The scale was reduced sufficiently to result in
clear aliasing within the early portion of the mitral inflow. The resulting mitral inflow
spatiotemporal velocity profile pattern was used to derive the early propagation velocity
of mitral inflow (Vp) as previously described 22.
Statistical Analysis
Numerical data are presented as mean ± standard deviation. Random coefficient mixed
models analysis was performed to estimate regression parameters between non-invasive
estimates of left-sided filling pressure (i.e. E/e’ and E/Vp) and invasive measures of left-
sided filling pressure (PCWP) in instances in which group data was comprised of
multiple data points from individual subjects, thereby accounting for the correlation
within individual subjects. Linear regression analysis was performed to estimate
regression parameters between non-invasive estimates of left-sided filling pressure and
invasive measures of left-sided filling pressure in instances in which: 1) group data was
comprised of single data points from individual subjects; or 2) a single subject’s data was
being regressed. Standard error of the estimate (SE) was determined for the slope
coefficient in each simple linear regression. As clinicians and researchers are generally
interested in estimating the PCWP by the non-invasive measures of E/e’ or E/Vp, PCWP
was set as the dependent variable and E/e’ and E/Vp as the independent variables in the
analyses except in the group data for each stage of preload manipulation. All analyses
were performed by use of commercial software (SigmaPlot 11.0, Systat Software. Inc,
Chicago, IL and SAS version 9.2, SAS Institute, Cary, NC).
d invasive meeeeeeeaasaaaaa
ata wawawawawawawas ss s s ss cocococococoompmpmpmpmpmpmpriririririririses
ints from individual subjects, thereby accounting for the co r
l m
m
ints from individual subjects, thereby accounting for the corr
l subjects. Linear regression analysis was performed to estim
meters between non-invasive estimates of left-sided filling pr
by guest on May 6, 2018
http://circimaging.ahajournals.org/
Dow
nloaded from
Results
Characteristics for each of the three study groups are presented in Table 1. Additional
characteristics of the HFpEF patients 15, 16, healthy elderly subjects 17, 18 and healthy
young subjects 18 can be found elsewhere.
Alterations in Preload
The mean PCWP, mean E/e’ and mean E/Vp (± standard deviation) by group for each
stage of preload manipulation are presented in Figure 1. The application of LBNP at
levels of -15 and -30 mmHg lowered PCWP in each group; the rapid infusion of warm
saline at 10-15 and 20-30 mL/kg increased PCWP in each group. With this protocol, a
range of PCWP from 0.8 mmHg to 28.8 mmHg was achieved.
E/e’ and PCWP
In the composite of all subjects, the random coefficient mixed model regression was
PCWP = 0.58×E/e’+7.02 (p<0.001) (Table 2); this relationship was based on 267 paired
measurements of E/e’ and PCWP (Figure 2). The linear regression slopes of the 47
individual subjects who comprised this composite varied greatly, ranging from -6.76 to
11.03. Individual coefficients of determination (r2) also varied greatly, ranging from 0.00
to 0.94.
In healthy subjects, group random coefficient mixed model regression slopes ranged from
0.07 in the young group to 0.93 in the elderly group. Within the individual subjects who
comprised these groups, linear regression slopes ranged from negative to steeply positive
he rapid infusioioioioioioion
oup. . . W WWWWWWititititittith h h h h h thththththththisisisisisisis p
f
P
from 0.8 mmHg to 28.8 mmHg was achieved.
P
by guest on May 6, 2018
http://circimaging.ahajournals.org/
Dow
nloaded from
and r2 ranged from low to high. Based on linear regression slopes, in 10 healthy subjects
changes in E/e’ and PCWP were discordant (E/e’ decreased as PCWP increased) whereas
in the other 24, changes were concordant.
Using only baseline measures, the HFpEF group’s linear regression was PCWP =
0.52×E/e' + 6.85 (p=0.04, r2 = 0.42, SE = 1.99) (Figure 3). However, with preload
manipulations the linear regression slopes of the individual HFpEF patients varied greatly,
ranging from -1.44 to 4.42. Likewise, individual HFpEF patient r2 varied from 0.01 to
0.82. Based on linear regression slopes, in 3 HFpEF patients changes in E/e’ and PCWP
were discordant whereas in the other 8, changes were concordant. To further
characterize these relationships, the linear regression slopes of E vs. PCWP and e’ vs.
PCWP in individual HFpEF patients are presented in Figure 4.
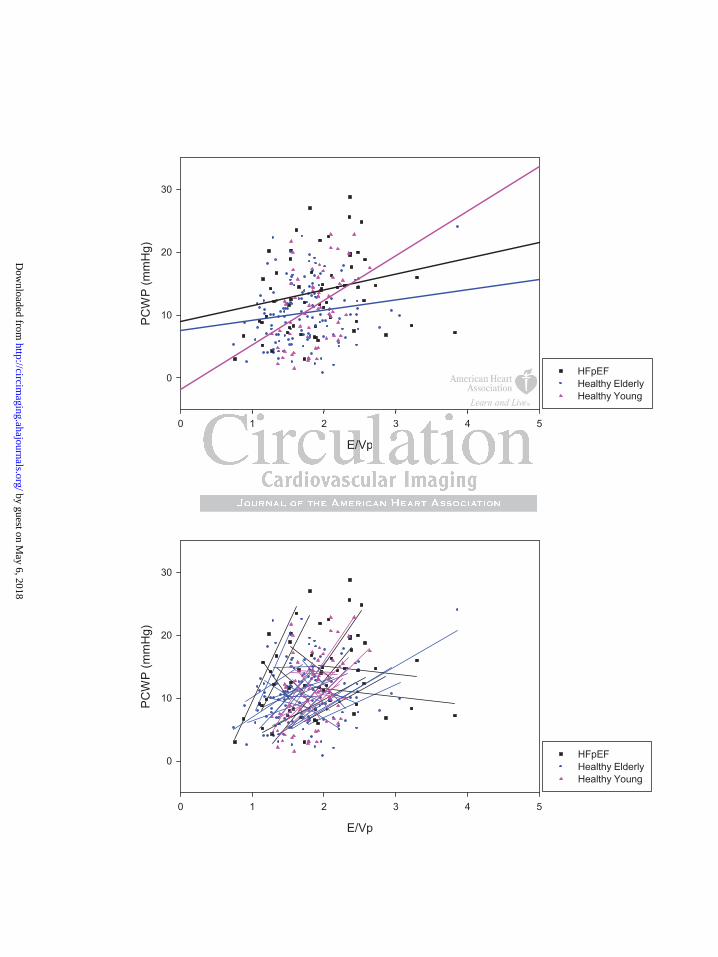
E/Vp and PCWP
In the composite of all subjects, the random coefficient mixed model regression was
PCWP = 1.95×E/Vp +7.48 (p=0.005) (Table 3); this relationship was based on 256 paired
measurements (Figure 5). Within this composite, the linear regression slopes of 46
individual subjects ranged from -16.42 to 25.39 while r2 ranged from 0.00 to 0.94.
In healthy subjects, group random coefficient mixed model regression slopes ranged from
1.64 in the elderly group to 7.07 in the young group; in HFpEF patients, this group
regression slope was 2.51. Once again, within the individual subjects who comprised
these groups, linear regression slopes ranged from steeply negative to steeply positive
changes in E/E//////eeeeeee
dant.t.t.t.t.t.t T T T T T T To oo o ooo fufufufufufufurtrtrtrtrtrtrthhhhheheh
a
d
e relationships, the linear regression slopes of E vs. PCWP a
dual HFpEF patients are presented in Figure 4.
by guest on May 6, 2018
http://circimaging.ahajournals.org/
Dow
nloaded from

and r2 ranged from low to high. Based on linear regression slopes, in 12 healthy subjects
changes in E/Vp and PCWP were discordant whereas in the other 24, changes were
concordant; in HFpEF patients these numbers were 5 and 6, respectively.
Discussion
The key finding of this study is that as left-sided filling pressures are manipulated in
healthy individuals or in outpatients with HFpEF, the relationship between non-invasive
indices (E/e’ and E/Vp) and the PCWP is highly variable, with individual subject linear
regression slopes ranging from steeply negative to steeply positive and coefficients of
determination ranging from very low to very high. Consequently, non-invasive indices
do not adequately track changes in left-sided filling pressures as these pressures vary
within individual subjects.
Limitations of Non-Invasive Indices in the One-Time Estimation of Left-Sided
Filling Pressures
There are several known limitations of E/e’ and E/Vp in the one-time estimation of left-
sided filling pressures. Published linear regressions relating E/e’ and E/Vp with invasive
measures are generally derived from a composite of data points from individual subjects,
each data point representing a single, simultaneous measure of the non-invasive index
and PCWP. As each subject contributes only one paired measurement to the composite,
these regressions consequently reflect the relationship for the population rather than for
the individual subjects which comprise the population. For this reason population based
linear regressions often poorly predict left-sided filling pressures in individual subjects as
sitive and coefefefefefeffffi
entlly,y,y,y,y,y,y, nononononononon-nnnnnn inininininininvavavavavavavasi
y u
l
y track changes in left-sided filling pressures as these pressu
l subjects.
by guest on May 6, 2018
http://circimaging.ahajournals.org/
Dow
nloaded from

reflected by their wide confidence intervals. Furthermore, the utility of non-invasive
estimates of left sided filling pressure appears to be highly dependent on the population
studied. While non-invasive indices have been validated in populations of healthy
subjects as well as in select patients depressed systolic heart failure 2, cardiac
transplantation 4 , atrial fibrillation 5, sinus tachycardia 6 and hypertrophic
cardiomyopathy 7, others have shown that they fail to accurately estimate left-sided
filling pressures in patients with mitral valve disease 8, 10, symptomatic hypertrophic
cardiomyopathy 11 and decompensated advanced systolic heart failure 12.
Non-Invasive Indices Do Not Accurately Track Changes in Left-Sided Filling
Pressures
Despite these limitations, some have suggested that serial measures of non-invasive
indices might allow for the estimation of directional changes in left-sided filling pressures
in response to therapy or worsening of heart failure within an individual subject. This
thought is based on the presumption that changes in non-invasive indices should track
changes in invasive measures within individuals in accordance with population based
regressions 4, 7, 13. Our data refute this presumption. The group means (of E/e’ and E/Vp)
tended to track preload manipulation well (Figure 1) and our population-based random
coefficient mixed model regressions suggested a weak but significant relationship
between PCWP and E/e’ and PCWP and E/Vp (Figures 2, 4). However, as filling
pressures were manipulated in the individual subjects who comprised these groups,
significant variability was observed within individual subjects with regression slopes
ranging from steeply negative to steeply positive and coefficients of determination
in LeLeeeeeeftftftftftftft-S-SSSSSSidididididididededededededed F F F
m n
ow for the estimation of directional changes in left-sided fi l
mitations, some have suggested that serial measurd es of non-in
ow for the estimation of directional changes in left-sided fill
by guest on May 6, 2018
http://circimaging.ahajournals.org/
Dow
nloaded from

ranging from very low to very high. This broad variability demonstrates that E/e’ and
E/Vp are not able to accurately track changes in left-sided filling pressures in individual
patients.
To illustrate this point, our HFpEF group’s baseline linear regression (PCWP = 0.52×E/e'
+ 6.85 [p=0.04, r2 = 0.42, SE = 1.99]; Figure 3) is similar to previously published
regressions with the exception of a lower standard error of the estimate (SE), which has
ranged from 3.4 7 to 3.9 mmHg 1, 6 in prior studies. Yet despite this favorable group
baseline regression, as filling pressures were manipulated within the individual HFpEF
patients who comprised the group, E/e’ responded unpredictably with individual linear
regressions varying profoundly in terms of slope (patient slopes: -1.44, -1.34, -0.68, 0.19,
1.55, 1.73, 2.45, 2.65, 2.69, 3.83, 4.42) and coefficient of determination (range: 0.00 –
0.82). Examples of the primary data for PCWP, E and e’ in two HFpEF patients are
presented in Figure 6. In the top example, PCWP and E/e’ were concordant (the patient
with a slope of 4.42) while in the bottom example, the two were discordant (the patient
with a slope of -1.44). These examples illustrate the broad individual variability
observed with this index as preload is manipulated. Similar findings were observed
between PCWP and E/Vp in these HFpEF patients and between PCWP and E/e’ and
PCWP and E/Vp in our healthy subjects.
To better understand the limitations of E/e’ as an index to track changes in left-sided
filling pressures, individual linear regression slopes for E vs. PCWP and e’ vs. PCWP
were examined in HFpEF patients. As demonstrated in Figure 4, E showed a degree of
thin the indiviiiidududdddd
ably wwwwwwwititititititith h h h h h ininininininindididididididivivivvvvv d
i 4
2.65, 2.69, 3.83, 4.42) and coefficient of determination (ra g
s
ing profoundly in terms of slope (patient slopes: -1.44, -1.34
2.65, 2.69, 3.83, 4.42) and coefficient of determination (rang
s of the primary data for PCWP, E and e’ in two HFpEF pati
by guest on May 6, 2018
http://circimaging.ahajournals.org/
Dow
nloaded from

preload dependence that was generally similar among individual HFpEF patients.
Conversely, the response of e’, which also demonstrated a degree of preload dependence,
was highly variable between individual HFpEF patients with steeply elevated slopes in 5
patients and more mildly elevated slopes in the other 6. This degree of preload
dependence contrasts prior reports of the preload independence of e’ 1 falling more in line
with reports demonstrating a varying strength of relationship between e’ and left sided
filling pressures 3, 6, 7, 23. Of the two measures, the broad variability observed in the
denominator of E/e’ would appear to primarily account for the broad variability observed
in individual E/e’ slopes. As a collective, these observations illustrate the point that the
inter-individual slope of the preload manipulated E/e’ relationship is so highly variable
that it is impossible to reliably track changes in filling pressures in a given individual
without first establishing the slope of the relationship in that given individual. This is, of
course, impractical to perform in patients with clinical heart failure and hence,
demonstrates an important limitation of this index.
A limited number of studies have previously attempted to assess the feasibility of serial
measures of non-invasive indices to track changes in left-sided filling pressures
associated with medical therapy or exercise. Mullens et al examined the ability of the
non-invasive index E/Ea to track changes in filling pressures between admission and the
48 hour time point in 51 patients admitted to the intensive care unit with advanced
decompensated heart failure. Over the course of these 48 hours, the change in PCWP
ranged from -24 to 16 mmHg; however, the authors found no correlation between
absolute changes in the E/Ea ratio and PCWP 12. More recently, Maeder et al
illustrate the p ppppppoo
nshihip p p p p p p isisisisisisis s s s s s sso o o o o o o hihihihihihihighghghghghgg l
b n
b l
c
ble to reliably track changes in filling pressures in a given in
blishing the slope of the relationship in that given individual
cal to perform in patients with clinical heart failure and henc
by guest on May 6, 2018
http://circimaging.ahajournals.org/
Dow
nloaded from

demonstrated that E/e’ failed to reflect PCWP in exercising patients with heart failure
with normal ejection fraction 24. In another study, Dokainish et al correlated the change
in E/E’ with the change in PCWP in 9 patients hospitalized in the intensive care unit
before and after 48 hours of treatment with intravenous diuretics (n=5) and/or ionotropes
(n=8) 13. While these authors did show a correlation between change in PCWP and
change in E/E’ based on the group’s composite data, the linear regression slopes of the
individual subjects were not presented. Additional studies have also reported correlations
between changes in PCWP and changes in E/E’ 4, 7; however, again, the linear regression
slopes of the individual subjects who made up these populations were not presented,
calling into question the ability of these population based indices to accurately predict
changes in left-sided filling pressures within individual subjects.
Study Limitations
Although great care was taken to obtain all echocardiographic measures in traditional
imaging planes, subtle variations are often unavoidable and occasionally, representative
measures could not obtained or interpreted. Overall, subtle variation in imaging planes
was felt to be a random phenomenon which was equally distributed amongst all measures
obtained. There were few instances of unobtainable or uninterpretable measures. For
E/e’, only 15 of the 282 possible measures (5%) could not be obtained or interpreted; for
E/Vp, this number was 20 of the 276 possible measures (7%). Finally, we used PCWP as
a measure of left-sided filling pressures rather than directly measured left atrial pressure
(LAP). However previous studies have shown that in the absence of anatomic
obstruction between the pulmonary capillary and the left ventricle, PCWP correlates
ons were not ppppppprerrrrrr
icess t t tttto o oo o oo acacacacacacccucucucucucucurararararararattttetett l
iided filling pressures within individual subjects.
ns
by guest on May 6, 2018
http://circimaging.ahajournals.org/
Dow
nloaded from

closely with left ventricular end-diastolic pressure and is widely used as a surrogate for
LAP 23, 24.
Conclusion
As filling pressures are manipulated, the relationship between non-invasive indices (E/e’
and E/Vp) and the pulmonary capillary wedge pressure is highly variable in healthy
patients and patients with HFpEF, with individual subject linear regression slopes ranging
from steeply negative to steeply positive and coefficients of determination ranging from
very low to very high. Consequently, within individual subjects, non-invasive indices do
not reliably track changes in left-sided filling pressures, precluding the use of these
techniques in research studies with healthy volunteers or to titrate medical therapy in
patients with HFpEF.
ects, non invaasisisisisisisivv
ludiingngngngngngng t t t t t t thehehehehehee uu u uuuusesesesesesese o o f
h
p
earch studies with healthy volunteers or to titrate medical th
pEF.
by guest on May 6, 2018
http://circimaging.ahajournals.org/
Dow
nloaded from

Acknowledgements
We would like to acknowledge our research team for the invaluable contributions: Mrs.
Diane Bedenkop, Mr. Colin Connor, Mr. Daniel Creson, Mrs. Peggy Fowler, Mr. Cyrus
Oufi, Ms. Tiffany VanGundy and Dr. Murugappan Ramanathan.
Sources of Funding
This project was supported by the NIH (Grant R01 AG17479). Additional support for
statistical analyses was provided by the National Institutes of Health Clinical and
Translational Science Award (Grant UL1 RR024982).
Disclosures
None.
Disclosures
by guest on May 6, 2018
http://circimaging.ahajournals.org/
Dow
nloaded from

References
1. Nagueh SF, Middleton KJ, Kopelen HA, Zoghbi WA, Quiñones MA. Doppler tissue imaging: A noninvasive technique for evaluation of left ventricular relaxation and estimation of filling pressures. Journal of the American College of Cardiology. 1997;30:1527-1533
2. Garcia M, Ares M, Asher C, Rodriguez L, Vandervoort P, Thomas J. An index of early left ventricular filling that combined with pulsed doppler peak e velocity may estimate capillary wedge pressure. Journal of the American College of Cardiology. 1997;29:448-454
3. Firstenberg MS, Levine BD, Garcia MJ, Greenberg NL, Cardon L, Morehead AJ, Zuckerman J, Thomas JD. Relationship of echocardiographic indices to pulmonary capillary wedge pressures in healthy volunteers. Journal of the American College of Cardiology. 2000;36:1664-1669
4. Sundereswaran L, Nagueh SF, Vardan S, Middleton KJ, Zoghbi WA, Quiñones MA, Torre-Amione G. Estimation of left and right ventricular filling pressures after heart transplantation by tissue doppler imaging. The American Journal of Cardiology. 1998;82:352-357
5. Sohn D-W, Song J-M, Zo J-H, Chai I-H, Kim H-S, Chun H-G, Kim H-C. Mitral annulus velocity in the evaluation of left ventricular diastolic function in atrial fibrillation. J Am Soc Echocardiogr. 1999;12:927-931
6. Nagueh SF, Mikati I, Kopelen HA, Middleton KJ, Quinones MA, Zoghbi WA. Doppler estimation of left ventricular filling pressure in sinus tachycardia : A new application of tissue doppler imaging. Circulation. 1998;98:1644-1650
7. Nagueh SF, Lakkis NM, Middleton KJ, Spencer WH, III, Zoghbi WA, Quinones MA. Doppler estimation of left ventricular filling pressures in patients with hypertrophic cardiomyopathy. Circulation. 1999;99:254-261
8. Bruch C, Stypmann J, Gradaus R, Breithardt G, Wichter T. Usefulness of tissue doppler imaging for estimation of filling pressures in patients with primary or secondary pure mitral regurgitation. The American Journal of Cardiology.2004;93:324-328
9. Paulus WJ, Tschöpe C, Sanderson JE, Rusconi C, Flachskampf FA, Rademakers FE, Marino P, Smiseth OA, De Keulenaer G, Leite-Moreira AF, Borbély A, Édes In, Handoko ML, Heymans S, Pezzali N, Pieske B, Dickstein K, Fraser AG, Brutsaert DL. How to diagnose diastolic heart failure: A consensus statement on the diagnosis of heart failure with normal left ventricular ejection fraction by the heart failure and echocardiography associations of the european society of cardiology. European Heart Journal. 2007;28:2539-2550
10. Diwan A, McCulloch M, Lawrie GM, Reardon MJ, Nagueh SF. Doppler estimation of left ventricular filling pressures in patients with mitral valve disease. Circulation. 2005;111:3281-3289
11. Geske JB, Sorajja P, Nishimura RA, Ommen SR. Evaluation of left ventricular filling pressures by doppler echocardiography in patients with hypertrophic cardiomyopathy: Correlation with direct left atrial pressure measurement at cardiac catheterization. Circulation. 2007;116:2702-2708
The Americannnnnnn J J J J J
hun H-H-H-H-H-H-H G,G,G,G,G,G,G, K K K K K KKimimimimimimim H Hvelocity in the evaluation of left t i l di t li f ctionoSe ao 5S Appler estimation of left ventricular filling pressures in patient
velocity in the evaluation of left ventricular diastolic functionon. J Am Soc Echocardiogr. 1999;12:927-931 SF, Mikati I, Kopelen HA, Middleton KJ, Quinones MA, Zoestimation of left ventricular filling pressure in sinus tachycaon of tissue doppler imaging. Circulation. 1998;98:1644-165SF, Lakkis NM, Middleton KJ, Spencer WH, III, Zoghbi WAppler estimation of left ventricular filling pressures in patient
by guest on May 6, 2018
http://circimaging.ahajournals.org/
Dow
nloaded from

12. Mullens W, Borowski AG, Curtin RJ, Thomas JD, Tang WH. Tissue doppler imaging in the estimation of intracardiac filling pressure in decompensated patients with advanced systolic heart failure. Circulation. 2009;119:62-70
13. Dokainish H, Zoghbi WA, Lakkis NM, Al-Bakshy F, Dhir M, Quinones MA, Nagueh SF. Optimal noninvasive assessment of left ventricular filling pressures: A comparison of tissue doppler echocardiography and b-type natriuretic peptide in patients with pulmonary artery catheters. Circulation. 2004;109:2432-2439
14. McKee PA, Castelli WP, McNamara PM, Kannel WB. The natural history of congestive heart failure: The framingham study. N Engl J Med. 1971;285:1441-1446
15. Drazner MH, Prasad A, Ayers C, Markham DW, Hastings J, Bhella PS, Shibata S, Levine BD. The relationship of right- and left-sided filling pressures in patients with heart failure and a preserved ejection fraction. Circ Heart Fail. 2010;3:202-206
16. Prasad A, Hastings JL, Shibata S, Popovic ZB, Arbab-Zadeh A, Bhella PS, Okazaki K, Fu Q, Berk M, Palmer D, Greenberg NL, Garcia MJ, Thomas JD, Levine BD. Characterization of static and dynamic left ventricular diastolic function in patients with heart failure with a preserved ejection fraction / clinical perspective. Circulation: Heart Failure. 2010;3:617-626
17. Arbab-Zadeh A, Dijk E, Prasad A, Fu Q, Torres P, Zhang R, Thomas JD, Palmer D, Levine BD. Effect of aging and physical activity on left ventricular compliance. Circulation. 2004;110:1799-1805
18. Prasad A, Popovic ZB, Arbab-Zadeh A, Fu Q, Palmer D, Dijk E, Greenberg NL, Garcia MJ, Thomas JD, Levine BD. The effects of aging and physical activity on doppler measures of diastolic function. Am J Cardiol. 2007;99:1629-1636
19. Levine BD, Lane LD, Buckey JC, Friedman DB, Blomqvist CG. Left ventricular pressure-volume and frank-starling relations in endurance athletes. Implications for orthostatic tolerance and exercise performance. Circulation. 1991;84:1016-1023
20. Prasad A, Okazaki K, Zadeh AA, Dijk E, Fu Q, Thomas JD, Levine BD. Abnormalities of doppler measures of diastolic function in the healthy elderly are not related to alterations of left atrial pressure. Circulation. 2005;111:1499-1503
21. Sohn D-W, Chai I-H, Lee D-J, Kim H-C, Kim H-S, Oh B-H, Lee M-M, Park Y-B, Choi Y-S, Seo J-D, Lee Y-W. Assessment of mitral annulus velocity by doppler tissue imaging in the evaluation of left ventricular diastolic function. Journal of the American College of Cardiology. 1997;30:474-480
22. Popovic ZB, Prasad A, Garcia MJ, Arbab-Zadeh A, Borowski A, Dijk E, Greenberg NL, Levine BD, Thomas JD. Relationship among diastolic intraventricular pressure gradients, relaxation, and preload: Impact of age and fitness. Am J Physiol Heart Circ Physiol. 2006;290:H1454-1459
23. Nagueh SF, Sun H, Kopelen HA, Middleton KJ, Khoury DS. Hemodynamic determinants of the mitral annulus diastolic velocities by tissue doppler. J Am Coll Cardiol. 2001;37:278-285
24. Maeder MT, Thompson BR, Brunner-La Rocca H-P, Kaye DM. Hemodynamic basis of exercise limitation in patients with heart failure and normal ejection fraction. J Am Coll Cardiol. 2010;56:855-863
ft ventricular dddddddiiaddddddd eeeeeeejejejejejejejectctctctctctctioioioioioioion n n n n n n frfrfrfrfrfrfracacacacacacactttitititt ooooooo6266
adeh A, Dijk E, Prasad A, F Q, Torres P, Zhang R, Thomase ao, Popovic ZB, Arbab-Zadeh A, Fu Q, Palmer D, Dijk E, G e
MJ, Thomas JD, Levine BD. The effects of in and icamD Lane LD Buckey JC Friedman DB Blomqvist CG Left
adeh A, Dijk E, Prasad A, Fu Q, Torres P, Zhang R, Thomase BD. Effect of aging and physical activity on left ventriculaon. 2004;110:1799-1805 , Popovic ZB, Arbab-Zadeh A, Fu Q, Palmer D, Dijk E, Gre
MJ, Thomas JD, Levine BD. The effects of aging and physicameasures of diastolic function. Am J Cardiol. 2007;99:1629-D Lane LD Buckey JC Friedman DB Blomqvist CG Left
by guest on May 6, 2018
http://circimaging.ahajournals.org/
Dow
nloaded from

Table 1. Group Characteristics Variable HFpEF (n=11) Healthy Elderly (n=24) Healthy Young (n=12) Age (years) 73.0 ± 6.8 69.2 ± 3.4 32.3 ± 9.0 Female (%) 64% 46% 25% Height (cm) 162.4 ± 9.6 169.3 ± 10.5 179.2 ± 8.2 Weight (kg) 88.9 ± 21.3 69.5 ± 12.5 74.9 ± 15.9 Body Mass Index (kg/m2) 33.6 ± 6.7 24.1 ± 2.8 23.1 ± 3.4 Body Surface Area (m2) 1.99 ± 0.27 1.80 ± 0.21 1.90 ± 0.27 Peak VO2 (ml/kg/min) 13.7 ± 3.4 29.9 ± 9.8 40.6 ± 10.1 Data are presented as mean ± standard deviation
Table 2. Summary Data for Non-Invasive Index E/e'
Average (Min - Max) Average (Min - Max)HFpEF (n=11) 60 PCWP = 0.83*E/e' + 3.93 0.04 1.46 (-1.44 - 4.42) 0.38 (0.01 - 0.82)Healthy Elderly (n=24) 137 PCWP = 0.93*E/e' + 4.60 0.008 3.12 (-2.37 - 11.03) 0.42 (0.00 - 0.94)Healthy Young (n=12) 70 PCWP = 0.07*E/e' + 10.33 0.91 -1.31 (-6.76 - 6.35) 0.27 (0.00 - 0.76)All Subjects (n=47) 267 PCWP = 0.58*E/e' + 7.02 <0.0001 1.60 (-6.76 - 11.03) 0.37 (0.00 - 0.94)
Table 3. Summary Data for Non-Invasive Index E/Vp
Average (Min - Max) Average (Min - Max)HFpEF (n=11) 59 PCWP = 2.51*E/Vp + 9.02 0.16 4.70 (-16.33 - 24.65) 0.41 (0.02 - 0.94)Healthy Elderly (n=24) 135 PCWP =1.64*E/Vp +7.54 0.06 4.40 (-12.54 - 25.39) 0.27 (0.00 - 0.66)Healthy Young (n=11) 62 PCWP = 7.07*E/Vp - 1.90 0.003 3.89 (-16.42 - 20.04) 0.30 (0.00 - 0.87)All Subjects (n=46) 256 PCWP = 1.94*E/Vp + 7.48 0.005 4.35 (-16.42 - 25.39) 0.31 (0.00 - 0.94)
Group (n = subjects)
Paired Data
Points (E/e' & PCWP)
Group Random Coefficient Mixed Model
Regressionp Value
Range of Individual Linear Regression Slopes Within
Group
Range of Individual r2
Within Group
Group (n = subjects)
Paired Data
Points (E/Vp & PCWP)
Group Random Coefficient Mixed Model
Regressionp Value
Range of Individual Linear Regression Slopes Within
Group
Range of Individual r2
Within Group
137 PCWP = 0 93*E/e' + 4 60 0 008 3 12 ( 2 37 11 03) 0 42
a
e60 PCWP = 0.83*E/e' + 3.93 0.04 1.46 (-1.44 - 4.42) 0.38
gW
137 PCWP = 0 93*E/e' + 4 60 0 008 3 12 ( 2 37 11 03) 0 42
a for Non-Invasive Index E/e'
Average (Min - Max) Average60 PCWP = 0.83*E/e' + 3.93 0.04 1.46 (-1.44 - 4.42) 0.38
Paired Data
Points (E/e' & PCWP)
Group Random Coefficient Mixed Model
Regressionp Value
Range of Individual Linear Regression Slopes Within
Group
RangW
by guest on May 6, 2018
http://circimaging.ahajournals.org/
Dow
nloaded from

Figure Legends
Figure 1. E/e’ (top) and E/Vp (bottom) across filling pressures. Data represent group
means ± standard deviations at each stage of preload manipulation.
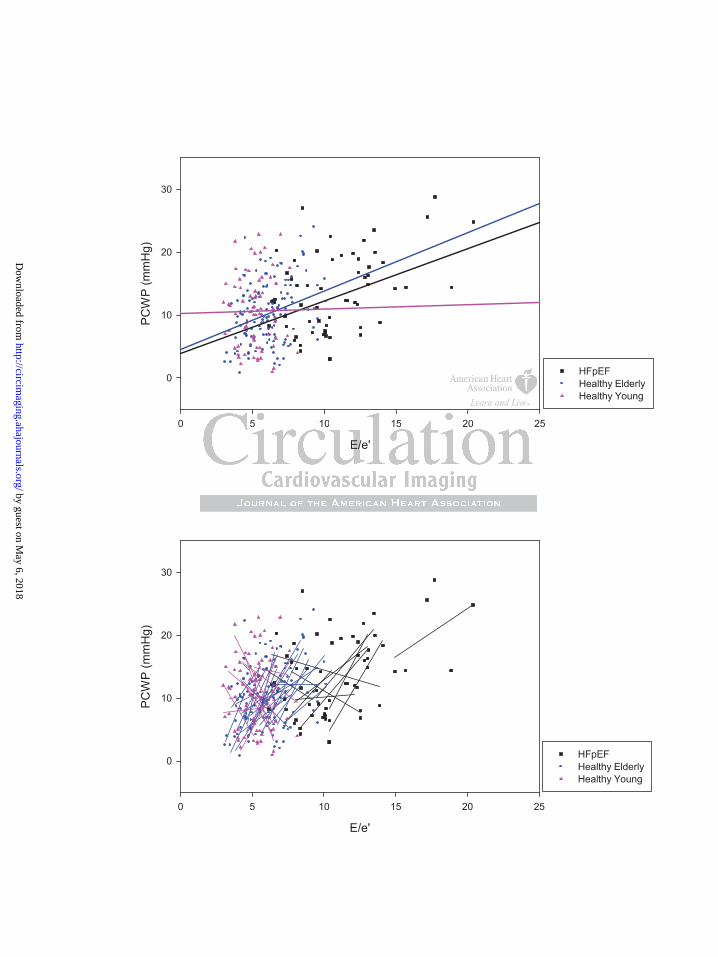
Figure 2. Composite of E/e’ vs. PCWP in all subjects. Group random coefficient mixed
model regressions (top) and individual linear regressions (bottom) are superimposed.
Individual linear regressions were highly variable in regards to slope and r2.
Figure 3. Top: E/e’ vs. PCWP in HFpEF patients at baseline with superimposed group
linear regression (one HFpEF patient could not adequately imaged at baseline). Bottom:
E/e’ vs. PCWP in individual HFpEF patients with superimposed linear regressions (note:
linear regressions are extended to axes). Again, individual linear regressions were highly
variable in regards to slope and r2.
Figure 4. Top: E vs. PCWP in individual HFpEF patients with superimposed linear
regressions. E demonstrated a degree of preload dependence which was similar between
individual HFpEF patients. Bottom: e’ vs. PCWP in individual HFpEF patients with
superimposed linear regressions. e’ varied greatly between individual HFpEF patients
accounting for the broad variability observed in individual E/e’ slopes as preload was
manipulated.
withthhhhhh s s s s s ssupupupupupupuperererererererimimimimimimimpopppppp
n
n
s s
(one HFpEF patient could not adequately imaged at baselin
n individual HFpEF patients with superimposed linear regrer
s are extended to axes). Again, individual linear regressions
by guest on May 6, 2018
http://circimaging.ahajournals.org/
Dow
nloaded from

Figure 5. Composite of E/Vp vs. PCWP in all subjects. Group random coefficient mixed
model regressions (top) and individual linear regressions (bottom) are superimposed.
Again, individual linear regressions were highly variable in regards to slope and r2.
Figure 6. Effects of preload manipulation on PCWP, E, e’ and E/e’ slope in two HFpEF
patients. In the top example, increasing PCWP results in a positive E/e’ slope
demonstrating concordance between these measures. In the bottom example, increasing
PCWP results in a negative E/e’ slope demonstrating discordance. In 8/11 HFpEF
patients, PCWP and E/e’ were concordant whereas in the other 3, the two measures were
discordant. Mean PCWP was determined during the period of diastasis, thereby
minimizing the impact of large V waves on the mean PCWP observed in the top example.
er 3, the two memmmmmm
of ddiaiaaaaaastststststststasasasasasasasisisisisisiss,, , ,, thththththththeree
mpact of large V waves on the mean PCWP observed in the mpact of large V waves on the mean PCWP observed in the
by guest on May 6, 2018
http://circimaging.ahajournals.org/
Dow
nloaded from

PCWP (mmHg)
0 5 10 15 20 25 30
E/e
'
0
5
10
15
20
HFpEFHealthy ElderlyHealthy Young
PCWP (mmHg)
0 5 10 15 20 25 30
E/V
p
0.5
1.0
1.5
2.0
2.5
3.0
3.5
HFpEFHealthy ElderlyHealthy Young
3
PCWP (mmHg)
5 10 15 20 25 3
by guest on May 6, 2018
http://circimaging.ahajournals.org/
Dow
nloaded from
E/e'
0 5 10 15 20 25
PC
WP
(mm
Hg)
0
10
20
30
HFpEFHealthy ElderlyHealthy Young
E/e'
0 5 10 15 20 25
PC
WP
(mm
Hg)
0
10
20
30
HFpEFHealthy ElderlyHealthy Young
2
E/e'
5 10 15 20 2
by guest on May 6, 2018
http://circimaging.ahajournals.org/
Dow
nloaded from

E/e'
0 5 10 15 20 25 30
PC
WP
(mm
Hg)
0
10
20
30
Patient 1Patient 2Patient 3Patient 4Patient 5Patient 6Patient 7Patient 8Patient 9Patient 10
E/e'
0 5 10 15 20 25 30
PC
WP
(mm
Hg)
0
10
20
30
Patient 1Patient 2Patient 3Patient 4Patient 5Patient 6Patient 7Patient 8Patient 9Patient 10Patient 11
E/e'
5 10 15 20 25 3
by guest on May 6, 2018
http://circimaging.ahajournals.org/
Dow
nloaded from

E (cm/s)
0 20 40 60 80 100 120 140 160
PC
WP
(mm
Hg)
0
10
20
30
Patient 1Patient 2Patient 3Patient 4Patient 5Patient 6Patient 7Patient 8Patient 9Patient 10Patient 11
e' (cm/s)
0 2 4 6 8 10 12 14 16
PC
WP
(mm
Hg)
0
10
20
30
Patient 1Patient 2Patient 3Patient 4Patient 5Patient 6Patient 7Patient 8Patient 9Patient 10Patient 11
20 40 60 80 100 120 140 1
E (cm/s)
20 40 60 80 100 120 140 1
by guest on May 6, 2018
http://circimaging.ahajournals.org/
Dow
nloaded from
E/Vp
0 1 2 3 4 5
PC
WP
(mm
Hg)
0
10
20
30
HFpEFHealthy ElderlyHealthy Young
E/Vp
0 1 2 3 4 5
PC
WP
(mm
Hg)
0
10
20
30
HFpEFHealthy ElderlyHealthy Young
1 2 3 4
E/Vp
1 2 3 4
by guest on May 6, 2018
http://circimaging.ahajournals.org/
Dow
nloaded from

PCWP
E
e’ (septal)
PreloadManipulation
E/e'
0 5 10 15 20 25 30
PC
WP
(mm
Hg)
0
10
20
30
Application of LBNP Baseline Rapid Infusion of NS
Patient #1 (discordant)
PCWP
e’ (septal)
E/e'
0 5 10 15 20 25 30
PC
WP
(mm
Hg)
0
10
20
30
Patient #10 (concordant)
E
Mean PCWP = 7.2 mmHg Mean PCWP = 8.3 mmHg Mean PCWP = 12.0 mmHg Mean PCWP = 12.5 mmHg Mean PCWP = 16.7 mmHg
Mean PCWP = 18.9 mmHgMean PCWP = 16.3 mmHgMean PCWP = 9.6 mmHg Mean PCWP = 21.9 mmHgMean PCWP = 6.4 mmHg
by guest on May 6, 2018
http://circimaging.ahajournals.org/
Dow
nloaded from

Thomas, Paul A. Grayburn and Benjamin D. LevinePaul S. Bhella, Eric L. Pacini, Anand Prasad, Jeffrey L. Hastings, Beverley Adams-Huett, James D.
Healthy Subjects or Patients with Heart Failure with Preserved Ejection FractionEchocardiographic Indices Do Not Reliably Track Changes in Left-Sided Filling Pressure in
Print ISSN: 1941-9651. Online ISSN: 1942-0080 Copyright © 2011 American Heart Association, Inc. All rights reserved.
TX 75231is published by the American Heart Association, 7272 Greenville Avenue, Dallas,Circulation: Cardiovascular Imaging
published online July 25, 2011;Circ Cardiovasc Imaging.
http://circimaging.ahajournals.org/content/early/2011/07/25/CIRCIMAGING.110.960575World Wide Web at:
The online version of this article, along with updated information and services, is located on the
http://circimaging.ahajournals.org//subscriptions/
is online at: Circulation: Cardiovascular Imaging Information about subscribing to Subscriptions:
http://www.lww.com/reprints Information about reprints can be found online at: Reprints:
document. Permissions and Rights Question and Answer this process is available in the
located, click Request Permissions in the middle column of the Web page under Services. Further information aboutnot the Editorial Office. Once the online version of the published article for which permission is being requested is
can be obtained via RightsLink, a service of the Copyright Clearance Center,Circulation: Cardiovascular Imaging Requests for permissions to reproduce figures, tables, or portions of articles originally published inPermissions:
by guest on May 6, 2018
http://circimaging.ahajournals.org/
Dow
nloaded from