Echo in Cardiomyopathy - Joe Marshall · Echo in Cardiomyopathy January 22, 2008 Joe M. Moody, Jr,...
40
Echo in Cardiomyopathy January 22, 2008 Joe M. Moody, Jr, MD UTHSCSA and STVAHCS Connolly HM and Oh, JK. Ch 14 in Braunwald’s 8 th ed. 2008 Ch. 17 in Feigenbaum’s 6 th ed. 2005
Transcript of Echo in Cardiomyopathy - Joe Marshall · Echo in Cardiomyopathy January 22, 2008 Joe M. Moody, Jr,...

Echo in Cardiomyopathy
January 22, 2008
Joe M. Moody, Jr, MD
UTHSCSA and STVAHCS
Connolly HM and Oh, JK. Ch 14 in Braunwald’s 8th ed. 2008
Ch. 17 in Feigenbaum’s 6th ed. 2005

Outline
• Echo is Critically Important in Diagnosis
– Dilated Cardiomyopathy
– Hypertrophic Cardiomyopathy
– Restrictive Cardiomyopathy
– Arrhythmogenic RV Cardiomyopathy
– Ventricular noncompaction
• Echo in Prognosis

Echo Features in Dilated
Cardiomyopathy
• Increased LV diastolic and systolic volumes
• Decreased LV systolic function
• Increased sphericity (long-axis dimension/short-axis dimension usually >1.5, but approaches 1.0 in DCM)
• Increased LV mass (eccentric LVH)
• Normal wall thickness
• Regional wall motion abnormalities can be present

Secondary Echo Findings in
Dilated Cardiomyopathy
• Mitral Annular Dilation
• Evidence of Low cardiac output (decreased MV excursion)
• Atrial enlargement
• RV enlargement
• Apical thrombus
• Intraventricular mechanical dyssynchrony

Doppler Findings in DCM
• Cardiac Output
– SV times HR
– SV = (VTI of LVOT) *(CSA of LVOT)
– SV is somewhat technically demanding
• LV filling pressures (diastolic function)
– Prognostic information
• TR velocity > 3 m/s adverse prognosis

Fig 14-71A, Braunwald’s 8th ed.

Fig 14-71B, Braunwald’s 8th ed.
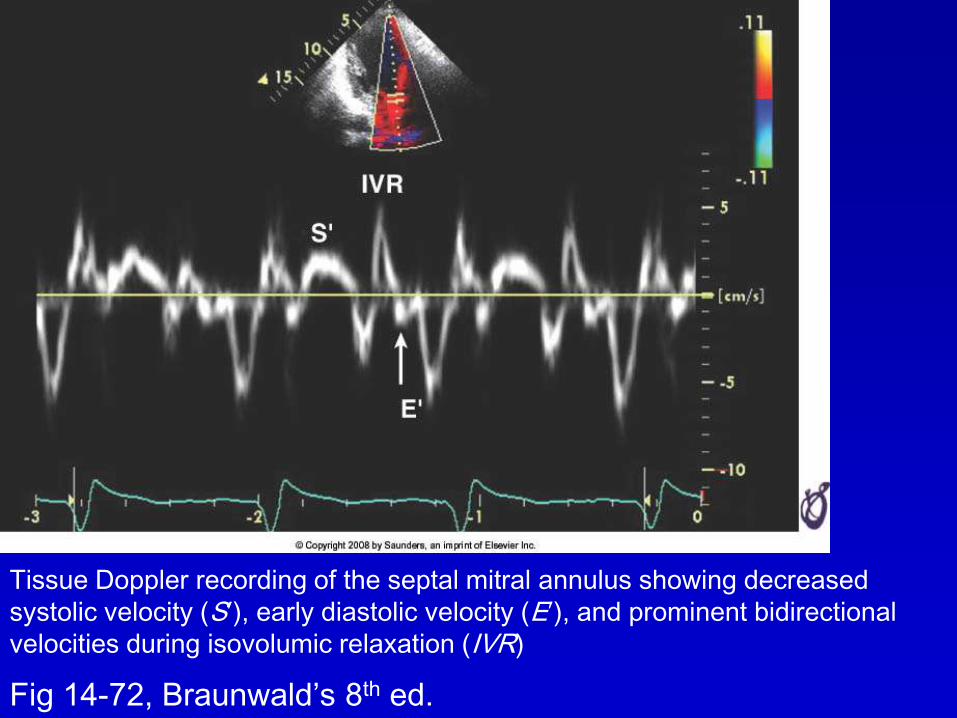
Fig 14-72, Braunwald’s 8th ed.
Tissue Doppler recording of the septal mitral annulus showing decreased
systolic velocity (S′), early diastolic velocity (E′), and prominent bidirectional
velocities during isovolumic relaxation (IVR)

Fig 14-73A, Braunwald’s 8th ed.
Dilated ischemic cardiomyopathy showing a relaxation abnormality pattern with
increased A velocity. Patients with this type of diastolic filling pattern usually
have minimal to mild symptoms, despite severe left ventricular (LV) systolic
dysfunction.

Fig 14-73B, Braunwald’s 8th ed.
In this patient with dilated cardiomyopathy, the MV inflow velocity
pattern shows restrictive physiology, with a markedly decreased A
velocity and an increased E/A ratio. Deceleration time (DT) of
mitral E velocity is shortened. Patients with this type of diastolic
filling have increased filling pressure and symptomatic congestive
heart failure.

Fig 14-73C, Braunwald’s 8th ed.
Tissue Doppler velocity recordings from the basal septal (yellow) and basal
lateral (blue) walls. Septal peak velocity occurs first, then lateral peak velocity.
The timing difference (+----+) is 110 msec, indicating dyssynchronous
contraction.

Fig 14-73D, Braunwald’s 8th ed.
Intraventricular dyssynchrony can be measured with strain imaging, which we
prefer. Left, Strain recording from the basal septal wall. The time from the onset
of QRS to peak negative strain (when the maximum contraction occurs) is
measured from three cardiac cycles. The time intervals measured for the three
cycles are 299, 299, and 291 msec. Right, Strain recording from the basal
lateral wall. The peak strain occurs after aortic valve closure (AVC), which is
termed postsystolic shortening. The time interval measured from the onset of
QRS to peak negative is 452 and 464 msec, much later than that of the septal
wall. The timing difference between the septal and lateral segments is more
than 150 msec, indicating marked dyssynchrony.

Echo Findings in Hypertrophic
Cardiomyopathy
• Asymmetrical Septal Hypertrophy is most common (diffuse hypertrophy of septum and anterolateral free wall accounts for 70-75% in the West, and Basal septal in 10-15%)
• Also possible:
– Concentric LVH (5%)
– Apical HCM (<5%)
– Lateral wall LVH (1-2%)

Doppler Findings in Hypertrophic
Cardiomyopathy
• Dynamic LVOT obstruction
– Broad-blade dagger
– LVOTO is not diagnostic for HCM• Elderly hypertensive on vasodilator or diuretic
• Postop patients on inotropes and volume depleted
• Postop AS with AVR or MVP with MV repair
• Membranous subaortic stenosis (but no late peak – looks like regular AS Doppler)
• Acute anteroapical MI or apical ballooning

Fig 14-74A, Braunwald’s 8th ed.
2D echocardiogram of hypertrophic obstructive cardiomyopathy (systolic
frame). The ventricular septum (VS) is markedly thickened (25 mm) and has an
abnormal myocardial texture. Systolic anterior motion of the anterior mitral
leaflet is shown, contributing to the obstruction of the left ventricular outflow
tract (arrow).

Fig 14-74B, Braunwald’s 8th ed.
Septal mitral annulus velocity recording by tissue Doppler imaging
in a 28-year-old asymptomatic patient with family history of
hypertrophic cardiomyopathy. Early diastolic velocity is reduced to
6 cm/sec.

Fig 14-74C, Braunwald’s 8th ed.
Strain from mid-septum (red curve with peak negative strain of 10
percent) is markedly reduced and apical strain (blue curve with 35
percent) is increased.

Fig 14-75, Braunwald’s 8th ed.
CW Doppler from the apex showing dynamic LVOT obstruction. Note the typical
late-peaking configuration resembling a dagger or ski slope (arrow). The
baseline (left) velocity is 2.8 m/sec, corresponding to the peak left ventricular
outflow tract gradient of 31 mm Hg (= 4 × 2.82). With the Valsalva maneuver
(right), the velocity increased to 3.5 m/sec, corresponding to the gradient of 50
mm Hg

Fig 14-76A, Braunwald’s 8th ed.
2D apical four-chamber view during diastole in a patient with apical
hypertrophic cardiomyopathy. The apical wall thickness during diastole is
markedly increased (arrow), and the apical cavity is nearly obliterated except
for a small slit during diastole.
Apical HCM is
regularly missed
by parasternal
echo window;
epicardium may
seem dyskinetic.
DDX:
hypereosinophilic
syndrome or
noncompaction.
Association with
giant negative
precordial T
waves.
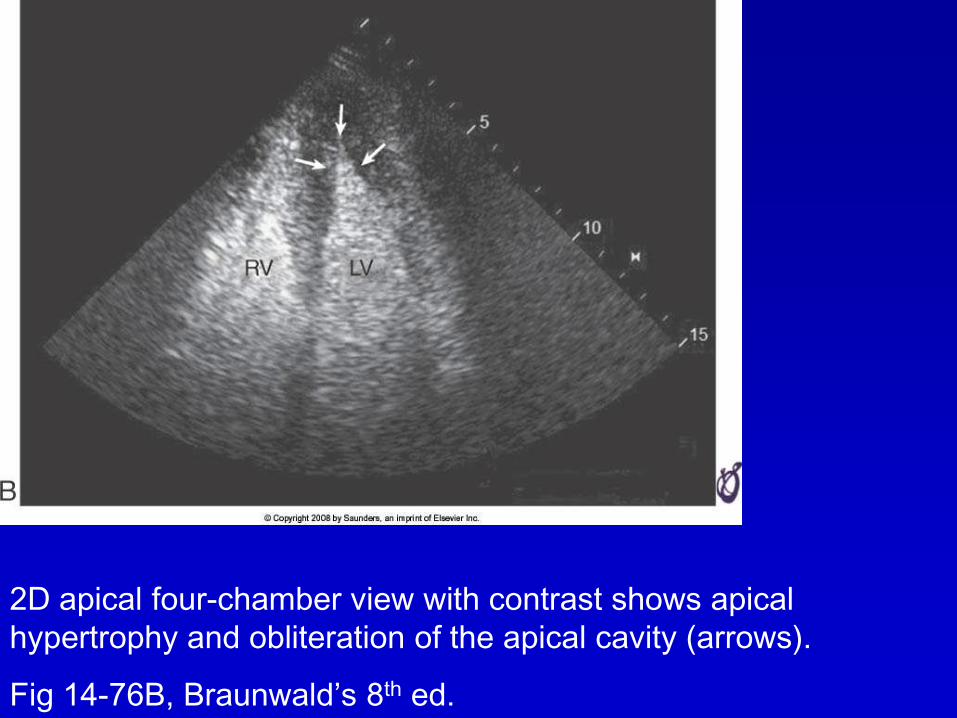
Fig 14-76B, Braunwald’s 8th ed.
2D apical four-chamber view with contrast shows apical
hypertrophy and obliteration of the apical cavity (arrows).

Fig 14-77A, Braunwald’s 8th ed.
2D echocardiography shows increased left ventricular (LV) wall
thickness and systolic obstruction (arrows) at mid ventricle. The
apical portion (A) is not well seen.

Fig 14-77B, Braunwald’s 8th ed.
Color flow imaging shows
increased flow velocity at the
obstructed mid cavity.

Fig 14-77C, Braunwald’s 8th ed.
Contrast echocardiography
for LV opacification shows the
apical cavity best.

Athlete’s Heart is Different from
HCM
• Athlete’s heart is symmetric hypertrophy
• Rarely >17 mm thick
• LV cavity increased
• Diastolic function is normal (Ea > 7
cm/s)
• Tissue Doppler velocities and strain
values are normal

Restrictive Cardiomyopathy

Fig 14-78, Braunwald’s 8th ed.
Apical four-chamber view of typical restrictive cardiomyopathy
with normal left ventricular (LV) cavity size, normal systolic
function, and marked biatrial enlargement.

Fig 14-79A, Braunwald’s 8th ed.
Mitral inflow in a patient with restrictive cardiomyopathy. E/A ratio
is greater than 2, and deceleration time is short

Fig 14-79B, Braunwald’s 8th ed.
tissue Doppler septal mitral annulus in a patient with restrictive
cardiomyopathy. E′ is decreased because of abnormal relaxation;
S′ is also decreased

Fig 14-79C, Braunwald’s 8th ed.
pulmonary vein in a patient with restrictive cardiomyopathy.
Pulmonary vein systolic velocity (S) is reduced and diastolic
velocity (D) deceleration time is shortened

Fig 14-79D, Braunwald’s 8th ed.
color M-mode of mitral inflow velocity in a patient with restrictive
cardiomyopathy. Mitral inflow color propagation velocity (V) is
reduced to 32-37 cm/sec.

Fig 14-80, Braunwald’s 8th ed.
Hepatic vein pulsed wave Doppler recording together with
respirometer recording from a patient with restrictive physiology.
Note the higher diastolic velocity (D) than systolic velocity (S) and
greater reversal of diastolic flow during inspiration (Insp) (arrow).

Arrhythmogenic RV
Cardiomyopathy

Fig 14-81A, Braunwald’s 8th ed.
Echocardiographic views
from a patient with
arrhythmogenic right
ventricular dysplasia. Right
ventricular outflow tract
(RVOT) enlargement from
the parasternal long-axis
view

Fig 14-81B, Braunwald’s 8th ed.
Echocardiographic views
from a patient with
arrhythmogenic right
ventricular dysplasia. RVOT
enlargement from the
parasternal short-axis view.

Fig 14-81C, Braunwald’s 8th ed.
Echocardiographic views
from a patient with
arrhythmogenic right
ventricular dysplasia. Note
the focal right ventricular
(RV) apical aneurysm
(arrows).

Fig 14-81D, Braunwald’s 8th ed.
Echocardiographic views
from a patient with
arrhythmogenic right
ventricular dysplasia. Note
excessive trabeculations
(arrows).

Fig 14-81E, Braunwald’s 8th ed.
Echocardiographic views
from a patient with
arrhythmogenic right
ventricular dysplasia. Note
hyperreflective moderator
band (arrow).

Fig 14-82A, Braunwald’s 8th ed.
Apical four-chamber 2D echocardiographic view showing
characteristic increase in trabeculations (T) and deep recesses
(arrows) in noncompaction cardiomyopathy

Fig 14-82B, Braunwald’s 8th ed.
Apical four-chamber 2D echocardiographic view in
noncompaction cardiomyopathy. Color flow imaging showing
flow into the intratrabecular recesses.

Fig 14-82C, Braunwald’s 8th ed.
Contrast administration shows trabeculations at the apex; the appearance is
different from that of apical hypertrophic cardiomyopathy. With contrast
enhancement, the ratio of noncompacted layer (x) to compacted layer (y) can
be calculated. In this patient, x = 1.8 cm, y = 0.8 cm, with x/y = 2.3.