Acoustic echo cancellation using nlms adaptive algorithm ranbeer
;01R. 26. 20014 .4 j46PM'HNICAL
NO, 1701 F. 2
Echo correlation analysis and the acoustic evidence in the Kennedy assassination
revisited DI3 THOMAS
USDA Subtropical Agriculrure Research Laboratory. 2301 S. International Blvd, Weslaco. Texas 78596, US.4
Science & Justice 2001: 41: 21-32
Received 14 June 2000; accepted 10 August 2000
A Dallas Police Department recording contemporaneous with the Kennedy assassination contains five impulsive sounds that have the acoustic waveform of Donley Plaza gunfire. One of the sounds matches the echo pattern of a test shot fired from the Grassy Knoll. The shock wave precedence associated with this pattern is consistent with the muzzle velocity of a .30 calibre rifle. Criticism of the acoustic identifications on statistical grounds is based on erroneous assumptions concerning the assignment of values to the parameters that determine the probability that random noises could resemble gunshot patterns. A conservative estimate of the true value of the probability that the putative Grassy Knoll shot is attributable to random radio noise is no greater than 0.037. Alleged asynehroncit• of the sounds with the time of the assassination stemmed Tom several incorrect assumptions. Whatever their origin, the gunshot. like sounds occur exactly synchronous with the time of the shooting.
Un enregistrement du Department de la Police It Dallas, contemporain a l'assassinat de Kennedy. contient 5 sons impulsifs qui montre une ondc acoustique du tir de Dealcy Plaza. Un de ces sons correspond 3 ream d'un tir test du Grassy Knoll. Londe de choc precedent associe avec eette onde est comparable it Ia %/Cloche de bouche d'un fusii de calibre .30. La critique des identifications acoustiques sur dc. bases statistiques provient de suppositions erronees concemant attribution de valeurs aux parametres qui determinent la probabilite que des bruits dus au hasard puissent resscmbler 3 celui d'un tie Une estimation conservauice de la valeur rielle de Ia probabilite qu' un tir putatif de Grassy Knoll soil attribusble a un bruit de radio aleatoire nest pas plus grand que 0.037. L'allEgation de Is non synchronisation des sons avec l'assassinat provient de suppositions incorrectes multiples. Quelle que snit Lew origin, les suns qui ressetnblent a ceux d'un tir paraissent etre cn synchronisation exacte avec lc moment de la fusillade.
Eine Aufnahme dee Dallas Police Department, die ; im Zeitpunkt der Ermordung Kenncdys gemacht wte le. enthalt fUnf Impuisgerausche, welche die Schalldruckw Ile der Schtisec vom Dealey Plaza aufweisen. Eines ler Gerausche stimmt mit dem Echomuster eines Testschte :es iibereire der von der nahegelegenen, grashewachse en Anhohe abgegeben wurde. Die mit diesem Mu Ter assoziienc, vorhergehende Dnickwelle stimmt mit ler Nlendungsgeschwindigkeit eines Oewehrs Kaliber 30 tiberein. Die Kritik an den akustischen Identifikationen of statistischer Basis gttindet sick aut. irrigen Annahmen t die Zuordnung von Wenen zu jenen Parameters, dic lie Wahrscheinlichkeit bestimmen, class ein zufalli es Gerausch deco Muster eines Schusses gleicht. E ne konservative Abschatzung des wahren Wertes ier Wahrscheinlichkeit, days ein verrneintlicher Schuss von ier AnhiShe einem zufalligen Gerilusch zuzuordnen ise 1st n :hi grdBer acs 0,037. Die behauptete Asynchronitet er Gerausche zum Zeitpunkt des Mordes rain • an verschiedencn inkorrekten Annahmen her. Welc: en Ursprungs sic such scin mOgen, die einem Sch vs ihnelnden Gerausche treten exakt zum Zeitpunkt es Schusses auf.
Una grab scion del Departamento de Policfa de Dal contempordneo del asesinato de Kennedy contiene ci co sonidos impuLsivos que tienen la forma de las on as acasticas del tiroteo de la Plaza Dealey. Uno de los sonic is, encaja con el patron de ecos de un disparo de test realize Jo desdc el Grassy Knoll. La onda de choque precede .te asociada a este patrtin es compatible con Ia velocidad inie al de un rifle de calibre .30. La crftica que se hate de as identifications actisticas basadas en la estadistica, se b sa en presunciones err6neas sohre Is asignacion de valore a los parametros clue determinan la probabilidad de to sonidos al azar se parczcan a patrons de disparos. is estimacion conservadora del verdadero valor de Ia probabi tided de que el disparo purativo de Grassy Knoll ea atribuible a un sonido al azar no es mayor de 0.037. .a alegada asincrunicidad de los sonidos de dispa ocurrieron exactamente sincrOnicos con el momento el tiroteo.
The Forensic Science Society 2001 Key Words: Forensic science, ballistic acoustics. statistics, shock wave precedence. echo-delay patterns, assassination
JF Kennedy.
Science & Justice 2001; 4/11): 21-32 1
DIAL 26. 2001 4:49PM NO. 1704 P. 3 Echo correlation analysts and acoustic evidence in :/w Kennedy assassination
One of the forensic issues surrounding the Kennedy assas-sination is the validity of acoustic evidence for a gunshot emanating from the so-called "Grassy Knoll" [I], The President's Commission on the Assassination of President John F Kennedy, more widely known as the Warren Commission, concluded that no more and no less than exactly three shots were fired by a single assassin from a building (Book Depository) at the northeast corner of Deeley Plaza, a park-like area in the downtown district of Dallas, Texas [2]. The number of shots, and therefore, alle-gations of a wider conspiracy, has been a matter of con-tention. Acoustic evidence pertaining to this matter was found in recordings of Dallas Police Department radio transmissions contemporaneous with the incident.
The police were using two radio channels for communica-tions at the time of the assassination. Routine transmissions were made over a frequency designated as channel one and were recorded on a sound-actuated Dictaphone belt recorder. An auxiliary frequency, designated channel two, was dedicated to the President's motorcade and its trans-missions were recorded on a sound-actuated Gray Audograph disc machine, Each channel had its own dis-patcher and, in accordance with radio protocol, each dis-patcher announced the time at regular intervals. The context of the transmissions, and the dispatcher's time notations on channel two, established that the assassination occurred between 12.30 and 1231 pm central standard time [3]. Simultaneously, for about five and a half minutes between 1228 and 12.34 pm, channel one transmissions were dom-inated by the sound of a motorcycle with a faulty relay causing the radio microphone to switch open intermittently. About half-way through this particular motorcycle trans-mission there occurs a sequence of static-like noises inter-preted by some listeners to be possible gunfire (4).
The Dallas police recordings were acquired by the US Congress, House of Representatives, Select Committee on Assassinations (HSCA), and subjected to a forensic analy-sis in 1978. An independent laboratory, Bolt. Beranek & Newman Inc., of Cambridge, Massachusetts. was contract-ed to analyse the dictabtlt and a first generation taped copy of the channel one transmissions. These acoustic analysts concluded that: the motorcycle with the open microphone was in the President's motorcade (one of 18); that sounds as loud as gunshots are on the recording; and that these includ-ed a sound pattern that might be attributed to a gunshot originating from the Grassy Knoll [5].
Because of a degree of uncertainty attached to this detection a second laboratory was asked to review the evidence. Specialists in sonar applications with the Computer Sciences Department of the City University New York con-:urred that the recording did include the acoustic signature of a gunshot emanating from the Grassy Knoll. In their final reports. both laboratories estimated that the likelihood of
the relevant acoustic pattern being a chance array of =dot radio noises was no more than 5% [6,7). Their finding were instrumental in the HSCA's conclusion that they probably was a conspiracy behind Kennedy's murder (8).
In 1980, the United States Department of Justice arrange with the National Research Council (NRC) for a reanalysi of the data produced by the HSCA. The NRC panel four, evidence that the alleged gunshot sounds were not synchrc nous with events linked to the assassination and thus con eluded that the impulsive sounds on the tape could not b. the assassination gunfire 191. They adopted the alternativ, theory that the sounds on the tape were most likely candor) radio noises which by chance gave rise to impulse pattern bearing a resemblance to the echoes of gunfire. The pane specifically recalculated the probability of the sound patter] being a Grassy Knoll gunshot, as opposed to random radii noise, at only 78% (10). In general practice, the 95% sig nificancc level is widely accepted as the standard for reject ing a null hypothesis [11,12]. In this case, the null hypothe sis is that the acoustic pattern is not a gunshot from the Grassy Knoll, but random noise. If the probability of the null hypothesis is as high as p 0.22 as calculated by the NRC, rather than p = 0.05 calculated by the HSCA's ana lysts, then the null hypothesis would not be rejected.
In this instance, however, acceptance of the null hypothesis presents a conundrum. If the relevant sounds on the polies recording are not synchronous with the shooting, then none of the gunshot-like sounds can be the actual assassinatior gunfire. Thus, the random radio noise hypothesis would have to explain all of the impulse patterns, not just the alleged Grassy Knoll shot The calculations of p only Applied to the latter, It seams unlikely that a random process would produce impulse patients resembling four gunshots from the Book Depository building and one from the Grassy Knoll. all within the space of eleven seconds, and nowhere else on the recording. Yet, such would hose to be the case for the assertion of asynchroncity to be true
In this report I will explain how the separate panels arrived at different estimates of p using the same data. Errors led both panels to underestimate the statistical level of signifi-cance that should have been attached to the acoustic data. The correct value of p is no greater than 0.037. I also pre-sent evidence pertaining to the problem of synchroneity of the sect ant acoustic signals with the assassination.
The Acoustic Fingerprints
The percussive noise that is associated with the discharge of a weapon is the muzzle blast. Observed on an oscillograph, the morale blast appears as a brief duration (c. 5 msec). large amplitude wave with a narrow peak. Different weapons produce discernably different waveforms, howev-er, the automatic gain control built into the Dallas Police radio system produced distortion in the signal such that the
22 Science & luvice 2001; 41(1): 11-12
Ma 26.2001 4:49PM
DB THOMAS
NO. 1704 'P. 4'
waveform could not be relied upon for identifying the type of weapon or even if the sound actually was a muzzle blast from a weapon [131. Alternatively, the limiting circuitry does not affect the rime history of the incoming signals. In an urban environment, such as Dealey Plaza, the muzzle blast will resonate off the prominent structures creating echoes. Thus, the pattern of a gunshot in an urban environ-ment appears un an oscillograph as a train of impulses. The time-lag between the muzzle blast and any particular echo is a function of the difference in the distance travelled by the blast from the origin to the microphone and the alternate path distance to the echo producing structure and from there to the microphone. This parameter is the echo delay time and the specific pattern that arises is the acoustic finger-print. The pattern re-sulting from each combination of shoot-er and microphone location is complex and unique and by applying echo location principles one can isolate the origin of the sound. The echo correlation technique has been suc-cessfully applied in other cases. For example. the origin of gunfire was determined from recordings in the case of the Kent State shooting and likewise in the Greensboro, North Carolina incident known as the "Commie-Klan shootout" [14].
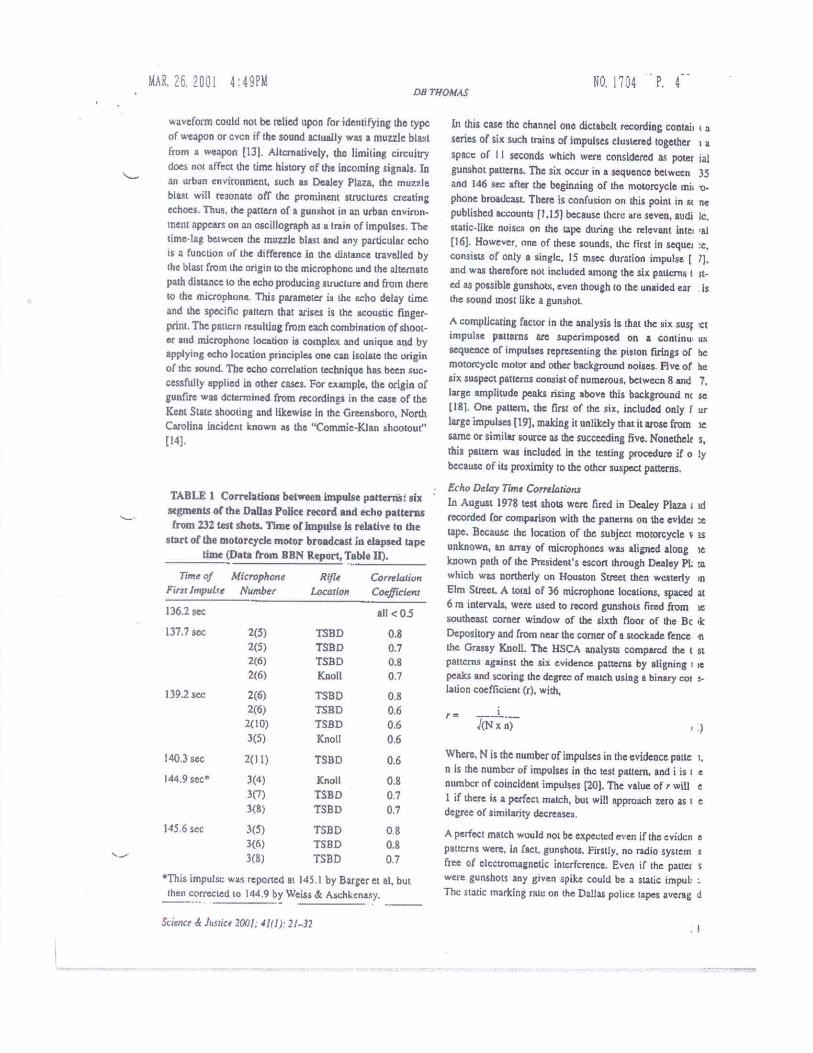
TABLE 1 Correlations between impulse patterns: six segments of the Dallas Police record and echo patterns from 232 test shots. Time of impulse is relative to the
start of the motorcycle motor broadcast in elapsed tape time (Data from SRN Report, Table II).
Time of Microphone First Impulse Number
Rifle Location
Correlation Coefficient
136.2 sec all < 0 5
137.7 sec 2(5) TSBD 0.8 2(5) TSBD 0.7 2(6) TSBD 0.8 2(6) Knoll 0.7
139,2 sec 2(6) TSBD 0.8 2(6) TSBD 0.6 2(10) TSBD 0.6 3(5) Knoll 0.6
140.3 sec 2(11) TSBD 0.6
144.9 sec* 3(4) Knoll 0.8 3(7) TSBD 0.7 3(8) TSBD 0.7
145.6 sec 3(5) TSBD 08 3(6) TSBD 0.8 3(8) TSBD 0.7
This impulse was reported at 145.1 by Barger et al. but then corrected to 144.9 by Weiss tic Asehkenasy.
Science di Justice 200!; 41(1). 21-32
In this case the channel one dictabch recording contair series of six such trains of impulses clustered together space of I I seconds which were considered as rioter ial gunshot patterns. The six occur in a sequence between 35 and 146 See after the beginning of the motorcycle mi, phone broadcast. There is confusion on this point in sc ne published accounts [1.15] because there are seven, audi lc. static-like noises on the tape during the relevant inte, al [16]. However, one of these sounds, the first in sequel consists of only a single. 15 msec duration impulse [ and was therefore not included among the six patterns t ;t-ett as possible gunshots, even though to the unaided ear is the sound most like a gunshot.
A complicating factor in the analysis is that the six sus ct impulse patterns are superimposed on a continta us sequence of impulses representing the piston firings of he motorcycle motor and other background noises. Five of he six suspect patterns consist of numerous, between 8 and 7. large amplitude peaks rising above this background rn se [181. One pattern. the first of the six, included only f ur large impulses (19), making it unlikely that it arose from se same or similar source as the succeeding five. Nonethelt s, this pattern was included In the testing procedure if o ly because of its proximity to the other suspect patterns.
Echo Delay Time Correlations In August 1978 test shots were fired in Dealey Plaza ; td recorded for comparison with the patterns on the evidei tape. Because the location of the subject motorcycle r as unknown, an array of microphones was aligned along to known path of the President's escort through Dealey P1. to which was northerly un Houston Street then westerly at Elm Street. A total of 36 microphone locations, spaced at 6 m intervals, were used to record gunshots fired from to southeast corner window of the sixth floor of the Br ik Depository and from near the corner of a stockade Fence o the Grassy Knoll. The HSCA analysts compared the t st patterns against the six evidence patterns by aligning 1 le peaks and scoring the degree of match using a binary cos lauon coefficient (r). with,
r= .— ,l(N x a) .)
Where, N is the number of impulses in the evidence paste 1, it is the number of impulses in the test pattern, and i is t e number of coincident impulses [20). The value of r will e 1 if there is a perfect match, but will approach zero as t e degree of similarity decreases.
A perfect match would not be expected even if the evidcn e patterns were, in fact, gunshots. Firstly, no radio system 5 free of electromagnetic interference. Esen if the patter s were gunshots any given spike could be a static impul: The static marking rate on the Dallas pollee tapes averag d
EAR. 26. 2001 4:50Pli NO. 1701 F, Echo correlation analysis and acoustic evidence in the Kennedy assassination
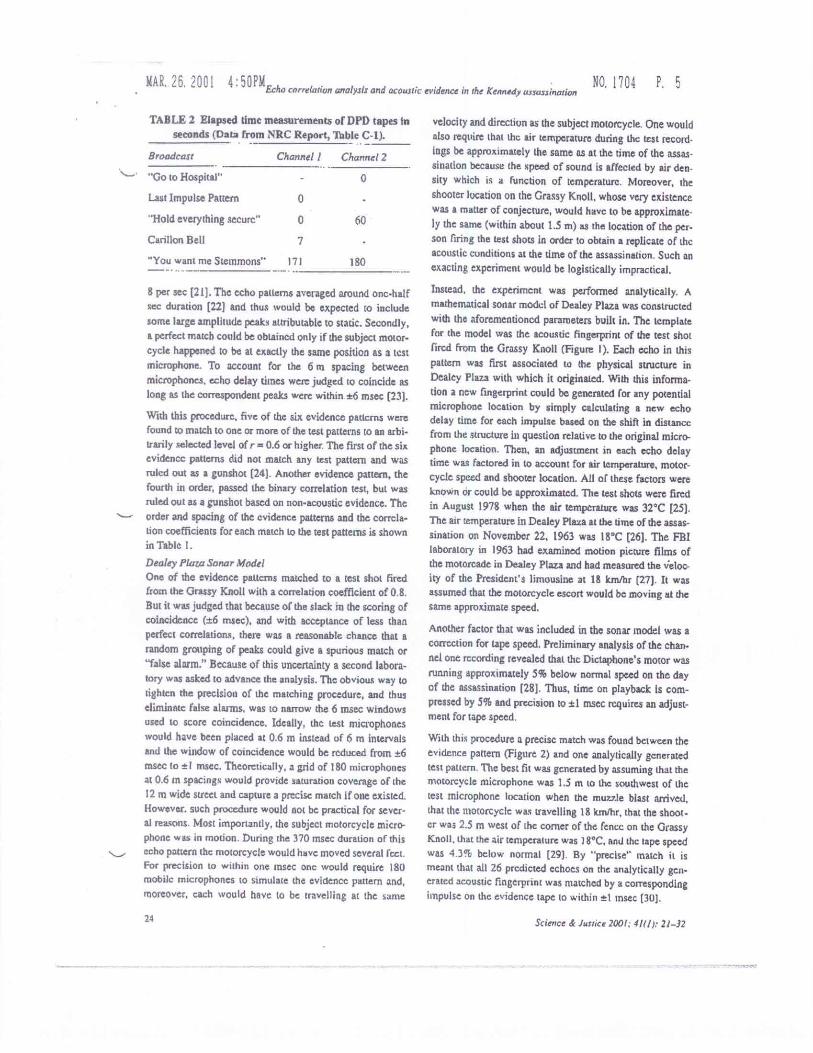
TABLE 2 Elapsed time measurements of DPI) tapes In seconds (Data from NRC Report, Table G-1).
Broadcast Channel 1 Channel 2
"Go to Hospital"
Last Impulse Pattern
0
"Hold everything secure."
0
Carillon Bell
7
"You want me Stemmons"
171
8 per sec [21). The echo patterns averaged around one-half sec duration [22) and thus would be expected to include some large amplitude peaks attributable to static. Secondly, a perfect match could be obtained only if the subject motor-cycle happened to be at exactly the same position as a test microphone. To account for the 6 m spacing between microphones. echo delay nines were judged to coincide as long as the correspondent peaks were within *6 msec [23).
With this procedure, five of the six evidence patterns were found to match to one or more of the test patterns to an arbi-trarily selected level of r = 0.6 or higher. The first of the six evidence patterns did not match any test pattern and was ruled out as a gunshot [24). Another evidence pattern, the fourth in order, passed the binary correlation test, but was ruled out as a gunshot based on non-acoustic evidence. The order and spacing of the evidence patterns and the correla-tion coefficients for each match to the test patterns is shown in Table I.
Dealey Plaza Sonar Model
One of the evidence patterns matched to a test shot fired from the Grassy Knoll with a correlation coefficient of 0.8. But it was judged that because of the slack in the scoring of coincidence (-±6 msec), and with acceptance of less than perfect correlations, there was a reasonable chance that a random grouping of peaks could give a spurious match or "false alarm." Because of this uncertainty a second labora-tory was asked to advance the analysis. The obvious way to tighten the precision of the matching procedure. and thus eliminate false alarms, was to narrow the 6 msec windows used to score coincidence. Ideally. the test microphones would have been placed at 0.6 in instead of 6 m intervals and the window of coincidence would be reduced from ±6 raw to el msec. Theoretically, a grid of 180 microphones at 0.6 in spacings would provide saturation coverage of the 12 to wide street and capture a precise match if one existed. However. such procedure would not be practical for sever-al reasons. Most importantly, the subject motorcycle micro-phone was in motion. During the 370 msec duration of this echo pattern the motorcycle would have moved several feet. For precision to within one insec one would require 180 mobile microphones to simulate the evidence pattern and, moreover, each would have to be travelling at the same
velocity and direction as the subject motorcycle. One would also require that the air temperature during the test record-ings be approximately the same as at the time of the assas-sination because the speed of sound is affected by air den-sity which is a function of temperature_ Moreover, the shooter location on the Grassy Knoll, whose very existence was a matter of conjecture, would have to he approximate-ly the same (within about 1.5 m) as the location of the per-son firing the test shots in order to obtain a replicate of the acoustic conditions at the time of the assassination. Such an exacting experiment would be logistically impractical.
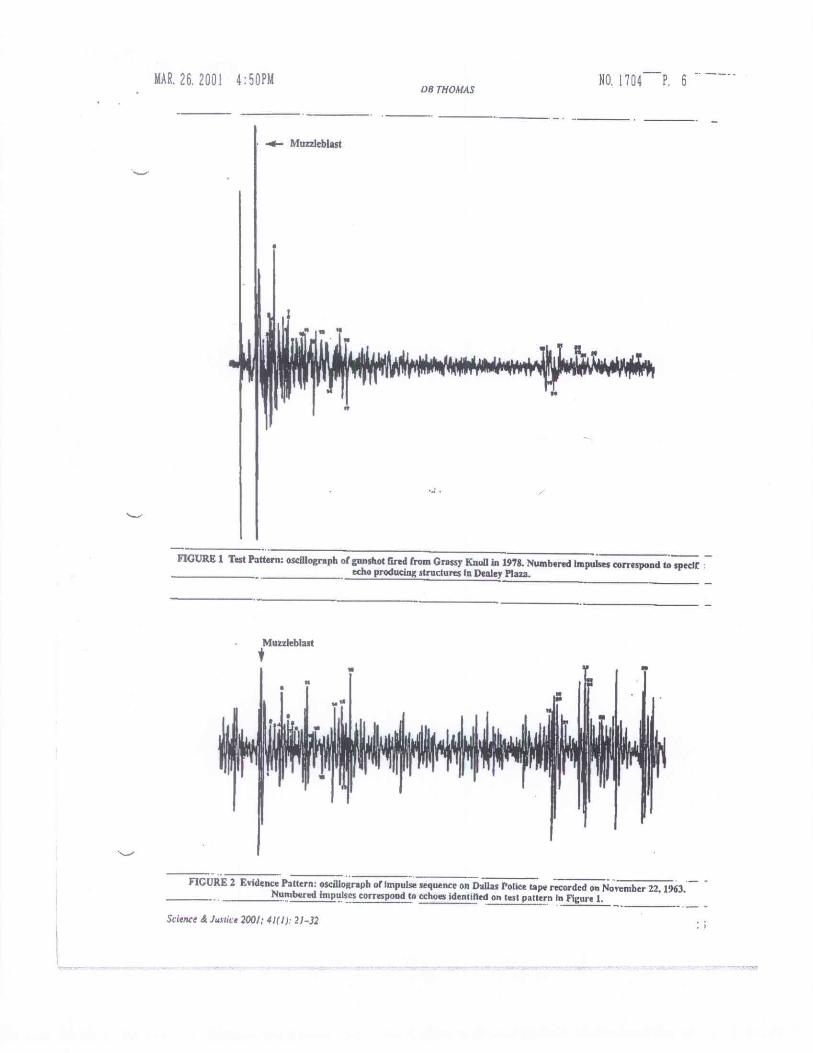
Instead, the experiment was performed analytically. A mathematical sonar model of Dealey Plaza was constructed with the aforementioned parameters built in. The template for the model was the acoustic fingerprint of the test shot fired from the Grassy Knoll (Figure I). Each echo in this pattern was first associated to the physical structure in Dealey Plaza with which it originated_ With this informa-tion a new fingerprint could be generated for any potential microphone location by simply calculating a new echo delay time for each impulse based on the shift in distance from the structure in question relative to the original micro-phone location. Then, an adjustment in each echo delay time was factored in to account for air temperature, motor-cycle speed and shooter location. All of these factors were known or could be approximated. The test shots were fired in August 1978 when the air temperature was 32°C [25). The air temperature in Dealey Plaza at the time of the assas-sination on November 22, 1963 was 18°C [26). The FBI laboratory in 1963 had examined motion picture films of the motorcade in Dealey Plaza and had measured the v'eloc-ity of the President's limousine at 18 km/hr [27]. It was assumed that the motorcycle escort would be moving at the same approximate speed.
Another factor that was included in the sonar model was a correction for tape speed. Preliminary analysis of the chan-nel one recording revealed that the Dictaphone's motor was running approximately 5% below normal speed on the day of the assassination [281. Thus, time on playback is com-pressed by 5% and precision to el msec requires an adjust-ment for tape speed.
With this procedure a precise match was found between the evidence pattern (Figure 2) and one analytically generated test pattern. The best fit was generated by assuming that the motorcycle microphone was 1.5 m to the southwest of the test microphone location when the muzzle blast arrived, that the motorcycle was travelling 18 km/hr, that the shoot-cr was 2.5 in west of the corner of the fence on the Grassy Knoll, that the air temperature was 18°C, and the tape speed was 4.3% below normal [29). By "precise" match it is meant that all 26 predicted echoes on the analytically gen-erated acoustic fingerprint was matched by a corresponding impulse on the evidence tape to within ezt msec [301.
0
60
180
24 Science & Justice 2001; 41/11:21-32
NO, 1704---P. 5 MAR. 26. 2001 4:50PM De THOMAS
.4— Muz2leblast
FIGURE 1 Test Pattern: oscillogrnph of gunshot fired from Grassy Knoll in 1978. Numbered Impulses correspond to speclf echo producing structures In Dealey Plaza.
FIGURE 2 Evidence Pattern: oscillograph of impulse sequence on Dallas Police tape recorded on November 22, 1963. Numbered impulses correspond to echoes identified on test pattern In Figure L.
Science & Justice 2001; 41(1): 21-32
MAL 26. 2001 4:501N NO. 1704 F. 7 Echo correlation analysis and acoustic evidence in the Kennedy assassination
However. there was an ambiguity inherent to the precision of this match, As previously explained, most of the impuls-es on the evidence tape were due to motorcycle piston fir-ings. There was no objective way to separate peaks due to piston firings from putative gunshot echoes except by amplitude. Therefore, using an amplitude threshold that would eliminate motor noise, consideration was given only to the large amplitude echoes on the test pattern and the large amplitude impulses on the evidence pattern. Under this procedure, the 13 largest impulses on the analytical test
pattern coincided with II large peaks in the evidence pac-t= to el msec 131) Interestingly, the two peaks in the test pattern which were attendant only to smaller impulses in the evidence pattern were echoes originating with a colonnade arc which was a structure to the front of the motorcycle. It was reasoned that the amplitude of these echoes might have been attenuated by the motorcycle's windshield [32). Nonetheless, objectively the match was a less than perfect II out of 13. Furthermore, two large peaks in the evidence pattern were not matched in the test pattern, which therefore cannot be gunshot echoes [33]. Conceivably these peaks could be attributed to static. The pertinent question is, given 15 impulses on the evidence tape and 13 echoes on the test pattern. what are the odd:: that ll peaks would be coincident to within 1 msec. The factors that enter into this calculation go to the heart of the discrepancy in the value of p comput-ed by the HSCAand NRC panels.
Sratisiical Analysis• of Echo Delay Time Coincidence
The value p in this case is calculated in the same manner that lottery or casino odds are calculated. The probability is defined by the hypergeometric function, p1M,N,n,i1, where, M = the number of windows where a spike could appear, N = the number of spikes in the test pattern, n = the number of spikes in the evidence pattern, i = the number of coincident spikes. The hypergeometric function is appropri-ate for comparisons of two finite populations which arc sampled without replacement [341. In this case each match depletes the number of potential impulses available fur each succeeding window. Thc formula for the calculation of the hypergeometric p involves factorials and is
(2) Thc null hypothesis holds that the radio impulses were gen-erated by a source other than gunshot sounds, and if so, then occurrence or absence of a peak at any given window is determined by chance and the frequency of impulses. It was an unstated assumption of the analysis that whatever gener-ated the impulses on the evidence tape would have generat-ed impulses at the same approximate frequency as a gun-shot in Dealey Plaza. The NRC report noted that the HSCA's calculation of p contained errors. This was true.
The errors seem to have arisen because one laboratory (New York) provided the data, while the second laboratory (Cambridge) calculated the value of p. The latter made two overt errors in assigning values to the parameters M, N, r and i. The first was quite simple The matching procedure begins with the alignment of the first peak in each pattern the impulse corresponding to the muzzle blast. Because these impulses are aligned deliberately they cannot be scored as a match. Only the peaks representing echoes were free to coincide or not. Therefore, the number set 15. 13. and 11. must be reduced to 14, 12. and 10 for the values of N, n and i respectively. The researchers in Cambridge began their analysis with the number set representing the echoes but then made the correction for the deliberate alignment of the first spike. failing to recognise that the correction was already built in, then compounded the error by only reduc-ing the value of i, the number of coincidences, by one, giv-ing an erroneous number set of 14, 12, and 9 for N. n and i, respectively, in their analysis [351.
A second error involved the value of M, the number of win-dows. The test pattern was 3743 msec in duration. Inasmuch as the scoring of coincidence was based on a proximity of
msec, each window was 2 msec wide and there should be 370/2 = 185 windows. However, in this particular instance, the echoes arrive in two discrete clusters. The echoes originating with the structures on Elm Street arrive within the first 85 msec. The echoes originating with the structures farther back on Houston Street arrive in the last 95 msec [36]. The 190 msec gap between the clusters cor-responds to the open space at the intersection of Elm and Houston. The evidence tape has the same pattern of peaks in two clusters. It was reasoned that if some unidentified phenomenon was generating clusters of impulses. then only the time span including peaks should be incorporated in the analysis. Thus, the 190 msec open span is eliminated and the appropriate time span would be 180 msec, and there-fore, the value of M would be 180/2 = 90 windows. The HSCA report states erroneously that the patterns arrive in two clusters encompassing a total of 90 msec [37]. Thus, an erroneous value of 90/2 = 45 windows was assigned to M.
The adjustment of the M value is particularly noteworthy with respect to a contention made by the NRC panel. The NRC panel argued that the calculation of p using the hyper-geometric function assumes a Poisson distribution. If the source of the impulse patterns was some non-white noise the distribution of peaks might be non-Poisson and there-fore have a different probability [38]. However, the NRC panel offered no evidence nor suggested any non-white noise phenomena that might account for the impulse pat-terns Their argument also overlooked that in making the assumption requiring that the frequency of impulses would be the same approximate number as that generated by gunshot echoes, and by constricting the nine span only to
26
Science di Justice 2001; 41(1), 21-32
EAR. 26. 2001 4:51PM
DB THOMAS
NO. 1704 P. Fi
that encompassed by the impulses, the HSCA analysts had in fact incorporated an adjustment for any statistical bias against a Poisson distribution.
In any event, the HSCAanalysts used an erroneous number set for (M,N,n,i) of (45,14.12,91, which for the reasons explained above, should have been (90,14,12.10). With 14 peaks in one pattern and 12 peaks in the other, the chances of getting nine coincidences out of 45 windows is 3.13 x 10-', and wee so reported 1391. This is not the final value of p, however Another adjustment is required because the ana-lytically determined motorcycle position was a free vari-able. Theoretically, there were 180 possible microphone positions. This is the equivalent of purchasing 180 tickets to increase one's chances of winning a lottery. Thus, the value 3.13 x 10' has to be multiplied by 180, giving the final value for p of 0.0563 (the HSCA report gives 0.053 [401). Had these analysts not committed the aforementioned errors and used the data set 190,14,12,101, the odds would be 1.04
10-' and multiplying by 180 gives a final value for p of 1.87 x 10⁴, or about 50,000 to one, against.
The NRC panel was aware of some of the errors made by the HSCA consultants in the calculation of p and identified others that they described as 'errors of statistical reasoning.' The NRC panel calculated that with these errors eliminated the correct value of p was 0.223 [411. However. I will show that the NRC calculation was, also, not correct.
Firstly, the NRC panel recognised that the correct value of M was 90 and not 45. Thus, they began their analysis with the number set reported by the New York lab. with the cor-rection for M giving (9034.12.10). The NRC panel then adjusted these numbers to account for what they judged to be errors of statistical reasoning.
Close scrutiny of the data revealed discrepancies in the scoring procedure with respect to two pairs of echoes. One pair of echoes. designated numbers 19 and 20. were sepa-rated by only 3 msec on the test pattern [421. Applying the sonar model so the echo delay times predicted that these two echoes would have arrived precisely coincident with one another when the microphone is moved to the predicted motorcycle position [43]. In fact, there is only one peak in the evidence pattern at the corresponding echo delay loca-tion. The HSCA analysts scored the two echoes as separate coincidences givine a contribution of 2, 2, and 2 to the val-ues of N, n and i respectively. The NRC panel took the posi-tion that because there really is only one peak on the evi-dence pattern in this position, and one on the predicted pat-tern, the contribution to N, a and i should have been 1, 1. and I respectively. Because there really are two echoes involved, the assigned values were not really an error un the pan of the HSCA. Rather, of the two reasonable alternative scoring procedures the NRC procedure was simply the more conservative. However. to avoid a type 11 statistical
Science & rushee 2001: 41(1)! 21-32
error, the conservative approach should be adopted. 'his results in a number set of (90,13,11.9).
A similar problem involved echo numbers 23 and 24 On the test tape they are separated by 5 niece [44J. The .oar model predicts their arrival will be much closer. thougl not exactly coincident, approx 1 msec apart, when the m phone is moved to the predicted motorcycle position 15). Likewise, the two echoes on the evidence tape at this :ho delay location are approx 1 cosec apart [461. The EV CA analysts scored the two echoes as contributing values f 2, 2, and 2 to the parameters N, n and i, respectively. But the NRC panel argued that the coincident windows shout be non-overlapping, and because the windows are 2 cosec ide the scoring should count only one coincidence not vo. Inasmuch as there really are two echoes on the test tape, wo separate peaks on the evidence tape, and two predi led echoes on the sonar model, the reduction from two to me coincidences seems overly conservative. In fact, the e R.0 panel scored the contributions to the parameters N, n a cl as 1. 2 and 1, respectively, in effect, insisting on countin an echo for which they would not allow a match. Even ace pt-ing the overly conservative approach to scoring wl ich insisted on non-overlapping windows, their assigned e re
was clearly inappropriate. By the NRC scoring the nun ser set was now (90,12,11.8).
Then, according to the NRC panel, the individual pars se-t= that went into the sonar model should be considers as free variables. For example. the location of the motore :le microphone was found by trying different possible It :a-lions until a best fit was found. The HSCA factored tis parameter into the estimate of p by multiplying by a fa, tor of 180, the number of potential microphone locations. ' he NRC panel reasoned that each free variable could be tr• at-cd as a degree of freedom and that an appropriate nun. 'er of df could be deducted straight from the values of the p; -a-meters defining p. In the case of the motorcycle low' el. instead of multiplying by 180. 2 df could be deduc ed because the microphone position was free to vary in vo dimensions. Likewise, they argued that 2 df could be deducted for the shooter location. An additional df could ee applied to the function in the sonar model which adjus td for tape speed and air temperature, another for motorcy to speed and one for "time of shot," for a total of 7 df [' '1. Deducting the 7 df the NRC panel arrived at a final num er set of (83,5,4.11 (481. The value of p calculated from t is number set is 0,207 (NRC reported 0.223 (491).
The NRC report contains the admission that their estim to of p may be somewhat 'unduly conservative'(501. This v is true. While the possible motorcycle position was certai. ly free to vary in two dimensions, this was not true of to shooter position. The shooter could not have been any c s-tance away from the fence on the Grassy Knoll, and tt is
was not truly free to vary in two dimensions, but only ale .e
MAR. 26. 2001 4:51PM NO, 1704 P. 9 Echo correlation analyser and acoustic evidence in the Kennedy assassination
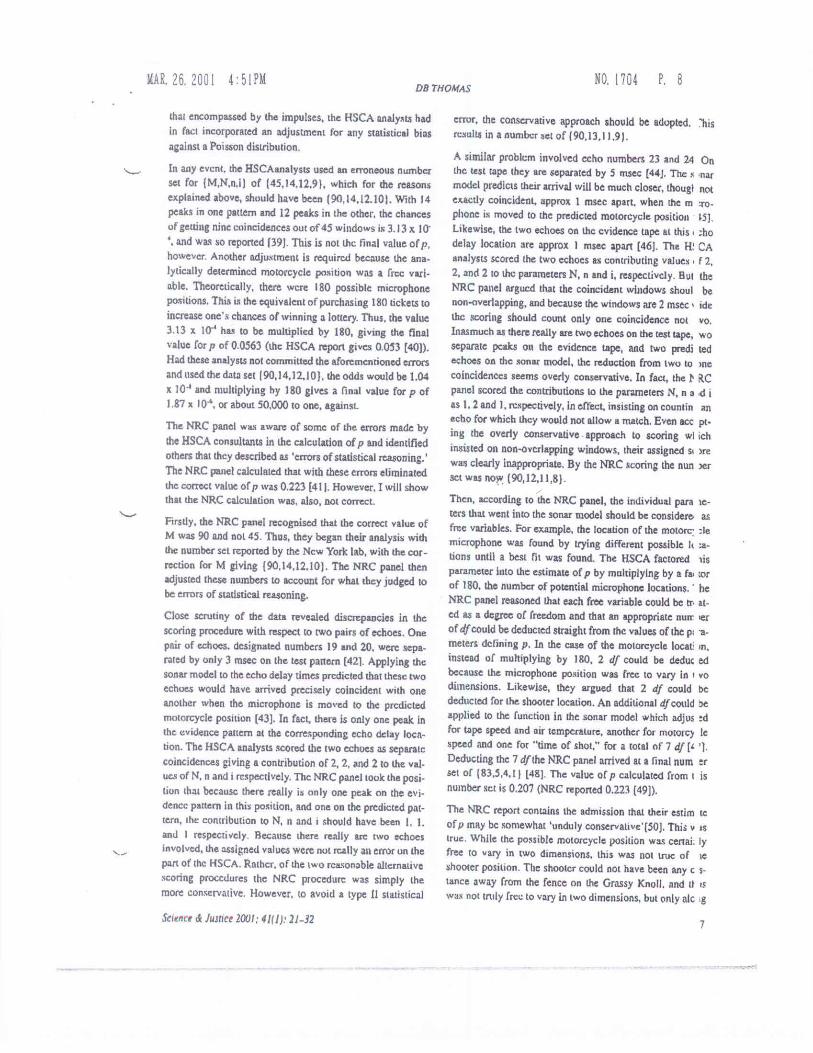
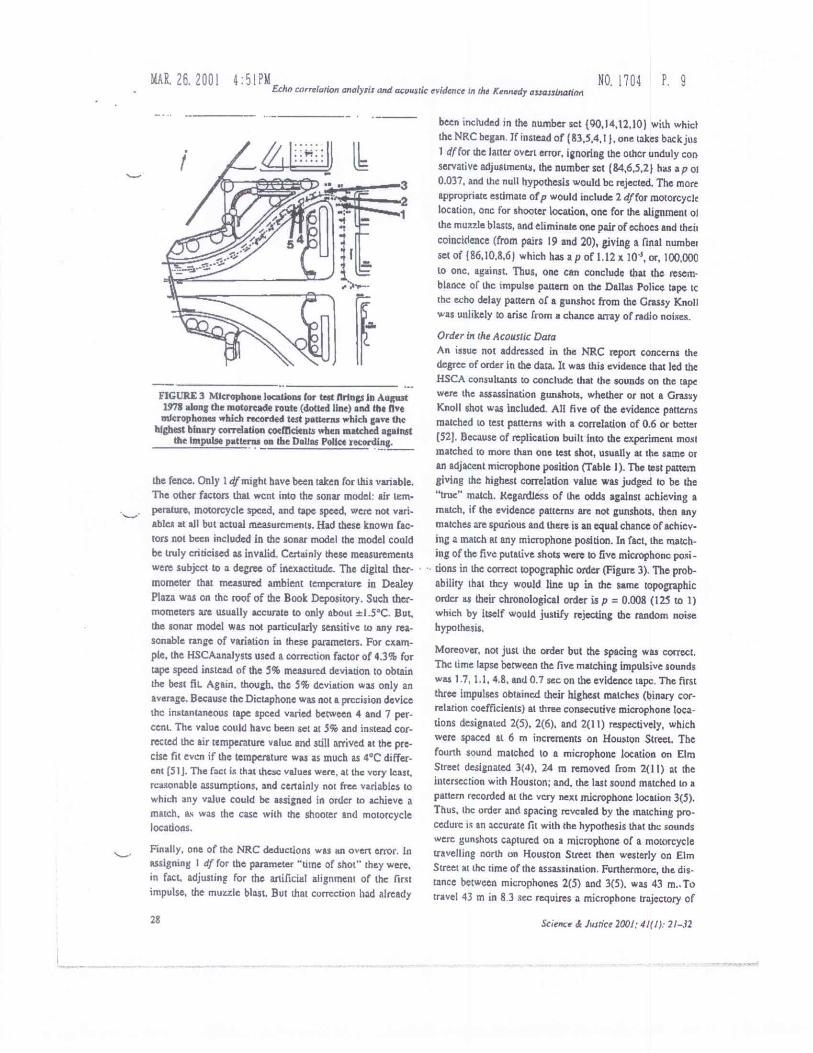
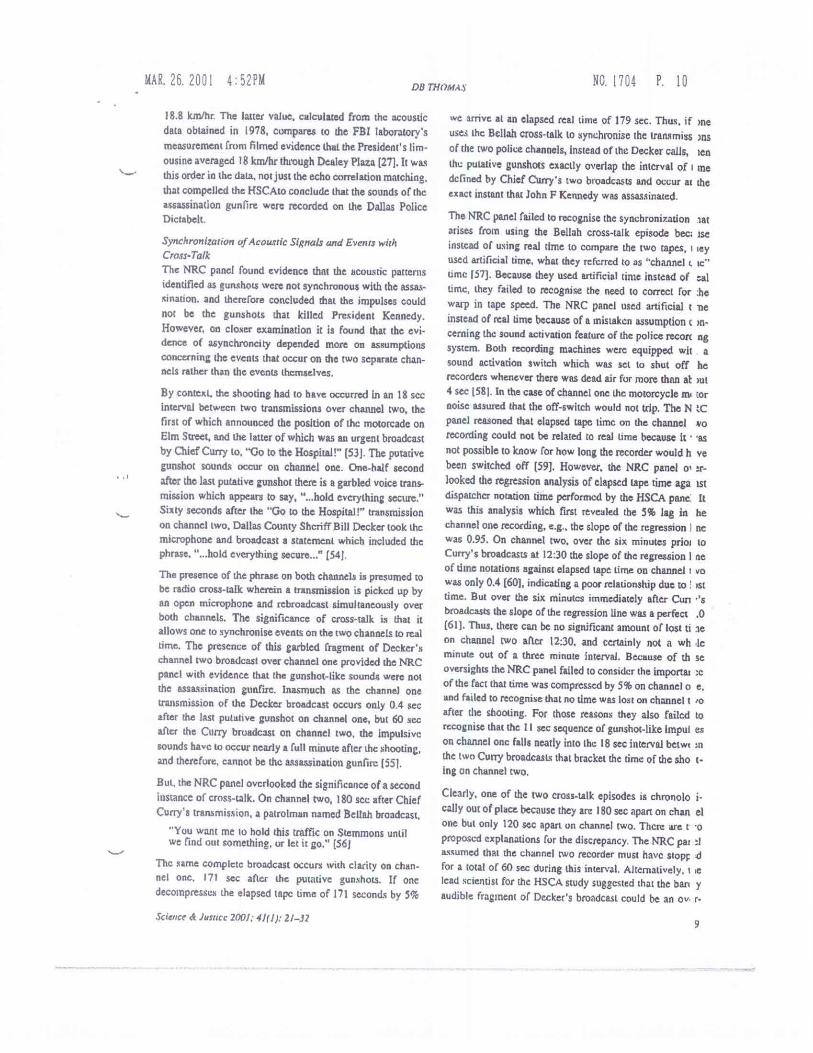
FIGURE 3 Microphone locations for test things In August 1978 along the motorcade route (dotted line) and the rive microphones which recorded test patterns which gave the
highest binary correlation coefIlcients when matched against the Impulse patterns on the Dallas Police recording.
the fence. Only 1 df might have been taken for this variable. The other factors that went into the sonar model: air tem-perature, motorcycle speed, and tape speed, were not vari-ables at all but actual measurements. Had these known fac-tors not been included in the sonar model the model could be truly criticised as invalid. Certainly these measurements were subject to a degree of inexactitude. The digital ther-mometer that measured ambient temperature in Dealey Plaza was on the roof of the Book Depository. Such ther-mometers are usually accurate to only about ±-1.5°C. But, the sonar model was not particularly sensitive to any rea-sonable range of variation in these parameters. For exam-ple, the HSCAanalysts used a correction factor of 4.3% fur tape speed instead of the 5% measured deviation to obtain the best fit. Again, though, the 5% deviation was only an average. Because the Dictaphone was not a precision device the instantaneous tape speed varied between 4 and 7 per-cent, The value could have been set at 5% and instead cor-rected the air temperature value and still arrived at the pre-cise fit even if the temperature was as much as 4°C differ-ent (511. The fact is that these values were, at the very least, reasonable assumptions, and certainly not free variables to which any value could be assigned in order to achieve a match, its was the case with the shooter and motorcycle locations.
Finally, one of the NRC deductions was an overt error. In assigning I df for the parameter "time of shot" they were, in fact, adjusting for the artificial alignment of the first impulse, the muzzle blast. But that correction had already
been included in the number act (90,14,12,10) with whit} the NRC began if instead of (83,5,4,11, one takes back ins 1 df for the latter overt error, ignoring the other unduly con servative adjustments, the number set (84,6,5,2) has a p of 0.037, and the null hypothesis would be rejected. The more appropriate estimate of p would include 2 df for motorcycle location, one For shooter location, one for the alignment of the muzzle blasts, and eliminate one pair of echoes and then coincidence (from pairs 19 and 20), giving a final number set of 186,10,8,61 which has a p of 1.12 x 10', or, 100,000 to one, against. Thus, one can conclude that the resem-blance of the impulse pattern on the Dallas Police tape Lc the echo delay pattern of a gunshot from the Grassy Knoll was unlikely to arise from a chance an•ay of radio noises.
Order in the Acoustic Dara
An issue not addressed in the NRC report concerns the degree of order in the data, It was this evidence that led the HSCA consultants to conclude that the sounds on the tape were the assassination gunshots, whether or not a Grassy Knoll shot was Included. All five of the evidence patterns matched to test patterns with a correlation of 0.6 or better (52]. Because of replication built into the experiment most matched to more than one test shot, usually at the same or an adjacent microphone position (Table I). The test pattern giving the highest correlation value was judged to be the "true" match. Regardless of the odds against achieving a match, if the evidence patterns are not gunshots, then any matches are spurious and there is an equal chance of achiev-ing a match at any microphone position. In fact, the match-ing of the five putative shots were to five microphone posi-dons in the correct topographic order (Figure 3). The prob-ability that thcy would line up in the same topographic
order as their chronological order is p = 0.008 (125 to 1) which by itself would justify rejecting the random noise hypothesis.
Moreover, not just the order but the spacing was correct. The time lapse between the five matching impulsive sounds was 1.7, 1.1, 4.8, and 0.7 sec on the evidence tape. The first three impulses obtained their highest matches (binary cor-relation coefficients) at three consecutive microphone loca-tions designated 2(5). 2(6). and 2(11) respectively, which were spaced at 6 m increments on Houston Street. The fourth sound matched to a microphone location on Elm Street designated 3(4), 24 m removed from 2(1 I) at the intersection with Houston: and, the last sound matched to a pattern recorded Al the very next microphone location 3(5). Thus, the order and spacing revealed by the matching pro-cedure is an accurate fit with the hypothesis that the sounds were gunshots captured on a microphone of a motorcycle travelling north on Houston Street then westerly on Elm Street at the time of the assassination. Furthermore, the. dis-tance between microphones 2(5) and 3(5), was 43 m.- To travel 43 m in 8 3 sec requires a microphone trajectory of
28 Science tit hrtice 2001: 41(1): 21-32
Ma 26.2001 4:52PM DB THolviAs
NO. 1704 P. 10
18.8 km/hr The latter value, calculated from the acoustic data obtained in 1978, compares to the FBI laboratory's measurement from filmed evidence that the President's lim-ousine averaged 18 km/hr theough Dealey Plaza [27]. It was this order in the data, not just the echo correlation matching, that compelled the HSCAto conclude that the sounds of the assassination gunfire were recorded on the Dallas Police Dictabelt.
Synchronization of Acouttic Signals and Events with Cross-Talk
The NRC panel found evidence that the acoustic patterns identified as gunshots were not synchronous with the assas-sination. and therefore concluded that the impulses could not be the gunshots that killed President Kennedy. However, on closer examination it is found that the evi-dence of asynchroncity depended more on assumptions concerning the events that occur on the two separate chan-nels rather than the events themselves.
By context, the shooting had to have occurred in an 18 sec interval between two transmissions over channel two, the first of which announced the position of the motorcade on Elm Street, and the latter of which was an urgent broadcast by Chief Curry to. "Go to the Hospital" (53J. The putative gunshot sounds occur on channel one. One-half second after the last putative gunshot there is a garbled voice trans-mission which appears to say, "...hold everything secure." Sixty seconds after the "Go to the Hospital!" transmission on channel two. Dallas County Sheriff Bill Decker took the microphone and broadcast a statement which included the phrase. "...hold everything secure..." [541.
The presence of the phrase on both channels is presumed to be radio cross-talk wherein a transmission is picked up by an open microphone and rebroadcast simultaneously over both channels. The significance of cross-talk is that it allows one to synchronise events on the two channels to real time. The presence of this garbled fragment of Decker's channel two broadcast over channel one provided the NRC panel with evidence that the gunshot-like sounds were not the assassination gunfire. Inasmuch as the channel one transmission of the Decker broadcast occurs only 0.4 sec after the last putative gunshot on channel one, but 60 sec after the Curry broadcast on channel two, the impulsive sounds have to occur nearly a full minute after the shooting, and therefore. cannot be the assassination gunfire [551.
But, the NRC panel overlooked the significance of a second instance of cross-talk. On channel two, 180 sec after Chief Curry's transmission, a patrolman named Bellah broadcast.
"You want me to hold this traffic on Stemmons until we find out something, or let it go." [561
The same complete broadcast occurs with clarity on chan-nel one, 171 sec after the putative gunshots. If one decompresses the elapsed tape time of 171 seconds by 5%
we amve at an elapsed real time of 179 sec. Thus, if me uses the Bellah cross-talk to synchronise the transmiss )ns of the two police channels, instead of the Decker calls, ten the putative gunshots exactly overlap the interval of i me defined by Chief Curry's two broadcasts and occur at the exact instant that John F Kennedy was assassinated.
The NRC panel failed to recognise the synchronization sat arises from using the Bellah cross-talk episode bee; tse instead of using real time to compare the two tapes, i ley used artificial time, what they referred to as "channel t ic" time 1571. Because they used artificial time instead of cal time, they failed to recognise the need to correct for he warp in tape speed. The NRC panel used artificial t ne instead of real time because of a mistaken assumption cerning the sound activation feature of the police recon ng system. Both recording machines were equipped wit a sound activation switch which was set to shut off he recorders whenever there was dead air for more than at nit 4 sec 1581. In the case of channel one the motorcycle m■ for noise assured that the off-switch would not trip. The N tC panel reasoned that elapsed tape time on the channel vo recording could not be related to real time because it • 'as not possible to know for how long the recorder would h ve been switched off [59]. However, the NRC panel co sr-looked the regression analysis of elapsed tape time aga ist dispatcher notation time performed by the HSCA pane. It was this analysis which first revealed the 5% lag in he channel one recording. e.g., the slope of the regression ! ne was 0.95. On channel two, over the six minutes prim to Curry's broadcasts at 12:30 the slope of the regression 1 ne of dine notations against elapsed tape time on channel t vo was only 0.4 [60], indicating a poor relationship due to ! is( time. But over the six minutes immediately after Cun •'s broadcasts the slope of the regression line was a perfect .0 [611. Thus, there can be no significant amount of lost ti ie on channel two after 12:30, and certainly not a wh de minute out of a three minute interval. Because of th se oversights the NRC panel failed to consider the importai :c of the fact that time was compressed by 5% on channel a e, and failed to recognise that no time was lost on channel t ro after the shooting. For those reasons they also failed to recognise that the II sec sequence of gunshot-like impul es on channel one falls neatly into the 18 sec interval betwi sn the two Curry broadcasts that bracket the time of the sho t-ine on channel two.
Clearly, one of the two cross-talk episodes is chronolo cally out of place because they are 180 sec apart on than el one but only 120 sec span on channel two. There are t '0
proposed explanations fur the discrepancy. The NRC par :1 assumed that the channel two recorder must have stopp for a total of 60 sec during this interval. Alternatively, lead scientist for the HSCA study suggested that the ban y audible fragment of Decker's broadcast could be an oss r-
Science A Justice 2001: 41f11: 21-32 9
MAR. 26. 2001 4:52PM NO. 1704 Echo correlation analysis and acoustic evidence in the Kennedy assassination
M' ` 1. Microphone 0.,ca
i, 1 a‘
OLS 1, as mi '44,411
)6, 1
43.1 o \ Kennedy
it
;1 21-3 11 '41
A" Shooter
A' Grimly Knoll
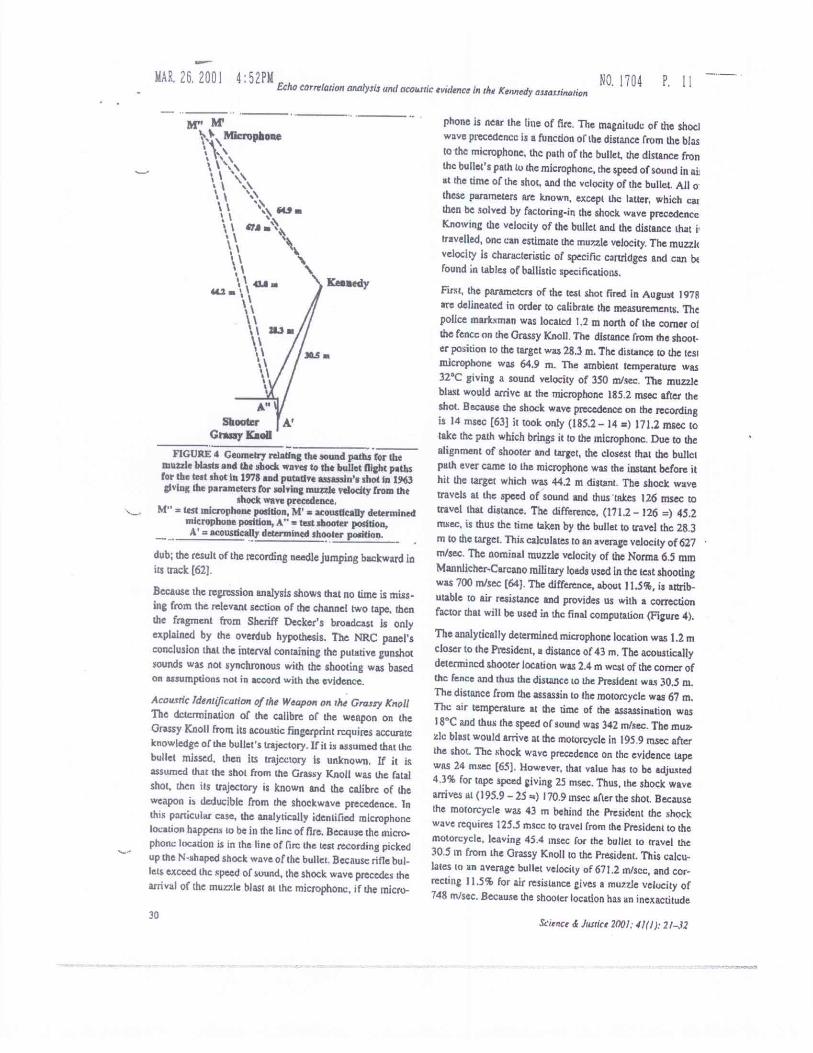
FIGURE d Geometry relating the sound paths for the Innate blasts and the shock waves to the bullet flight paths for the test shot hi 1978 and putative assassin's shot in 1963 ;Ping the parameters for solving muzzle velocity from the
shock wave precedence, hi" = test microphone position, M' = acoustically determined
microphone position, A" = test shooter position, A' = acoustically determined shooter position.
dub; the result of the recording needle jumping backward in its track [621.
Because the regression analysis shows that no time is miss-ing from the relevant section of the channel two tape, then the fragment from Sheriff Decker's broadcast is only explained by the overdub hypothesis. The NRC panel's conclusion that the interval containing the putative gunshot sounds was not synchronous with the shooting was based on assumptions not in accord with the evidence.
Acoustic Identification of the Weapon on the Grassy Knoll The determination of the calibre of the weapon on the Grassy Knoll from its acoustic fingerprint requires accurate knowledge of the bullet's trajectory. If it is assumed that the bullet missed. then its trajectory is unknown, If it is assumed that the shot from the Grassy Knoll was the fatal shot, then its trajectory is known and the calibre of the weapon is deducible from the shockwave precedence. In this particular case, the analytically identified microphone location happens to be in the line of fire. Because the micro-phone location is in the line of fire the test recording picked up the N -shaped shock wave of the bullet. Because rifle bul-lets exceed the speed of sound, the shock wave precedes the arrival of the muv.le blast at the microphone, if the micro-
phone is near the line of fire. The magnitude of the shod wave precedence is a function of the distance from the bias to the microphone, the path of the bullet, the distance iron the bullet's path to the microphone, the speed of sound in as at the time of the shot, and the velocity of the bullet. All o these parameters are known, except the latter. which cat then be solved by factoring-in the shock wave precedence Knowing the velocity of the bullet and the distance that I' travelled, one can estimate the muzzle velocity. The muzzlt velocity is characteristic of specific cartridges and can bt Found in tables of ballistic specifications.
First, the parameters of the test shot fired in August 1978 are delineated in order to calibrate the measurements. The police marksman was located 1.2 m north of the corner of the fence on the Grassy Knoll. The distance from the shoot-er position to the target was 28.3 m. The distance to the test microphone was 64.9 rn. The ambient temperature was 328C giving a sound velocity of 350 in/sec. The muzzle blast would arrive at the microphone 185.2 msec after the shot. Because the shock wave precedence on the recording is 14 msec [633 it took only (185.2 - 14 =) 171.2 msec to take the path which brings it to the microphone. Due to the alignment of shooter and target, the closest that the bullet path ever came to the microphone was the instant before it hit the target which was 44.2 m distant. The shock wave travels at the speed of sound and thus 'takes 126 msec to travel that distance. The difference, (171.2 - 126 =) 45.2 msec, is thus the time taken by the bullet to travel the 28.3 m to the target. This calculates to an average velocity of 627 m/sec. The nominal muzzle velocity of the Norma 6.5 mm Mannlicher-Carcano military loads used in the test shooting was 700 msec (64). The difference, about 11.5%, is attrib-utable to air resistance and provides us with a correction factor that will be used in the final computation (Figure 4).
The analytically determined microphone location was 1.2 m closer to the President, a distance of 43 m. The acoustically determined shooter location was 2.4 m west of the corner of the fence and thus the distance to the President waa 30.5 m. The distance from the assassin to the motorcycle was 67 m. The air temperature at the time of the assassination was 18°C and thus the speed of sound was 342 msec. The muz-zle blast would arrive at the motorcycle in 195_9 msec after the shot.. The shock wave precedence on the evidence tape was 24 msee [65). However, that value has to be adjusted 4.3% for tape speed giving 25 msec. Thus, the shock wave arrives 51 (195.9 - 25 170.9 msec after the shot. Because the motorcycle was 43 m behind the President the shock wave requires 125.5 msce to travel from the President to the motorcycle, leaving 45.4 insee for the bullet to travel the 30.5 m from the Grassy Knoll to the President. This calcu-lates to an average bullet velocity of 671.2 in/sec, and cor-recting 11.5% for air resistance gives a muzzle velocity of 748 m/sec. Because the shooter location has an inexactitude
30 Science & Justice 2001: 41(/).• 21-32
Ma 26. 2001 4:53PM
DB THOMAS
NO. 1704 P. i2
of 1.1.5 tn, the estimate must be assigned an error of about ±32 m/sec.
A check of ballistic tables from 1963 [661 shows more than a dozen commercially available cartridges with a muzzle velocity of 748 ±32 m/sec, most of them in the .30 calibre range. The popular .30-30 Winchester with a muzzle veloc-ity of 735 m/sec falls in this category and is noteworthy in the context of the Dallas. Police tapes. At 12.45 pm, 15 min after the shooting, a police officer in Dcalcy Plaza radioed in the following information over channel one
"The wanted person in this is a slender white male about thirty, five feet ten, one sixty five, carrying what looked to be a 30-30 or some type of Winchester" [671
Summary and Conclusions The validity of acoustic evidence for a gunshot from the `Grassy Knoll' was challenged on statistical grounds and on the basis of an anomaly on the Dallas police recordings. However, the assumptions underlying those criticisms were not in accord with evidence overlooked by the review panel. With a rigorous statistical analysis one arrives at a calculation for the probability that the recording contains a random pattern which by chance resembled the acoustic signature of a gunshot from the Grassy Knoll at no more than ps=,,0.037.
The NRC panel asserted that radio cross-talk indicated asynchroneity between the putative gunshots on channel one and the time of the assassination revealed by context on channel two. The NRC panel overlooked that an alternative synchronization arises from the radio cross-talk evidence because of the fact that the two identifiable eases of cross-talk were out of synch with one another. The episodes are three minutes apart on one channel, but only two minutes apart on the other. Had the unambiguous instance of cross-talk been used, instead of the barely audible fragment of cross-talk, the supposed asynchroneity in the evidence would have been resolved. The unambiguous cross-talk evi-dence indicates that the gunshot-like sounds on channel one were recorded over the police radio at the precise instant in real time that the President was being assassinated by gun-fire.
The order in the data. that is. the congruence between the acoustic evidence and the sequence of events derived from a reconstruction of the crime from video evidence is the major factor that led acoustic experts to conclude that there was a gunshot from the Grassy Knoll during the assassina-tion. The critiques of the acoustic evidence by the NRC panel and the FBI laboratory failed to consider that evi-dence. There was a further incongruity in the arguments of the NRC panel, and perhaps irony, in that a broadcast over the police radio sent one minute after the assassination giving orders to search behind the Grassy Knoll for an assassin, was invoked as evidence that there was no assas-
Snence h Misfire 2001, 41(1): 21-32
sin on the Grassy Knoll,
Acknowledgements I am grateful to James E Barger of Bolt, Barancl & Newman for his comments on the manuscript and pat ant explanation of the concepts behind his analysis. Alse to Stephan Barber of Mansfield, Ohio, for information rola Ave to his discovery of the Decker cross-talk. Robert G Bla ey, Notre Dame University, Brett C Ratcliffe, Universa; of Nebraska, and Gary Mack of the Sixth Floor Muse m. Dallas Texas, reviewed and commented on a draft of the manuscript. Chris Mari Van Dyke of McAllen. Tc as, assisted with the figures.
References 1. Koenig BE Acoustic Gunshot Analysis: the Kennedy /Isaiah% Mn
and beyond- Law Enforcement Bulletin 52(111: 1-9 (pt 1), : 1- 9 (pt. 2), 1983.
2 Report of the President's Commission on the Assassinatiot of President John F. Kennedy. US Gov( Print. Oft Washington IC. 1964 (hereinafter referenced as Warren Commission). p. 19.
3. Warren Commission Hearings, vol. 23. Exhibit No. 1974. 4. Pt. Worth Stu-Telegram, I September 1977. 5. L'S Congress, House of Representatives, House Report wn. 95-1 28.
Select Committee on Assassinations. U.S. Gov't Print. /ff. Washington D.C. 1979 (hereinafter referenced HSCA). I nal Report. pp, 76. 94.
6. Weiss, MR ik Aschicenasy. A. An analysis of recorded sounds relt dg to the assassination of President John F Kennedy. Dept. Comp ter Sciences. Queens College, City Univmsity Ncw York_ I f9 HSCAProceedinga Vol. 6, p. 32.
7. Barger, JE. Robinson, SP, Schmidt EC & Wolf, JJ AnatStsi of Recorded sounds relating to the nssitashtation of President Jot F. Kennedy. Bolt, Buranct tit Newman. Inc., 1979. H5 'A Proceedings Vol. 8 p. 116.
8. HSCAFina1 Report, p. 95. 9. National Research Council, Committee on Ballistic Acoux es.
Reexamination of acoustic evidence in the Kennedy aSSaStirint in Science 218: 127-133. 1982.
10. National Research Council, Report of the Committee on Bail tic Acoustics. Prepared for Department of Justice. Washington r C. Report No. P1381-218461, p. 16.. 1982. (Hereinafter reference ea NRC Report).
1 I. Sokol RR and Road' F). Introduction to Bionatisties. San Franci :o. CA: WH Freeman At Co., 19731 p. 112.
l2. Ott L. An Introduction to Statistical Melhoda and Dass Amtd), Boaton, MA: PWS-Kent Publ., 1988; p. 151.
11. Barger et al, p. 38. 14, Hollien H. The Acoustics of Crime: The New Science of Fore. .ic
Acoustic. New York, NY, Plenum Press, 1990 15 Bowles IC. The Kennedy ASSASSolltiOn Tapes: a rebuttal to 'le
acoustical evidence theory. In: G Savage, JPK: First 1 sy Evidence. monnae, LA.: Shoppe Press. 1993: 313410.
16. Marrs J. Crossfire: the plot that killed Kennedy New York, NY: Ca ill & Graf, 1989: p 531,
17. Barger et al. p. 23. 18. Barger et at, p. 49. 19, Barger et at, p. 54. 20. Roger et ill, p. 54. 21. HSCArroceetlings vol. 5, p. 677, 22. Diaper et al. appendix C. 23. Barger et al, p. 57. 24. Barger es al, p. 60. 35. Weiss & AlChkeneay. p. 21, 26. Weiss & Ashkenasy p. 21. 27 Warren Report. p. 49. 28. Burger et al. p. 73.
MAR, 26. 2001 4:53PM Echo correlation ana4 cis and acoustic evidence in the Kennedy assusgination
NO. 17 04
29. Weiss & Mchkeriasy. p. 27.
30. & Aschkensay, p. 27. 31. Weiss- & Aschkenasy. p. 31 32. Weiss & Aschkenasy. pp. 30-31 33. Weisz & Aschkenasy, p.31. 34. Lewitt M. Elementary Appherl Statistic,. Belmont, CA: Roden &
Quigley, 1972. 35. Barger et al, p. 76. 36. Weiss & AschEenaly, p.30, 37. Barger et al. p 71. 38. NRC Report. p. 38. 39 Barger or al., p. 76. 40, Barger et al.. p. 76 41. NRC Report, p. 40. 42. Wens & Aschkenixy, p. 24, Table 3. 43. Weiu & Aiehkenasy, p. 27. Table 4.
4.4. Vitt44 k Aschkerialy, p. 24. Table 3. 45. Weibl. & Axchlecimsy, p. 27. Table 4
46. Weirs & Awhkensiy, p. 27, Table 4. 47. NRC Ripon. p. 40. 48. NRC Report, p. 40. 49. NRC Report. p. 40. 50. NRC Report, p. 40.
51. weiss & Aschkenasy p. 27. 52. Borger et al_ p. 60, 53. NRC Report, pp. 75-76. 54. NRC Reprice, p. 76. 55 NRC Report. p. 2. 56. NRC Rcpon, p. 78. 57. NRC Report, p. 61. 58. NRC Report, p. 64. 59. NRC Report. p. 64. 60. Barger or c,I . p 31 61 Barger or al., p. 31. 62 NRC Report p. 58. 63. HSC:AProceorlings, vol. 5. p. 810 64. B.anes FC. Cartridges of the World 2nd Ear Chicago IL: Gun
Co., 1969; p. /BS. 65. HSCAProcecalings, vol. 5, p, 610, 66. Gun Digest, 47th Arutuul Edition. IT Amber (ed). 1963 I -
reprinted 09 exhibit F-673. HSCA.ProccedInga vol. 5 pp. 57.e 67. Warren Commission Exhibit 1974 p. 25
37 Science & Justice 2001. 41(IJ: 21-
MAR. 26. 2001 4:48PM
NO. 1704 P. 1
illrtUasliingtonpost 11.58 ISM 5TPEET W.
WASHINGTON, D.C. 200714403 (20.2) 33a4000
TO: L'--,SA 12—
FAX NO. 30f -36 1/
FROM: 6er-0 No. of pages (Including cover sheet) /3 If transmission is incomplete, please call (202) 334-
14