
Acute Myocardial Infarction Acute Myocardial Infarction (AMI ...
Upload
uzair-akbarCategory
view
23download
0
Early Detection of Myocardial Infarction Using
WBANIEEE Healthcom 2013
Medina Hadjem, Osman Salem, Farid Naït Abdesselam and Ahmed MehaouaLIPADE Laboratory, University of Paris Descartes, France
Group MembersUzair Akbar
Muhammad Saad QureshiAhmed Shaheer

Overview
AlgorithmDetects Heart attack with 73 %Accuracy

Facts and Figures•25 % of ALL deaths[1]
•326,200 die of out-of-hospital cardiac arrests[2]
•10.6 % survival rate[2]
[2]AHA 2015 Heart and Stroke Statistics
[1]Heart disease and stroke statistics— 2015 update: a report from the American Heart Association

Techniques
Accuracy
Specificity
Sensitivity
Hidden Markov Model(HMM) and Gaussian Mixture Models (GMM).
82.5%
79.82%
85.71%
K-Nearest Neighbor (KNN)Classifier
98.3%
99.6%
97%
Discrete WaveletTransform (DWT).
95%
Not Specified
Not Specified
BayesianANN Classifier
94% for MI cases93.3% for normal cases
Not Specified
Not Specified
SVMNaïve Bayes (NB) Random Forecast (RF)
82.8% for SVM81.9% for NB84.5% for RF
Not Specified
Not Specified

What This Paper Proposes• A Real-time method for early detection of MI
• Autonomy of patients and remote capture of ECG using WBAN
• A low power consumption algorithm adapted to WBAN using CUSUM Method
• Detection rate 73 % and False alarm rate 5 %.

ECG Signal Processing & Feature Extraction
ECG Wavelet
Decomposition
Baseline wander Removal
ECG features
ST segment amplitudes
R
peaks detection
P
peaks Q peaks S
peaks T
peaks
S offsets
S onsets
T offsets
T onsets
Q offsets
Q onsets
P offsets
P onsets

Implementation of the code

What Is Myocardial Infarction?
• Commonly referred to as “Heart Attack”.
• Occurs when heart’s supply of blood is stopped.
• Not fatal if proper medical treatment is given on timely diagnosis.

The ECG (Electrocardiogram)
P
Q
S
R
T
PR Interval
PR Segment
ST Segment
QRS Complex
ST Interval
P
Q
S
R
T
ST Segment Elevation
(a) One-cycle ECG tracing (b) ST Elevation ECG

Experimental Setup

Wavelet Decomposition

Wavelet Decomposition
(a) MI ECG signal from the edb database (b) MI ECG signal after Wavelet Decomposition (c) ECG after filtering and base line correction

Baseline Wander Removal
130 140 150 160 170 180
-1.5
-1
-0.5
0
0.5
1
1.5
Base Line Wandering
130 140 150 160 170 180
-1
-0.5
0
0.5
1
1.5
Baseline Corrected Signal
Baseline Wander Removal from ECG

Peak Detection
100 150 200 250 300
-1
-0.5
0
0.5
1
1.5
Wavelet decomposed and baseline corrected ecg
• Extract Detail Coefficients
• Detect R-peaks
• Detect other peaks relative to R-peaks
P, Q, R, S, T peak detection in ECG
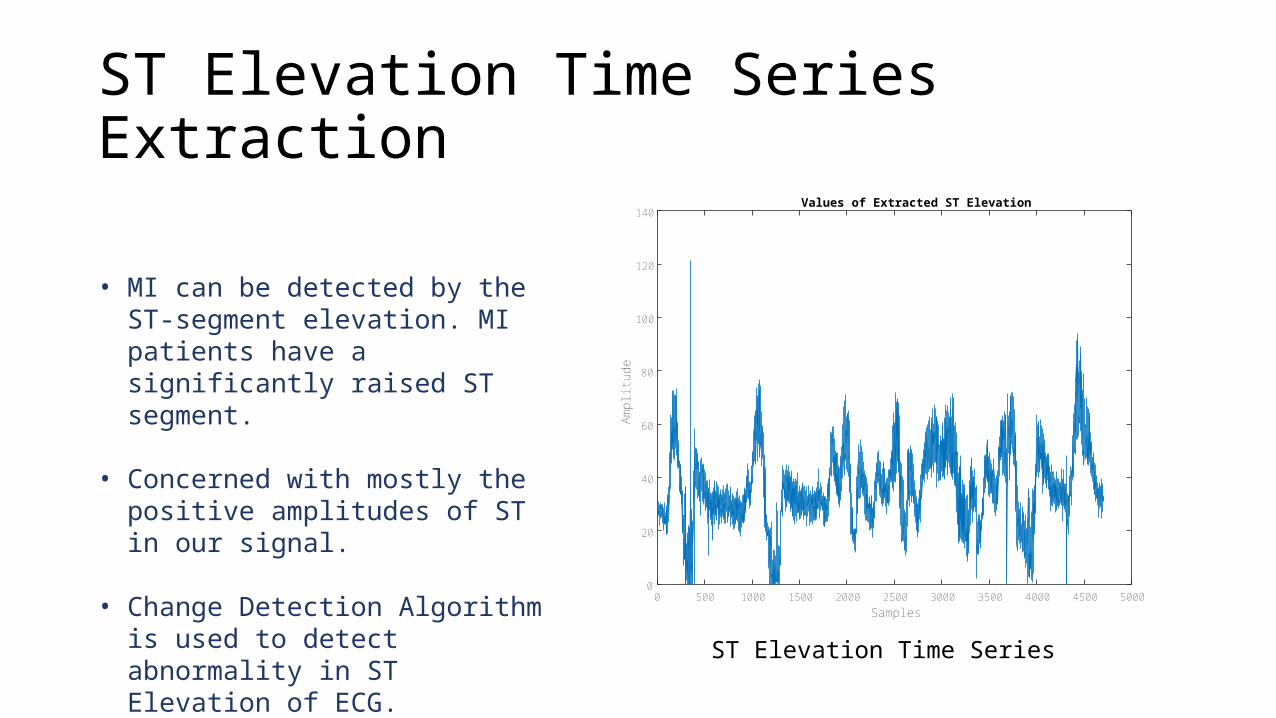
ST Elevation Time Series Extraction
Samples0 500 1000 1500 2000 2500 3000 3500 4000 4500 5000
Am
plitu
de
0
20
40
60
80
100
120
140Values of Extracted ST Elevation
• MI can be detected by the ST-segment elevation. MI patients have a significantly raised ST segment.
• Concerned with mostly the positive amplitudes of ST in our signal.
• Change Detection Algorithm is used to detect abnormality in ST Elevation of ECG. ST Elevation Time Series

CUmulative SUM (CUSUM) AlgorithmInitialization
if necessaryendwhile algorithm running
measure decide between and if
estimate stop or reset
end ifend while
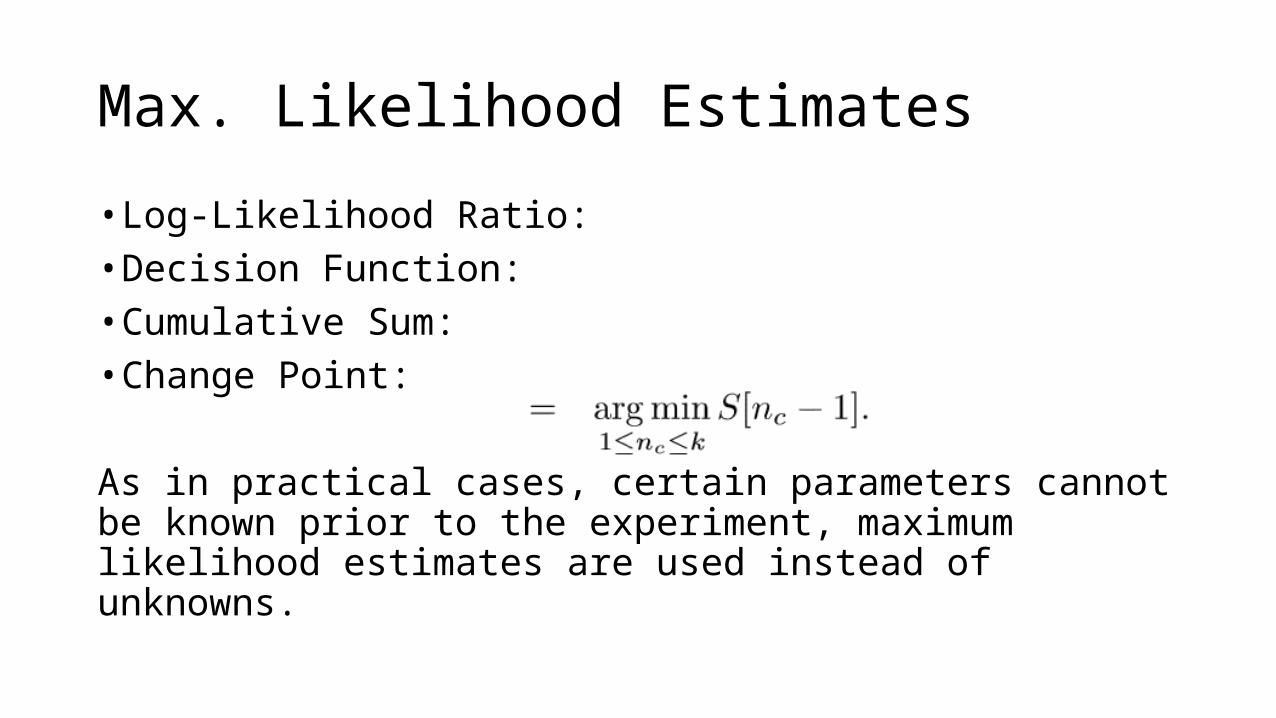
Max. Likelihood Estimates• Log-Likelihood Ratio:• Decision Function:• Cumulative Sum:• Change Point:
As in practical cases, certain parameters cannot be known prior to the experiment, maximum likelihood estimates are used instead of unknowns.

Max. Likelihood Estimates
Typical behaviour of the CUSUM algorithm in the case of an Gaussian signal with a change in the mean at time nc = 1000.

CUmulative SUM (CUSUM) Algorithm
n0 500 1000 1500 2000 2500 3000 3500 4000 4500 5000
x[n]
0
20
40
60
80
100
120
140CUSUM Alarms in Signal x[n]
x[n]CUSUM Alarms
CUSUM Alarms in the ST-Elevation Time Series

Receiver Operating Characteristicsand Results
𝐷𝑒𝑡𝑒𝑐𝑡𝑖𝑜𝑛𝑅𝑎𝑡𝑒=𝑇𝑃 / (𝑇𝑃+𝐹𝑁 )=73%