ECG Morphology
36
1 The Morphology of the Electrocardiogram Antoni Bayés de Luna, Velislav N. Batchvarov and Marek Malik The 12-lead electrocardiogram (ECG) is the single most commonly performed investigation. Almost every hospitalized patient will undergo electrocardiography, and patients with known cardiovascular disease will do so many times. In addition, innumerable ECGs recorded are made for life insurance, occupational fitness and routine purposes. Most ECG machines are now able to read the tracing; many of the reports are accurate but some are not. However, an accurate interpretation of the ECG requires not only the trace but also clinical details relating to the patient. Thus, every cardiologist and physician/cardiologist should be able to understand and interpret the 12-lead ECG. Nowadays, many other groups, for example accident and emergency physicians, anaesthetists, junior medical staff, coronary care, cardiac service and chest pain nurses, also need a Summary good grounding in this skill. In the last several decades a variety of new electrocardiographic techniques, such as short- and long-term ambulatory ECG monitoring using wearable or implantable devices, event ECG monitoring, single averaged ECGs in the time, frequency and spatial domains and a variety of stress recoding methods, have been devised. The cardiologist, at least, must understand the application and value of these important clinical investigations. This chapter deals comprehensively with 12-lead electrocardiography and the major pathophysiological conditions that can be revealed using this technique. Cardiac arrhythmias and other information from ambulatory and averaging techniques are explained only briefly but are more fully covered in other chapters, for example those devoted to specific cardiac arrhythmias. Introduction Broadly speaking, electrocardiography, i.e. the science and practice of making and interpreting recordings of cardiac electrical activity, can be divided into morphology and arrhythmology. While electrocardiographic morphology deals with interpretation of the shape (amplitude, width and contour) of the electrocardiographic signals, arrhyth- mology is devoted to the study of the rhythm (sequence and frequency) of the heart. Although these two parts of electrocardiography are closely interlinked, their metho- dological distinction is appropriate. Intentionally, this chapter covers only electrocardiographic morphology since rhythm abnormalities are dealt with elsewhere in this book. Morphology of the ECG The electrocardiogram (ECG), introduced into clinical practice more than 100 years ago by Einthoven, comprises a linear recording of cardiac electrical activity as it occurs over time. An atrial depolarization wave (P wave), a ventricular depolarization wave (QRS complex) and a ventricular repolarization wave (T wave) are successively 1 TETC01 12/2/05 18:09 Page 1
Transcript of ECG Morphology
1The Morphology of the ElectrocardiogramAntoni Bayés de Luna, Velislav N. Batchvarov and Marek Malik
The 12-lead electrocardiogram (ECG) is the single mostcommonly performed investigation. Almost everyhospitalized patient will undergo electrocardiography,and patients with known cardiovascular disease will doso many times. In addition, innumerable ECGs recordedare made for life insurance, occupational fitness androutine purposes. Most ECG machines are now able toread the tracing; many of the reports are accurate butsome are not. However, an accurate interpretation ofthe ECG requires not only the trace but also clinicaldetails relating to the patient. Thus, every cardiologistand physician/cardiologist should be able to understandand interpret the 12-lead ECG. Nowadays, many other groups, for example accident and emergencyphysicians, anaesthetists, junior medical staff, coronarycare, cardiac service and chest pain nurses, also need a
Summary
good grounding in this skill. In the last several decades a variety of new electrocardiographic techniques, suchas short- and long-term ambulatory ECG monitoringusing wearable or implantable devices, event ECGmonitoring, single averaged ECGs in the time,frequency and spatial domains and a variety of stressrecoding methods, have been devised. The cardiologist,at least, must understand the application and value ofthese important clinical investigations. This chapterdeals comprehensively with 12-lead electrocardiographyand the major pathophysiological conditions that canbe revealed using this technique. Cardiac arrhythmiasand other information from ambulatory and averagingtechniques are explained only briefly but are more fullycovered in other chapters, for example those devoted tospecific cardiac arrhythmias.
Introduction
Broadly speaking, electrocardiography, i.e. the science andpractice of making and interpreting recordings of cardiacelectrical activity, can be divided into morphology andarrhythmology. While electrocardiographic morphologydeals with interpretation of the shape (amplitude, widthand contour) of the electrocardiographic signals, arrhyth-mology is devoted to the study of the rhythm (sequenceand frequency) of the heart. Although these two parts ofelectrocardiography are closely interlinked, their metho-dological distinction is appropriate. Intentionally, thischapter covers only electrocardiographic morphology
since rhythm abnormalities are dealt with elsewhere inthis book.
Morphology of the ECG
The electrocardiogram (ECG), introduced into clinicalpractice more than 100 years ago by Einthoven, comprisesa linear recording of cardiac electrical activity as it occursover time. An atrial depolarization wave (P wave), a ventricular depolarization wave (QRS complex) and a ventricular repolarization wave (T wave) are successively
1
TETC01 12/2/05 18:09 Page 1
2 Chapter 1
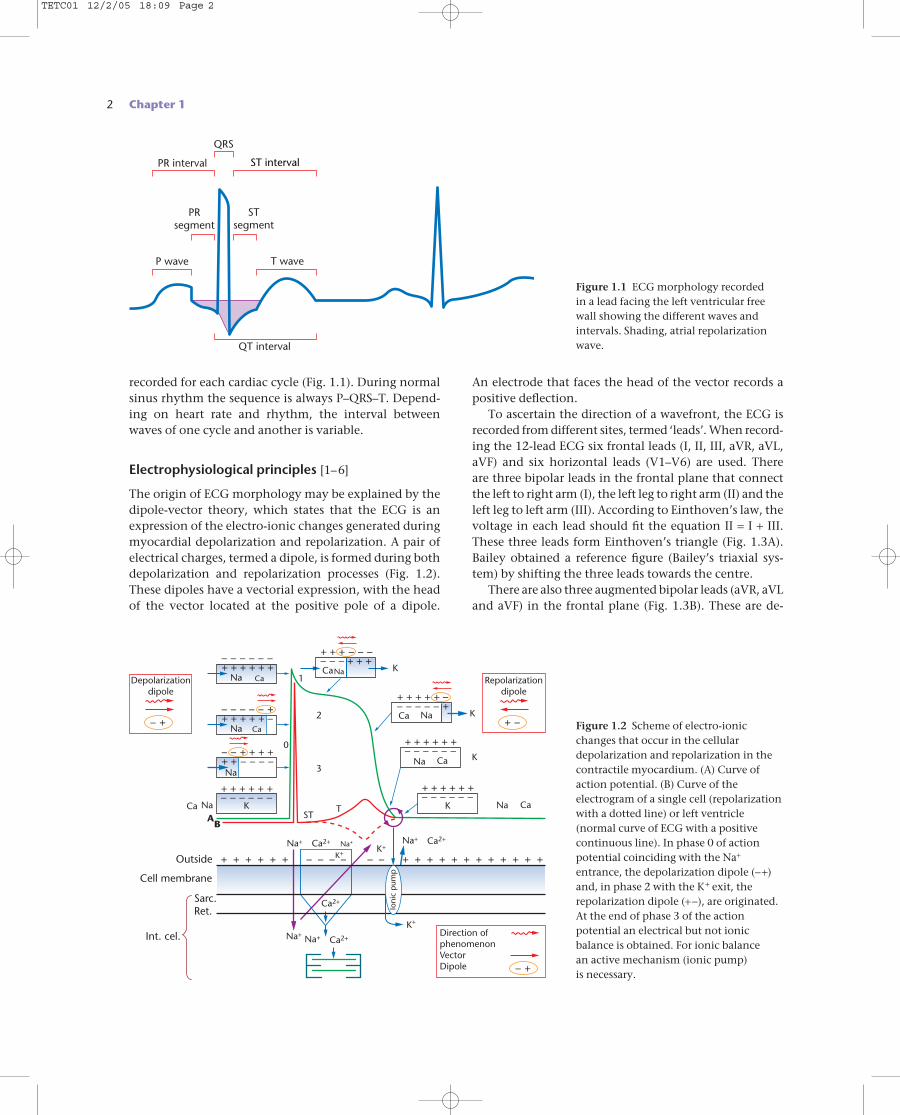
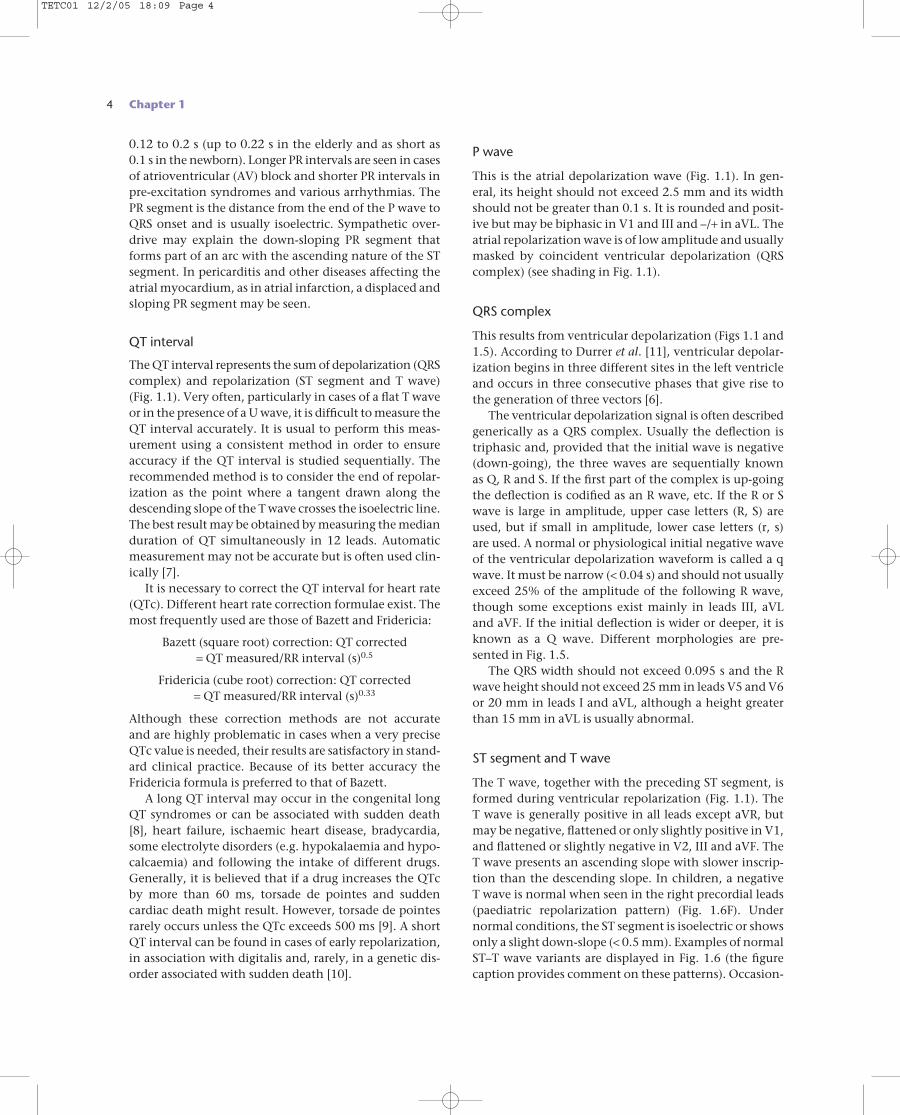
recorded for each cardiac cycle (Fig. 1.1). During normalsinus rhythm the sequence is always P–QRS–T. Depend-ing on heart rate and rhythm, the interval betweenwaves of one cycle and another is variable.
Electrophysiological principles [1–6]
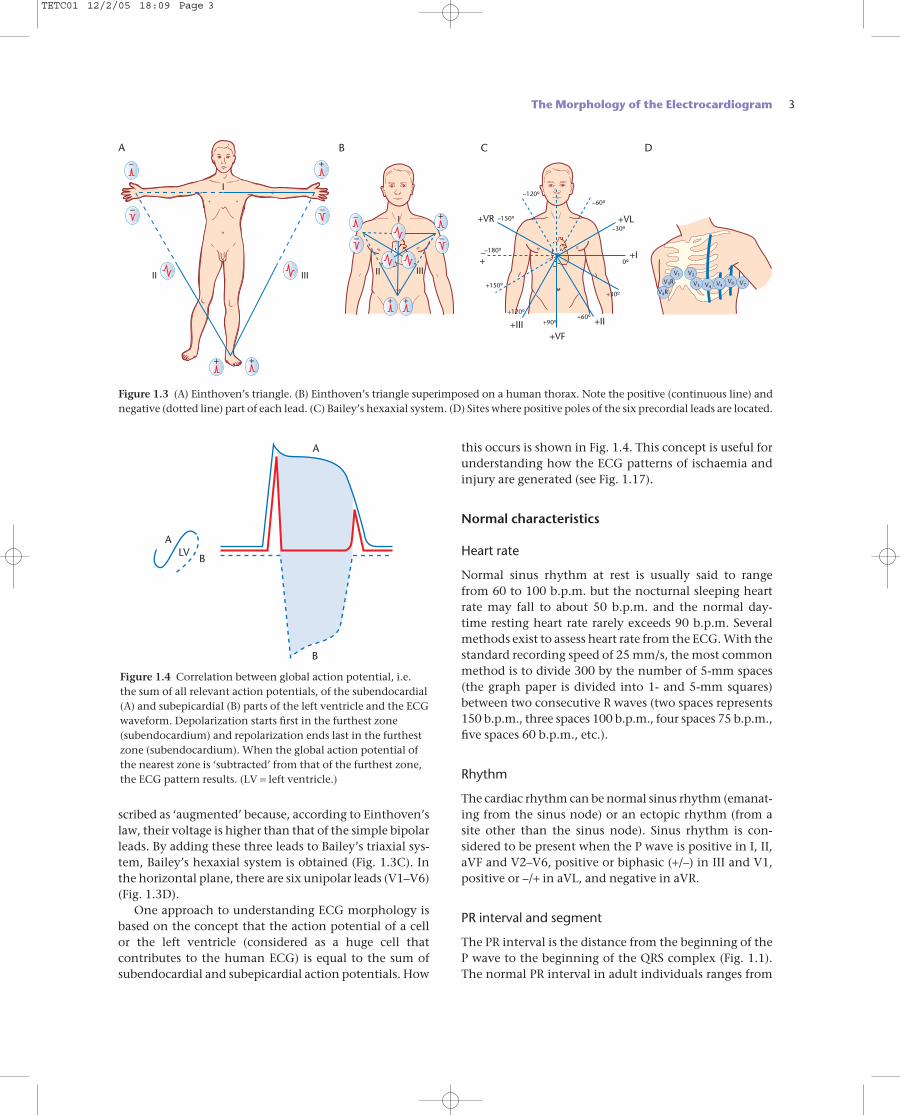
The origin of ECG morphology may be explained by thedipole-vector theory, which states that the ECG is anexpression of the electro-ionic changes generated duringmyocardial depolarization and repolarization. A pair ofelectrical charges, termed a dipole, is formed during bothdepolarization and repolarization processes (Fig. 1.2).These dipoles have a vectorial expression, with the headof the vector located at the positive pole of a dipole.
PR interval
QRS
STsegment
PRsegment
ST interval
T waveP wave
QT interval
Figure 1.1 ECG morphology recorded in a lead facing the left ventricular freewall showing the different waves andintervals. Shading, atrial repolarizationwave.
Cell membrane
Outside
Int. cel.
Sarc.Ret.
Na
0
2
3
STT
1
K
K
K
Depolarizationdipole
Ca
– – – – – – + + + + + +
Na
NaNa
Ca
– – – – – + + + + + + –
Na
– – + + + + + + – – – –
Na+ Na+
Na+
K+
Na+
Ca2+ Ca2+
Ca2+
Ca2+
Na+
CaA
B
K
K+
K+
– – – – – – + + + + + +
NaCa
+ + + – – – – – – + + +
NaCa
+ + + + + –– – – – – +
Na Ca
– – – – – – + + + + + +
Ca– – – – – – + + + + + +
+ + + + + + – – – – – – + + + + + + + + + + + +
– +
Repolarizationdipole
+ –
Direction ofphenomenonVectorDipole – +
Ioni
c p
ump
K
Figure 1.2 Scheme of electro-ionicchanges that occur in the cellulardepolarization and repolarization in thecontractile myocardium. (A) Curve ofaction potential. (B) Curve of theelectrogram of a single cell (repolarizationwith a dotted line) or left ventricle(normal curve of ECG with a positivecontinuous line). In phase 0 of actionpotential coinciding with the Na+
entrance, the depolarization dipole (−+)and, in phase 2 with the K+ exit, therepolarization dipole (+−), are originated.At the end of phase 3 of the actionpotential an electrical but not ionicbalance is obtained. For ionic balance an active mechanism (ionic pump) is necessary.
An electrode that faces the head of the vector records apositive deflection.
To ascertain the direction of a wavefront, the ECG isrecorded from different sites, termed ‘leads’. When record-ing the 12-lead ECG six frontal leads (I, II, III, aVR, aVL,aVF) and six horizontal leads (V1–V6) are used. There are three bipolar leads in the frontal plane that connectthe left to right arm (I), the left leg to right arm (II) and theleft leg to left arm (III). According to Einthoven’s law, thevoltage in each lead should fit the equation II = I + III.These three leads form Einthoven’s triangle (Fig. 1.3A).Bailey obtained a reference figure (Bailey’s triaxial sys-tem) by shifting the three leads towards the centre.
There are also three augmented bipolar leads (aVR, aVLand aVF) in the frontal plane (Fig. 1.3B). These are de-
TETC01 12/2/05 18:09 Page 2
scribed as ‘augmented’ because, according to Einthoven’slaw, their voltage is higher than that of the simple bipolarleads. By adding these three leads to Bailey’s triaxial sys-tem, Bailey’s hexaxial system is obtained (Fig. 1.3C). Inthe horizontal plane, there are six unipolar leads (V1–V6)(Fig. 1.3D).
One approach to understanding ECG morphology isbased on the concept that the action potential of a cell or the left ventricle (considered as a huge cell that contributes to the human ECG) is equal to the sum ofsubendocardial and subepicardial action potentials. How
this occurs is shown in Fig. 1.4. This concept is useful forunderstanding how the ECG patterns of ischaemia andinjury are generated (see Fig. 1.17).
Normal characteristics
Heart rate
Normal sinus rhythm at rest is usually said to range from 60 to 100 b.p.m. but the nocturnal sleeping heartrate may fall to about 50 b.p.m. and the normal day-time resting heart rate rarely exceeds 90 b.p.m. Severalmethods exist to assess heart rate from the ECG. With thestandard recording speed of 25 mm/s, the most commonmethod is to divide 300 by the number of 5-mm spaces(the graph paper is divided into 1- and 5-mm squares)between two consecutive R waves (two spaces represents150 b.p.m., three spaces 100 b.p.m., four spaces 75 b.p.m.,five spaces 60 b.p.m., etc.).
Rhythm
The cardiac rhythm can be normal sinus rhythm (emanat-ing from the sinus node) or an ectopic rhythm (from asite other than the sinus node). Sinus rhythm is con-sidered to be present when the P wave is positive in I, II,aVF and V2–V6, positive or biphasic (+/–) in III and V1,positive or –/+ in aVL, and negative in aVR.
PR interval and segment
The PR interval is the distance from the beginning of theP wave to the beginning of the QRS complex (Fig. 1.1).The normal PR interval in adult individuals ranges from
The Morphology of the Electrocardiogram 3
V4R
V3RV1
– –
+ +
– +
III IIIII II
I
I
B C D
–
–
–
+ +
+ +VR
A
+VL
+I
+II
+VF+III
–+
–180º
–150º
–120º–60º
0º
–30º
+30º
+60º+90º
+120º
+150ºV6 V7V4V4V3
V2
Figure 1.3 (A) Einthoven’s triangle. (B) Einthoven’s triangle superimposed on a human thorax. Note the positive (continuous line) andnegative (dotted line) part of each lead. (C) Bailey’s hexaxial system. (D) Sites where positive poles of the six precordial leads are located.
A
A
B
BLV
Figure 1.4 Correlation between global action potential, i.e. the sum of all relevant action potentials, of the subendocardial (A) and subepicardial (B) parts of the left ventricle and the ECGwaveform. Depolarization starts first in the furthest zone(subendocardium) and repolarization ends last in the furthestzone (subendocardium). When the global action potential ofthe nearest zone is ‘subtracted’ from that of the furthest zone,the ECG pattern results. (LV = left ventricle.)
TETC01 12/2/05 18:09 Page 3
4 Chapter 1
0.12 to 0.2 s (up to 0.22 s in the elderly and as short as 0.1 s in the newborn). Longer PR intervals are seen in casesof atrioventricular (AV) block and shorter PR intervals inpre-excitation syndromes and various arrhythmias. ThePR segment is the distance from the end of the P wave toQRS onset and is usually isoelectric. Sympathetic over-drive may explain the down-sloping PR segment thatforms part of an arc with the ascending nature of the STsegment. In pericarditis and other diseases affecting theatrial myocardium, as in atrial infarction, a displaced andsloping PR segment may be seen.
QT interval
The QT interval represents the sum of depolarization (QRScomplex) and repolarization (ST segment and T wave)(Fig. 1.1). Very often, particularly in cases of a flat T waveor in the presence of a U wave, it is difficult to measure theQT interval accurately. It is usual to perform this meas-urement using a consistent method in order to ensureaccuracy if the QT interval is studied sequentially. Therecommended method is to consider the end of repolar-ization as the point where a tangent drawn along thedescending slope of the T wave crosses the isoelectric line.The best result may be obtained by measuring the medianduration of QT simultaneously in 12 leads. Automaticmeasurement may not be accurate but is often used clin-ically [7].
It is necessary to correct the QT interval for heart rate(QTc). Different heart rate correction formulae exist. Themost frequently used are those of Bazett and Fridericia:
Bazett (square root) correction: QT corrected = QT measured/RR interval (s)0.5
Fridericia (cube root) correction: QT corrected = QT measured/RR interval (s)0.33
Although these correction methods are not accurate and are highly problematic in cases when a very preciseQTc value is needed, their results are satisfactory in stand-ard clinical practice. Because of its better accuracy theFridericia formula is preferred to that of Bazett.
A long QT interval may occur in the congenital longQT syndromes or can be associated with sudden death[8], heart failure, ischaemic heart disease, bradycardia,some electrolyte disorders (e.g. hypokalaemia and hypo-calcaemia) and following the intake of different drugs.Generally, it is believed that if a drug increases the QTcby more than 60 ms, torsade de pointes and sudden cardiac death might result. However, torsade de pointesrarely occurs unless the QTc exceeds 500 ms [9]. A shortQT interval can be found in cases of early repolarization,in association with digitalis and, rarely, in a genetic dis-order associated with sudden death [10].
P wave
This is the atrial depolarization wave (Fig. 1.1). In gen-eral, its height should not exceed 2.5 mm and its widthshould not be greater than 0.1 s. It is rounded and posit-ive but may be biphasic in V1 and III and –/+ in aVL. Theatrial repolarization wave is of low amplitude and usuallymasked by coincident ventricular depolarization (QRScomplex) (see shading in Fig. 1.1).
QRS complex
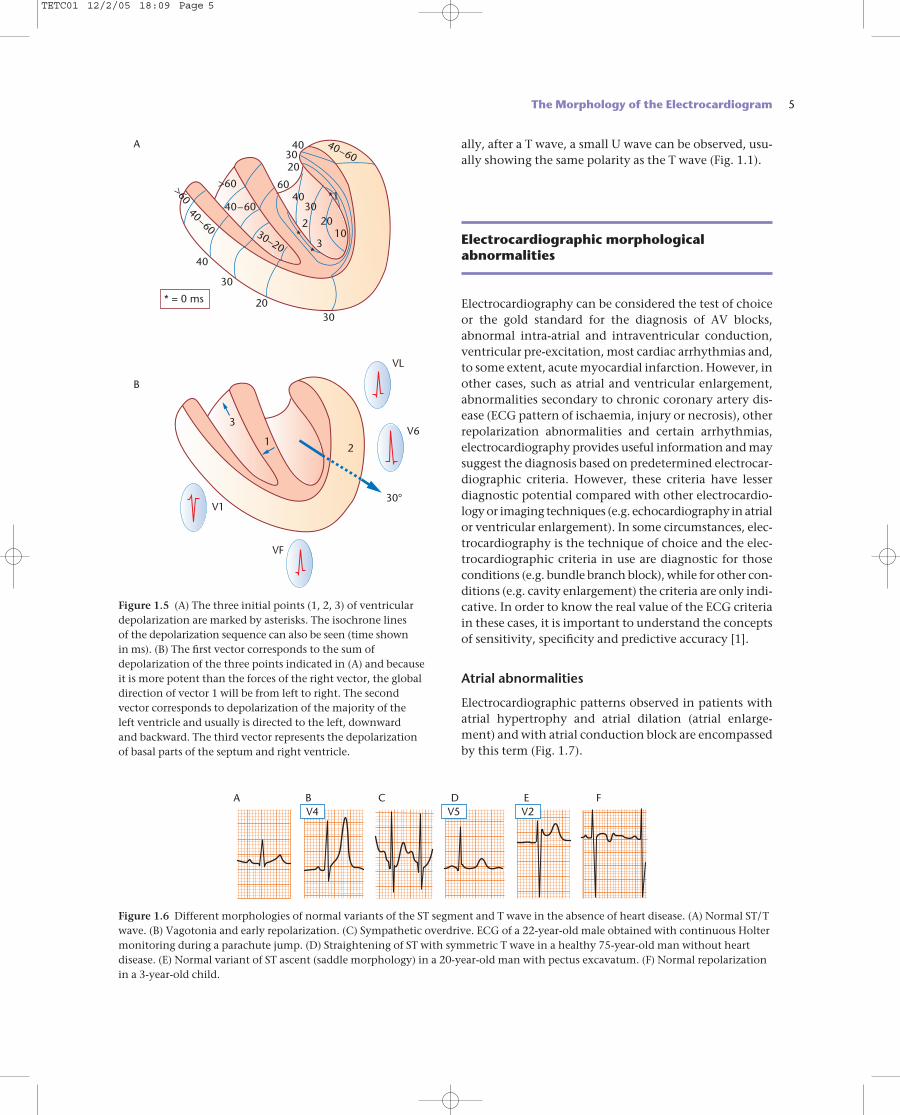
This results from ventricular depolarization (Figs 1.1 and1.5). According to Durrer et al. [11], ventricular depolar-ization begins in three different sites in the left ventricleand occurs in three consecutive phases that give rise tothe generation of three vectors [6].
The ventricular depolarization signal is often describedgenerically as a QRS complex. Usually the deflection istriphasic and, provided that the initial wave is negative(down-going), the three waves are sequentially known as Q, R and S. If the first part of the complex is up-goingthe deflection is codified as an R wave, etc. If the R or Swave is large in amplitude, upper case letters (R, S) areused, but if small in amplitude, lower case letters (r, s) are used. A normal or physiological initial negative waveof the ventricular depolarization waveform is called a qwave. It must be narrow (< 0.04 s) and should not usuallyexceed 25% of the amplitude of the following R wave,though some exceptions exist mainly in leads III, aVLand aVF. If the initial deflection is wider or deeper, it isknown as a Q wave. Different morphologies are pre-sented in Fig. 1.5.
The QRS width should not exceed 0.095 s and the Rwave height should not exceed 25 mm in leads V5 and V6or 20 mm in leads I and aVL, although a height greaterthan 15 mm in aVL is usually abnormal.
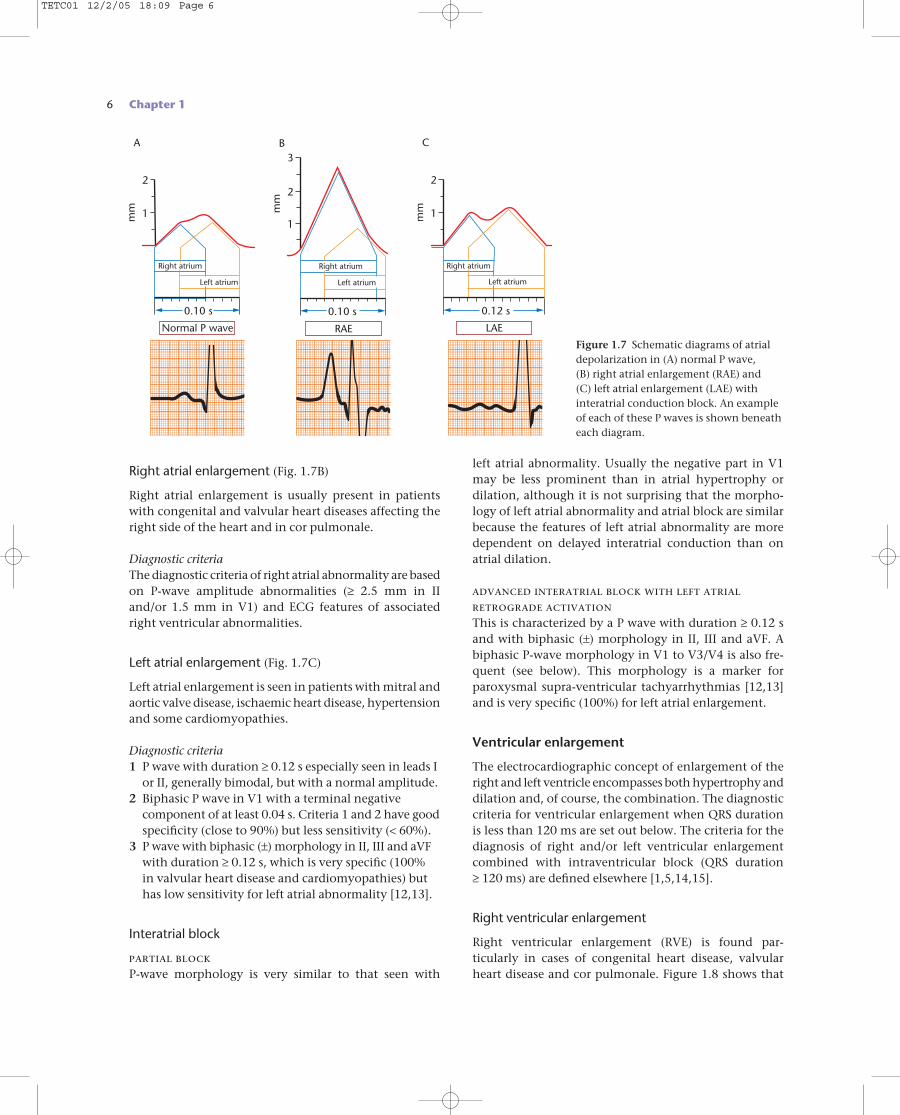
ST segment and T wave
The T wave, together with the preceding ST segment, isformed during ventricular repolarization (Fig. 1.1). The T wave is generally positive in all leads except aVR, butmay be negative, flattened or only slightly positive in V1,and flattened or slightly negative in V2, III and aVF. TheT wave presents an ascending slope with slower inscrip-tion than the descending slope. In children, a negative T wave is normal when seen in the right precordial leads(paediatric repolarization pattern) (Fig. 1.6F). Under normal conditions, the ST segment is isoelectric or showsonly a slight down-slope (< 0.5 mm). Examples of normalST–T wave variants are displayed in Fig. 1.6 (the figurecaption provides comment on these patterns). Occasion-
TETC01 12/2/05 18:09 Page 4
ally, after a T wave, a small U wave can be observed, usu-ally showing the same polarity as the T wave (Fig. 1.1).
Electrocardiographic morphologicalabnormalities
Electrocardiography can be considered the test of choiceor the gold standard for the diagnosis of AV blocks,abnormal intra-atrial and intraventricular conduction,ventricular pre-excitation, most cardiac arrhythmias and,to some extent, acute myocardial infarction. However, inother cases, such as atrial and ventricular enlargement,abnormalities secondary to chronic coronary artery dis-ease (ECG pattern of ischaemia, injury or necrosis), otherrepolarization abnormalities and certain arrhythmias,electrocardiography provides useful information and maysuggest the diagnosis based on predetermined electrocar-diographic criteria. However, these criteria have lesserdiagnostic potential compared with other electrocardio-logy or imaging techniques (e.g. echocardiography in atrialor ventricular enlargement). In some circumstances, elec-trocardiography is the technique of choice and the elec-trocardiographic criteria in use are diagnostic for thoseconditions (e.g. bundle branch block), while for other con-ditions (e.g. cavity enlargement) the criteria are only indi-cative. In order to know the real value of the ECG criteriain these cases, it is important to understand the conceptsof sensitivity, specificity and predictive accuracy [1].
Atrial abnormalities
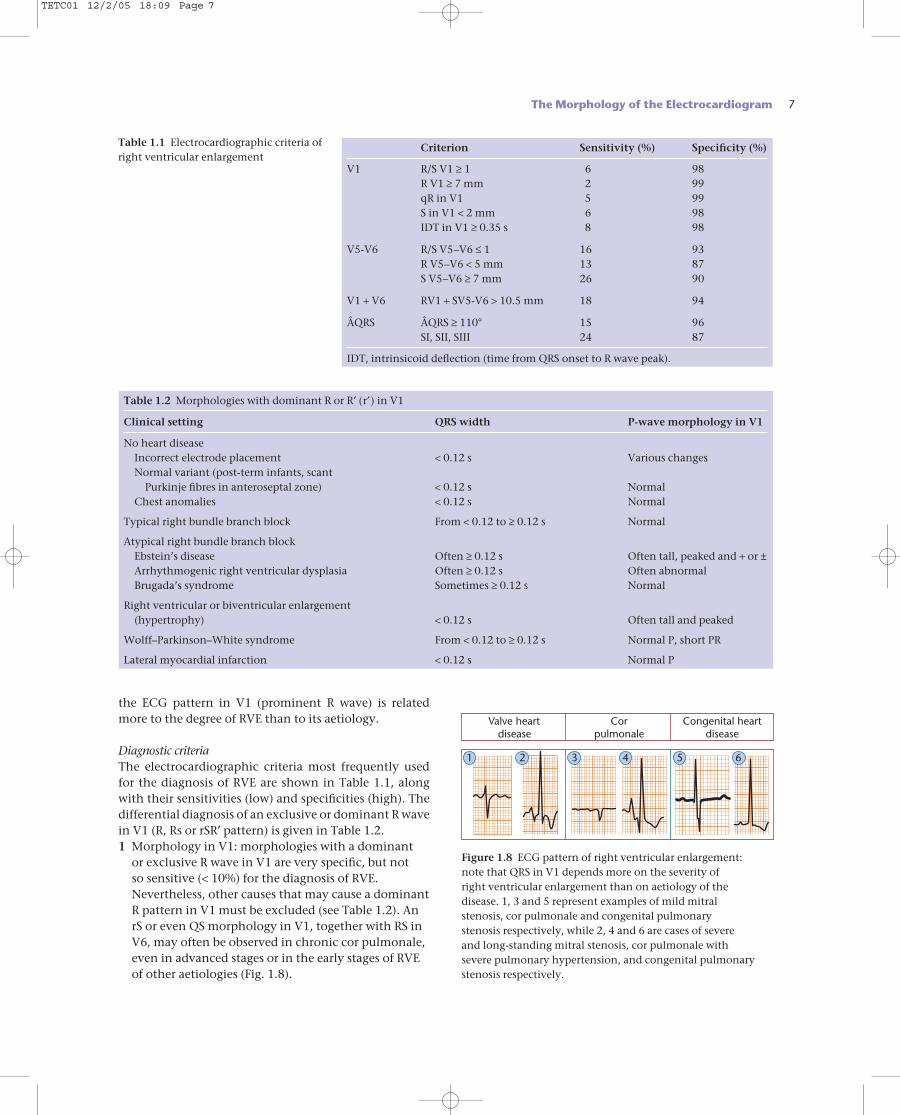
Electrocardiographic patterns observed in patients withatrial hypertrophy and atrial dilation (atrial enlarge-ment) and with atrial conduction block are encompassedby this term (Fig. 1.7).
The Morphology of the Electrocardiogram 5
30°
VF
V1
VL
V6
B
A
* = 0 ms
2
3
1
>60
>60
40
3
240–60
40–60
40–60
30–20
30
30
30
3040
4060
20
20
20
10
*1
*
*
Figure 1.5 (A) The three initial points (1, 2, 3) of ventriculardepolarization are marked by asterisks. The isochrone lines of the depolarization sequence can also be seen (time shown in ms). (B) The first vector corresponds to the sum ofdepolarization of the three points indicated in (A) and becauseit is more potent than the forces of the right vector, the globaldirection of vector 1 will be from left to right. The secondvector corresponds to depolarization of the majority of the left ventricle and usually is directed to the left, downward and backward. The third vector represents the depolarizationof basal parts of the septum and right ventricle.
V5V4A B C D E F
V2
Figure 1.6 Different morphologies of normal variants of the ST segment and T wave in the absence of heart disease. (A) Normal ST/Twave. (B) Vagotonia and early repolarization. (C) Sympathetic overdrive. ECG of a 22-year-old male obtained with continuous Holtermonitoring during a parachute jump. (D) Straightening of ST with symmetric T wave in a healthy 75-year-old man without heartdisease. (E) Normal variant of ST ascent (saddle morphology) in a 20-year-old man with pectus excavatum. (F) Normal repolarizationin a 3-year-old child.
TETC01 12/2/05 18:09 Page 5
6 Chapter 1
Right atrial enlargement (Fig. 1.7B)
Right atrial enlargement is usually present in patientswith congenital and valvular heart diseases affecting theright side of the heart and in cor pulmonale.
Diagnostic criteriaThe diagnostic criteria of right atrial abnormality are basedon P-wave amplitude abnormalities (≥ 2.5 mm in IIand/or 1.5 mm in V1) and ECG features of associatedright ventricular abnormalities.
Left atrial enlargement (Fig. 1.7C)
Left atrial enlargement is seen in patients with mitral andaortic valve disease, ischaemic heart disease, hypertensionand some cardiomyopathies.
Diagnostic criteria1 P wave with duration ≥ 0.12 s especially seen in leads I
or II, generally bimodal, but with a normal amplitude.2 Biphasic P wave in V1 with a terminal negative
component of at least 0.04 s. Criteria 1 and 2 have goodspecificity (close to 90%) but less sensitivity (< 60%).
3 P wave with biphasic (±) morphology in II, III and aVFwith duration ≥ 0.12 s, which is very specific (100% in valvular heart disease and cardiomyopathies) buthas low sensitivity for left atrial abnormality [12,13].
Interatrial block
partial blockP-wave morphology is very similar to that seen with
left atrial abnormality. Usually the negative part in V1may be less prominent than in atrial hypertrophy or dilation, although it is not surprising that the morpho-logy of left atrial abnormality and atrial block are similarbecause the features of left atrial abnormality are moredependent on delayed interatrial conduction than onatrial dilation.
advanced interatrial block with left atrialretrograde activationThis is characterized by a P wave with duration ≥ 0.12 sand with biphasic (±) morphology in II, III and aVF. Abiphasic P-wave morphology in V1 to V3/V4 is also fre-quent (see below). This morphology is a marker forparoxysmal supra-ventricular tachyarrhythmias [12,13]and is very specific (100%) for left atrial enlargement.
Ventricular enlargement
The electrocardiographic concept of enlargement of theright and left ventricle encompasses both hypertrophy anddilation and, of course, the combination. The diagnosticcriteria for ventricular enlargement when QRS durationis less than 120 ms are set out below. The criteria for thediagnosis of right and/or left ventricular enlargementcombined with intraventricular block (QRS duration ≥ 120 ms) are defined elsewhere [1,5,14,15].
Right ventricular enlargement
Right ventricular enlargement (RVE) is found par-ticularly in cases of congenital heart disease, valvularheart disease and cor pulmonale. Figure 1.8 shows that
2
3
Right atrium
Left atriumm
m
0.10 s
RAE LAENormal P wave
B
1
2
Right atrium
Left atrium
mm
0.12 s
C
1
2
Right atrium
Left atrium
mm
0.10 s
A
1
Figure 1.7 Schematic diagrams of atrialdepolarization in (A) normal P wave, (B) right atrial enlargement (RAE) and (C) left atrial enlargement (LAE) withinteratrial conduction block. An exampleof each of these P waves is shown beneatheach diagram.
TETC01 12/2/05 18:09 Page 6
the ECG pattern in V1 (prominent R wave) is relatedmore to the degree of RVE than to its aetiology.
Diagnostic criteriaThe electrocardiographic criteria most frequently usedfor the diagnosis of RVE are shown in Table 1.1, alongwith their sensitivities (low) and specificities (high). Thedifferential diagnosis of an exclusive or dominant R wavein V1 (R, Rs or rSR′ pattern) is given in Table 1.2.1 Morphology in V1: morphologies with a dominant
or exclusive R wave in V1 are very specific, but not so sensitive (< 10%) for the diagnosis of RVE.Nevertheless, other causes that may cause a dominantR pattern in V1 must be excluded (see Table 1.2). AnrS or even QS morphology in V1, together with RS inV6, may often be observed in chronic cor pulmonale,even in advanced stages or in the early stages of RVEof other aetiologies (Fig. 1.8).
The Morphology of the Electrocardiogram 7
1 2 3 4 5 6
Congenital heartdisease
Corpulmonale
Valve heartdisease
Figure 1.8 ECG pattern of right ventricular enlargement: note that QRS in V1 depends more on the severity of right ventricular enlargement than on aetiology of the disease. 1, 3 and 5 represent examples of mild mitral stenosis, cor pulmonale and congenital pulmonary stenosis respectively, while 2, 4 and 6 are cases of severe and long-standing mitral stenosis, cor pulmonale with severe pulmonary hypertension, and congenital pulmonarystenosis respectively.
Criterion Sensitivity (%) Specificity (%)
V1 R/S V1 ≥ 1 6 98R V1 ≥ 7 mm 2 99qR in V1 5 99S in V1 < 2 mm 6 98IDT in V1 ≥ 0.35 s 8 98
V5-V6 R/S V5–V6 ≤ 1 16 93R V5–V6 < 5 mm 13 87S V5–V6 ≥ 7 mm 26 90
V1 + V6 RV1 + SV5-V6 > 10.5 mm 18 94
ÂQRS ÂQRS ≥ 110° 15 96SI, SII, SIII 24 87
IDT, intrinsicoid deflection (time from QRS onset to R wave peak).
Table 1.1 Electrocardiographic criteria ofright ventricular enlargement
Table 1.2 Morphologies with dominant R or R′ (r′) in V1
Clinical setting QRS width P-wave morphology in V1
No heart diseaseIncorrect electrode placement < 0.12 s Various changesNormal variant (post-term infants, scant
Purkinje fibres in anteroseptal zone) < 0.12 s NormalChest anomalies < 0.12 s Normal
Typical right bundle branch block From < 0.12 to ≥ 0.12 s Normal
Atypical right bundle branch blockEbstein’s disease Often ≥ 0.12 s Often tall, peaked and + or ±Arrhythmogenic right ventricular dysplasia Often ≥ 0.12 s Often abnormalBrugada’s syndrome Sometimes ≥ 0.12 s Normal
Right ventricular or biventricular enlargement (hypertrophy) < 0.12 s Often tall and peaked
Wolff–Parkinson–White syndrome From < 0.12 to ≥ 0.12 s Normal P, short PR
Lateral myocardial infarction < 0.12 s Normal P
TETC01 12/2/05 18:09 Page 7
8 Chapter 1
2 Morphology in V6: the presence of forces directed to the right expressed as an S wave in V5–V6 is one of the most important ECG criteria.
3 Frontal plane QRS electrical axis (ÂQRS): ÂQRS ≥ 110°is a criterion with low sensitivity but high specificity(95%) provided that left posterior hemiblock, anextremely vertical heart position and lateral leftventricular wall infarction have been excluded.
4 SI, SII, SIII: an S wave in the three bipolar limb leads is frequently seen in chronic cor pulmonale with a QS or rS pattern in V1 and an RS pattern in V6. The possibility of this pattern being secondary to a positional change or simply to peripheral rightventricular block must be excluded [16].
The combination of more than one of these criteriaincreases the diagnostic likelihood. Horan and Flowers[15] have published a scoring system based on the most frequently used ECG criteria for right ventricularenlargement.
Left ventricular enlargement
Left ventricular enlargement, or ischaemic heart disease,is found particularly in hypertension, valvular heart dis-ease, cardiomyopathies and in some congenital heartdiseases.
In general, in patients with left ventricular enlarge-ment, the QRS voltage is increased and is directed moreposteriorly than normal. This explains why negative QRScomplexes predominate in the right precordial leads. Occa-sionally, probably related to significant cardiac laevo-rotation or with more significant hypertrophy of the leftventricular septal area than of the left ventricular free wall,as occurs in some cases of apical hypertrophic cardio-myopathy, the maximum QRS is not directed posteriorly.In this situation a tall R wave may be seen even in V2.
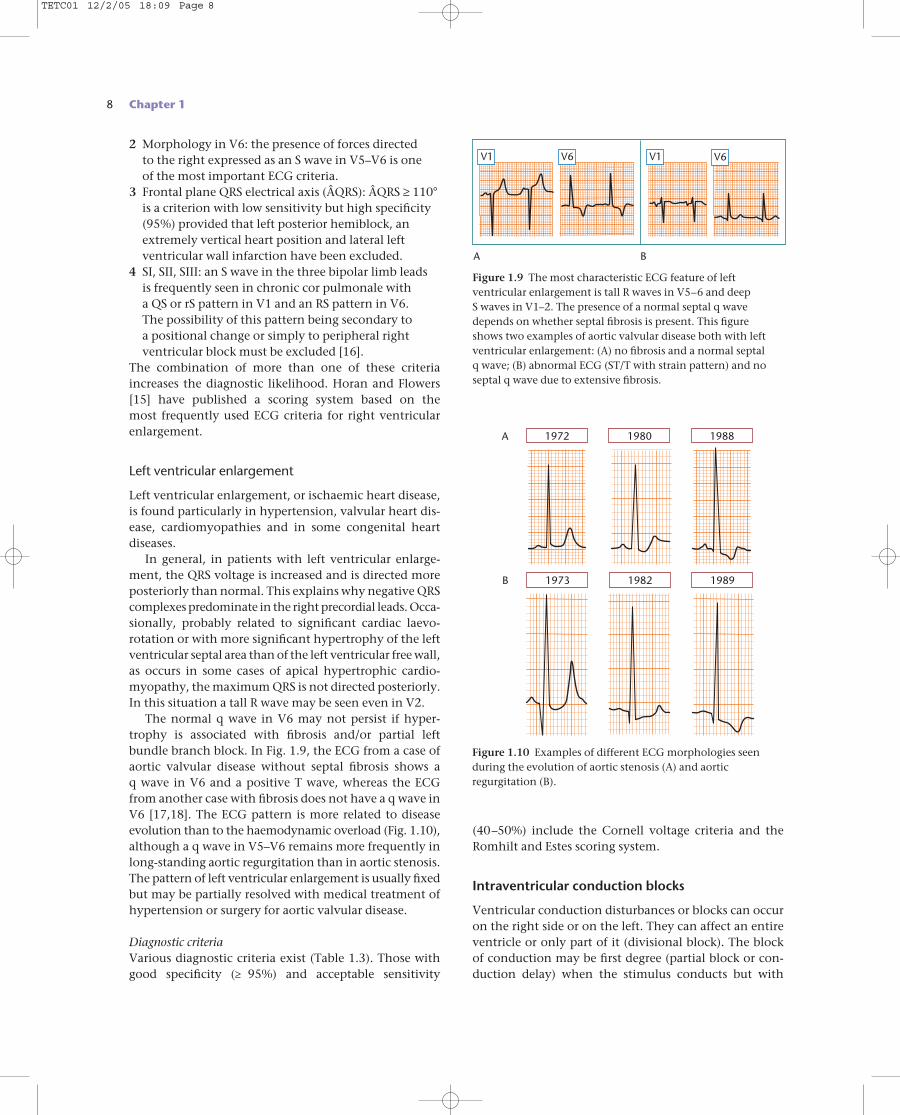
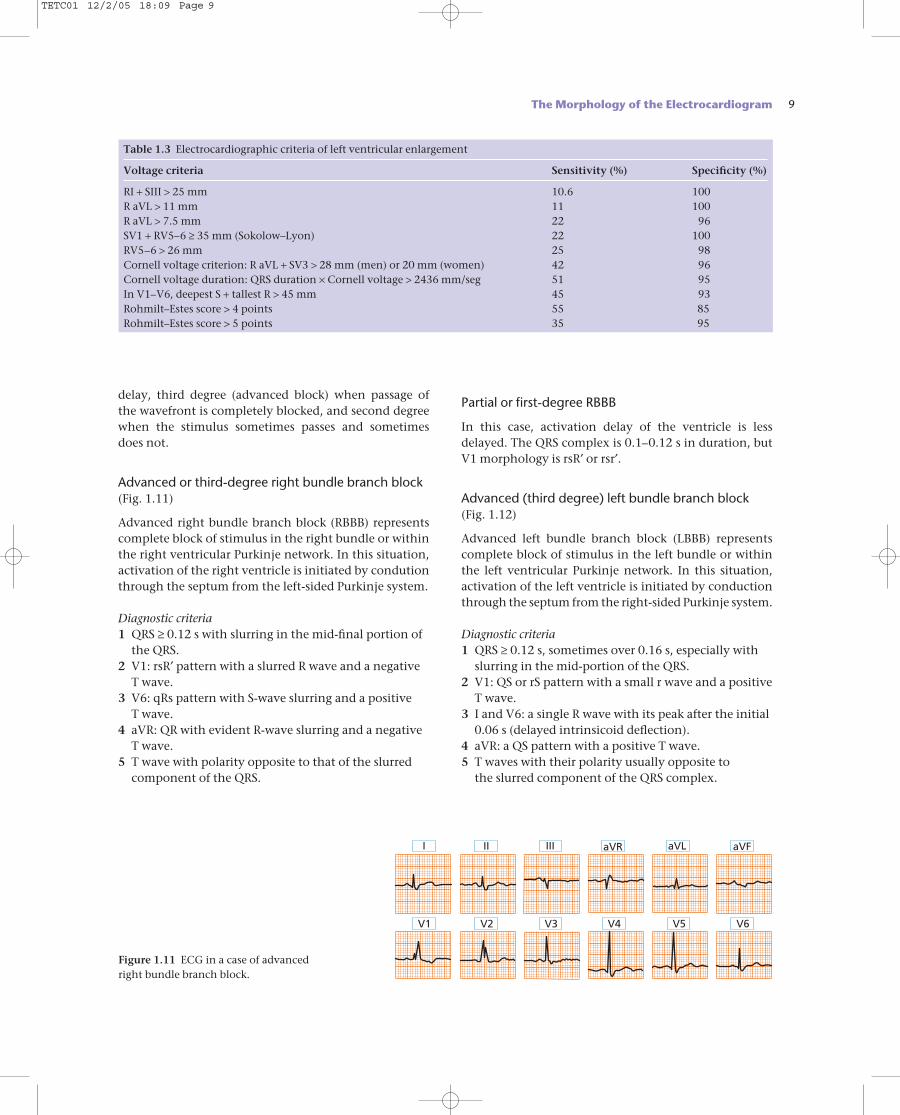
The normal q wave in V6 may not persist if hyper-trophy is associated with fibrosis and/or partial left bundle branch block. In Fig. 1.9, the ECG from a case ofaortic valvular disease without septal fibrosis shows a q wave in V6 and a positive T wave, whereas the ECGfrom another case with fibrosis does not have a q wave inV6 [17,18]. The ECG pattern is more related to diseaseevolution than to the haemodynamic overload (Fig. 1.10),although a q wave in V5–V6 remains more frequently inlong-standing aortic regurgitation than in aortic stenosis.The pattern of left ventricular enlargement is usually fixedbut may be partially resolved with medical treatment ofhypertension or surgery for aortic valvular disease.
Diagnostic criteriaVarious diagnostic criteria exist (Table 1.3). Those withgood specificity (≥ 95%) and acceptable sensitivity
(40–50%) include the Cornell voltage criteria and theRomhilt and Estes scoring system.
Intraventricular conduction blocks
Ventricular conduction disturbances or blocks can occuron the right side or on the left. They can affect an entireventricle or only part of it (divisional block). The block of conduction may be first degree (partial block or con-duction delay) when the stimulus conducts but with
B
A
1973 1982 1989
198819801972
Figure 1.10 Examples of different ECG morphologies seenduring the evolution of aortic stenosis (A) and aorticregurgitation (B).
V1 V6 V1 V6
Figure 1.9 The most characteristic ECG feature of leftventricular enlargement is tall R waves in V5–6 and deep S waves in V1–2. The presence of a normal septal q wavedepends on whether septal fibrosis is present. This figure shows two examples of aortic valvular disease both with leftventricular enlargement: (A) no fibrosis and a normal septal q wave; (B) abnormal ECG (ST/T with strain pattern) and noseptal q wave due to extensive fibrosis.
BA
TETC01 12/2/05 18:09 Page 8
delay, third degree (advanced block) when passage of the wavefront is completely blocked, and second degreewhen the stimulus sometimes passes and sometimesdoes not.
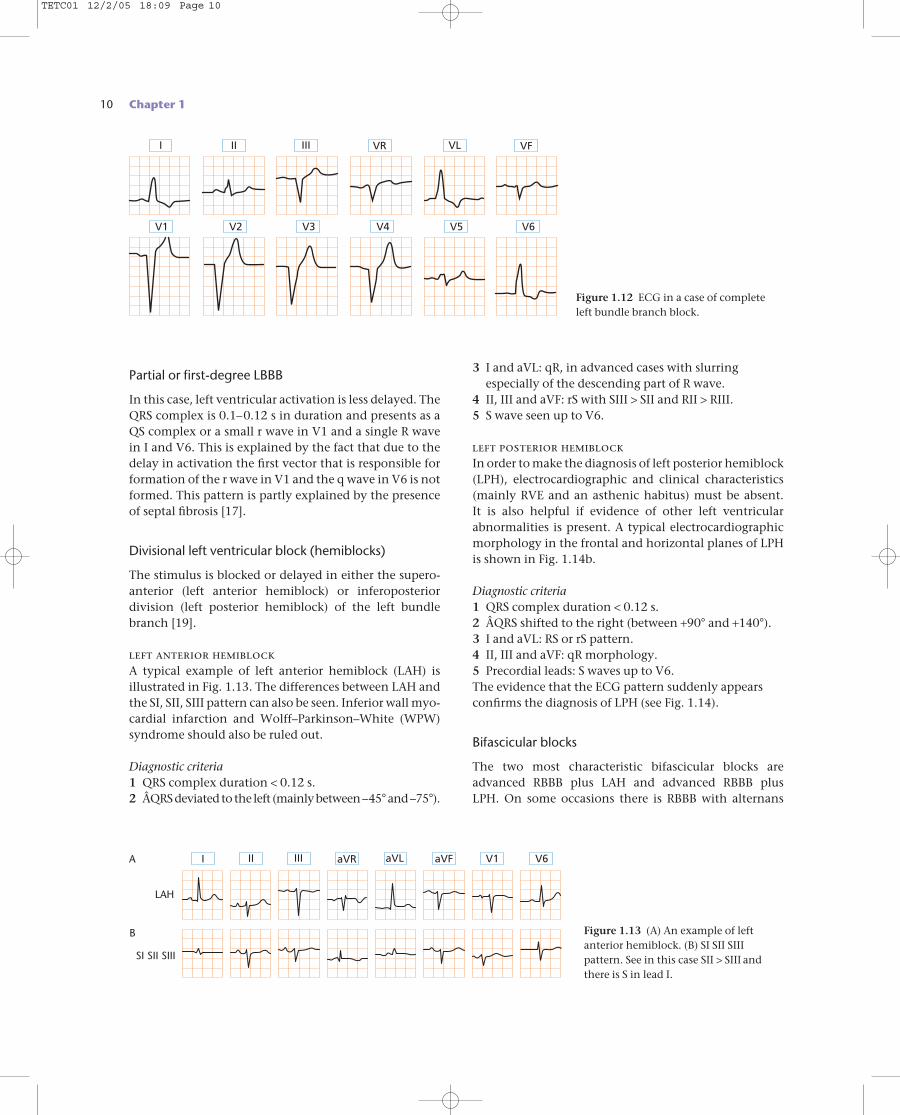
Advanced or third-degree right bundle branch block(Fig. 1.11)
Advanced right bundle branch block (RBBB) representscomplete block of stimulus in the right bundle or withinthe right ventricular Purkinje network. In this situation,activation of the right ventricle is initiated by condutionthrough the septum from the left-sided Purkinje system.
Diagnostic criteria1 QRS ≥ 0.12 s with slurring in the mid-final portion of
the QRS.2 V1: rsR′ pattern with a slurred R wave and a negative
T wave.3 V6: qRs pattern with S-wave slurring and a positive
T wave.4 aVR: QR with evident R-wave slurring and a negative
T wave.5 T wave with polarity opposite to that of the slurred
component of the QRS.
Partial or first-degree RBBB
In this case, activation delay of the ventricle is lessdelayed. The QRS complex is 0.1–0.12 s in duration, butV1 morphology is rsR′ or rsr′.
Advanced (third degree) left bundle branch block (Fig. 1.12)
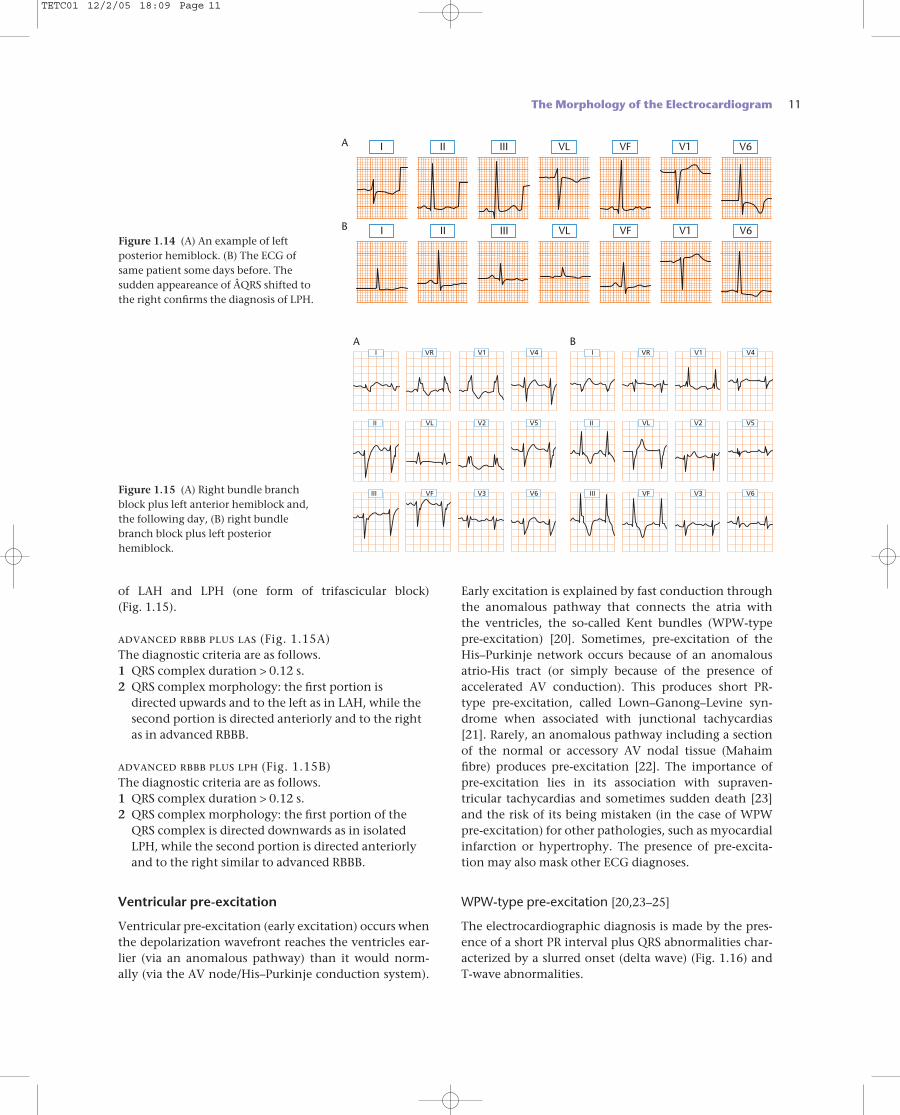
Advanced left bundle branch block (LBBB) representscomplete block of stimulus in the left bundle or withinthe left ventricular Purkinje network. In this situation,activation of the left ventricle is initiated by conductionthrough the septum from the right-sided Purkinje system.
Diagnostic criteria1 QRS ≥ 0.12 s, sometimes over 0.16 s, especially with
slurring in the mid-portion of the QRS.2 V1: QS or rS pattern with a small r wave and a positive
T wave.3 I and V6: a single R wave with its peak after the initial
0.06 s (delayed intrinsicoid deflection).4 aVR: a QS pattern with a positive T wave.5 T waves with their polarity usually opposite to
the slurred component of the QRS complex.
The Morphology of the Electrocardiogram 9
Table 1.3 Electrocardiographic criteria of left ventricular enlargement
Voltage criteria Sensitivity (%) Specificity (%)
RI + SIII > 25 mm 10.6 100R aVL > 11 mm 11 100R aVL > 7.5 mm 22 96SV1 + RV5–6 ≥ 35 mm (Sokolow–Lyon) 22 100RV5–6 > 26 mm 25 98Cornell voltage criterion: R aVL + SV3 > 28 mm (men) or 20 mm (women) 42 96Cornell voltage duration: QRS duration × Cornell voltage > 2436 mm/seg 51 95In V1–V6, deepest S + tallest R > 45 mm 45 93Rohmilt–Estes score > 4 points 55 85Rohmilt–Estes score > 5 points 35 95
I II III aVR aVL aVF
V1 V2 V3 V4 V5 V6
Figure 1.11 ECG in a case of advancedright bundle branch block.
TETC01 12/2/05 18:09 Page 9
10 Chapter 1
Partial or first-degree LBBB
In this case, left ventricular activation is less delayed. TheQRS complex is 0.1–0.12 s in duration and presents as aQS complex or a small r wave in V1 and a single R wavein I and V6. This is explained by the fact that due to thedelay in activation the first vector that is responsible forformation of the r wave in V1 and the q wave in V6 is notformed. This pattern is partly explained by the presenceof septal fibrosis [17].
Divisional left ventricular block (hemiblocks)
The stimulus is blocked or delayed in either the supero-anterior (left anterior hemiblock) or inferoposterior division (left posterior hemiblock) of the left bundlebranch [19].
left anterior hemiblockA typical example of left anterior hemiblock (LAH) isillustrated in Fig. 1.13. The differences between LAH andthe SI, SII, SIII pattern can also be seen. Inferior wall myo-cardial infarction and Wolff–Parkinson–White (WPW)syndrome should also be ruled out.
Diagnostic criteria1 QRS complex duration < 0.12 s.2 ÂQRS deviated to the left (mainly between –45°and –75°).
3 I and aVL: qR, in advanced cases with slurringespecially of the descending part of R wave.
4 II, III and aVF: rS with SIII > SII and RII > RIII.5 S wave seen up to V6.
left posterior hemiblockIn order to make the diagnosis of left posterior hemiblock(LPH), electrocardiographic and clinical characteristics(mainly RVE and an asthenic habitus) must be absent.It is also helpful if evidence of other left ventricularabnormalities is present. A typical electrocardiographicmorphology in the frontal and horizontal planes of LPHis shown in Fig. 1.14b.
Diagnostic criteria1 QRS complex duration < 0.12 s.2 ÂQRS shifted to the right (between +90° and +140°).3 I and aVL: RS or rS pattern.4 II, III and aVF: qR morphology.5 Precordial leads: S waves up to V6.The evidence that the ECG pattern suddenly appearsconfirms the diagnosis of LPH (see Fig. 1.14).
Bifascicular blocks
The two most characteristic bifascicular blocks areadvanced RBBB plus LAH and advanced RBBB plus LPH. On some occasions there is RBBB with alternans
I II III VR VL VF
V1 V2 V3 V4 V5 V6
Figure 1.12 ECG in a case of completeleft bundle branch block.
LAH
A
B
SI SII SIII
I II III aVR aVL aVF V6V1
Figure 1.13 (A) An example of left anterior hemiblock. (B) SI SII SIIIpattern. See in this case SII > SIII andthere is S in lead I.
TETC01 12/2/05 18:09 Page 10
of LAH and LPH (one form of trifascicular block) (Fig. 1.15).
advanced rbbb plus las (Fig. 1.15A)The diagnostic criteria are as follows.1 QRS complex duration > 0.12 s.2 QRS complex morphology: the first portion is
directed upwards and to the left as in LAH, while thesecond portion is directed anteriorly and to the rightas in advanced RBBB.
advanced rbbb plus lph (Fig. 1.15B)The diagnostic criteria are as follows.1 QRS complex duration > 0.12 s.2 QRS complex morphology: the first portion of the
QRS complex is directed downwards as in isolatedLPH, while the second portion is directed anteriorlyand to the right similar to advanced RBBB.
Ventricular pre-excitation
Ventricular pre-excitation (early excitation) occurs whenthe depolarization wavefront reaches the ventricles ear-lier (via an anomalous pathway) than it would norm-ally (via the AV node/His–Purkinje conduction system).
Early excitation is explained by fast conduction throughthe anomalous pathway that connects the atria with the ventricles, the so-called Kent bundles (WPW-typepre-excitation) [20]. Sometimes, pre-excitation of theHis–Purkinje network occurs because of an anomalousatrio-His tract (or simply because of the presence of accelerated AV conduction). This produces short PR-type pre-excitation, called Lown–Ganong–Levine syn-drome when associated with junctional tachycardias[21]. Rarely, an anomalous pathway including a sectionof the normal or accessory AV nodal tissue (Mahaimfibre) produces pre-excitation [22]. The importance ofpre-excitation lies in its association with supraven-tricular tachycardias and sometimes sudden death [23] and the risk of its being mistaken (in the case of WPWpre-excitation) for other pathologies, such as myocardialinfarction or hypertrophy. The presence of pre-excita-tion may also mask other ECG diagnoses.
WPW-type pre-excitation [20,23–25]
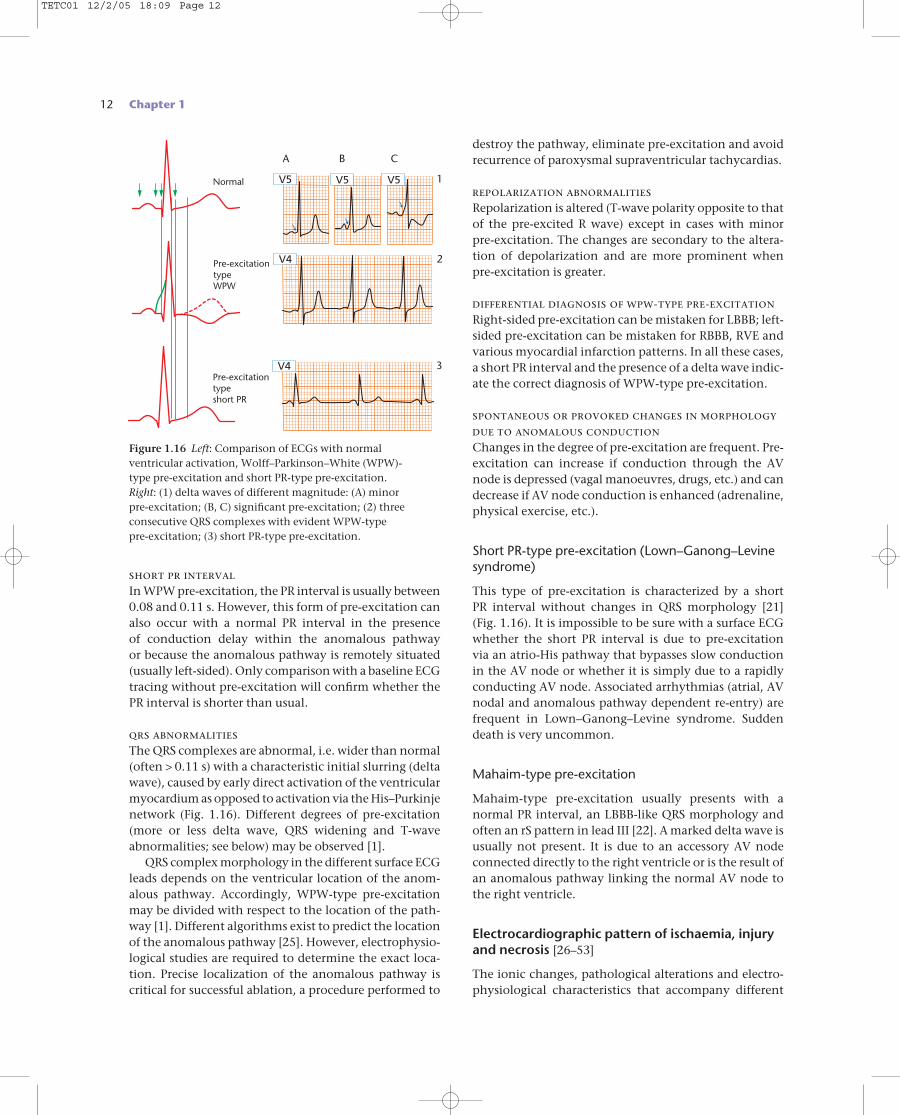
The electrocardiographic diagnosis is made by the pres-ence of a short PR interval plus QRS abnormalities char-acterized by a slurred onset (delta wave) (Fig. 1.16) andT-wave abnormalities.
The Morphology of the Electrocardiogram 11
I
I
II
II
III
III
VL
VL
VF
VF
V1
V1
V6
V6Figure 1.14 (A) An example of leftposterior hemiblock. (B) The ECG ofsame patient some days before. Thesudden appeareance of ÂQRS shifted tothe right confirms the diagnosis of LPH.
A BI V1 V4VR I V1 V4VR
II V5VL II V2 V5VL
III V6VF III V3 V6VF
V2
V3Figure 1.15 (A) Right bundle branchblock plus left anterior hemiblock and,the following day, (B) right bundlebranch block plus left posteriorhemiblock.
A
B
TETC01 12/2/05 18:09 Page 11
12 Chapter 1
short pr intervalIn WPW pre-excitation, the PR interval is usually between0.08 and 0.11 s. However, this form of pre-excitation canalso occur with a normal PR interval in the presence of conduction delay within the anomalous pathway or because the anomalous pathway is remotely situated(usually left-sided). Only comparison with a baseline ECGtracing without pre-excitation will confirm whether thePR interval is shorter than usual.
qrs abnormalitiesThe QRS complexes are abnormal, i.e. wider than normal(often > 0.11 s) with a characteristic initial slurring (deltawave), caused by early direct activation of the ventricularmyocardium as opposed to activation via the His–Purkinjenetwork (Fig. 1.16). Different degrees of pre-excitation(more or less delta wave, QRS widening and T-waveabnormalities; see below) may be observed [1].
QRS complex morphology in the different surface ECGleads depends on the ventricular location of the anom-alous pathway. Accordingly, WPW-type pre-excitationmay be divided with respect to the location of the path-way [1]. Different algorithms exist to predict the locationof the anomalous pathway [25]. However, electrophysio-logical studies are required to determine the exact loca-tion. Precise localization of the anomalous pathway iscritical for successful ablation, a procedure performed to
destroy the pathway, eliminate pre-excitation and avoidrecurrence of paroxysmal supraventricular tachycardias.
repolarization abnormalitiesRepolarization is altered (T-wave polarity opposite to thatof the pre-excited R wave) except in cases with minor pre-excitation. The changes are secondary to the altera-tion of depolarization and are more prominent whenpre-excitation is greater.
differential diagnosis of wpw-type pre-excitationRight-sided pre-excitation can be mistaken for LBBB; left-sided pre-excitation can be mistaken for RBBB, RVE andvarious myocardial infarction patterns. In all these cases,a short PR interval and the presence of a delta wave indic-ate the correct diagnosis of WPW-type pre-excitation.
spontaneous or provoked changes in morphologydue to anomalous conductionChanges in the degree of pre-excitation are frequent. Pre-excitation can increase if conduction through the AVnode is depressed (vagal manoeuvres, drugs, etc.) and candecrease if AV node conduction is enhanced (adrenaline,physical exercise, etc.).
Short PR-type pre-excitation (Lown–Ganong–Levinesyndrome)
This type of pre-excitation is characterized by a short PR interval without changes in QRS morphology [21](Fig. 1.16). It is impossible to be sure with a surface ECGwhether the short PR interval is due to pre-excitation via an atrio-His pathway that bypasses slow conductionin the AV node or whether it is simply due to a rapidlyconducting AV node. Associated arrhythmias (atrial, AVnodal and anomalous pathway dependent re-entry) arefrequent in Lown–Ganong–Levine syndrome. Suddendeath is very uncommon.
Mahaim-type pre-excitation
Mahaim-type pre-excitation usually presents with a normal PR interval, an LBBB-like QRS morphology andoften an rS pattern in lead III [22]. A marked delta wave isusually not present. It is due to an accessory AV nodeconnected directly to the right ventricle or is the result ofan anomalous pathway linking the normal AV node tothe right ventricle.
Electrocardiographic pattern of ischaemia, injuryand necrosis [26–53]
The ionic changes, pathological alterations and electro-physiological characteristics that accompany different
Normal
Pre-excitationtypeWPW
Pre-excitationtypeshort PR
A B C
1
2
3V4
V5 V5 V5
V4
Figure 1.16 Left: Comparison of ECGs with normal ventricular activation, Wolff–Parkinson–White (WPW)-type pre-excitation and short PR-type pre-excitation. Right: (1) delta waves of different magnitude: (A) minor pre-excitation; (B, C) significant pre-excitation; (2) threeconsecutive QRS complexes with evident WPW-type pre-excitation; (3) short PR-type pre-excitation.
TETC01 12/2/05 18:09 Page 12
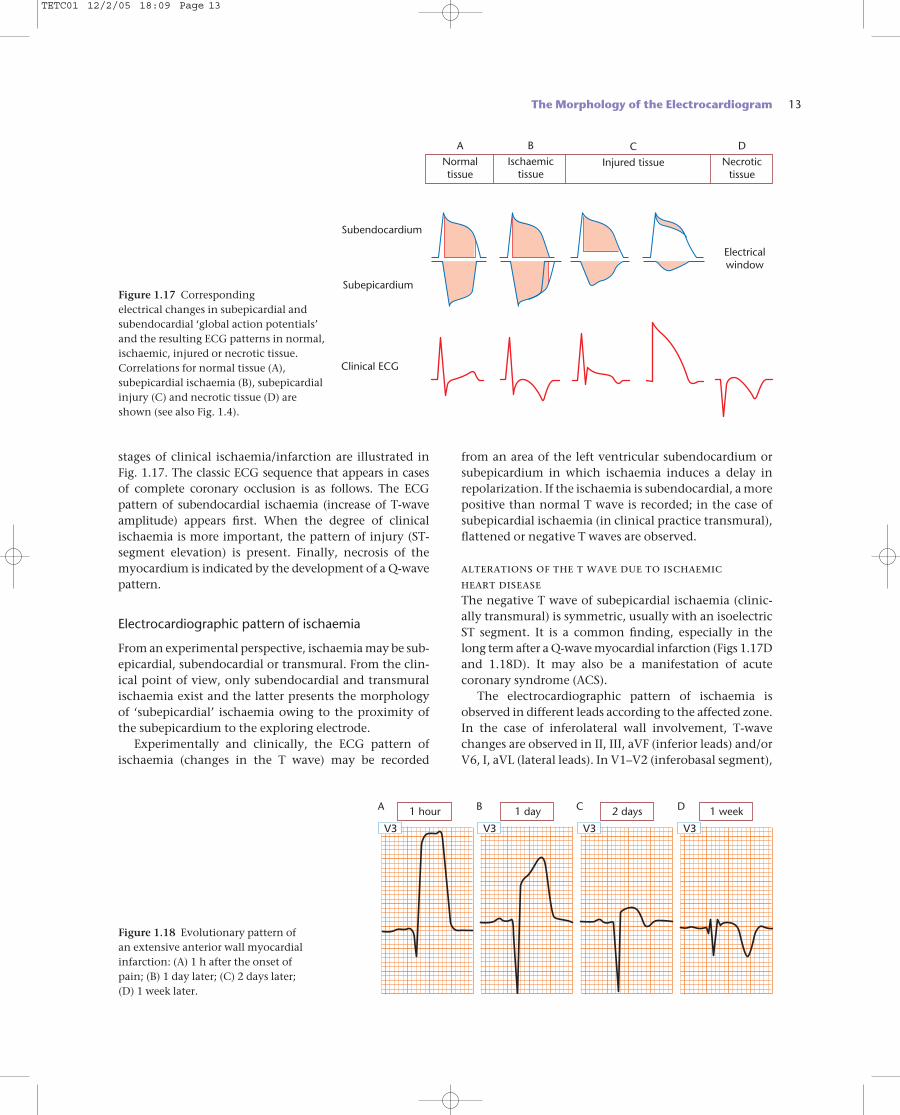
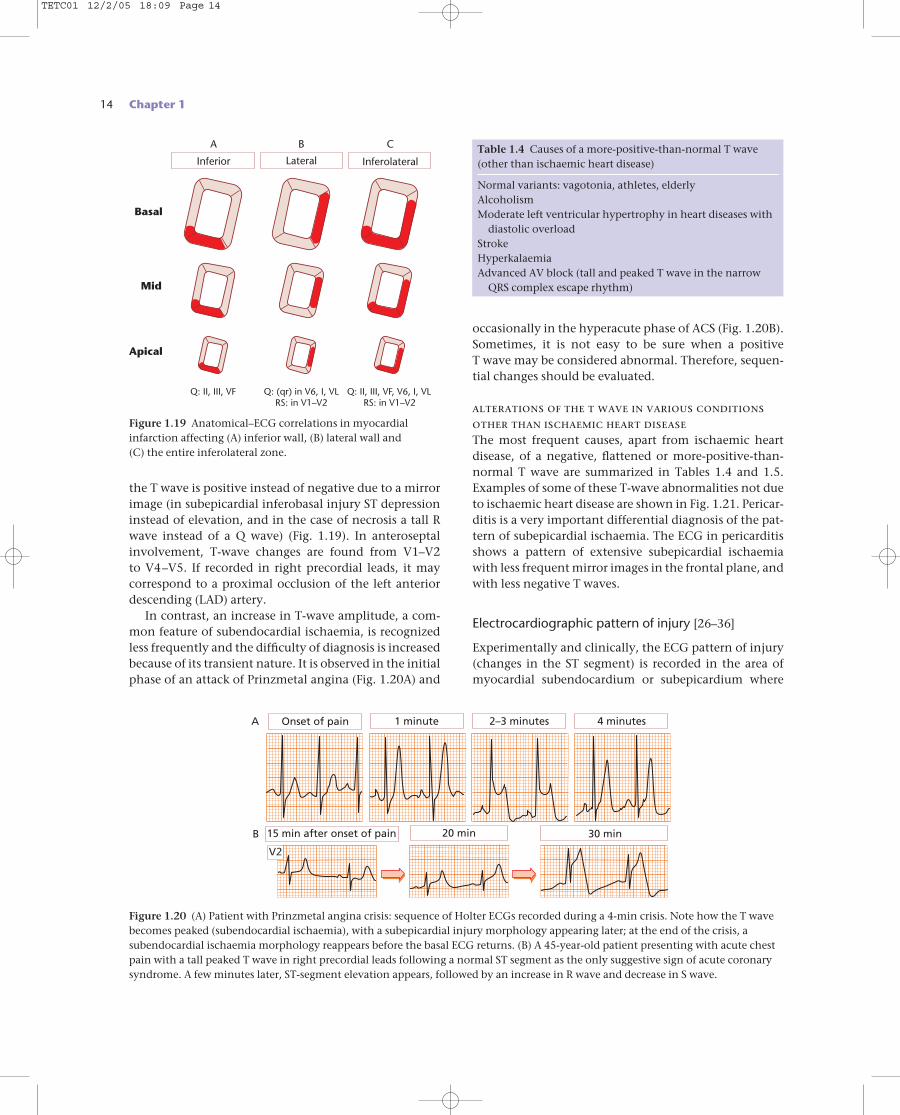
stages of clinical ischaemia/infarction are illustrated inFig. 1.17. The classic ECG sequence that appears in cases of complete coronary occlusion is as follows. The ECG pattern of subendocardial ischaemia (increase of T-waveamplitude) appears first. When the degree of clinicalischaemia is more important, the pattern of injury (ST-segment elevation) is present. Finally, necrosis of themyocardium is indicated by the development of a Q-wavepattern.
Electrocardiographic pattern of ischaemia
From an experimental perspective, ischaemia may be sub-epicardial, subendocardial or transmural. From the clin-ical point of view, only subendocardial and transmuralischaemia exist and the latter presents the morphologyof ‘subepicardial’ ischaemia owing to the proximity ofthe subepicardium to the exploring electrode.
Experimentally and clinically, the ECG pattern ofischaemia (changes in the T wave) may be recorded
from an area of the left ventricular subendocardium orsubepicardium in which ischaemia induces a delay inrepolarization. If the ischaemia is subendocardial, a more positive than normal T wave is recorded; in the case ofsubepicardial ischaemia (in clinical practice transmural),flattened or negative T waves are observed.
alterations of the t wave due to ischaemic heart diseaseThe negative T wave of subepicardial ischaemia (clinic-ally transmural) is symmetric, usually with an isoelectricST segment. It is a common finding, especially in thelong term after a Q-wave myocardial infarction (Figs 1.17Dand 1.18D). It may also be a manifestation of acute coronary syndrome (ACS).
The electrocardiographic pattern of ischaemia isobserved in different leads according to the affected zone.In the case of inferolateral wall involvement, T-wavechanges are observed in II, III, aVF (inferior leads) and/orV6, I, aVL (lateral leads). In V1–V2 (inferobasal segment),
The Morphology of the Electrocardiogram 13
Normaltissue
Ischaemictissue
Injured tissue Necrotictissue
A B C D
Electricalwindow
Subendocardium
Subepicardium
Clinical ECG
Figure 1.17 Corresponding electrical changes in subepicardial andsubendocardial ‘global action potentials’and the resulting ECG patterns in normal,ischaemic, injured or necrotic tissue.Correlations for normal tissue (A),subepicardial ischaemia (B), subepicardialinjury (C) and necrotic tissue (D) areshown (see also Fig. 1.4).
1 hour 1 day 2 days 1 week
V3V3 V3 V3
A B C D
Figure 1.18 Evolutionary pattern of an extensive anterior wall myocardialinfarction: (A) 1 h after the onset of pain; (B) 1 day later; (C) 2 days later; (D) 1 week later.
TETC01 12/2/05 18:09 Page 13
14 Chapter 1
the T wave is positive instead of negative due to a mirrorimage (in subepicardial inferobasal injury ST depressioninstead of elevation, and in the case of necrosis a tall Rwave instead of a Q wave) (Fig. 1.19). In anteroseptalinvolvement, T-wave changes are found from V1–V2 to V4–V5. If recorded in right precordial leads, it may correspond to a proximal occlusion of the left anteriordescending (LAD) artery.
In contrast, an increase in T-wave amplitude, a com-mon feature of subendocardial ischaemia, is recognizedless frequently and the difficulty of diagnosis is increasedbecause of its transient nature. It is observed in the initialphase of an attack of Prinzmetal angina (Fig. 1.20A) and
occasionally in the hyperacute phase of ACS (Fig. 1.20B).Sometimes, it is not easy to be sure when a positive T wave may be considered abnormal. Therefore, sequen-tial changes should be evaluated.
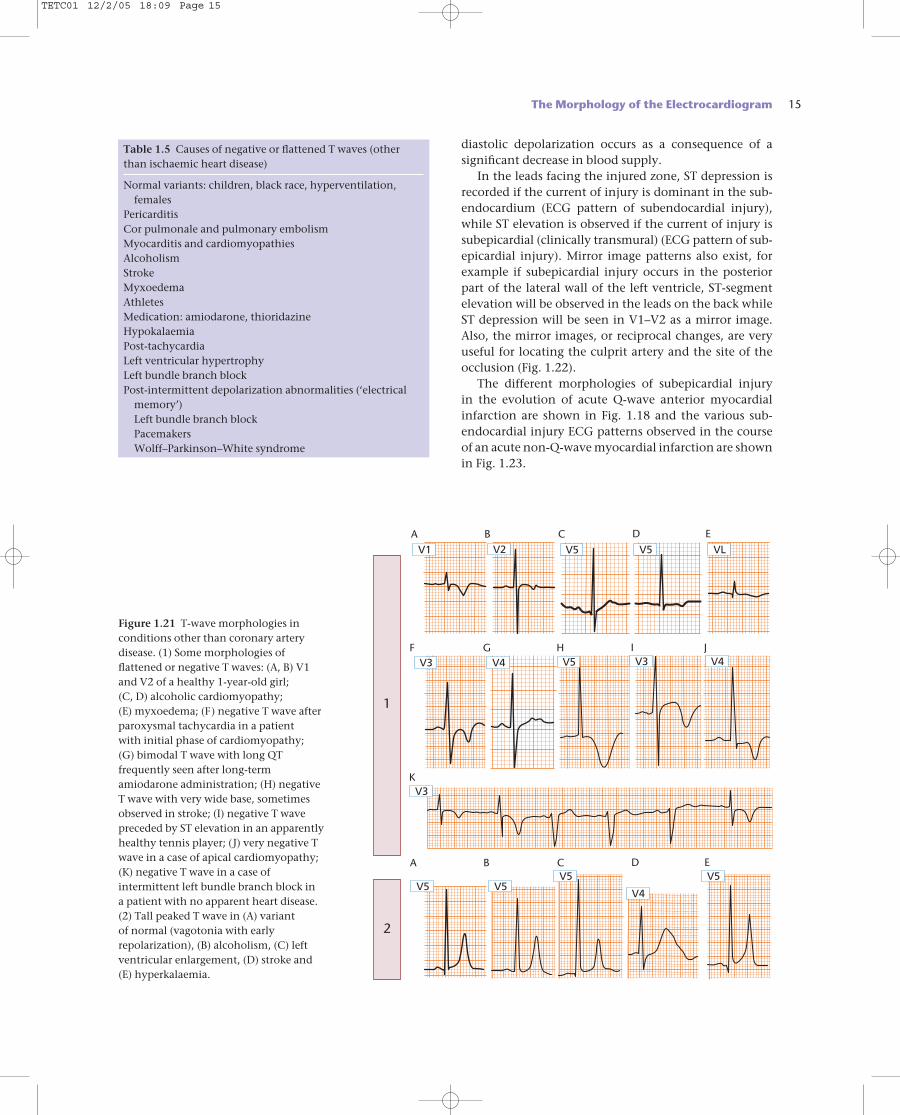
alterations of the t wave in various conditionsother than ischaemic heart diseaseThe most frequent causes, apart from ischaemic heartdisease, of a negative, flattened or more-positive-than-normal T wave are summarized in Tables 1.4 and 1.5.Examples of some of these T-wave abnormalities not dueto ischaemic heart disease are shown in Fig. 1.21. Pericar-ditis is a very important differential diagnosis of the pat-tern of subepicardial ischaemia. The ECG in pericarditisshows a pattern of extensive subepicardial ischaemiawith less frequent mirror images in the frontal plane, andwith less negative T waves.
Electrocardiographic pattern of injury [26–36]
Experimentally and clinically, the ECG pattern of injury(changes in the ST segment) is recorded in the area ofmyocardial subendocardium or subepicardium where
InferolateralLateral
Q: II, III, VF Q: (qr) in V6, I, VLRS: in V1–V2
Q: II, III, VF, V6, I, VLRS: in V1–V2
Basal
Mid
Apical
Inferior
CBA
Figure 1.19 Anatomical–ECG correlations in myocardialinfarction affecting (A) inferior wall, (B) lateral wall and (C) the entire inferolateral zone.
Onset of pain
15 min after onset of pain 20 min 30 min
1 minute 2–3 minutes 4 minutesA
B
V2
Figure 1.20 (A) Patient with Prinzmetal angina crisis: sequence of Holter ECGs recorded during a 4-min crisis. Note how the T wavebecomes peaked (subendocardial ischaemia), with a subepicardial injury morphology appearing later; at the end of the crisis, asubendocardial ischaemia morphology reappears before the basal ECG returns. (B) A 45-year-old patient presenting with acute chestpain with a tall peaked T wave in right precordial leads following a normal ST segment as the only suggestive sign of acute coronarysyndrome. A few minutes later, ST-segment elevation appears, followed by an increase in R wave and decrease in S wave.
Table 1.4 Causes of a more-positive-than-normal T wave(other than ischaemic heart disease)
Normal variants: vagotonia, athletes, elderlyAlcoholismModerate left ventricular hypertrophy in heart diseases with
diastolic overloadStrokeHyperkalaemiaAdvanced AV block (tall and peaked T wave in the narrow
QRS complex escape rhythm)
TETC01 12/2/05 18:09 Page 14
diastolic depolarization occurs as a consequence of asignificant decrease in blood supply.
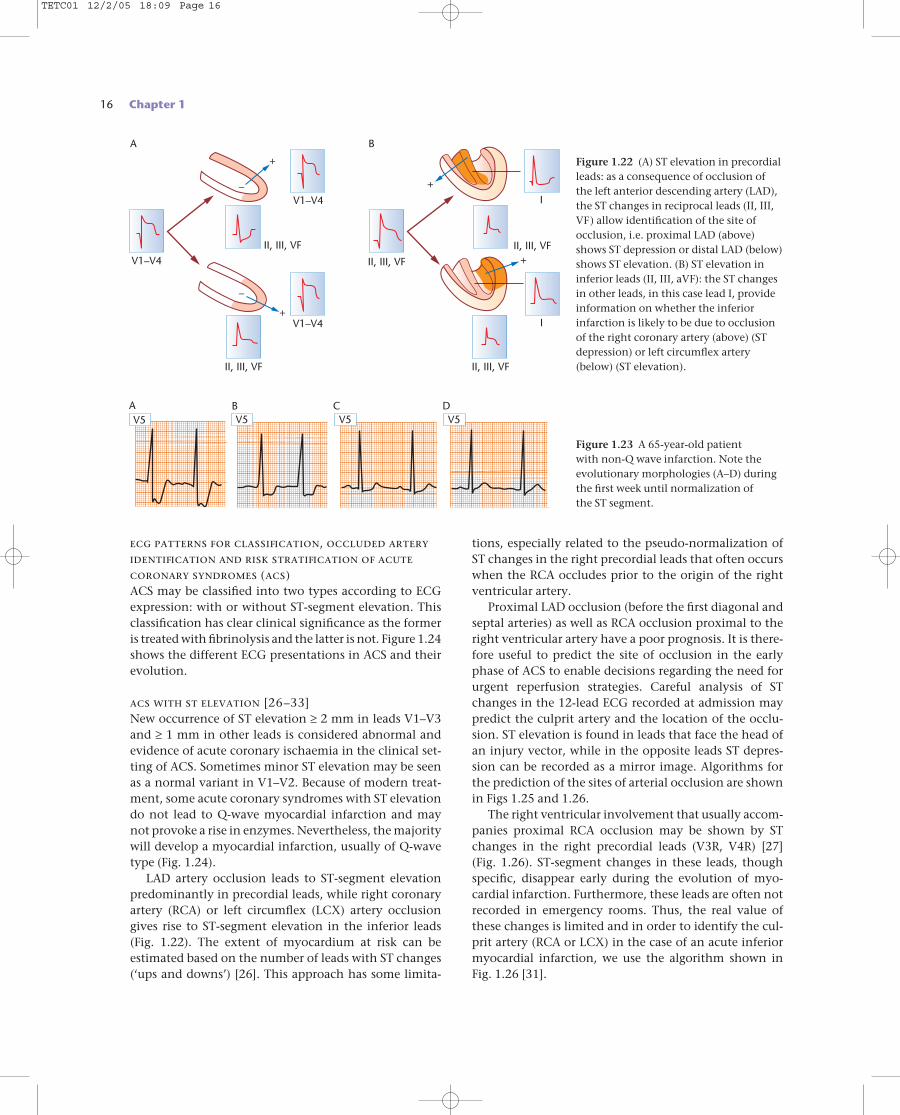
In the leads facing the injured zone, ST depression isrecorded if the current of injury is dominant in the sub-endocardium (ECG pattern of subendocardial injury),while ST elevation is observed if the current of injury issubepicardial (clinically transmural) (ECG pattern of sub-epicardial injury). Mirror image patterns also exist, forexample if subepicardial injury occurs in the posteriorpart of the lateral wall of the left ventricle, ST-segmentelevation will be observed in the leads on the back whileST depression will be seen in V1–V2 as a mirror image.Also, the mirror images, or reciprocal changes, are veryuseful for locating the culprit artery and the site of theocclusion (Fig. 1.22).
The different morphologies of subepicardial injury in the evolution of acute Q-wave anterior myocardialinfarction are shown in Fig. 1.18 and the various sub-endocardial injury ECG patterns observed in the courseof an acute non-Q-wave myocardial infarction are shownin Fig. 1.23.
The Morphology of the Electrocardiogram 15
V1 V2
V3 V4
V5 V5 VLA B C D E
A B C D E
F
K
G H I JV5 V3 V4
V3
V5 V5V5
V4
V5
1
2
Figure 1.21 T-wave morphologies inconditions other than coronary arterydisease. (1) Some morphologies offlattened or negative T waves: (A, B) V1and V2 of a healthy 1-year-old girl; (C, D) alcoholic cardiomyopathy; (E) myxoedema; (F) negative T wave afterparoxysmal tachycardia in a patient with initial phase of cardiomyopathy; (G) bimodal T wave with long QTfrequently seen after long-termamiodarone administration; (H) negativeT wave with very wide base, sometimesobserved in stroke; (I) negative T wavepreceded by ST elevation in an apparentlyhealthy tennis player; (J) very negative Twave in a case of apical cardiomyopathy;(K) negative T wave in a case ofintermittent left bundle branch block in a patient with no apparent heart disease.(2) Tall peaked T wave in (A) variant of normal (vagotonia with earlyrepolarization), (B) alcoholism, (C) leftventricular enlargement, (D) stroke and(E) hyperkalaemia.
Table 1.5 Causes of negative or flattened T waves (otherthan ischaemic heart disease)
Normal variants: children, black race, hyperventilation,females
PericarditisCor pulmonale and pulmonary embolismMyocarditis and cardiomyopathiesAlcoholismStrokeMyxoedemaAthletesMedication: amiodarone, thioridazineHypokalaemiaPost-tachycardiaLeft ventricular hypertrophyLeft bundle branch blockPost-intermittent depolarization abnormalities (‘electrical
memory’)Left bundle branch blockPacemakersWolff–Parkinson–White syndrome
TETC01 12/2/05 18:09 Page 15
ecg patterns for classification, occluded arteryidentification and risk stratification of acutecoronary syndromes (acs)ACS may be classified into two types according to ECGexpression: with or without ST-segment elevation. Thisclassification has clear clinical significance as the formeris treated with fibrinolysis and the latter is not. Figure 1.24shows the different ECG presentations in ACS and theirevolution.
acs with st elevation [26–33]New occurrence of ST elevation ≥ 2 mm in leads V1–V3and ≥ 1 mm in other leads is considered abnormal andevidence of acute coronary ischaemia in the clinical set-ting of ACS. Sometimes minor ST elevation may be seenas a normal variant in V1–V2. Because of modern treat-ment, some acute coronary syndromes with ST elevationdo not lead to Q-wave myocardial infarction and maynot provoke a rise in enzymes. Nevertheless, the majoritywill develop a myocardial infarction, usually of Q-wavetype (Fig. 1.24).
LAD artery occlusion leads to ST-segment elevationpredominantly in precordial leads, while right coronaryartery (RCA) or left circumflex (LCX) artery occlusiongives rise to ST-segment elevation in the inferior leads(Fig. 1.22). The extent of myocardium at risk can be estimated based on the number of leads with ST changes(‘ups and downs’) [26]. This approach has some limita-
tions, especially related to the pseudo-normalization ofST changes in the right precordial leads that often occurswhen the RCA occludes prior to the origin of the rightventricular artery.
Proximal LAD occlusion (before the first diagonal andseptal arteries) as well as RCA occlusion proximal to theright ventricular artery have a poor prognosis. It is there-fore useful to predict the site of occlusion in the earlyphase of ACS to enable decisions regarding the need forurgent reperfusion strategies. Careful analysis of STchanges in the 12-lead ECG recorded at admission maypredict the culprit artery and the location of the occlu-sion. ST elevation is found in leads that face the head ofan injury vector, while in the opposite leads ST depres-sion can be recorded as a mirror image. Algorithms forthe prediction of the sites of arterial occlusion are shownin Figs 1.25 and 1.26.
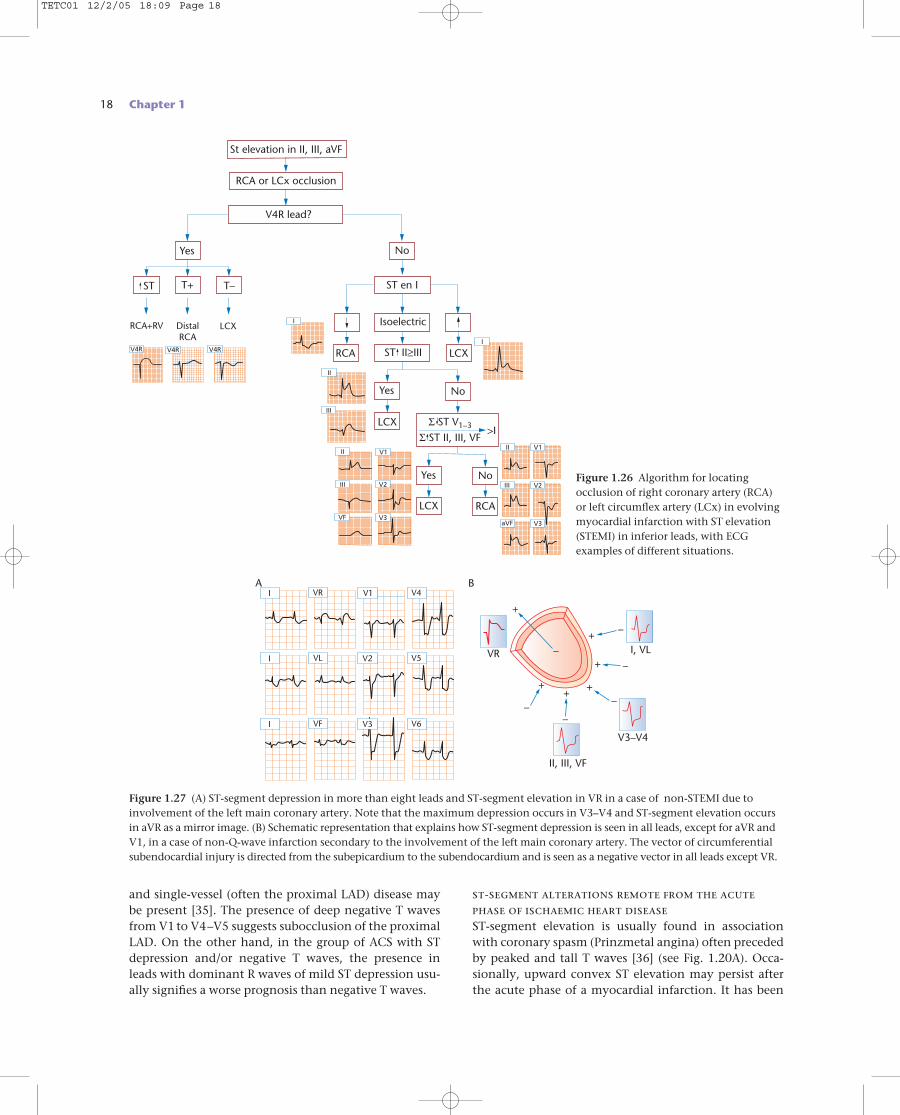
The right ventricular involvement that usually accom-panies proximal RCA occlusion may be shown by STchanges in the right precordial leads (V3R, V4R) [27] (Fig. 1.26). ST-segment changes in these leads, thoughspecific, disappear early during the evolution of myo-cardial infarction. Furthermore, these leads are often notrecorded in emergency rooms. Thus, the real value ofthese changes is limited and in order to identify the cul-prit artery (RCA or LCX) in the case of an acute inferiormyocardial infarction, we use the algorithm shown inFig. 1.26 [31].
16 Chapter 1
V5V5A B
V5C
V5D
Figure 1.23 A 65-year-old patient with non-Q wave infarction. Note theevolutionary morphologies (A–D) duringthe first week until normalization of the ST segment.
V1–V4
V1–V4
V1–V4 I
I
II, III, VF
II, III, VF
II, III, VF II, III, VF
II, III, VF
BA
–
–
+
+
+
+
Figure 1.22 (A) ST elevation in precordialleads: as a consequence of occlusion ofthe left anterior descending artery (LAD),the ST changes in reciprocal leads (II, III,VF) allow identification of the site ofocclusion, i.e. proximal LAD (above)shows ST depression or distal LAD (below)shows ST elevation. (B) ST elevation ininferior leads (II, III, aVF): the ST changesin other leads, in this case lead I, provideinformation on whether the inferiorinfarction is likely to be due to occlusionof the right coronary artery (above) (STdepression) or left circumflex artery(below) (ST elevation).
TETC01 12/2/05 18:09 Page 16
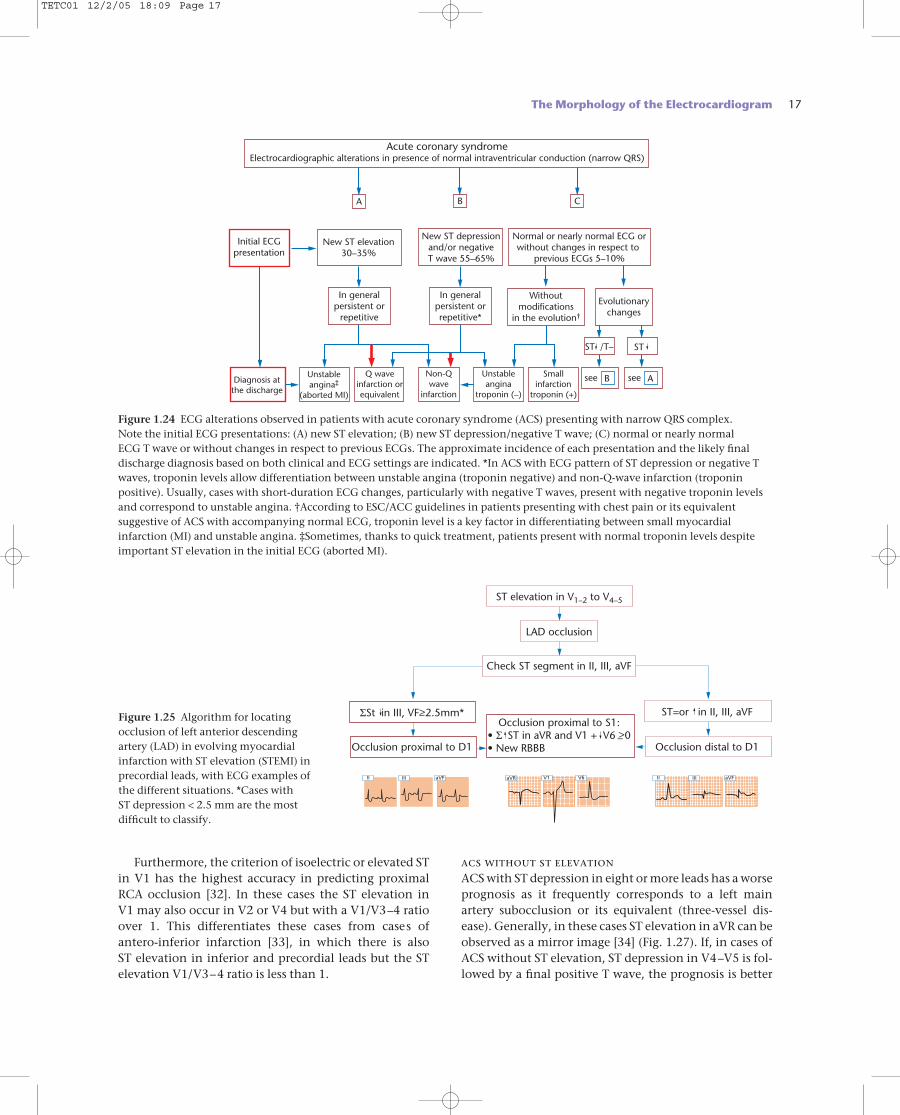
Furthermore, the criterion of isoelectric or elevated STin V1 has the highest accuracy in predicting proximalRCA occlusion [32]. In these cases the ST elevation in V1 may also occur in V2 or V4 but with a V1/V3–4 ratioover 1. This differentiates these cases from cases ofantero-inferior infarction [33], in which there is also ST elevation in inferior and precordial leads but the STelevation V1/V3–4 ratio is less than 1.
acs without st elevationACS with ST depression in eight or more leads has a worseprognosis as it frequently corresponds to a left mainartery subocclusion or its equivalent (three-vessel dis-ease). Generally, in these cases ST elevation in aVR can beobserved as a mirror image [34] (Fig. 1.27). If, in cases ofACS without ST elevation, ST depression in V4–V5 is fol-lowed by a final positive T wave, the prognosis is better
The Morphology of the Electrocardiogram 17
ST elevation in V1–2 to V4–5
LAD occlusion
ST=or in II, III, aVFΣSt in III, VF>2.5mm*Occlusion proximal to S1:
• Σ ST in aVR and V1 + V6 >0• New RBBB
Check ST segment in II, III, aVF
Occlusion proximal to D1
–
–Occlusion distal to D1
IIIII IIIV1aVF aVFV6II aVR
Figure 1.25 Algorithm for locatingocclusion of left anterior descendingartery (LAD) in evolving myocardialinfarction with ST elevation (STEMI) inprecordial leads, with ECG examples ofthe different situations. *Cases with ST depression < 2.5 mm are the mostdifficult to classify.
Acute coronary syndromeElectrocardiographic alterations in presence of normal intraventricular conduction (narrow QRS)
Initial ECGpresentation
New ST elevation30–35%
In generalpersistent orrepetitive*
Withoutmodifications
in the evolution†
In generalpersistent or
repetitive
Diagnosis atthe discharge
New ST depressionand/or negativeT wave 55–65%
Normal or nearly normal ECG orwithout changes in respect to
previous ECGs 5–10%
A B C
Evolutionarychanges
Unstableangina‡
(aborted MI)
Unstableangina
troponin (–)
ST /T–
see BSmallinfarction
troponin (+)
Q waveinfarction orequivalent
Non-Qwave
infarction
see A
ST
Figure 1.24 ECG alterations observed in patients with acute coronary syndrome (ACS) presenting with narrow QRS complex. Note the initial ECG presentations: (A) new ST elevation; (B) new ST depression/negative T wave; (C) normal or nearly normal ECG T wave or without changes in respect to previous ECGs. The approximate incidence of each presentation and the likely finaldischarge diagnosis based on both clinical and ECG settings are indicated. *In ACS with ECG pattern of ST depression or negative Twaves, troponin levels allow differentiation between unstable angina (troponin negative) and non-Q-wave infarction (troponinpositive). Usually, cases with short-duration ECG changes, particularly with negative T waves, present with negative troponin levelsand correspond to unstable angina. †According to ESC/ACC guidelines in patients presenting with chest pain or its equivalentsuggestive of ACS with accompanying normal ECG, troponin level is a key factor in differentiating between small myocardialinfarction (MI) and unstable angina. ‡Sometimes, thanks to quick treatment, patients present with normal troponin levels despiteimportant ST elevation in the initial ECG (aborted MI).
TETC01 12/2/05 18:09 Page 17
18 Chapter 1
and single-vessel (often the proximal LAD) disease maybe present [35]. The presence of deep negative T wavesfrom V1 to V4–V5 suggests subocclusion of the proximalLAD. On the other hand, in the group of ACS with STdepression and/or negative T waves, the presence inleads with dominant R waves of mild ST depression usu-ally signifies a worse prognosis than negative T waves.
st-segment alterations remote from the acutephase of ischaemic heart diseaseST-segment elevation is usually found in associationwith coronary spasm (Prinzmetal angina) often precededby peaked and tall T waves [36] (see Fig. 1.20A). Occa-sionally, upward convex ST elevation may persist afterthe acute phase of a myocardial infarction. It has been
B
VR
II, III, VF
V3–V4
I, VL
A
–
–
–
–
–
–
++ +
+
+
+
I V2 V5VL
I V6VF
I V1 V4VR
V3
Figure 1.27 (A) ST-segment depression in more than eight leads and ST-segment elevation in VR in a case of non-STEMI due toinvolvement of the left main coronary artery. Note that the maximum depression occurs in V3–V4 and ST-segment elevation occursin aVR as a mirror image. (B) Schematic representation that explains how ST-segment depression is seen in all leads, except for aVR andV1, in a case of non-Q-wave infarction secondary to the involvement of the left main coronary artery. The vector of circumferentialsubendocardial injury is directed from the subepicardium to the subendocardium and is seen as a negative vector in all leads except VR.
St elevation in II, III, aVF
RCA or LCx occlusion
V4R lead?
DistalRCA
LCXRCA+RV
Yes
ST
No
ST en I
No
>IΣ ST V1–3
Yes
NoYes
Isoelectric
ST II>III–
T+ T–
LCXRCA
Σ ST II, III, VFLCX
RCALCX
V4RV4R V4R
I
II
III
V1II
V2III
V3VF
I
V1
V2
V3
II
III
aVF
Figure 1.26 Algorithm for locatingocclusion of right coronary artery (RCA)or left circumflex artery (LCx) in evolvingmyocardial infarction with ST elevation(STEMI) in inferior leads, with ECGexamples of different situations.
TETC01 12/2/05 18:09 Page 18
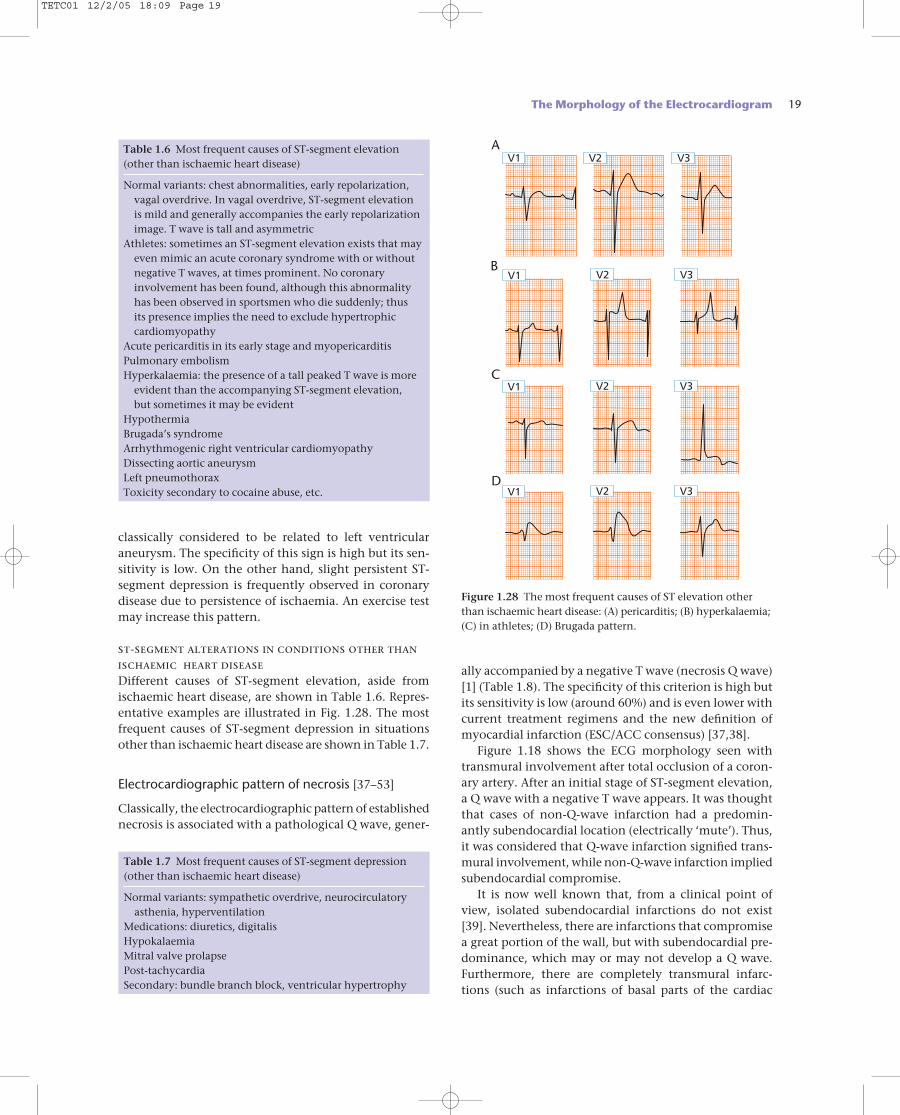
ally accompanied by a negative T wave (necrosis Q wave)[1] (Table 1.8). The specificity of this criterion is high butits sensitivity is low (around 60%) and is even lower withcurrent treatment regimens and the new definition ofmyocardial infarction (ESC/ACC consensus) [37,38].
Figure 1.18 shows the ECG morphology seen withtransmural involvement after total occlusion of a coron-ary artery. After an initial stage of ST-segment elevation,a Q wave with a negative T wave appears. It was thoughtthat cases of non-Q-wave infarction had a predomin-antly subendocardial location (electrically ‘mute’). Thus,it was considered that Q-wave infarction signified trans-mural involvement, while non-Q-wave infarction impliedsubendocardial compromise.
It is now well known that, from a clinical point ofview, isolated subendocardial infarctions do not exist[39]. Nevertheless, there are infarctions that compromisea great portion of the wall, but with subendocardial pre-dominance, which may or may not develop a Q wave.Furthermore, there are completely transmural infarc-tions (such as infarctions of basal parts of the cardiac
The Morphology of the Electrocardiogram 19
classically considered to be related to left ventricularaneurysm. The specificity of this sign is high but its sen-sitivity is low. On the other hand, slight persistent ST-segment depression is frequently observed in coronarydisease due to persistence of ischaemia. An exercise testmay increase this pattern.
st-segment alterations in conditions other thanischaemic heart diseaseDifferent causes of ST-segment elevation, aside fromischaemic heart disease, are shown in Table 1.6. Repres-entative examples are illustrated in Fig. 1.28. The mostfrequent causes of ST-segment depression in situationsother than ischaemic heart disease are shown in Table 1.7.
Electrocardiographic pattern of necrosis [37–53]
Classically, the electrocardiographic pattern of establishednecrosis is associated with a pathological Q wave, gener-
Table 1.6 Most frequent causes of ST-segment elevation(other than ischaemic heart disease)
Normal variants: chest abnormalities, early repolarization,vagal overdrive. In vagal overdrive, ST-segment elevation is mild and generally accompanies the early repolarizationimage. T wave is tall and asymmetric
Athletes: sometimes an ST-segment elevation exists that mayeven mimic an acute coronary syndrome with or withoutnegative T waves, at times prominent. No coronaryinvolvement has been found, although this abnormalityhas been observed in sportsmen who die suddenly; thus its presence implies the need to exclude hypertrophiccardiomyopathy
Acute pericarditis in its early stage and myopericarditisPulmonary embolismHyperkalaemia: the presence of a tall peaked T wave is more
evident than the accompanying ST-segment elevation, but sometimes it may be evident
HypothermiaBrugada’s syndromeArrhythmogenic right ventricular cardiomyopathyDissecting aortic aneurysmLeft pneumothoraxToxicity secondary to cocaine abuse, etc.
V1 V2 V3A
V1 V2 V3B
V1 V2 V3C
V1 V2 V3D
Figure 1.28 The most frequent causes of ST elevation otherthan ischaemic heart disease: (A) pericarditis; (B) hyperkalaemia;(C) in athletes; (D) Brugada pattern.
Table 1.7 Most frequent causes of ST-segment depression(other than ischaemic heart disease)
Normal variants: sympathetic overdrive, neurocirculatoryasthenia, hyperventilation
Medications: diuretics, digitalisHypokalaemiaMitral valve prolapsePost-tachycardiaSecondary: bundle branch block, ventricular hypertrophy
TETC01 12/2/05 18:09 Page 19
20 Chapter 1
walls, especially the posterior part of the lateral wall) thatmay not develop a Q wave. This assumption has beenrecently confirmed by magnetic resonance imaging (MRI)[40]. Consequently, the distinction between transmural(Q-wave infarction) and subendocardial (non-Q-waveinfarction) can no longer be supported.
q-wave infarction
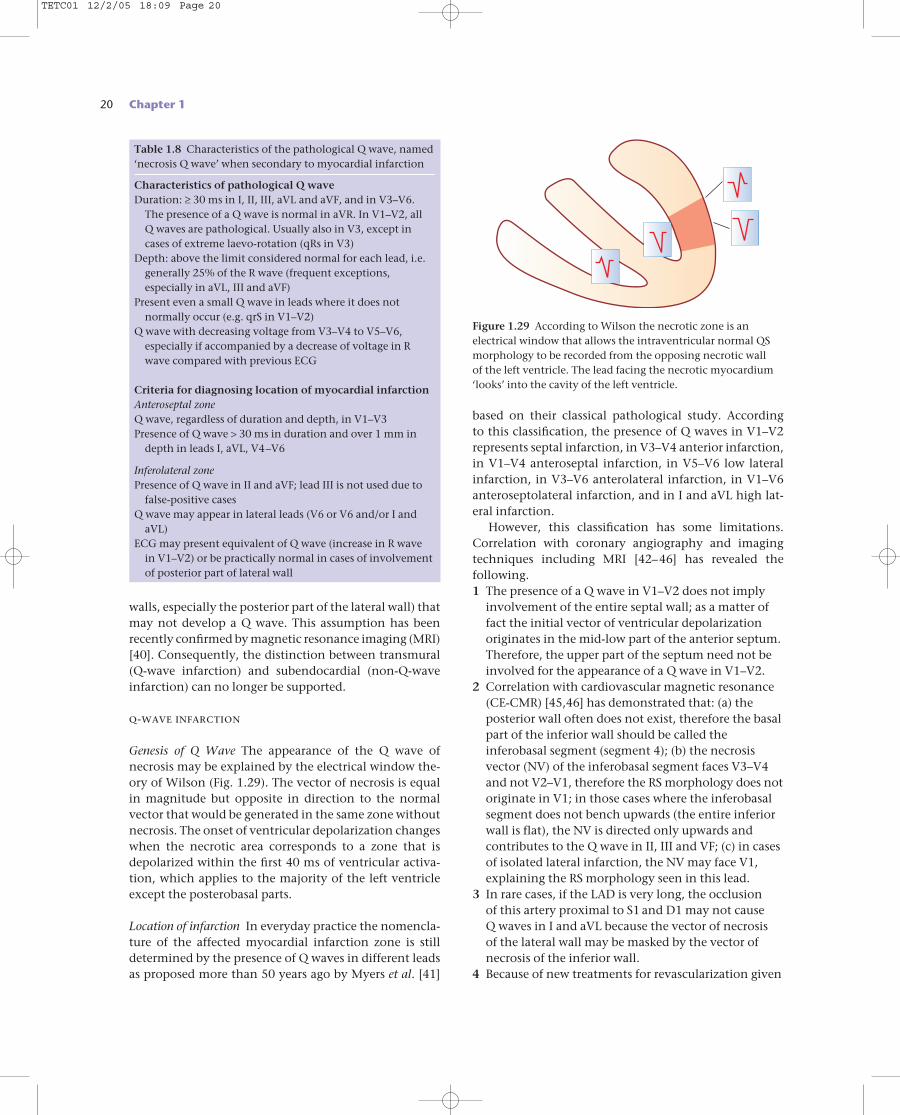
Genesis of Q Wave The appearance of the Q wave of necrosis may be explained by the electrical window the-ory of Wilson (Fig. 1.29). The vector of necrosis is equalin magnitude but opposite in direction to the normalvector that would be generated in the same zone withoutnecrosis. The onset of ventricular depolarization changeswhen the necrotic area corresponds to a zone that isdepolarized within the first 40 ms of ventricular activa-tion, which applies to the majority of the left ventricleexcept the posterobasal parts.
Location of infarction In everyday practice the nomencla-ture of the affected myocardial infarction zone is stilldetermined by the presence of Q waves in different leadsas proposed more than 50 years ago by Myers et al. [41]
based on their classical pathological study. According to this classification, the presence of Q waves in V1–V2represents septal infarction, in V3–V4 anterior infarction,in V1–V4 anteroseptal infarction, in V5–V6 low lateralinfarction, in V3–V6 anterolateral infarction, in V1–V6anteroseptolateral infarction, and in I and aVL high lat-eral infarction.
However, this classification has some limitations.Correlation with coronary angiography and imagingtechniques including MRI [42–46] has revealed the following.1 The presence of a Q wave in V1–V2 does not imply
involvement of the entire septal wall; as a matter offact the initial vector of ventricular depolarizationoriginates in the mid-low part of the anterior septum.Therefore, the upper part of the septum need not beinvolved for the appearance of a Q wave in V1–V2.
2 Correlation with cardiovascular magnetic resonance(CE-CMR) [45,46] has demonstrated that: (a) theposterior wall often does not exist, therefore the basalpart of the inferior wall should be called theinferobasal segment (segment 4); (b) the necrosisvector (NV) of the inferobasal segment faces V3–V4and not V2–V1, therefore the RS morphology does notoriginate in V1; in those cases where the inferobasalsegment does not bench upwards (the entire inferiorwall is flat), the NV is directed only upwards andcontributes to the Q wave in II, III and VF; (c) in casesof isolated lateral infarction, the NV may face V1,explaining the RS morphology seen in this lead.
3 In rare cases, if the LAD is very long, the occlusion of this artery proximal to S1 and D1 may not cause Q waves in I and aVL because the vector of necrosis of the lateral wall may be masked by the vector ofnecrosis of the inferior wall.
4 Because of new treatments for revascularization given
Table 1.8 Characteristics of the pathological Q wave, named‘necrosis Q wave’ when secondary to myocardial infarction
Characteristics of pathological Q waveDuration: ≥ 30 ms in I, II, III, aVL and aVF, and in V3–V6.
The presence of a Q wave is normal in aVR. In V1–V2, all Q waves are pathological. Usually also in V3, except incases of extreme laevo-rotation (qRs in V3)
Depth: above the limit considered normal for each lead, i.e.generally 25% of the R wave (frequent exceptions,especially in aVL, III and aVF)
Present even a small Q wave in leads where it does notnormally occur (e.g. qrS in V1–V2)
Q wave with decreasing voltage from V3–V4 to V5–V6,especially if accompanied by a decrease of voltage in Rwave compared with previous ECG
Criteria for diagnosing location of myocardial infarctionAnteroseptal zoneQ wave, regardless of duration and depth, in V1–V3Presence of Q wave > 30 ms in duration and over 1 mm in
depth in leads I, aVL, V4–V6
Inferolateral zonePresence of Q wave in II and aVF; lead III is not used due to
false-positive casesQ wave may appear in lateral leads (V6 or V6 and/or I and
aVL)ECG may present equivalent of Q wave (increase in R wave
in V1–V2) or be practically normal in cases of involvementof posterior part of lateral wall
Figure 1.29 According to Wilson the necrotic zone is anelectrical window that allows the intraventricular normal QSmorphology to be recorded from the opposing necrotic wall of the left ventricle. The lead facing the necrotic myocardium‘looks’ into the cavity of the left ventricle.
TETC01 12/2/05 18:09 Page 20
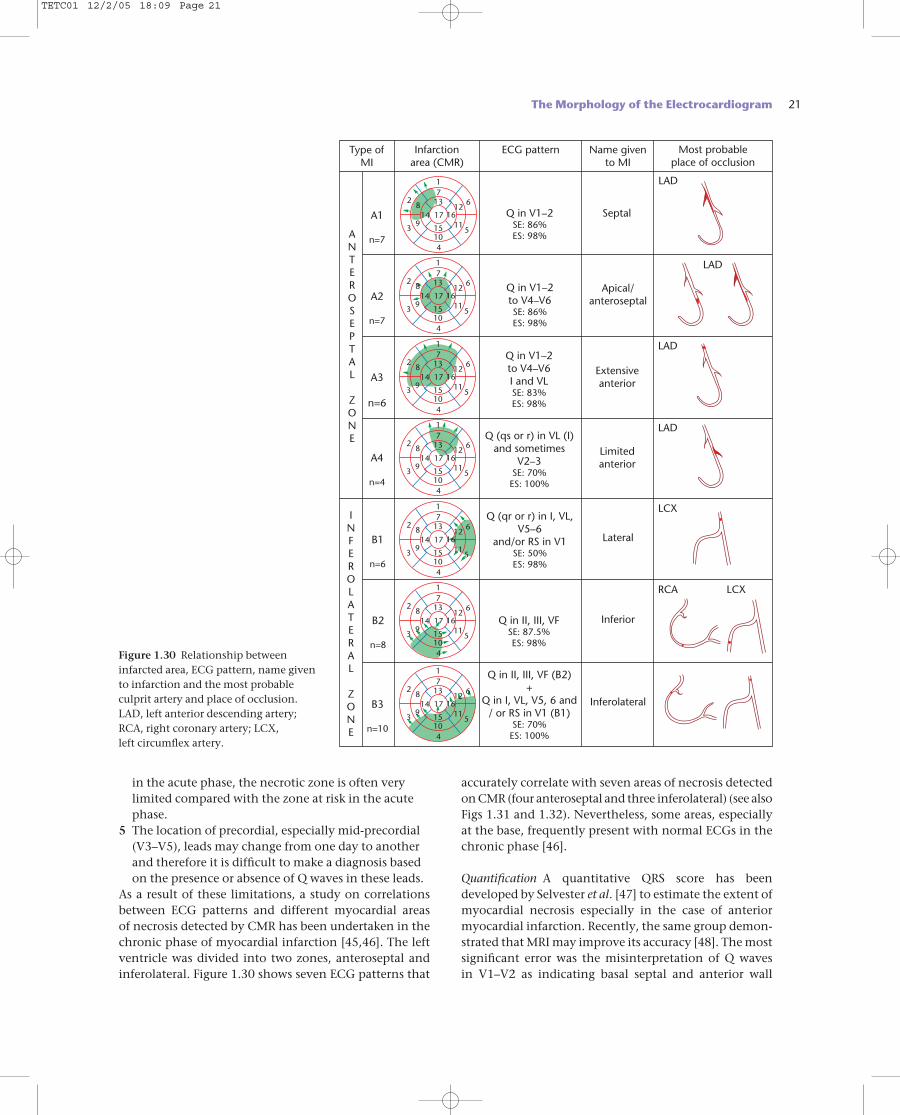
accurately correlate with seven areas of necrosis detectedon CMR (four anteroseptal and three inferolateral) (see alsoFigs 1.31 and 1.32). Nevertheless, some areas, especiallyat the base, frequently present with normal ECGs in thechronic phase [46].
Quantification A quantitative QRS score has been developed by Selvester et al. [47] to estimate the extent ofmyocardial necrosis especially in the case of anteriormyocardial infarction. Recently, the same group demon-strated that MRI may improve its accuracy [48]. The mostsignificant error was the misinterpretation of Q waves in V1–V2 as indicating basal septal and anterior wall
in the acute phase, the necrotic zone is often verylimited compared with the zone at risk in the acutephase.
5 The location of precordial, especially mid-precordial(V3–V5), leads may change from one day to anotherand therefore it is difficult to make a diagnosis basedon the presence or absence of Q waves in these leads.
As a result of these limitations, a study on correlationsbetween ECG patterns and different myocardial areas of necrosis detected by CMR has been undertaken in thechronic phase of myocardial infarction [45,46]. The leftventricle was divided into two zones, anteroseptal andinferolateral. Figure 1.30 shows seven ECG patterns that
The Morphology of the Electrocardiogram 21
Q in II, III, VF (B2)+
Q in I, VL, V5, 6 and/ or RS in V1 (B1)
SE: 70%ES: 100%
Q in II, III, VFSE: 87.5%ES: 98%
Q (qr or r) in I, VL,V5–6
and/or RS in V1SE: 50%ES: 98%
Q (qs or r) in VL (I)and sometimes
V2–3SE: 70%ES: 100%
Q in V1–2to V4–V6I and VLSE: 83%ES: 98%
Q in V1–2to V4–V6SE: 86%ES: 98%
Q in V1–2SE: 86%ES: 98%
Name givento MI
Most probableplace of occlusion
17
28 13
1412
6
3 9
10
16
15
4
115
17
17
28 13
1412
6
3 9
10
16
15
4
115
17
17
28 13
1412
6
3 9
10
16
15
4
115
17
17
28 13
1412
6
3 9
10
16
15
4
115
17
17
28 13
1412
6
3 9
10
16
15
4
115
17
17
28 13
1412
6
3 9
10
16
15
4
115
17
17
28 13
1412
6
3 9
10
16
15
4
115
17
ECG patternInfarctionarea (CMR)
Type ofMI
B3
n=10
B2
n=8
Inferolateral
Inferior
RCA LCX
LCX
Lateral
Limitedanterior
LAD
LAD
LAD
LAD
Extensiveanterior
Apical/anteroseptal
Septal
B1
n=6
A4
n=4
A3
n=6
A2
n=7
A1
n=7
INFEROLATERAL
ZONE
ANTEROSEPTAL
ZONE
Figure 1.30 Relationship betweeninfarcted area, ECG pattern, name givento infarction and the most probableculprit artery and place of occlusion. LAD, left anterior descending artery; RCA, right coronary artery; LCX, left circumflex artery.
TETC01 12/2/05 18:09 Page 21
22 Chapter 1
involvement. As already stated this is incorrect becausethe first vector (r wave in V1–V2) is generated in the mid-low anterior part of the septum. Also recently, it has been found that pre-discharge scoring in patients withanterior Q waves did not correlate with the amount ofmyocardial damage as estimated by radionuclide tech-niques in patients treated with and without thrombolytics[49]. Furthermore, spontaneous changes in the QRS scorefrom discharge to 6 months seem to be of limited value inidentifying patients with late improvement of perfusionor left ventricular function.
differential diagnosis of pathological q waveAlthough the specificity of a pathological Q wave fordiagnosing myocardial infarction is high, similar Q wavescan be seen in other conditions. The diagnosis ofmyocardial infarction is based not only on electrocardio-graphic alterations but also on the clinical evaluationand enzyme changes. The pattern of ischaemia or injuryaccompanying a pathological Q wave is supportive of theQ wave being secondary to ischaemic heart disease. Themain causes of pathological Q waves other than myocar-dial necrosis are listed in Table 1.9. On the other hand, in5–25% of Q-wave infarctions (with the highest incidencein inferior wall infarction) the Q wave disappears withtime, which explains the relatively poor sensitivity of theQ wave for detecting old myocardial infarction.
diagnosis of necrosis in the presence ofventricular blocks, pre-excitation or ventricular pacemaker
Complete RBBB Since cardiac activation begins normallyin RBBB, the presence of a myocardial infarction causesan alteration in the first part of the QRS complex that can generate a Q wave, just as with normal ventricularconduction. Furthermore, in the acute phase the ST–Tchanges can be seen exactly as with normal activation.Patients with ACS with ST elevation that during its coursedevelops new-onset complete RBBB usually have theLAD occluded before the first septal and first diagonalarteries (Fig. 1.25). This is explained by the fact that theright bundle branch receives its blood supply from thefirst septal artery.
Complete LBBB In the acute phase, the diagnosis ofmyocardial infarction in the presence of complete LBBBmay be suggested by ST-segment changes [50]. In thechronic phase, detection of underlying myocardialinfarction is difficult. Ventricular depolarization startsclose to the base of the anterior papillary muscle of the right ventricle. This causes a depolarization vector that isdirected forward, downwards and to the left. Trans-septaldepolarization of the left ventricle initiates subsequent
Table 1.9 Pathological Q wave not secondary to myocardialinfarctioon
During the evolution of an acute disease involving the heartAcute coronary syndrome with an aborted infarctionCoronary spasm (Prinzmetal angina type)Acute myocarditisPresence of transient apical dyskinesia that also shows ST-
segment elevation and a transient pathological q wave(Tako-tsubo syndrome) [53]
Pulmonary embolismMiscellaneous: toxic agents, etc.
Chronic patternRecording artefactsNormal variants: aVL in the vertical heart and III in the
dextrorotated and horizontal heartQS in V1 (hardly ever in V2) in septal fibrosis, emphysema,
the elderly, chest abnormalities, etc.Some types of right ventricular hypertrophy (chronic cor
pulmonale) or left ventricular hypertrophy (QS in V1–V2,or slow increase in R wave in precordial leads, or abnormalq wave in hypertrophic cardiomyopathy)
Left bundle branch conduction abnormalitiesInfiltrative processes (e.g. amyloidosis, sarcoidosis, tumours,
chronic myocarditis, dilated cardiomyopathy)Wolff–Parkinson–White syndromeDextrocardiaPhaeochromocytoma
I II III VR VL VF
V1 V2 V3 V4 V5 V6
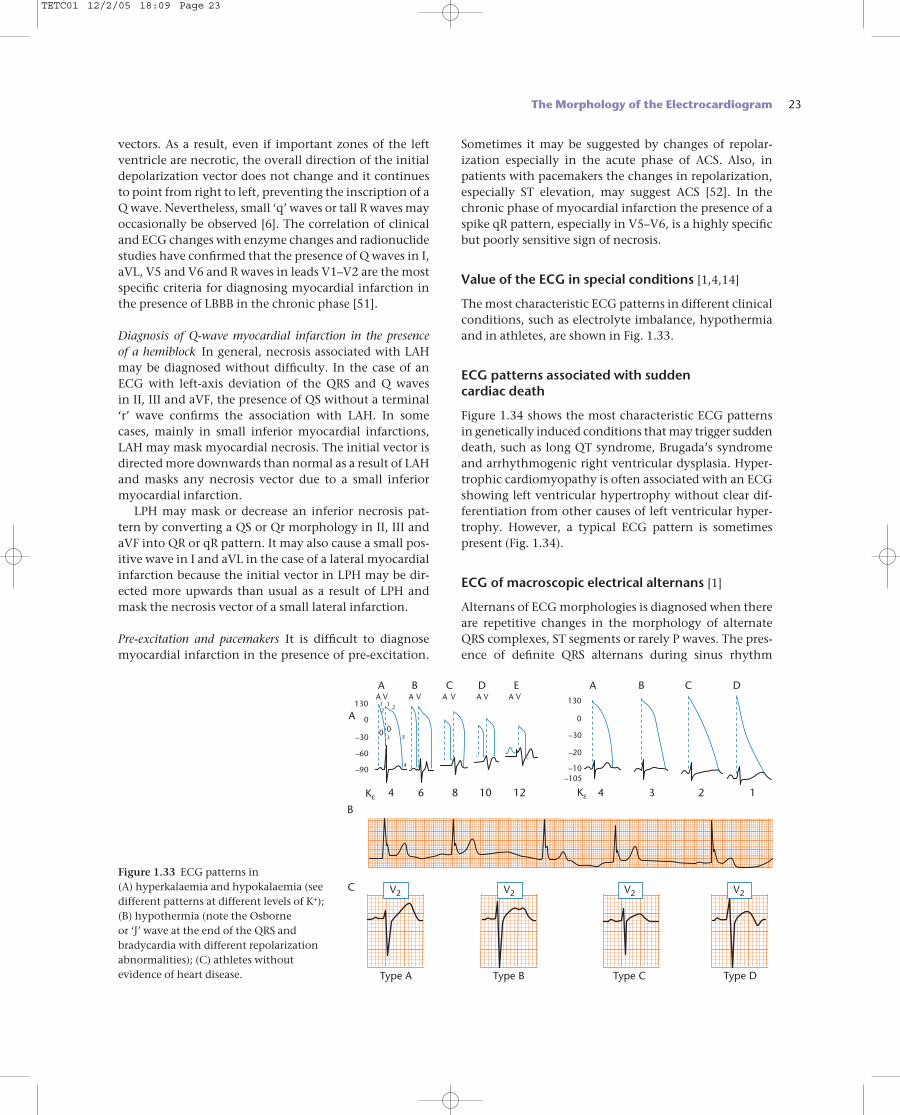
Figure 1.32 ECG of inferolateral myocardial infarction (B3 type in Fig. 1.30).
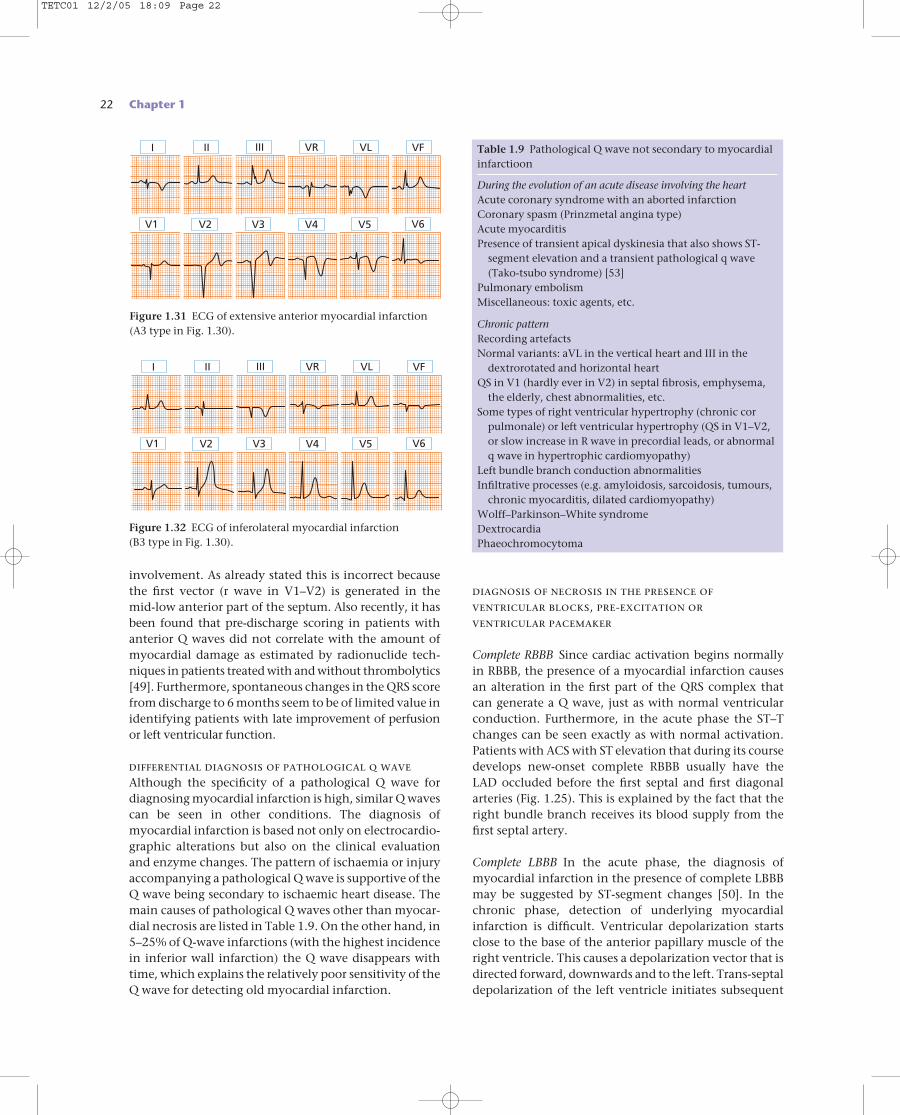
Figure 1.31 ECG of extensive anterior myocardial infarction(A3 type in Fig. 1.30).
I II III VR VL VF
V1 V2 V3 V4 V5 V6
TETC01 12/2/05 18:09 Page 22
vectors. As a result, even if important zones of the leftventricle are necrotic, the overall direction of the initialdepolarization vector does not change and it continuesto point from right to left, preventing the inscription of aQ wave. Nevertheless, small ‘q’ waves or tall R waves mayoccasionally be observed [6]. The correlation of clinicaland ECG changes with enzyme changes and radionuclidestudies have confirmed that the presence of Q waves in I,aVL, V5 and V6 and R waves in leads V1–V2 are the mostspecific criteria for diagnosing myocardial infarction inthe presence of LBBB in the chronic phase [51].
Diagnosis of Q-wave myocardial infarction in the presence of a hemiblock In general, necrosis associated with LAHmay be diagnosed without difficulty. In the case of anECG with left-axis deviation of the QRS and Q waves in II, III and aVF, the presence of QS without a terminal‘r’ wave confirms the association with LAH. In somecases, mainly in small inferior myocardial infarctions,LAH may mask myocardial necrosis. The initial vector isdirected more downwards than normal as a result of LAHand masks any necrosis vector due to a small inferiormyocardial infarction.
LPH may mask or decrease an inferior necrosis pat-tern by converting a QS or Qr morphology in II, III andaVF into QR or qR pattern. It may also cause a small pos-itive wave in I and aVL in the case of a lateral myocardialinfarction because the initial vector in LPH may be dir-ected more upwards than usual as a result of LPH andmask the necrosis vector of a small lateral infarction.
Pre-excitation and pacemakers It is difficult to diagnosemyocardial infarction in the presence of pre-excitation.
The Morphology of the Electrocardiogram 23
B
C
A
4KεKε 3 2 1
AA B C D E B C D
1210864
Type A Type C
130
0
–30
–20
–10
130
–30
–60
–90
0
0 0
1 12 2
3 3
4
A A A A AV V V V V
–105
V2 V2 V2 V2
Type B Type D
Figure 1.33 ECG patterns in (A) hyperkalaemia and hypokalaemia (seedifferent patterns at different levels of K+); (B) hypothermia (note the Osborne or ‘J’ wave at the end of the QRS andbradycardia with different repolarizationabnormalities); (C) athletes withoutevidence of heart disease.
Sometimes it may be suggested by changes of repolar-ization especially in the acute phase of ACS. Also, inpatients with pacemakers the changes in repolarization,especially ST elevation, may suggest ACS [52]. In thechronic phase of myocardial infarction the presence of aspike qR pattern, especially in V5–V6, is a highly specificbut poorly sensitive sign of necrosis.
Value of the ECG in special conditions [1,4,14]
The most characteristic ECG patterns in different clinicalconditions, such as electrolyte imbalance, hypothermiaand in athletes, are shown in Fig. 1.33.
ECG patterns associated with sudden cardiac death
Figure 1.34 shows the most characteristic ECG patternsin genetically induced conditions that may trigger suddendeath, such as long QT syndrome, Brugada’s syndromeand arrhythmogenic right ventricular dysplasia. Hyper-trophic cardiomyopathy is often associated with an ECGshowing left ventricular hypertrophy without clear dif-ferentiation from other causes of left ventricular hyper-trophy. However, a typical ECG pattern is sometimespresent (Fig. 1.34).
ECG of macroscopic electrical alternans [1]
Alternans of ECG morphologies is diagnosed when thereare repetitive changes in the morphology of alternateQRS complexes, ST segments or rarely P waves. The pres-ence of definite QRS alternans during sinus rhythm
TETC01 12/2/05 18:09 Page 23
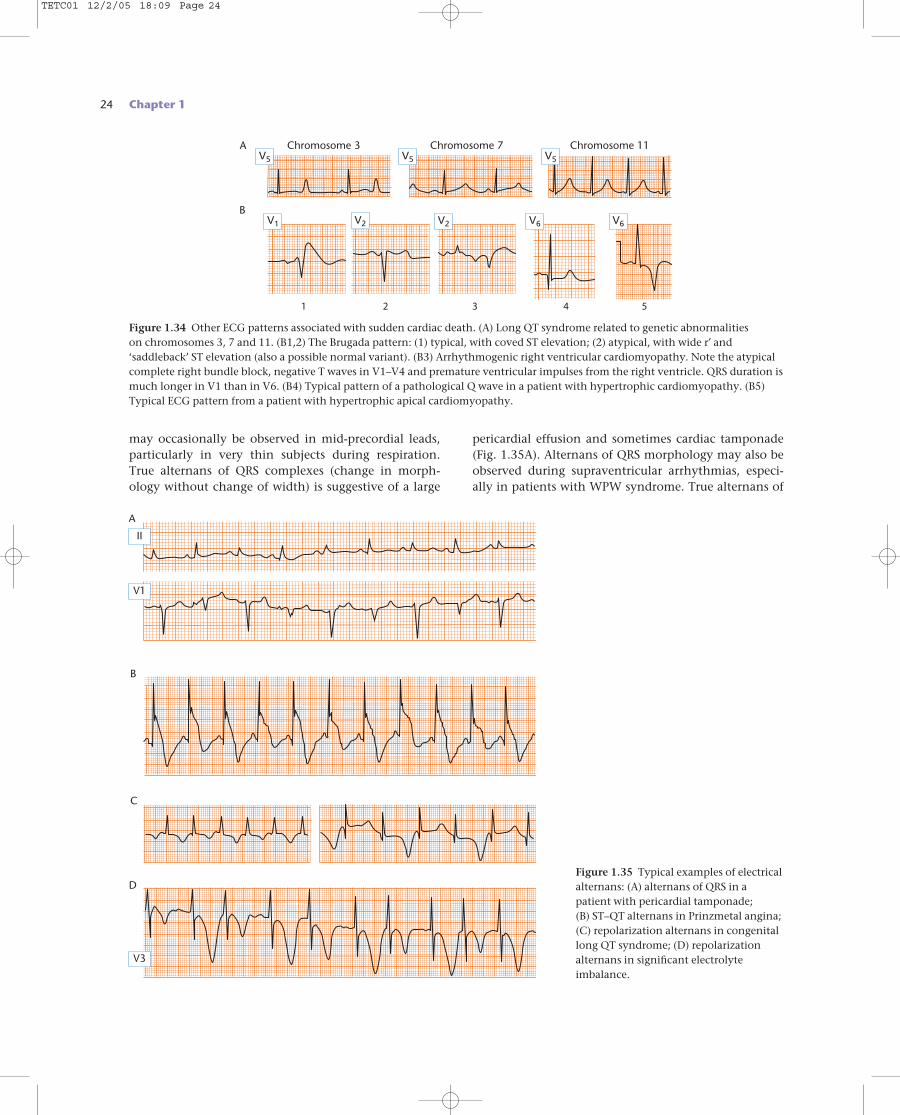
24 Chapter 1
may occasionally be observed in mid-precordial leads,particularly in very thin subjects during respiration. True alternans of QRS complexes (change in morph-ology without change of width) is suggestive of a large
pericardial effusion and sometimes cardiac tamponade (Fig. 1.35A). Alternans of QRS morphology may also beobserved during supraventricular arrhythmias, especi-ally in patients with WPW syndrome. True alternans of
A
B
C
D
V1
II
V3
Figure 1.35 Typical examples of electricalalternans: (A) alternans of QRS in apatient with pericardial tamponade; (B) ST–QT alternans in Prinzmetal angina; (C) repolarization alternans in congenitallong QT syndrome; (D) repolarizationalternans in significant electrolyteimbalance.
A Chromosome 3
BV6V6
V5
Chromosome 7V5
Chromosome 11
V2V2V1
4321 5
V5
Figure 1.34 Other ECG patterns associated with sudden cardiac death. (A) Long QT syndrome related to genetic abnormalities on chromosomes 3, 7 and 11. (B1,2) The Brugada pattern: (1) typical, with coved ST elevation; (2) atypical, with wide r′ and‘saddleback’ ST elevation (also a possible normal variant). (B3) Arrhythmogenic right ventricular cardiomyopathy. Note the atypicalcomplete right bundle block, negative T waves in V1–V4 and premature ventricular impulses from the right ventricle. QRS duration ismuch longer in V1 than in V6. (B4) Typical pattern of a pathological Q wave in a patient with hypertrophic cardiomyopathy. (B5)Typical ECG pattern from a patient with hypertrophic apical cardiomyopathy.
TETC01 12/2/05 18:09 Page 24
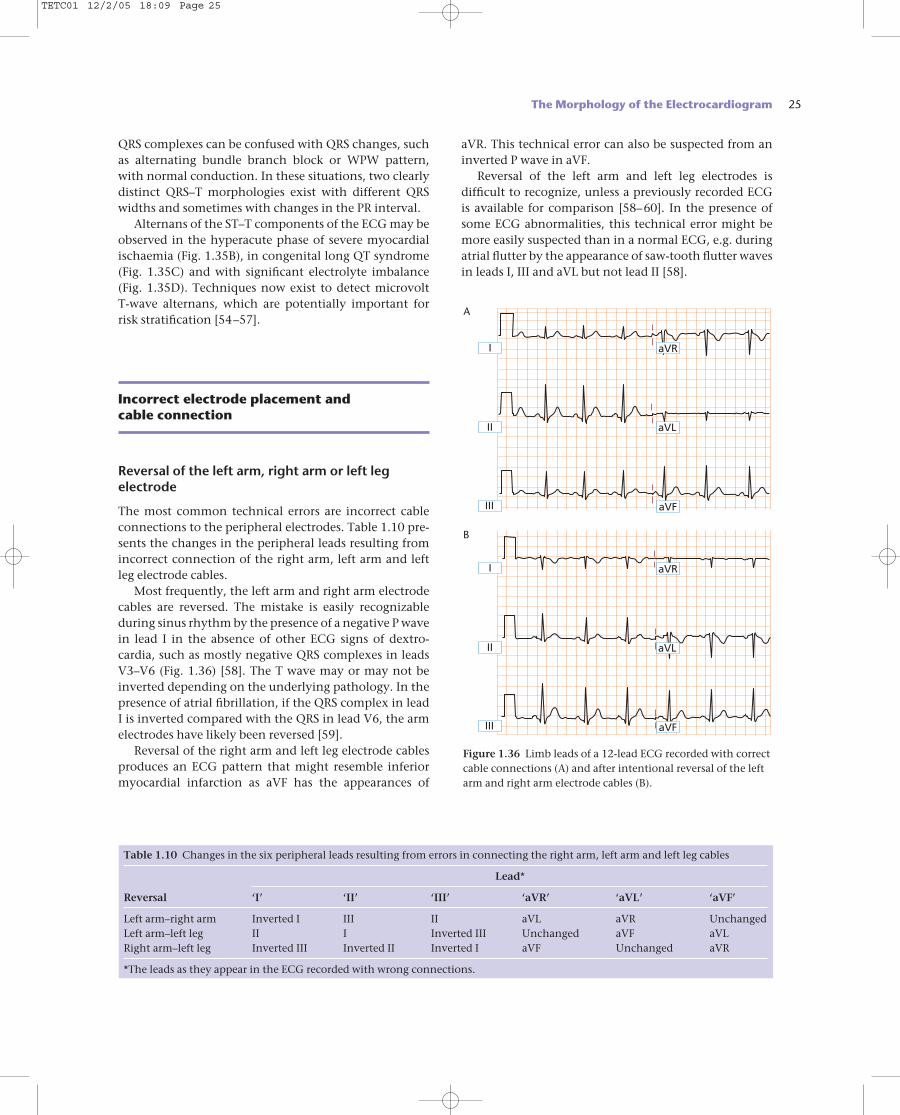
QRS complexes can be confused with QRS changes, suchas alternating bundle branch block or WPW pattern,with normal conduction. In these situations, two clearlydistinct QRS–T morphologies exist with different QRSwidths and sometimes with changes in the PR interval.
Alternans of the ST–T components of the ECG may beobserved in the hyperacute phase of severe myocardialischaemia (Fig. 1.35B), in congenital long QT syndrome(Fig. 1.35C) and with significant electrolyte imbalance(Fig. 1.35D). Techniques now exist to detect microvolt T-wave alternans, which are potentially important forrisk stratification [54–57].
Incorrect electrode placement and cable connection
Reversal of the left arm, right arm or left legelectrode
The most common technical errors are incorrect cableconnections to the peripheral electrodes. Table 1.10 pre-sents the changes in the peripheral leads resulting fromincorrect connection of the right arm, left arm and leftleg electrode cables.
Most frequently, the left arm and right arm electrodecables are reversed. The mistake is easily recognizableduring sinus rhythm by the presence of a negative P wavein lead I in the absence of other ECG signs of dextro-cardia, such as mostly negative QRS complexes in leadsV3–V6 (Fig. 1.36) [58]. The T wave may or may not beinverted depending on the underlying pathology. In thepresence of atrial fibrillation, if the QRS complex in leadI is inverted compared with the QRS in lead V6, the armelectrodes have likely been reversed [59].
Reversal of the right arm and left leg electrode cablesproduces an ECG pattern that might resemble inferiormyocardial infarction as aVF has the appearances of
aVR. This technical error can also be suspected from aninverted P wave in aVF.
Reversal of the left arm and left leg electrodes is difficult to recognize, unless a previously recorded ECG is available for comparison [58–60]. In the presence ofsome ECG abnormalities, this technical error might bemore easily suspected than in a normal ECG, e.g. duringatrial flutter by the appearance of saw-tooth flutter wavesin leads I, III and aVL but not lead II [58].
The Morphology of the Electrocardiogram 25
Table 1.10 Changes in the six peripheral leads resulting from errors in connecting the right arm, left arm and left leg cables
Lead*
Reversal ‘I’ ‘II’ ‘III’ ‘aVR’ ‘aVL’ ‘aVF’
Left arm–right arm Inverted I III II aVL aVR UnchangedLeft arm–left leg II I Inverted III Unchanged aVF aVLRight arm–left leg Inverted III Inverted II Inverted I aVF Unchanged aVR
*The leads as they appear in the ECG recorded with wrong connections.
I
II
III
I
II
III
aVR
aVR
aVL
aVL
aVF
aVF
Figure 1.36 Limb leads of a 12-lead ECG recorded with correctcable connections (A) and after intentional reversal of the leftarm and right arm electrode cables (B).
A
B
TETC01 12/2/05 18:09 Page 25
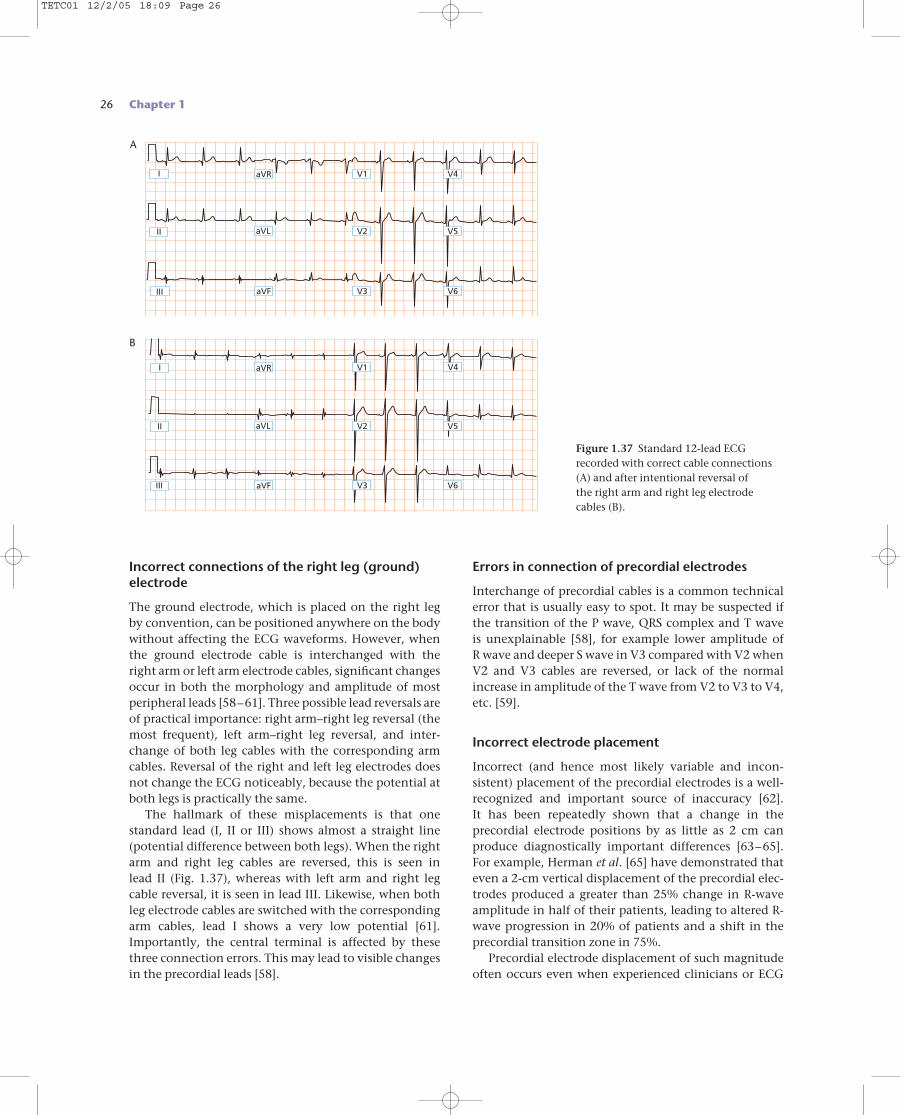
26 Chapter 1
Incorrect connections of the right leg (ground)electrode
The ground electrode, which is placed on the right legby convention, can be positioned anywhere on the bodywithout affecting the ECG waveforms. However, whenthe ground electrode cable is interchanged with the right arm or left arm electrode cables, significant changesoccur in both the morphology and amplitude of mostperipheral leads [58–61]. Three possible lead reversals areof practical importance: right arm–right leg reversal (themost frequent), left arm–right leg reversal, and inter-change of both leg cables with the corresponding armcables. Reversal of the right and left leg electrodes doesnot change the ECG noticeably, because the potential atboth legs is practically the same.
The hallmark of these misplacements is that one standard lead (I, II or III) shows almost a straight line(potential difference between both legs). When the rightarm and right leg cables are reversed, this is seen in lead II (Fig. 1.37), whereas with left arm and right legcable reversal, it is seen in lead III. Likewise, when bothleg electrode cables are switched with the correspondingarm cables, lead I shows a very low potential [61].Importantly, the central terminal is affected by thesethree connection errors. This may lead to visible changesin the precordial leads [58].
Errors in connection of precordial electrodes
Interchange of precordial cables is a common technicalerror that is usually easy to spot. It may be suspected ifthe transition of the P wave, QRS complex and T wave is unexplainable [58], for example lower amplitude of R wave and deeper S wave in V3 compared with V2 whenV2 and V3 cables are reversed, or lack of the normalincrease in amplitude of the T wave from V2 to V3 to V4,etc. [59].
Incorrect electrode placement
Incorrect (and hence most likely variable and incon-sistent) placement of the precordial electrodes is a well-recognized and important source of inaccuracy [62]. It has been repeatedly shown that a change in the precordial electrode positions by as little as 2 cm can produce diagnostically important differences [63–65].For example, Herman et al. [65] have demonstrated that even a 2-cm vertical displacement of the precordial elec-trodes produced a greater than 25% change in R-waveamplitude in half of their patients, leading to altered R-wave progression in 20% of patients and a shift in theprecordial transition zone in 75%.
Precordial electrode displacement of such magnitudeoften occurs even when experienced clinicians or ECG
Figure 1.37 Standard 12-lead ECGrecorded with correct cable connections(A) and after intentional reversal of the right arm and right leg electrodecables (B).
I
I
II
II
III
III
aVR
aVR
aVL
aVL
aVF
aVF
V1
V1
V2
V2
V3
V3
V4
V4
V5
V5
V6
V6
A
B
TETC01 12/2/05 18:09 Page 26
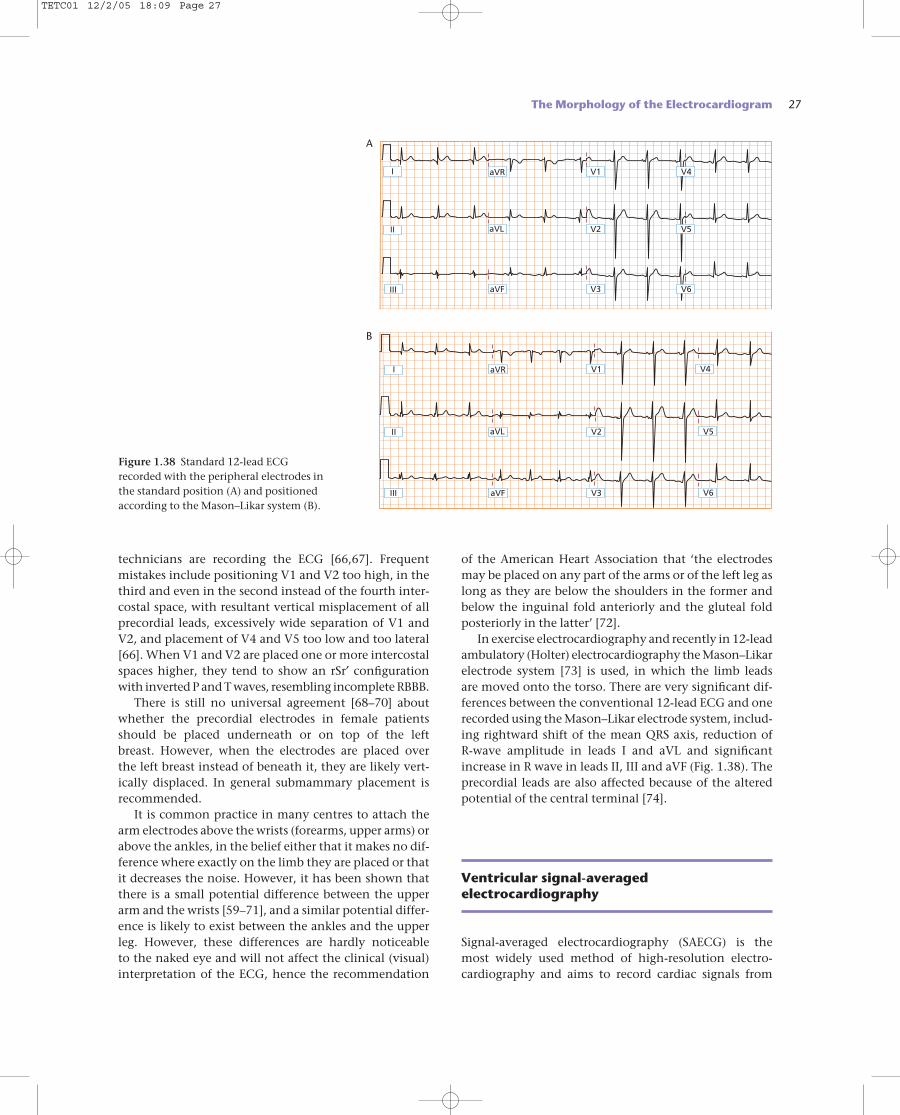
technicians are recording the ECG [66,67]. Frequent mistakes include positioning V1 and V2 too high, in thethird and even in the second instead of the fourth inter-costal space, with resultant vertical misplacement of allprecordial leads, excessively wide separation of V1 andV2, and placement of V4 and V5 too low and too lateral[66]. When V1 and V2 are placed one or more intercostalspaces higher, they tend to show an rSr′ configurationwith inverted P and T waves, resembling incomplete RBBB.
There is still no universal agreement [68–70] aboutwhether the precordial electrodes in female patientsshould be placed underneath or on top of the left breast. However, when the electrodes are placed over the left breast instead of beneath it, they are likely vert-ically displaced. In general submammary placement is recommended.
It is common practice in many centres to attach thearm electrodes above the wrists (forearms, upper arms) orabove the ankles, in the belief either that it makes no dif-ference where exactly on the limb they are placed or thatit decreases the noise. However, it has been shown thatthere is a small potential difference between the upperarm and the wrists [59–71], and a similar potential differ-ence is likely to exist between the ankles and the upperleg. However, these differences are hardly noticeable to the naked eye and will not affect the clinical (visual)interpretation of the ECG, hence the recommendation
of the American Heart Association that ‘the electrodesmay be placed on any part of the arms or of the left leg as long as they are below the shoulders in the former andbelow the inguinal fold anteriorly and the gluteal foldposteriorly in the latter’ [72].
In exercise electrocardiography and recently in 12-leadambulatory (Holter) electrocardiography the Mason–Likarelectrode system [73] is used, in which the limb leads are moved onto the torso. There are very significant dif-ferences between the conventional 12-lead ECG and onerecorded using the Mason–Likar electrode system, includ-ing rightward shift of the mean QRS axis, reduction of R-wave amplitude in leads I and aVL and significantincrease in R wave in leads II, III and aVF (Fig. 1.38). Theprecordial leads are also affected because of the alteredpotential of the central terminal [74].
Ventricular signal-averagedelectrocardiography
Signal-averaged electrocardiography (SAECG) is the most widely used method of high-resolution electro-cardiography and aims to record cardiac signals from
The Morphology of the Electrocardiogram 27
I
II
III
aVR
aVL
aVF
V1
V2
V3
V4
V5
V6
I
II
III
aVR
aVL
aVF
V1
V2
V3
V4
V5
V6
Figure 1.38 Standard 12-lead ECGrecorded with the peripheral electrodes inthe standard position (A) and positionedaccording to the Mason–Likar system (B).
A
B
TETC01 12/2/05 18:09 Page 27
28 Chapter 1
the body surface that are not visible or apparent from thestandard ECG [75]. In its most popular form, ventricularSAECG uses temporal averaging in order to improve thesignal-to-noise ratio and enable the detection of low-amplitude potentials usually outlasting the QRS com-plex (so-called ‘late potentials’) [75–77]. Late potentialson SAECG reflect low-amplitude fractionated electro-grams generated by surviving myocardial fibres within or surrounding regions of myocardial infarction (less frequently by other forms of ischaemic heart disease or other cardiac diseases) that are activated after a delayand thus create a substrate for re-entrant ventriculararrhythmias (Fig. 1.39) [78–80].
The SAECG is recorded using orthogonal bipolar XYZECG leads, which are averaged, filtered and combinedinto a vector magnitude called the filtered QRS complex.The most frequently used time-domain analysis (Fig. 1.39)of the filtered QRS complex includes:1 filtered QRS duration;2 root-mean-square voltage of the terminal 40 ms of
the filtered QRS (RMS40);3 duration that the filtered QRS complex remains
< 40 µV (LAS).The abnormal SAECG recorded with a 40-Hz high-passfilter (i.e. the presence of late potentials) is characterizedby a filtered QRS complex > 114 ms, RMS40 < 20 µV andLAS > 38 ms [76,81], of which the most important is theprolonged filtered QRS duration (Figs 1.40 and 1.41) [82].
The ventricular SAECG is most frequently used inpatients recovering from myocardial infarction. Studiesduring the 1980s showed that late potentials are recordedmuch more frequently (in up to 93%) in patients re-covering from myocardial infarction who develop sus-tained ventricular arrhythmias or sudden cardiac death.Although the presence of late potentials is not a highlyspecific or sensitive marker of sudden cardiac death,
SAECG was considered a useful test, alone or in combina-tion with other risk factors, for prediction of arrhythmicevents in patients recovering from myocardial infarctionbecause of its high (up to 97%) negative predictive valuedespite its very low (about 20%) positive predictive value[75,83].
The widespread use of thrombolysis/revasculariza-tion, beta-blockers and other advances in the treatmentof myocardial infarction during the 1990s considerablydecreased the rate of sudden cardiac death and sustainedventricular arrhythmias [84] and reduced the prevalenceof late potentials following myocardial infarction [85].Recent large studies on patients receiving modern treat-
Figure 1.40 Schematic presentation of the three parametersthat characterize the filtered QRS complex of the ventricularsignal-averaged ECG. Note the low noise level of all threerecordings.
9060300 120
ms
QRSd
40µV
LAS
VRMS
µV
150 210 270 300240180
5 ms 10 ms 10 ms
0.5 mV 0.5 mV 0.5 mV
A B C
Figure 1.39 Development of low-amplitude fractionated electrograms in experimental models of myocardial infarction in caninehearts. Bipolar subepicardial electrograms are shown recorded from (A) a non-infarcted preparation, (B) 5-day-old infarction and (C) 2-month-old infarction. The low-amplitude fractionated electrograms shown in (C) reflect zones of abnormal conduction, whichrepresent a substrate for the development of re-entrant arrhythmias. These can be recorded as late potentials on the signal-averagedECG. Reproduced with permission from Gardner et al. [80].
TETC01 12/2/05 18:09 Page 28
ment after myocardial infarction demonstrated greatlyreduced predictive power of SAECG for sudden cardiacdeath following myocardial infarction [86]. Nonetheless,a recently published substudy of the Multicenter Unsus-tained Tachycardia Trial (MUSTT) [87] demonstrated thatin patients with ischaemic heart disease, left ventricularejection fraction < 40% and non-sustained ventriculartachycardia, a filtered QRS duration > 114 ms was anindependent predictor of cardiac and arrhythmic mortal-ity. Because of its high negative predictive value (> 90%),SAECG is considered useful in the management of patientswith syncope of unknown cause and ischaemic heart disease [75].
The value of SAECG in non-ischaemic cardiac diseasesis less well investigated and established. Late potentialshave been shown to independently predict adverse out-come in patients with non-ischaemic dilated cardio-myopathy in some studies [88] but not in others [89].Although late potentials are more frequently recorded inpatients with hypertrophic cardiomyopathy comparedwith healthy subjects, SAECG does not seem to havepractical value for prediction of arrhythmic events inthese patients [90]. Due to the localized character of the conduction abnormalities, SAECG can be useful as an additional diagnostic test in arrhythmogenic right ventricular cardiomyopathy [91].
In addition to time-domain analysis, other methodsof analysis of the SAECG, such as spectrotemporal analysis [92,93], spectral turbulence analysis [94] and methods of high-resolution electrocardiography not basedon temporal averaging (e.g. spatial averaging, whichenables beat-to-beat analysis of late potentials [95]), havealso been proposed but their clinical applicability is stillunknown.
Atrial signal-averaged electrocardiography
Signal-averaged electrocardiography of the P wave (P-SAECG) was developed during the 1990s [96,97] as aresult of growing awareness of the enormous clinical and socioeconomic significance of atrial fibrillation (AF)and hence of the need for simple and easily applicablemethods for prediction of its occurrence or recurrence.Similarly to ventricular SAECG, the goal of P-SAECG is todetect and quantify intra-atrial conduction defects, oneof the main factors for development of AF, which cannotsimply be discerned from the shape and duration of the P wave on the standard ECG [98,99].
At present, most clinical studies have been performedusing time-domain analysis of the P-SAECG. Similarly toventricular SAECG, the filtered X, Y and Z leads are com-bined into a vector magnitude, and the latter is charac-terized by a set of parameters, such as the filtered P-waveduration, the integral of the P wave and the amplitude(RMS voltage) in different segments (e.g. the last 10, 20 or30 ms) [96].
Several studies have demonstrated that the preoperat-ively assessed P-SAECG (mainly increased signal-averagedP-wave duration) independently predicts occurrence ofAF following coronary artery bypass surgery [100–104].P-SAECG has been shown to be useful for identifyingpatients at risk of transition from paroxysmal to sustainedforms of AF [105], for prediction of AF recurrence aftercardioversion [106,107], for prediction of paroxysmal AF in patients with congestive heart failure [108] and forassessment of antiarrhythmic drug efficacy for prophy-laxis of paroxysmal AF [109].
The Morphology of the Electrocardiogram 29
100
µV
200 mm/s
VM
1000 mm/mV
90
80
70
60
50
40
30
20
10
0
QRS duration = 101 msRMS40 = 65 µVLAS<40 mV = 16 msNoise level = 0.14 µV
100
µV
200 mm/s
VM
1000 mm/mV
90
80
70
60
50
40
30
20
10
0
QRS duration = 136 msRMS40 = 32 µVLAS<40 mV = 31 msNoise level = 0.24 µV
100
µV
200 mm/s
VM
1000 mm/mVA B C
90
80
70
60
50
40
30
20
10
0
QRS duration = 134 msRMS40 = 13 µVLAS<40 mV = 58 msNoise level = 0.24 µV
Figure 1.41 Examples of normal andabnormal ventricular signal-averagedECG (SAECG). (A) Normal SAECG. (B) SAECG recorded in a 67-year-old manwith mild heart failure and no history of arrhythmias. Only the filtered QRSduration is prolonged. (C) A clearlyabnormal SAECG recorded in a man with severe heart failure. Note that allthree parameters of the filtered QRS areabnormal.
TETC01 12/2/05 18:09 Page 29
30 Chapter 1
A limited number of studies suggest that spectral ana-lysis of the P-SAECG can provide additional informationto the standard time-domain methods, but its clinicalvalue is still unknown.
Microvolt T-wave alternans
Visible variations of the shape, amplitude or polarity of the T wave on an alternate-beat basis, described as T-wave alternans, have been recognized as a harbinger ofventricular arrhythmias in many clinical conditions, suchas congenital long QT syndrome, myocardial ischaemia,electrolyte disturbance and toxic myocarditis [110–112].In the 1980s, progress in computerized electrocardiog-raphy and signal processing led to the discovery, androutine clinical assessment, of microvolt (a few milli-seconds) T-wave alternans (MTWA) induced by anincrease in heart rate and invisible to the naked eye [113]. Subsequently, experimental studies demonstratedthat MTWA is caused by non-uniform alterations (sequen-tial shortening and lengthening) of action potentialduration in different parts of the myocardium, whichproduce repolarization gradients that alternate in magni-tude and direction on every other beat and thus createconditions for re-entry [114,115].
The methodology of measurement, the technicalaspects and the interpretation of MTWA tests haverecently been reviewed in detail (Fig. 1.42) [116]. Whilstearly clinical studies used invasive atrial pacing in orderto achieve the necessary increase in heart rate [117], currently MTWA is assessed using bicycle or treadmillexercise. Hohnloser et al. [118] demonstrated that thetwo methods were equivalent, both in terms of averageheart rate at which MTWA becomes detectable and interms of diagnostic yield.
During the last decade, a number of clinical studieshave demonstrated a strong link between abnormalMTWA and arrhythmic events including sudden cardiacdeath in different cardiac patient populations [119,120].Abnormal MTWA has been shown to strongly predictinducibility of ventricular tachycardia or ventricularfibrillation during electrophysiological study [121,122]and all-cause mortality [123] or arrhythmic events inpatients recovering after myocardial infarction [124,125]and in those with dilated cardiomyopathy [126,127],Brugada’s syndrome [128], non-ischaemic cardiomyop-athy [129] or heart failure [130].
Three recent studies have demonstrated that MTWAtesting can identify patients at high risk of arrhythmic
death who might benefit from an implantable cardioverter-defibrillator (ICD) within the population of patients withleft ventricular dysfunction after myocardial infarction(MADIT II type patients). In a meta-analysis of patientsdrawn from two previously published prospective stud-ies on MTWA, Hohnloser et al. [131] reported a 15.6%rate of cardiac arrest or sudden cardiac death during a follow-up of 24 months in patients who tested positive orindeterminate (non-negative) for MTWA compared withno events in MTWA-negative patients (P = 0.02). Chow et al. [132] followed up similar patients for 18 months andreported an 11.8% rate of arrhythmic events (arrhythmicdeath, resuscitated cardiac arrest, or appropriate ICD dis-charge) among MTWA-positive patients compared with2.0% among those who were MTWA negative (relativerisk 6.0, P = 0.035). Bloomfield et al. [133] reported thatthe actuarial 2-year all-cause mortality rate of patientswith abnormal (positive or indeterminate) MTWA was17.8% compared with 3.2% of patients with negativeMTWA (hazard ratio 4.8, P = 0.02). The mortality rate ofpatients with negative MTWA was only 3.8% (3.5% false-negative tests), which suggests that the test could be usedfor identifying MADIT II type patients who are at lowarrhythmic risk and unlikely to benefit from an ICD.
120
140
160
180
200
6040200 80Beat number
T-w
ave
leve
l (µV
2 )
100 120100
Time series
10
20
30
40
50
35255 45Frequency (cycles/beat)
Spec
trum
(µV
2 )
55 650
Spectrum
FFT
ECG
128 beats
Figure 1.42 Principles of spectral analysis of microvolt T-wavealternans. The amplitudes of the T waves of 128 consecutivebeats are measured and a time series consisting of these 128amplitudes is constructed. The power spectrum of this timeseries is computed using fast Fourier transform (FFT) analysis.In the power spectrum obtained from recordings during bicycleexercise, peaks corresponding to frequencies of respiration,pedalling and alternans are shown. Microvolt T-wave alternansappears as a peak at half the beat frequency (0.5 cycles/beat).The amplitude of this peak is compared with the mean andstandard deviation of the spectrum in a reference ‘noise band’.Reprinted with permission from Cohen RJ. TWA and Laplacianimaging. In: Zipes DP, Jalife J (eds) Cardiac Electrophysiology:From Cell to Bedside, 2000. Philadelphia: WB Saunders, pp. 781–789.
TETC01 12/2/05 18:09 Page 30
References
1 Bayés de Luna A. Clinical Electrocardiography: A Textbook,2nd edn, 1999. New York: Futura.
2 Cranefield PF. The Conduction of the Cardiac Impulse, 1975.Mount Kisco, NY: Future.
3 Grant RP. Clinical Electrocardiography: The Spatial VectorApproach, 1957. New York: McGraw Hill.
4 McFarlane P, Veitch Lawrie TD (eds) ComprehensiveElectrocardiography, 1989. Oxford: Pergamon Press.
5 Surawicz B (ed.). Chou’s Electrocardiography in ClinicalPractice, 5th edn, 1996. Philadelphia: WB Saunders.
6 Sodi D, Bisteni A, Medrano G. Electrocardiografía yVectorcardiografía Deductivas, Vol. I, 1964. México DF: La Prensa Médica Mexicana.
7 Malik M, Camm AJ (eds) Dynamic Electrocardiography,2004. Oxford: Blackwell Publishing.
8 Moss AJ. Long QT syndrome. JAMA 2003; 289: 2041–2044.9 Yap YG, Camm AJ. Drug induced QT prolongation and
torsades de pointes. Heart 2003; 89: 1363–1372.10 Gaita F, Giustetto C, Bianchi F et al. Short QT syndrome:
a familial cause of sudden death. Circulation 2003; 108:965–970.
11 Durrer D, Van Dam R, Freud G, Janse M, Meijler F,Arzbaecher R. Total excitation of the isolated humanheart. Circulation 1970; 41: 899–912.
12 Bayés de Luna A, Fort de Ribot R, Trilla E et al.Electrocardiographic and vectrocardiographic study ofinteratrial conduction disturbances with left atrialretrograde activation. J Electrocardiol 1985; 18: 1–13.
13 Bayés de Luna A, Cladellas M, Oter R et al. Interatrialconduction block and retrograde activation of the left atrium and paroxysmal supraventriculartachyarrhythmias. Eur Heart J 1988; 9: 1112–1118.
14 Wagner GS (ed.) Marriot’s Practical Electrocardiography,10th edn, 2001. Philadelphia: Lippincott Williams &Wilkins.
15 Horan LG, Flowers NC. ECG and VCG. In: Braunwald E(ed.). Heart Disease, 1980. Philadelphia: WB Saunders.
16 Bayés de Luna A, Carrio I, Subirana MT et al.Electrophysiological mechanism of the SISIISIII
electrocardiographic morphology. J Electrocardiol 1987;20: 38.
17 Bayés de Luna A, Serra Genís C, Guix M. Septal fibrosis asdeterminant of Q waves in patients with aortic valvedisease. Eur Heart J 1983; 4 (suppl. E): 86.
18 Piccolo E, Raviele A, Delise P et al. The role of leftventricular conduction in the electrogenesis of leftventricular hypertrophy. An electrophysiologic study inman. Circulation 1979; 59: 1044–1055.
19 Rosenbaum MB, Elizari MV, Lazzari JO. Los Hemibloqueos,1968. Buenos Aires: Ed. Paidos.
20 Wolff L, Parkinson J, White DD. Bundle branch block with short PR interval in healthy young people prone toparoxysmal tachycardia. Am Heart J 1930; 5: 685.
21 Lown B, Ganong WF, Levine SA. The syndrome of shortPR interval, normal QRS complex and paroxysmal rapidheart beat. Circulation 1957; 5: 693–706.
22 Sternick EB, Timmermans C, Sosa E et al. Theelectrocardiogram during sinus rhythm and tachycardiain patients with Mahaim fibers. J Am Coll Cardiol 2004; 44: 1626–1635.
23 Montoya PT, Brugada P, Smeets J et al. Ventricularfibrillation in the Wolff–Parkinson–White syndrome. Eur Heart J 1991; 12: 144–150.
24 Wellens HJ, Atie J, Smeets JL, Cruz FE, Gorgels AP, BrugadaP. The ECG in patients with multiple accessory pathways. J Am Coll Cardiol 1990; 16: 745–751.
25 Milstein S, Sharma AD, Guiraudon GM, Klein GJ. Analgorithm for the electrocardiographic localization of
The Morphology of the Electrocardiogram 31
It is said by some that the 12-lead ECG could be reducedto a report and the trace itself omitted. For example, in many hospitals it is customary to receive nuclearscintigram reports and even radiography reportswithout copies of the images themselves. Theseexperiences naturally frustrate most cardiologists, whowould like to see the ‘raw data’ on which others havecommented in order that they can make decisionsrelevant to the life and livelihood of their patients.Analysing the ECG or other images, especially asmedical informatics and information technologyimproves, should not be a technical problem and thecardiologist should insist upon this. Examining thequality of the image, assessing the accuracy andconfidence of the report, and assembling multiple
images, technical information and patients’ details arecrucial to modern medicine.
Although electrocardiography is a well-establishedtechnique, the refinement of computer interpretationalgorithms, improvements in recording technology andthe development of completely new techniques (such asT-wave alternans, implantable ECG rhythm and ST-segment surveillance and logging, and very long-termwearable monitoring systems) will continue to evolve.High-resolution electrocardiography, for detecting earlydisease, discerning the effects of medications on theECG and the prediction of electrical instability of theheart, will continue to develop. Web-based, ECG-related, patient-accessed systems will become morepopular world-wide.
Personal perspective
TETC01 12/2/05 18:09 Page 31
32 Chapter 1
accessory pathways in the Wolff–Parkinson–Whitesyndrome. Pacing Clin Electrophysiol 1987; 10: 555–563.
26 Hathaway WR, Peterson ED, Wagner GS et al. Prognosticsignificance of the initial electrocardiogram in patientswith acute myocardial infarction. GUSTO-I Investigators.Global Utilization of Streptokinase and t-PA for OccludedCoronary Arteries. JAMA 1998; 279: 38–91.
27 Wellens HJ, Gorgels A, Doevendans PA. The ECG in AcuteMyocardial Infarction and Unstable Angina, 2003. Boston:Kluwer Academic Publishers.
28 Engelen DJ, Gorgels AP, Cheriex EC et al. Value ofelectrocardiogram in localizing the occlusion site in theleft anterior descending coronary artery in acute anteriormyocardial infarction. J Am Coll Cardiol 1999; 34:389–395.
29 Sclarowsky S. Electrocardiography of Acute MyocardialIschemia, 1999. London: Martin Dunitz.
30 Fiol M, Cygankiewicz I, Guindo J et al. Evolvingmyocardial infarction with ST elevation: ups and downs of ST in different leads identifies the culprit artery andlocation of the occlusion. Ann Noninvasive Electrocardiol2004; 9: 180–186.
31 Fiol M, Cygankiewicz I, Bayés Genis A et al. The value ofECG algorithm based on ‘ups and downs’ of ST inassessment of a culprit artery in evolving inferiormyocardial infarction. Am J Cardiol 2004; 94: 709–714.
32 Fiol M, Carillo A, Cygankiewicz I et al. New criteria basedon ST changes in 12 leads surface ECG to detect proximalvs. distal right coronary artery occlusion in case of anacute inferoposterior myocardial infarction. AnnNoninvasive Electrocardiol 2004; 9: 383–389.
33 Sadanandan S, Hochman S, Kolodziej A et al. Clinical andangiographic characteristics of patients with combinedanterior and inferior ST segment elevation in the initialECG during acute myocardial infarction. Am Heart J 2003;146: 653–661.
34 Yamaji H, Iwasaki K, Kusachi S et al. Prediction of acuteleft main coronary artery obstruction by 12 leadelectrocardiography. ST segment elevation in lead VR with less ST segment elevation in lead V1. J Am CollCardiol 2001; 48: 1348–1354.
35 Nikus KC, Escola MJ, Virtanen VK et al. ST depression with negative T waves in leads V4–V5: a marker of a severe coronary artery disease in non-ST elevation acutecoronary syndrome: a prospective study of angina at rest with troponin, clinical, electrocardiographic, andangiographic correlation. Ann Noninvasive Electrocardiol2004; 9: 207–214.
36 Bayés de Luna A, Carreras F, Cladellas M, Oca F, Sagues F, Garcia Moll M. Holter ECG study of theelectrocardiographic phenomena in Prinzmetal angina attacks with emphasis on the study of ventricular arrhythmias. J Electrocardiol 1985; 18: 267–275.
37 European Society of Cardiology/American College of Cardiology. Myocardial infarction redefined: aconsensus document of the Joint European Society ofCardiology/American College of Cardiology Committee
for the redefinition of myocardial infarction. Eur Heart J2000; 21: 1502–1513.
38 Wagner GS, Bahit MC, Criger D et al. Toward a newdefinition of acute myocardial infarction for the 21stcentury: status of the ESC/ACC consensus conference. J Electrocardiol 2000; 33 (suppl.): 57–59.
39 Phibbs B, Marcus F, Marriott HJ, Moss A, Spodick DH. Q-wave versus non-Q wave myocardial infarction: ameaningless distinction. J Am Coll Cardiol 1999; 33:576–582.
40 Moon JCC, Perez de Arenaza P, Elkington AG et al. Thepathologic basis of Q wave and non-Q wave myocardialinfarction. A cardiovascular magnetic resonance study. J Am Coll Cardiol 2004; 44: 554–560.
41 Myers GB, Klein HA, Stofer BE. Correlation of ECGfindings in anteroseptal infarction. Am Heart J 1948; 36: 535.
42 Bogaty P, Boyer L, Rousseau L, Arsenault M. Isanteroseptal myocardial infarction an appropriate term?Am J Med 2002; 113: 37–41.
43 Selvanayagam JB, Kardos A, Nicolson D et al. Anteroseptaland apical myocardial infarction: a controversy addressedusing delayed enhancement cardiovascular magneticresonance imaging. J Cardiovasc Magn Reson 2004; 6:653–661.
44 Cerqueira MD, Weissman NJ, Disizian V et al. Standarized myocardial segmentation and nomenclaturefor tomographic imaging of the heart. A statement forhealthcare professionals from the Cardiac ImagingCommittee of the Council on Clinical Cardiology of theAmerican Heart Association. Circulation 2002; 105:539–542.
45 Bayés de Luna A, Cino J, Pujadas S et al. Concordance ofelectrocardiographic patterns and healed myocardialinfarction location detected by cardiovascular magneticresonance. Am J Cardiol 2006 (in press).
46 Cino JM, Pujadas S, Carreras F et al. Utility of contrast-enhanced cardiovascular magnetic resonance (CE-CMR)to assess the sensitivity and specificity of different ECGpatterns to locate Q-wave myocardial infarction. J Cardiovasc Magn Reson 2005 (in press).
47 Selvester RH, Wagner GS, Hindman NB. The Selvester QRS scoring system for estimating myocardial infarctionsize: the development and application of the system. Arch Intern Med 1985; 145: 1877–1881.
48 Engblom H, Wagner GS, Sester RM et al. Quantitativeclinical assessment of chronic anterior myocardialinfarction with delayed enhancement magnetic resonance imaging and QRS scoring. Am Heart J 2003; 146: 359–366.
49 Marcassa C, Galli M, Paino A, Campini R, Giubbini R,Giannuzzi P. Electrocardiographic evolution after Q waveanterior myocardial infarction: correlations between QRS score and changes in left ventricular perfusion andfunction. J Nucl Cardiol 2001; 8: 561–567.
50 Sgarbossa EB, Pinski SL, Barbagelata A et al.Electrocardiographic diagnosis of evolving acutemyocardial infarction in the presence of left bundle-
TETC01 12/2/05 18:09 Page 32
branch block. GUSTO-1 (Global Utilization ofStreptokinase and Tissue Plasminogen Activator forOccluded Coronary Arteries) Investigators. N Engl J Med1996; 334: 481.
51 Wackers F, Lie KL, David G, Durrer D, Wellens HJJ.Assessment of the value of the ECG signs for myocardialinfarction in left bundle branch block by thallium. Am J Cardiol 1978; 41: 428.
52 Sgarbossa E, Pinski S, Gates K, Wagner G. Early ECGdiagnosis of acute myocardial infarction in the presence of ventricular paced rhythm. Am J Cardiol 1996; 77:423–424.
53 Akurisu S, Sato H, Kawagoe T et al. Left ventriculardysfunction with ST elevation: a novel cardiac syndromemimicking acute myocardial infarction. Am Heart J 2002;143: 448–455.
54 Breithardt G, Cain ME, El-Sherif N et al. Standards for analysis of ventricular late potentials using highresolution or signal-averaged electrocardiography. A statement by a Task Force Committee between theEuropean Society of Cardiology, the American HeartAssociation and the American College of Cardiology. Eur Heart J 1991; 12: 473–480.
55 Kulakowski P. Ventricular signal averagedelectrocardiography. In: Malik M (ed.). Risk of Arrhythmiaand Sudden Death, 2001. London: BMJ Books, pp. 167–179.
56 Michelucci A, Padeletti L, Colella A et al. Signal averaged Pwave. In: Malik M (ed.). Risk of Arrhythmia and SuddenDeath, 2001. London: BMJ Books, pp. 180–186.
57 Verrier RL, Nearing BD, Stone PH. Optimizing ambulatoryECG monitoring of T-wave alternans for arrhythmia riskassessment. Card Electrophysiol Rev 2002; 6: 329–333.
58 Surawicz B, Knilans TK. Misplacement of leads andelectrocardiographic artifacts. In: Surawicz B, Knilans TK(eds). Chou’s Electrocardiography in Clinical Practice, 5th edn, 1996. Philadelphia: WB Saunders, pp. 569–582.
59 Macfarlane PW, Coleman EN. Resting 12-lead ECGelectrode placement and associated problems. Available at http://www.scst.org.uk/coleman/resting.htm
60 Wagner GS. Correct and incorrect lead placement. In:Wagner GS (ed.). Marriot’s Practical Electrocardiography,10th edn, 2001. Philadelphia: Lippincott Williams &Wilkins, pp. 33–34.
61 Haisty WK, Pahlm O, Edenbrandt L, Newman K.Recognition of electrocardiographic electrodemisplacements involving the ground (right leg) electrode.Am J Cardiol 1993; 71: 1490–1495.
62 Rauraharju PM, Park L, Rautaharju FS, Crow R. Astandardized procedure for locating and documentingECG chest electrode positions. Consideration of the effect of breast tissue on ECG amplitudes in women. J Electrocardiol 1998; 31: 17–29.
63 August T, Mazzeleni A, Wolff L. Positional and respiratorychanges in precordial lead patterns simulating acutemyocardial infarction. Am Heart J 1958; 55: 706–714.
64 Zema MJ, Luminais SK, Chiaramida S et al.Electrocardiographic poor R wave progression III: thenormal variant. J Electrocardiol 1980; 13: 135–142.
65 Herman MV, Ingram DA, Levy JA et al. Variability ofelectrocardiographic precordial lead placement: a methodto improve accuracy and reliability. Clin Cardiol 1991; 14: 469–476.
66 Kerwin A J, McLean R, Tegelaar H. A method for theaccurate placement of chest electrodes in the taking ofserial electrocardiographic tracings. Can Med Assoc J 1960; 82: 258–261.
67 Wenger W, Kligfield P. Variability of precordial electrode placement during routine electrocardiography. J Electrocardiol 1996; 29: 179–184.
68 Society for Cardiological Science and Technology. Clinical Guidelines by Consensus. Number 1. Recording a standard 12-lead electrocardiogram. Available athttp://www.scst.org.uk/docs/Consensus%20guidelines%20for%20recording%20a%2012%20lead%20ECG.pdf.Accessed on 16 June 2005.
69 Colaco R, Reay P, Beckett C, Aitchison TC, MacfarlanePW. False positive ECG reports of anterior myocardialinfarction in women. J Electrocardiol 2000; 33: 239–244.
70 Macfarlane PW, Colaco R, Stevens K, Reay P, Beckett C,Aitchison T. Precordial electrode placement in women.Neth Heart J 2003; 11: 118–122.
71 Pahlm O, Halsty WK, Edenbrandt L et al. Evaluation ofchange in standard electrocardiographic QRS waveformsrecorded from activity-compatible proximal limb leadpositions. Am J Cardiol 1992; 69: 253–257.
72 Pipberger HV, Arzbaecher RC, Berson AS et al. Report ofthe Committee on Electrocardiography of the AmericanHeart Association. Recommendations for standardizationof leads and of specifications for instruments inelectrocardiography and vectorcardiography. Circulation1975; 52: 11–31.
73 Mason RE, Likar I. A new system of multi-lead exerciseelectrocardiography. Am Heart J 1966; 71: 196–205.
74 Papaouchado M, Walker PR, James MA, Clarke LM.Fundamental differences between the standard 12-leadelectrocardiograph and the modified (Mason–Likar)exercise lead system. Eur Heart J 1987; 8: 725–733.
75 Berbari EJ. High-resolution electrocardiography. In: ZipesDP, Jalife J (eds). Cardiac Electrophysiology: From Cell toBedside, 4th edn, 2004. Philadelphia: WB Saunders,Elsevier, pp. 793–802.
76 Breithardt G, Cain ME, El-Sherif N et al. Standards foranalysis of ventricular late potentials using highresolution electrocardiography. A statement by a TaskForce Committee between the European Society ofCardiology, the American Heart Association and theAmerican College of Cardiology. J Am Coll Cardiol 1991;17: 999–1006.
77 Lander P, Berbari EJ. Principles and signal-processingtechniques of the high-resolution electrocardiogram. Prog Cardiovasc Dis 1992; 35: 169–188.
78 Boineau JP, Cox JL. Slow ventricular activation in acutemyocardial infarction. A source of re-entrant prematureventricular contraction. Circulation 1973; 48: 702–713.
79 El-Sherif N. Electrophysiologic basis of ventricular latepotentials. Prog Cardiovasc Dis 1993; 35: 417–427.
The Morphology of the Electrocardiogram 33
TETC01 12/2/05 18:09 Page 33
34 Chapter 1
80 Gardner PI, Ursell PC, Fenoglio JJ, Wit AL.Electrophysiologic and anatomic basis for fractionatedelectrograms recorded from healed myocardial infarcts.Circulation 1985; 72: 596–611.
81 ACC Expert Consensus Document. Signal-averagedelectrocardiography. J Am Coll Cardiol 1996; 27: 238–249.
82 Savard P, Rouleau JL, Ferguson J et al. Risk stratificationafter myocardial infarction using signal-averagedelectrocardiographic criteria adjusted for sex, age andmyocardial infarction. Circulation 1997; 96: 202–213.
83 Kulakowski P. Clinical utility of signal-averagedelectrocardiography. Card Electrophysiol Rev 1997; 3: 321–324.
84 Huikuri HV, Tapanainen JM, Lindgren K et al. Predictionof sudden cardiac death after myocardial infarction in thebeta-blocking era. J Am Coll Cardiol 2003; 42: 652–658.
85 Beauregard LA, Waxman HL, Volosin R, Volosin KJ,Kurnik PB. Signal averaged ECG prior to and serially afterthrombolytic therapy for acute myocardial infarction.Pacing Clin Electrophysiol 1996; 19: 883–889.
86 Bauer A, Guzik P, Barthel P et al. Reduced prognostic powerof ventricular late potentials in post-infarction patients ofthe reperfusion era. Eur Heart J 2005; 26: 755–761.
87 Gomes JA, Cain ME, Buxton AE et al. Prediction of long-term outcomes by signal-averaged electrocardiography in patients with unsustained ventricular tachycardia,coronary artery disease, and left ventricular dysfunction.Circulation 2001; 104: 436–441.
88 Mancini DM, Wong KL, Simson MB. Prognostic value ofan abnormal signal-averaged electrocardiogram inpatients with non-ischemic congestive cardiomyopathy.Circulation 1993; 87: 1083–1092.
89 Middlekauff HR, Stevenson WG, Woo MA et al.Comparison of frequency of late potentials in idiopathicdilated cardiomyopathy and ischemic cardiomyopathywith advanced congestive heart failure and theirusefulness in predicting sudden death. Am J Cardiol 1990; 66: 1113–1117.
90 Fauchier J-P, Fauchier L, Babuty D, Cosnay P. Time-domain signal-averaged electrocardiogram innonischemic ventricular tachycardia. Pacing ClinElectrophysiol 1996; 19: 231–244.
91 Hamid MS, Norman M, Quraishi A et al. Prospectiveevaluation of relatives for familial arrhythmogenic rightventricular cardiomyopathy/dysplasia reveals a need tobroaden diagnostic criteria. J Am Coll Cardiol 2002; 40:1445–1450.
92 Zbilut JP, Buckingham TA. Overview of frequency–time(spectro-temporal) analysis of signal-averagedelectrocardiograms. Prog Cardiovasc Dis 1993; 35: 429–434.
93 Cain ME, Ambos HD, Lindsay BD, Arthur RM.Contributions of frequency analysis to the identificationof the spectral, temporal, and spatial features in signal-averaged electrograms that distinguish patients prone tosustained ventricular arrhythmias. Prog Cardiovasc Dis1992; 35: 189–212.
94 Copie X, Hnatkova K, Staunton A, Camm AJ, Malik M.Spectral turbulence versus time-domain analysis of
signal-averaged ECG used for the prediction of differentarrhythmic events in survivors of acute myocardialinfarction. J Cardiovasc Electrophysiol 1996; 7: 583–593.
95 El-Sherif N, Mehra R, Restivo M. Beat-to-beat highresolution electrocardiogram: technical and clinicalaspects. Prog Cardiovasc Dis 1993; 35: 407–415.
96 Stafford PJ, Turner I, Vincent R. Quantitative analysis ofsignal-averaged P waves in idiopathic paroxysmal atrialfibrillation. Am J Cardiol 1991; 68: 751–755.
97 Guidera SA, Steinberg JS. The signal-averaged P waveduration: a rapid non-invasive marker of risk for atrialfibrillation. J Am Coll Cardiol 1993; 21: 1645–1651.
98 Jordaens L, Tavernier R, Gorgov N et al. Signal-averaged Pwave: predictor of atrial fibrillation. J CardiovascElectrophysiol 1998; 9 (suppl. 8): S30–S34.
99 Darbar D, Jahangir A, Hammill SC, Gersh BJ. P wavesignal-averaged electrocardiography to identify risk foratrial fibrillation. Pacing Clin Electrophysiol 2002; 25:1447–1453.
100 Stafford PJ, Kolvekar S, Cooper J et al. Signal averaged Pwave compared with standard electrocardiography orechocardiography for prediction of atrial fibrillation aftercoronary bypass grafting. Heart 1997; 77: 417–422.
101 Steinberg JS, Zelenkofske S, Wong S-C, Gelernt M, SciaccaR, Menchavez E. Value of the P-wave signal-averaged ECG for predicting atrial fibrillation after cardiac surgery.Circulation 1993; 88: 2618–2622.
102 Klein M, Evans SJ, Blumberg S, Cataldo L, BodeheimerMM. Use of P-wave-triggered, P-wave-signal-averagedelectrocardiogram to predict atrial fibrillation aftercoronary bypass surgery. Am Heart J 1995; 129: 895–901.
103 Zaman AG, Archbold RA, Helft G et al. Atrial fibrillationafter coronary artery bypass surgery: a model forpreoperative risk stratification. Circulation 2000; 101:1403–1408.
104 Yi Gang, Hnatkova K, Mandal K, Ghuran A, Malik M.Preoperative electrocardiographic risk assessment of atrial fibrillation after coronary artery bypass grafting. J Cardiovasc Electrophysiol 2004; 15: 1379–1386.
105 Abe Y, Fukunami M, Yamada T et al. Prediction oftransition to chronic atrial fibrillation in patients withparoxysmal atrial fibrillation by signal-averagedelectrocardiography. A prospective study. Circulation1997; 96: 2612–2616.
106 Raitt MH, Thurman M, Ingram KD. P wave durationpredicts the risk of early recurrence of atrial fibrillationafter cardioversion. J Am Coll Cardiol 1999; 33: 143A.
107 Opolski G, Scislo P, Stanislawska J, Gorecki A, SteckiewiczR, Torbicki A. Detection of patients at risk for recurrenceof atrial fibrillation after successful electrical cardioversionby signal-averaged P-wave. Int J Cardiol 1997; 602:181–185.
108 Yamada T, Fukunami M, Shimonagat T et al. Prediction ofparoxysmal atrial fibrillation in patients with congestiveheart failure: a prospective study. J Am Coll Cardiol 2000;35: 405–413.
109 Banasiak W, Telichowski A, Anker SD et al. Effects ofamiodarone on the P-wave triggered signal-averaged
TETC01 12/2/05 18:09 Page 34
electrocardiogram in patients with paroxysmal atrialfibrillation and coronary artery disease. Am J Cardiol 1999;83: 112–114.
110 Hering HE. Das Wesen des Herzalternans. Muench MedWochenschr 1908; 4: 1417–1421.
111 Surawicz B, Fisch C. Cardiac alternans: diversemechanisms and clinical manifestations. J Am Coll Cardiol1992; 20: 483–499.
112 Lux RL, Brockmeier K. Macro T wave alternans. In: Malik M, Camm AJ (eds). Dynamic Electrocardiography,2004. New York: Blackwell Publishing, Futura, pp. 433–438.
113 Adam DR, Powell AO, Gordon H, Cohen RJ. Ventricularfibrillation and fluctuations in the magnitude of the repolarization vector. IEEE Comp Cardiol 1982;241–244.
114 Pastore JM, Girouard SD, Laurita KR et al. Mechanismlinking T-wave alternans to the genesis of cardiacfibrillation. Circulation 1999; 99: 1385–1394.
115 Pastore JM, Rosenbaum DS. Role of structural barriers inthe mechanism of alternans-induced reentry. Circ Res2000; 87: 1157–1163.
116 Bloomfield DM, Hohnloser SH, Cohen RJ. Interpretationand classification of microvolt T wave alternans tests.J Cardiovasc Electrophysiol 2002; 13: 502–512.
117 Rosenbaum DS, Jackson LE, Smith JM et al. Electricalalternans and vulnerability to ventricular arrhythmias. N Engl J Med 1994; 330: 235–241.
118 Hohnloser SH, Klingenheben T, Zabel M et al. T wavealternans during exercise and atrial pacing in humans. J Cardiovasc Electrophysiol 1997; 8: 987–993.
119 Armoundas AA, Tomaselli GF, Esperer HD.Pathophysiological basis and clinical application of T-wave alternans. J Am Coll Cardiol 2002; 40: 207–217.
120 Hohnsloser SH. T-wave alternans. In: Zipes DP, Jalife J(eds). Cardiac Electrophysiology: From Cell to Bedside, 4th edn, 2004. Philadelphia: WB Saunders, Elsevier, pp. 839–847.
121 Gold MR, Bloomfield DM, Anderson KP et al. Acomparison of T wave alternans, signal-averagedelectrocardiography and programmed ventricularstimulation for arrhythmia risk stratification. J Am CollCardiol 2000; 36: 2247–2253.
122 Estes NA III, Michaud G, Zipes DP et al. Electrical alternansduring rest and exercise as predictors of vulnerability to ventricular arrhythmias. Am J Cardiol 1997; 80:1314–1318.
123 Tapanainen JM, Still AM, Airaksinen KEJ, Huikuri HV.Prognostic significance of risk stratifiers of mortality,including T wave alternans, after acute myocardialinfarction: results of a prospective follow-up study. J Cardiovasc Electrophysiol 2001; 12: 645–652.
124 Kitamura H, Ohnishi Y, Okajima K et al. Onset heart rateof microvolt-level T-wave alternans provides clinical andprognostic value in nonischemic dilated cardiomyopathy.J Am Coll Cardiol 2002; 39: 295–300.
125 Ikeda T, Saito H, Tanno K et al. T-wave alternans as apredictor for sudden cardiac death after myocardialinfarction. Am J Cardiol 2002; 89: 79–82.
126 Adachi K, Ohnishi Y, Shima T et al. Determinant ofmicrovolt T-wave alternans in patients with dilatedcardiomyopathy. J Am Coll Cardiol 1999; 34: 374–380.
127 Hohnloser SH, Klingenheben T, Bloomfield D et al.Usefulness of microvolt T wave alternans for prediction of ventricular tachyarrhythmic events in patients withdilated cardiomyopathy: results from a prospectiveobservational study. J Am Coll Cardiol 2003; 41:2220–2224.
128 Ikeda T, Sakurada H, Sakabe K et al. Assessment of non-invasive markers in identifying patients at risk in the Brugada syndrome: insight into risk stratification. J Am Coll Cardiol 2001; 37: 1628–1634.
129 Hennersdorf MG, Perings C, Niebch V, Vester EG, StrauerBE. T wave alternans as a risk predictor in patients withcardiomyopathy and mild-to-moderate heart failure.Pacing Clin Electrophysiol 2000; 23: 1386–1391.
130 Klingenheben T, Zabel M, D’Agostino RB, Cohen RJ,Hohnloser SH. Predictive value of T-wave alternans forarrhythmic events in patients with congestive heartfailure (letter). Lancet 2000; 356: 651–652.
131 Hohnloser SH, Ikeda T, Bloomfield DM, Dabbous OH,Cohen RJ. T-wave alternans negative coronary patientswith low ejection and benefit from defibrillatorimplantation. Lancet 2003; 362: 125–126.
132 Chow T, Schloss E, Waller T et al. Microvolt T-wavealternans identifies MADIT II type patients at low risk ofventricular tachyarrhythmic events (abstract). Circulation2003; 108: IV-323.
133 Bloomfield DM, Steinman RC, Namerow PB et al. MicrovoltT-wave alternans distinguishes between patients likelyand patients not likely to benefit from implanted cardiacdefibrillator therapy: a solution to the MulticenterAutomatic Defibrillator Implantation Trial (MADIT) IIconundrum. Circulation 2004; 110: 1885–1889.
The Morphology of the Electrocardiogram 35
TETC01 12/2/05 18:09 Page 35
TETC01 12/2/05 18:09 Page 36