eCF Work Values Inventory - eCareerFit.cominfo.ecareerfit.com/eCareerFit/eCF Values Technical Manual...
28
©2007 eCareerFit.com, All Rights Reserved 5263 Wynterhall Way, Suite 201, Atlanta, GA 30338 770-396-7463 eCF Work Values Inventory TECHNICAL MANUAL July 2007 by John W. Lounsbury, Ph.D. eCareerFit.com, Chairman, Intellectual Property, Licensed Industrial Psychologist & Fellow in American Psychological Association Lucy W. Gibson, Ph.D., Licensed Industrial Psychologist Adam W Drost, eCareerFit.Com, President
Transcript of eCF Work Values Inventory - eCareerFit.cominfo.ecareerfit.com/eCareerFit/eCF Values Technical Manual...

©2007 eCareerFit.com, All Rights Reserved 5263 Wynterhall Way, Suite 201, Atlanta, GA 30338 770-396-7463
eCF Work Values Inventory
TECHNICAL MANUAL
July 2007
by
John W. Lounsbury, Ph.D. eCareerFit.com, Chairman, Intellectual Property,
Licensed Industrial Psychologist & Fellow in American Psychological Association Lucy W. Gibson, Ph.D., Licensed Industrial Psychologist
Adam W Drost, eCareerFit.Com, President

eCareerFit Work Values Technical Manual v3.1 2
©2007 eCareerFit.com All Rights Reserved
eCareerFit.com Work Values Inventory Technical Manual
Table of Contents
Overview ..................................................................................................................... 3 Background and Development.................................................................................... 3 Internal Consistency Reliability eCF Work Values Inventory ...................................... 4 Standard Error of Measurement.................................................................................. 4 Norms.......................................................................................................................... 5 Means & Standard Deviations for the Work Values Scales ........................................ 6 Normative Comparisons and Within-Person Comparisons......................................... 7 Construct Validity ........................................................................................................ 7
Table 1: Coefficient Alphas for Work Values Scales................................................. 4 Table 2: Means and Standard Deviations for the Work Values Scales .................... 6 Table 3: Work Values Correlations with Selected Variables..................................... 7 Table 4: Correlations with Job, Career, & Life Satisfaction....................................... 8 Table 5: Correlations with PSI Personality Traits (Part 1)......................................... 9 Table 6: Correlations with PSI Personality Traits (Part 2)......................................... 10 Table 7: Correlations with NEO Big Five Traits ........................................................ 11 Table 8: Correlations with 16PF Dimensions (Part 1)............................................... 12 Table 9: Correlations with 16PF Dimensions (Part 2)............................................... 13 Table 10: Correlations with Myers-Briggs Dimensions ............................................... 14 Table 11: Correlations with Personal Orientation Inventory (Part 1) .......................... 15 Table 12: Correlations with Personal Orientation Inventory (Part 2) .......................... 16 Table 13: Correlations with the Strong Interest Inventory .......................................... 17 Graph 1: Mean Score for Income Value Across Four Industries ............................... 18 Graph 2: Mean Score for Achievement Value Across Three Industries .................... 19 Graph 3: Mean Score for Social Responsibility Value Across Four Industries .......... 20 Graph 4: Mean Score for Achievement Value Across Four Industries ...................... 21 Graph 5: Mean Score for Autonomy Value Across Four Industries........................... 22 Graph 6: Mean Score for Creativity Value Across Three Industries .......................... 23 Graph 7: Mean Score for Integrity Value Across Four Industries .............................. 24 Graph 8: Mean Score for Leadership Value Across Three Industries ....................... 25 Graph 9: Mean Score for Power Value Across Three Industries............................... 26 Graph 10:Mean Score for Teamwork Value Across Three Industries ........................ 27

eCareerFit Work Values Technical Manual v3.1 3
©2007 eCareerFit.com All Rights Reserved
Technical Manual for the eCareerFit.com Work Values Inventory
Overview
This technical report summarizes the background, development, and current data on psychometric properties of the eCF® Work Values Inventory, including reliability, construct validity, norming, mean scores and standard deviations, differences by occupations, and interpretation of results. Background and Development The eCF
® Work Values Inventory represents an on-line assessment of personal work values or
enduring, fundamental priorities and standards for meaning and significance in the world of work and other parts of life. To identify the work values for our measure, we surveyed the work values measures from a number of other work values inventories and taxonomies, including Super’s well-known, internationally-developed, work values scales (Super & Sverko, 1995), work values for the government of the United Kingdom, work values listed by the U. S. Dept. of Labor’s Occupational Network (see O*NET online, http://online.onetcenter.org/help/links/), and the U. S. Department of Defense’s Armed Services Vocational Aptitude Battery (see http://www.asvabprogram.com/index.cfm?fuseaction=learn.workvalues), and other online work values systems (e.g., My Plan, see http://www.myplan.com/assess/samples/ v2.php). After identifying dimensions which were common to these work values measures, we selected 19 for inclusion in our eCF
® Work Values Inventory.
The eCF
® Work Values Inventory measures an individual's core work-related values, which represent
enduring psychological traits. From a measurement standpoint, we can examine the reliability and validity of the measures in the same way as for any other psychological trait. Rather than use a simplistic rank-order system for measuring work values like most work values scales, we use three items to measure the content of each work value. The eCF on-line, work values inventory presents 57 bipolar items and asks the respondent indicate on a nine-step scale which of 2 contrasting statements best describes his or her situation. For example, one bipolar item designed to assess the value Leadership presents the statements, " It is very important for me to have a leadership or management position in the organization I work for" and " It is not important for me to have a leadership or management position in the organization I work for." The respondent selects one of 10 buttons between the statements to indicate which of the two is more accurate. When completed, the inventory produces a score for each of the 19 values, based on a composite 3 items per value. The current version of the eCF
® Work Values Inventory work represents the third edition, with previous
revisions made on the basis of focus groups as well as empirical results from college students and working adults. A team of industrial-organizational psychologists generated the report content, which represent the best insights about organizational behavior based on decades of experience with employee selection and job placement, organizational development, career planning, and coaching. Results appear in the eCF
®
Personal Work Values Report, which displays 19 values in rank-order, emphasizing the top 5 values. The report allows a comparison with the population of others who have taken the Inventory, and offers detailed discussions of the individual's top 5 values. The discussions describe ideal work situations, point out possible value conflicts, raise critical questions for career development, and address other value-specific implications for individual career development.
eCareerFit Work Values Technical Manual v3.1 4
©2007 eCareerFit.com All Rights Reserved
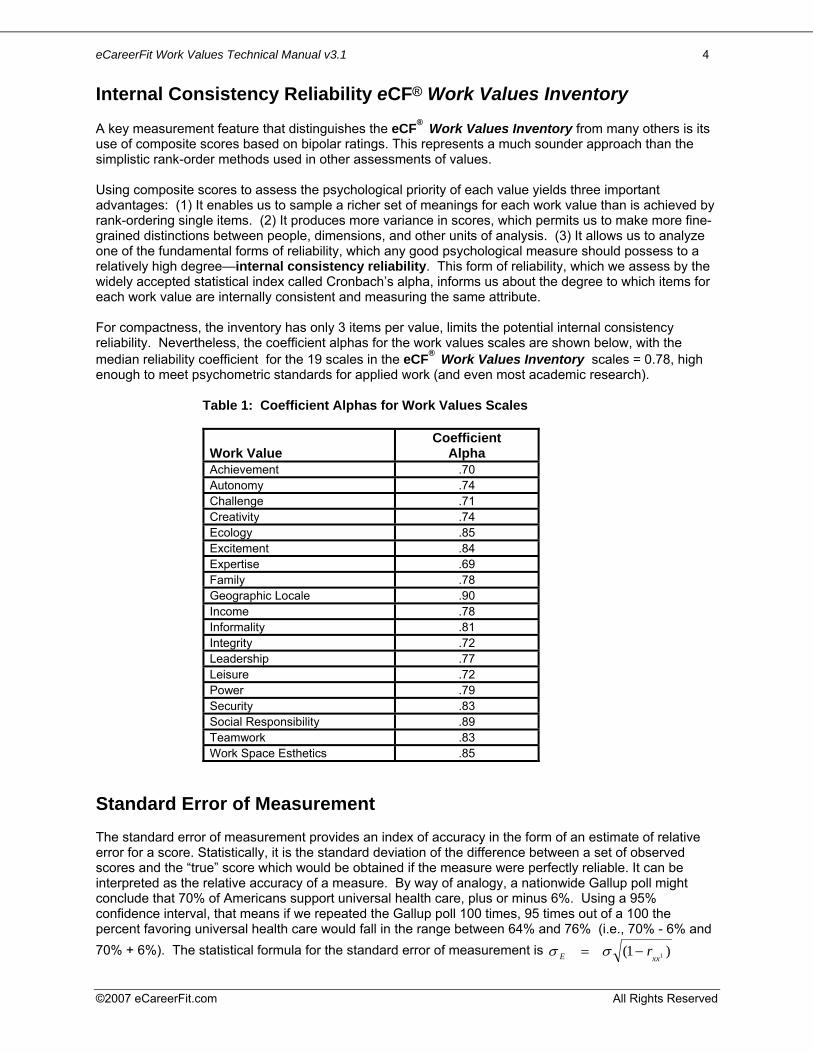
Internal Consistency Reliability eCF® Work Values Inventory A key measurement feature that distinguishes the eCF® Work Values Inventory from many others is its use of composite scores based on bipolar ratings. This represents a much sounder approach than the simplistic rank-order methods used in other assessments of values. Using composite scores to assess the psychological priority of each value yields three important advantages: (1) It enables us to sample a richer set of meanings for each work value than is achieved by rank-ordering single items. (2) It produces more variance in scores, which permits us to make more fine-grained distinctions between people, dimensions, and other units of analysis. (3) It allows us to analyze one of the fundamental forms of reliability, which any good psychological measure should possess to a relatively high degree—internal consistency reliability. This form of reliability, which we assess by the widely accepted statistical index called Cronbach’s alpha, informs us about the degree to which items for each work value are internally consistent and measuring the same attribute. For compactness, the inventory has only 3 items per value, limits the potential internal consistency reliability. Nevertheless, the coefficient alphas for the work values scales are shown below, with the median reliability coefficient for the 19 scales in the eCF®
Work Values Inventory scales = 0.78, high enough to meet psychometric standards for applied work (and even most academic research).
Table 1: Coefficient Alphas for Work Values Scales
Work Value
Coefficient Alpha
Achievement .70 Autonomy .74 Challenge .71 Creativity .74 Ecology .85 Excitement .84 Expertise .69 Family .78 Geographic Locale .90 Income .78 Informality .81 Integrity .72 Leadership .77 Leisure .72 Power .79 Security .83 Social Responsibility .89 Teamwork .83 Work Space Esthetics .85
Standard Error of Measurement The standard error of measurement provides an index of accuracy in the form of an estimate of relative error for a score. Statistically, it is the standard deviation of the difference between a set of observed scores and the “true” score which would be obtained if the measure were perfectly reliable. It can be interpreted as the relative accuracy of a measure. By way of analogy, a nationwide Gallup poll might conclude that 70% of Americans support universal health care, plus or minus 6%. Using a 95% confidence interval, that means if we repeated the Gallup poll 100 times, 95 times out of a 100 the percent favoring universal health care would fall in the range between 64% and 76% (i.e., 70% - 6% and 70% + 6%). The statistical formula for the standard error of measurement is )1( 1xxE r−= σσ

eCareerFit Work Values Technical Manual v3.1 5
©2007 eCareerFit.com All Rights Reserved
Where σE is the standard error of measurement, is the standard deviation of the measure (which we estimate as the median value of the 19 scales as 1.70 , and rxx1 is the reliability coefficient (which we estimate as the median value for the 19 scales as .78 ). For typical Work Values measures, we estimate the typical standard error of measurement for a person’s score as appearing in the main graphs to be = .374. If we wanted to use a 95% confidence interval, we can say that each person’s Work Value score will be approximately +/- .374 with a spread of .733, which gives us a fair amount of confidence about the accuracy of Work Values scores. For example, if a person scores 5.80 on the Integrity value, we can be 95% confident that their true score, controlling for errors of measurement, is 5.80+/-.37, or between 5.43 and 6.17; or, to put it another way, if a person took the scale 100 times without changing their values, 95 times his or her score would be in the 5.43 to 6.17 range, which is a fairly tight confidence range for this type of measure. Norms The initial set of norms for the Work Values dimensions is based on three populations: (1) Data collection by Research by Resource Associates using an earlier version of the inventory based on company participants in internal career planning programs. A total of over 500 participants were included in this sample representing a variety of jobs in different organizations units in the Northwestern, Southwestern, Midwestern, and Southern regions of the U.S. (2) Research involving approximately 200 college students participating in Career Services programs. (3) On going career assessment by eCF based on 679 individuals in a variety of organizations in the United States, Canada, and South America. Additional data will allow more specific comparisons by type of industry, geographic region, and demographic characteristics such as gender. For each company that uses the eCF®
Work Values assessment, we will be able to readily generate company-specific norms.
eCareerFit Work Values Technical Manual v3.1 6
©2007 eCareerFit.com All Rights Reserved
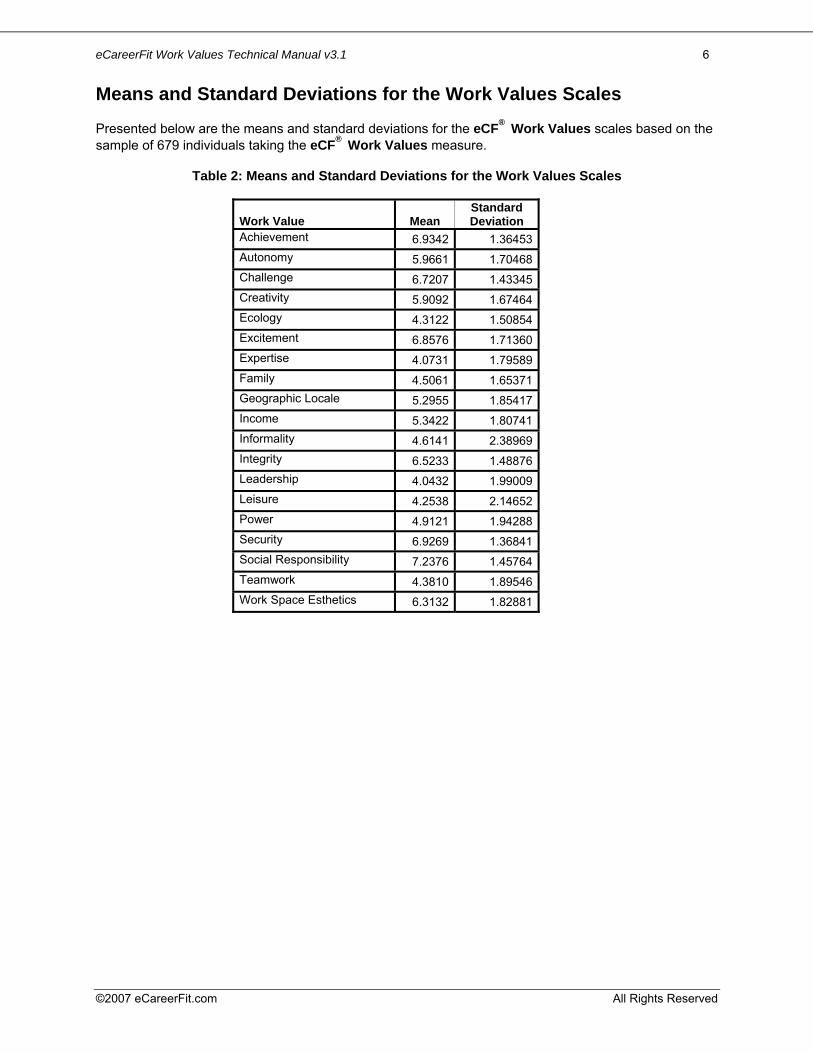
Means and Standard Deviations for the Work Values Scales Presented below are the means and standard deviations for the eCF®
Work Values scales based on the sample of 679 individuals taking the eCF®
Work Values measure.
Table 2: Means and Standard Deviations for the Work Values Scales
Work Value Mean Standard Deviation
Achievement 6.9342 1.36453Autonomy 5.9661 1.70468Challenge 6.7207 1.43345Creativity 5.9092 1.67464Ecology 4.3122 1.50854Excitement 6.8576 1.71360Expertise 4.0731 1.79589Family 4.5061 1.65371Geographic Locale 5.2955 1.85417Income 5.3422 1.80741Informality 4.6141 2.38969Integrity 6.5233 1.48876Leadership 4.0432 1.99009Leisure 4.2538 2.14652Power 4.9121 1.94288Security 6.9269 1.36841Social Responsibility 7.2376 1.45764Teamwork 4.3810 1.89546Work Space Esthetics 6.3132 1.82881
eCareerFit Work Values Technical Manual v3.1 7
©2007 eCareerFit.com All Rights Reserved
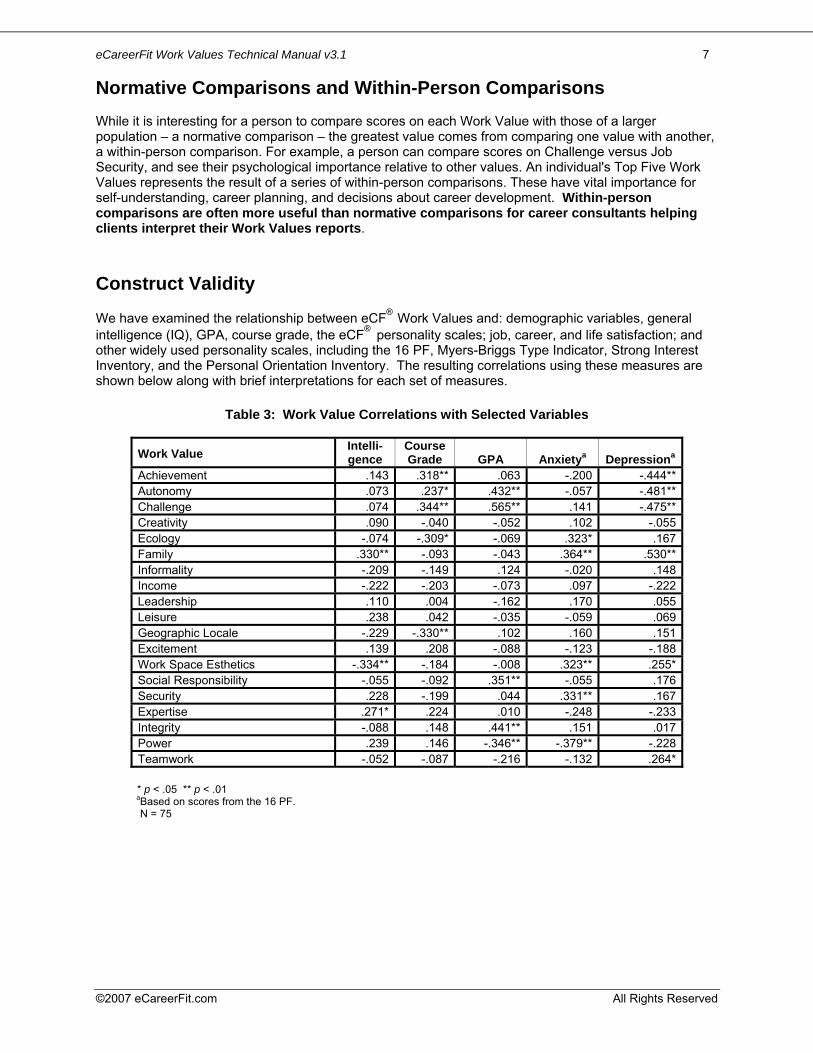
Normative Comparisons and Within-Person Comparisons While it is interesting for a person to compare scores on each Work Value with those of a larger population – a normative comparison – the greatest value comes from comparing one value with another, a within-person comparison. For example, a person can compare scores on Challenge versus Job Security, and see their psychological importance relative to other values. An individual's Top Five Work Values represents the result of a series of within-person comparisons. These have vital importance for self-understanding, career planning, and decisions about career development. Within-person comparisons are often more useful than normative comparisons for career consultants helping clients interpret their Work Values reports. Construct Validity We have examined the relationship between eCF®
Work Values and: demographic variables, general intelligence (IQ), GPA, course grade, the eCF®
personality scales; job, career, and life satisfaction; and other widely used personality scales, including the 16 PF, Myers-Briggs Type Indicator, Strong Interest Inventory, and the Personal Orientation Inventory. The resulting correlations using these measures are shown below along with brief interpretations for each set of measures.
Table 3: Work Value Correlations with Selected Variables
* p < .05 ** p < .01 aBased on scores from the 16 PF. N = 75
Work Value Intelli-gence
Course Grade GPA Anxietya Depressiona
Achievement .143 .318** .063 -.200 -.444**Autonomy .073 .237* .432** -.057 -.481**Challenge .074 .344** .565** .141 -.475**Creativity .090 -.040 -.052 .102 -.055Ecology -.074 -.309* -.069 .323* .167Family .330** -.093 -.043 .364** .530**Informality -.209 -.149 .124 -.020 .148Income -.222 -.203 -.073 .097 -.222Leadership .110 .004 -.162 .170 .055Leisure .238 .042 -.035 -.059 .069Geographic Locale -.229 -.330** .102 .160 .151Excitement .139 .208 -.088 -.123 -.188Work Space Esthetics -.334** -.184 -.008 .323** .255*Social Responsibility -.055 -.092 .351** -.055 .176Security .228 -.199 .044 .331** .167Expertise .271* .224 .010 -.248 -.233Integrity -.088 .148 .441** .151 .017Power .239 .146 -.346** -.379** -.228Teamwork -.052 -.087 -.216 -.132 .264*
eCareerFit Work Values Technical Manual v3.1 8
©2007 eCareerFit.com All Rights Reserved
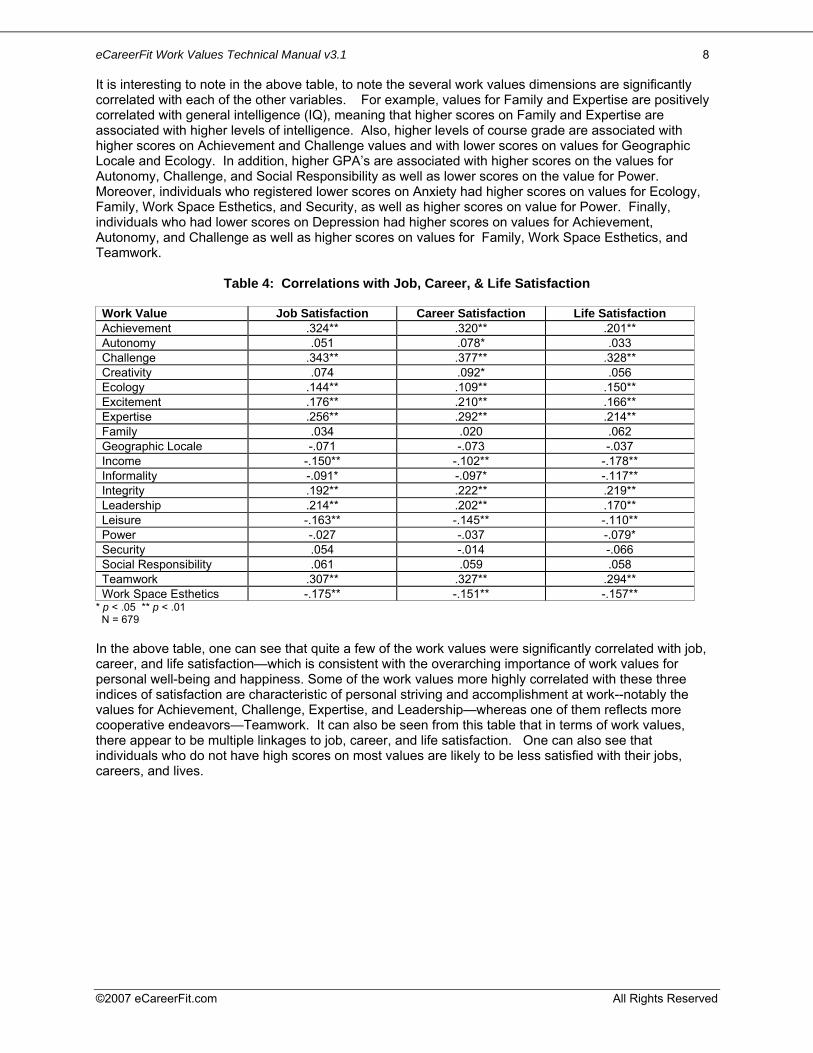
It is interesting to note in the above table, to note the several work values dimensions are significantly correlated with each of the other variables. For example, values for Family and Expertise are positively correlated with general intelligence (IQ), meaning that higher scores on Family and Expertise are associated with higher levels of intelligence. Also, higher levels of course grade are associated with higher scores on Achievement and Challenge values and with lower scores on values for Geographic Locale and Ecology. In addition, higher GPA’s are associated with higher scores on the values for Autonomy, Challenge, and Social Responsibility as well as lower scores on the value for Power. Moreover, individuals who registered lower scores on Anxiety had higher scores on values for Ecology, Family, Work Space Esthetics, and Security, as well as higher scores on value for Power. Finally, individuals who had lower scores on Depression had higher scores on values for Achievement, Autonomy, and Challenge as well as higher scores on values for Family, Work Space Esthetics, and Teamwork.
Table 4: Correlations with Job, Career, & Life Satisfaction
Work Value Job Satisfaction Career Satisfaction Life Satisfaction Achievement .324** .320** .201** Autonomy .051 .078* .033 Challenge .343** .377** .328** Creativity .074 .092* .056 Ecology .144** .109** .150** Excitement .176** .210** .166** Expertise .256** .292** .214** Family .034 .020 .062 Geographic Locale -.071 -.073 -.037 Income -.150** -.102** -.178** Informality -.091* -.097* -.117** Integrity .192** .222** .219** Leadership .214** .202** .170** Leisure -.163** -.145** -.110** Power -.027 -.037 -.079* Security .054 -.014 -.066 Social Responsibility .061 .059 .058 Teamwork .307** .327** .294** Work Space Esthetics -.175** -.151** -.157**
* p < .05 ** p < .01 N = 679 In the above table, one can see that quite a few of the work values were significantly correlated with job, career, and life satisfaction—which is consistent with the overarching importance of work values for personal well-being and happiness. Some of the work values more highly correlated with these three indices of satisfaction are characteristic of personal striving and accomplishment at work--notably the values for Achievement, Challenge, Expertise, and Leadership—whereas one of them reflects more cooperative endeavors—Teamwork. It can also be seen from this table that in terms of work values, there appear to be multiple linkages to job, career, and life satisfaction. One can also see that individuals who do not have high scores on most values are likely to be less satisfied with their jobs, careers, and lives.

eCareerFit Work Values Technical Manual v3.1 9
©2007 eCareerFit.com All Rights Reserved
Table 5: Correlations with PSI Personality Traits (Part 1)
Work Value
Conscien-tiousness
Emotional Stability Extraversion Openness Teamwork
Achievement .091* -.131** -.020 -.075 .022 Autonomy -.137** -.060 -.039 -.053 -.138** Challenge .047 -.123** -.015 .017 .023 Creativity -.062 -.226** -.003 -.029 -.037 Ecology .107** -.091* -.022 .041 .119** Family -.040 .052 .019 -.078* .047 Informality -.141** -.013 -.025 -.068 -.015 Income .031 -.017 -.024 .009 -.067 Leadership -.082* -.293** -.067 -.171** .065 Leisure -.095* .098* .013 -.055 -.025 Geographic Locale -.023 -.010 -.027 -.145** -.019 Excitement -.040 -.152** .030 -.025 .052 Work Space Esthetics -.044 -.009 .041 .010 .006 Social Responsibility -.007 -.097* .046 -.070 .008 Security .139** .087* .000 -.099** .056 Expertise .038 -.072 -.036 -.018 .002 Integrity .109** -.031 .007 .060 .115** Power -.166** -.239** -.085* -.171** -.138** Teamwork .098* -.093* .004 -.025 .388**
* p < .05 ** p < .01 N = 679

eCareerFit Work Values Technical Manual v3.1 10
©2007 eCareerFit.com All Rights Reserved
Table 6: Correlations with PSI Personality Traits (Part 2)
Work Value Visionary
Work Drive
Assertive-ness
Customer Service
Image Management Optimism
Tough-Mindedness
Achievement -.020 .123** -.147** -.217** -.121** .088* .142** Autonomy .097* .008 -.062 -.102** -.037 .057 -.028 Challenge .097* .079* -.158** -.185** -.200** .149** .149** Creativity .241** -.051 -.029 -.169** -.051 .001 -.059 Ecology .110** .030 -.048 -.053 -.156** -.052 .085* Family .034 -.094* -.081* .016 -.076* -.039 -.002 Informality .094* -.072 .015 -.022 .080* -.091* -.089* Income -.121** .056 .055 -.021 .285** -.047 -.106** Leadership .137** -.038 -.133** -.319** -.063 -.041 .046 Leisure .077* -.121** .052 .078* .091* -.083* -.088* Geographic Locale .018 -.002 -.044 -.043 .078* -.072 -.033 Excitement .123** .052 -.113** -.152** -.039 .034 .022 Work Space Esthetics .002 -.054 .090* .053 .219** -.096* -.123** Social Responsibility .159** -.063 -.090* -.021 -.055 -.054 -.173** Security -.096* .048 -.046 .054 -.052 -.201** .000 Expertise .007 .063 -.125** -.156** -.192** .042 .154** Integrity .055 .023 -.095* -.041 -.273** .054 .035 Power .087* -.059 -.032 -.270** .167** -.074 -.073 Teamwork .105** -.040 -.145** -.126** -.215** .087* .143**
* p < .05 ** p < .01 N = 679 The main observation to be made from the above two tables is that most of the correlations are of relatively low to modest magnitude. Thus, personality traits are relatively independent from work values, which makes sense given that they are conceptualized as measuring different attributes of individuals; viz, work values measure areas of major personal importance and personality traits measure stable characteristics or dispositions of individuals. The one possible exception to this trend is the .388 correlation between Teamwork as a value and Team as a personality trait, since they both pertain to functioning in a team context.

eCareerFit Work Values Technical Manual v3.1 11
©2007 eCareerFit.com All Rights Reserved
Table 7: Correlations with NEO Big Five Traits
Work Value NEO
Neuroticism NEO
Extroversion NEO
Openness NEO Agree-
ableness
NEO Conscien-tiousness
Achievement -.335** .166 .238* .299* .342**Autonomy -.363** .048 .275* .275* .251*Challenge -.304** -.001 .287* .033 .434**Creativity .098 .082 .162 -.224 -.218Ecology .246* .139 .141 .176 .064Family .438** .129 .095 .064 -.254*Informality .110 .113 -.081 -.274* -.461**Income .005 .073 .093 .213 .006Leadership .131 .165 .079 -.029 .040Leisure .020 -.177 -.035 -.012 -.174Geographic Locale .336** -.097 -.063 .028 .175Excitement -.260* .218 -.018 -.031 .178Work Space Esthetics .346** .087 .033 -.135 -.319**Social Responsibility .068 -.181 -.225 -.048 .111Security .080 .233* .237* -.032 .167Expertise -.249* .090 .062 .041 .162Integrity .017 .009 .024 .026 .134Power -.110 .030 -.006 .117 -.053Teamwork .266* .235* -.088 -.007 -.183
* p < .05 ** p < .01 N = 80 Although the above table is based on a relatively small sample size and the correlations would likely be of smaller magnitude with larger sample sizes, several interesting correlations can be observed. Neuroticism as measured by the NEO is moderately positively associated with values for Family (which may reflect the stress of families), Geographic Locale, and Work Place Esthetics and moderately negatively related to values for Achievement, Autonomy, and Challenge. Also, Conscientiousness as measured by the NEO is moderately positively related to Achievement, Autonomy, and Challenge while moderately negatively related to work values for Informality and Work Space Esthetics.

eCareerFit Work Values Technical Manual v3.1 12
©2007 eCareerFit.com All Rights Reserved
Table 8: Correlations with 16 PF Dimensions (Part 1)
Work Value A B C E F G H I Achievement -.083 .087 .342** .376** .087 -.034 .410** -.345** Autonomy .038 .200 .368** .369** -.052 .066 .133 -.327** Challenge -.079 .054 .437** .400** -.113 -.073 .275* -.171 Creativity -.018 -.116 .032 .389** .256* -.283* .399** -.137 Ecology -.028 -.119 -.184 -.050 .210 -.053 .082 .067 Family .163 -.038 -.241* .023 .070 .267* .013 -.181 Informality .386** -.307** -.209 -.113 .210 -.014 .080 -.203 Income .176 -.083 .008 -.061 .081 -.038 .048 -.023 Leadership .118 -.131 .202 .355** .415** -.050 .634** -.116 Leisure .109 -.033 -.183 .135 .290* -.177 .031 .071 Geographic Locale -.096 -.228 -.100 .079 -.211 .153 -.116 -.253 Excitement -.074 -.067 .366** .170 .225 -.096 .511** -.056 Work Space Esthetics .009 -.155 -.162 -.102 .189 .307** -.123 .177 Social Responsibility .110 -.234* .140 -.100 -.001 .037 -.043 -.171 Security -.081 -.284* .225 -.031 .076 .045 .212 -.110 Expertise -.278* .017 .316** .440** .077 .001 .403** -.158 Integrity -.033 -.002 -.126 .085 -.299* .283* -.235* .088 Power -.034 .085 .144 .174 .150 -.053 .469** -.198 Teamwork .264* -.233* -.183 .168 .484** .281* .416** -.056
* p < .05 ** p < .01 N = 80 16 PF Key: A = Outgoingness C = Emotional Stability E = Dominance F = Liveliness G = Rules /Consciousness H = Social Boldness I = Tender-Mindedness L = Vigilance M = Abstractness N = Privateness O = Apprehensiveness Q1 = Openness Q2 = Self-Reliance Q3 = Precision Q4 = Tension IM = Impression Management
eCareerFit Work Values Technical Manual v3.1 13
©2007 eCareerFit.com All Rights Reserved
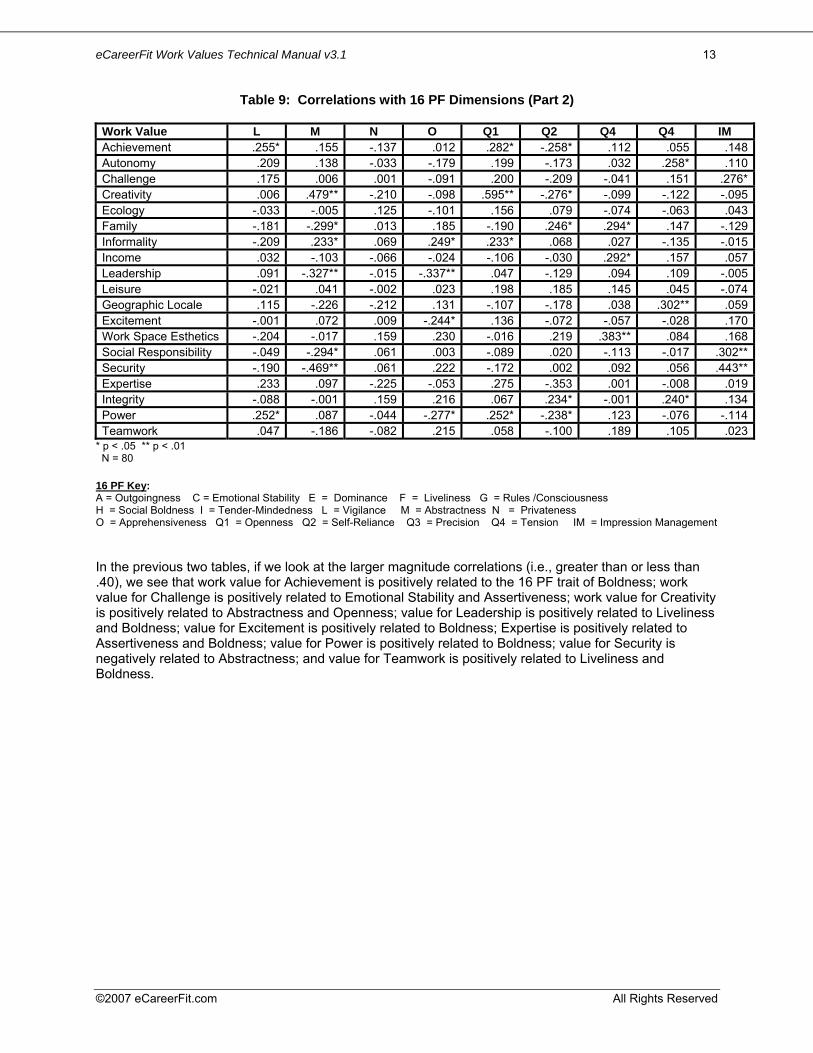
Table 9: Correlations with 16 PF Dimensions (Part 2) Work Value L M N O Q1 Q2 Q4 Q4 IM Achievement .255* .155 -.137 .012 .282* -.258* .112 .055 .148Autonomy .209 .138 -.033 -.179 .199 -.173 .032 .258* .110Challenge .175 .006 .001 -.091 .200 -.209 -.041 .151 .276*Creativity .006 .479** -.210 -.098 .595** -.276* -.099 -.122 -.095Ecology -.033 -.005 .125 -.101 .156 .079 -.074 -.063 .043Family -.181 -.299* .013 .185 -.190 .246* .294* .147 -.129Informality -.209 .233* .069 .249* .233* .068 .027 -.135 -.015Income .032 -.103 -.066 -.024 -.106 -.030 .292* .157 .057Leadership .091 -.327** -.015 -.337** .047 -.129 .094 .109 -.005Leisure -.021 .041 -.002 .023 .198 .185 .145 .045 -.074Geographic Locale .115 -.226 -.212 .131 -.107 -.178 .038 .302** .059Excitement -.001 .072 .009 -.244* .136 -.072 -.057 -.028 .170Work Space Esthetics -.204 -.017 .159 .230 -.016 .219 .383** .084 .168Social Responsibility -.049 -.294* .061 .003 -.089 .020 -.113 -.017 .302**Security -.190 -.469** .061 .222 -.172 .002 .092 .056 .443**Expertise .233 .097 -.225 -.053 .275 -.353 .001 -.008 .019Integrity -.088 -.001 .159 .216 .067 .234* -.001 .240* .134Power .252* .087 -.044 -.277* .252* -.238* .123 -.076 -.114Teamwork .047 -.186 -.082 .215 .058 -.100 .189 .105 .023
* p < .05 ** p < .01 N = 80 16 PF Key: A = Outgoingness C = Emotional Stability E = Dominance F = Liveliness G = Rules /Consciousness H = Social Boldness I = Tender-Mindedness L = Vigilance M = Abstractness N = Privateness O = Apprehensiveness Q1 = Openness Q2 = Self-Reliance Q3 = Precision Q4 = Tension IM = Impression Management In the previous two tables, if we look at the larger magnitude correlations (i.e., greater than or less than .40), we see that work value for Achievement is positively related to the 16 PF trait of Boldness; work value for Challenge is positively related to Emotional Stability and Assertiveness; work value for Creativity is positively related to Abstractness and Openness; value for Leadership is positively related to Liveliness and Boldness; value for Excitement is positively related to Boldness; Expertise is positively related to Assertiveness and Boldness; value for Power is positively related to Boldness; value for Security is negatively related to Abstractness; and value for Teamwork is positively related to Liveliness and Boldness.
eCareerFit Work Values Technical Manual v3.1 14
©2007 eCareerFit.com All Rights Reserved
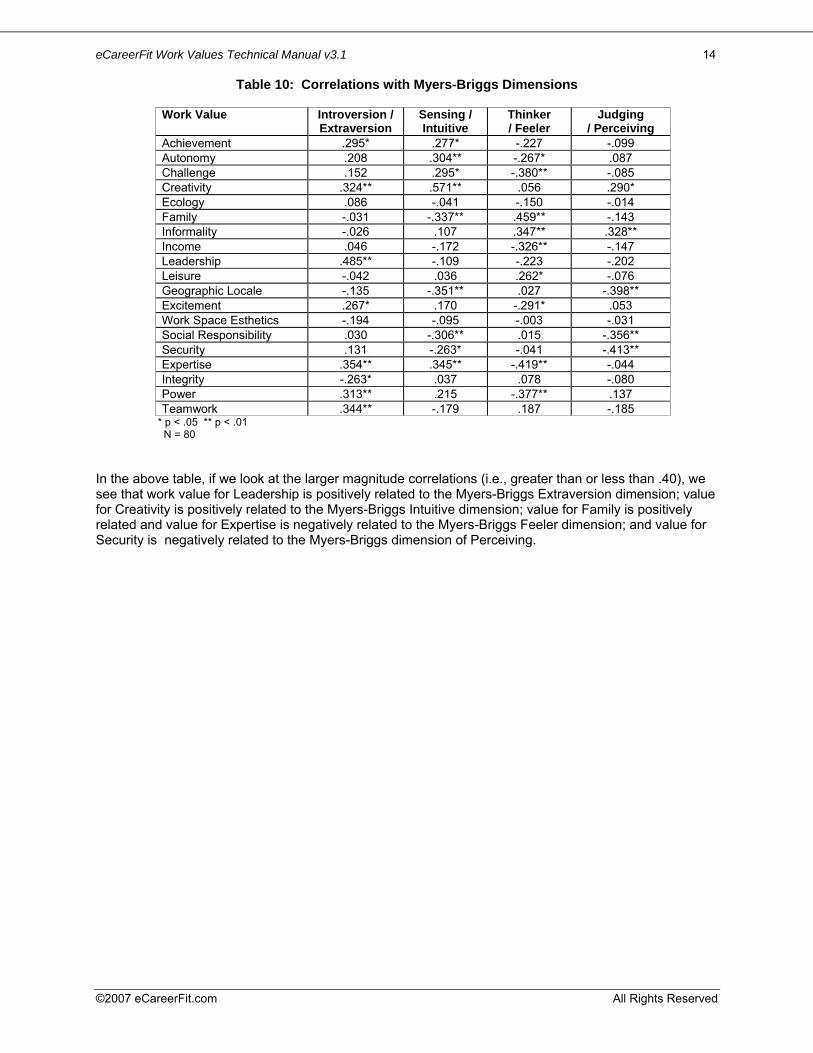
Table 10: Correlations with Myers-Briggs Dimensions
Work Value Introversion /
Extraversion Sensing / Intuitive
Thinker / Feeler
Judging / Perceiving
Achievement .295* .277* -.227 -.099 Autonomy .208 .304** -.267* .087 Challenge .152 .295* -.380** -.085 Creativity .324** .571** .056 .290* Ecology .086 -.041 -.150 -.014 Family -.031 -.337** .459** -.143 Informality -.026 .107 .347** .328** Income .046 -.172 -.326** -.147 Leadership .485** -.109 -.223 -.202 Leisure -.042 .036 .262* -.076 Geographic Locale -.135 -.351** .027 -.398** Excitement .267* .170 -.291* .053 Work Space Esthetics -.194 -.095 -.003 -.031 Social Responsibility .030 -.306** .015 -.356** Security .131 -.263* -.041 -.413** Expertise .354** .345** -.419** -.044 Integrity -.263* .037 .078 -.080 Power .313** .215 -.377** .137 Teamwork .344** -.179 .187 -.185
* p < .05 ** p < .01 N = 80 In the above table, if we look at the larger magnitude correlations (i.e., greater than or less than .40), we see that work value for Leadership is positively related to the Myers-Briggs Extraversion dimension; value for Creativity is positively related to the Myers-Briggs Intuitive dimension; value for Family is positively related and value for Expertise is negatively related to the Myers-Briggs Feeler dimension; and value for Security is negatively related to the Myers-Briggs dimension of Perceiving.

eCareerFit Work Values Technical Manual v3.1 15
©2007 eCareerFit.com All Rights Reserved
Table 11: Correlations with Personal Orientation Inventory (POI) Dimensions (Part 1)
Work Value Time
Competent Other
Directed Inner
DirectedSelf-
Actualizing Value
Existent-iality
Feeling Reactivity
Spontan-eity
Achievement .099 -.163 .151 .165 -.180 .025 .139 Autonomy .295* -.388** .382** .461** .026 .331** .246* Challenge .124 -.187 .184 .171 -.091 .122 .032 Creativity -.029 -.274* .262* .003 -.074 .111 .420** Ecology -.225 .246 -.253* -.224 -.189 -.033 -.025 Family -.162 -.018 .012 -.212 .054 -.003 .122 Informality .033 .002 .012 -.462** .181 -.081 .208 Income .012 .235 -.224 -.064 -.284* -.269* -.214 Leadership -.117 .110 -.119 .102 -.241 -.123 .163 Leisure -.123 -.319** .314** .156 .164 .216 .413** Geographic Locale -.378** -.100 .101 -.194 -.029 .246* -.249* Excitement .080 .151 -.148 .023 -.298* -.243 .159 Work Space Esthetics -.164 -.040 .039 -.122 .170 -.126 .176 Social Responsibility -.233 .395** -.394** -.300* -.141 -.134 -.259* Security -.189 .441** -.452** -.195 -.391** -.299* -.332** Expertise .059 -.135 .126 .170 .004 -.147 .142 Integrity -.149 -.227 .223 -.099 .171 .247* .065 Power .202 -.079 .083 .091 -.023 -.142 .251* Teamwork -.411** .295* -.306* -.321** -.210 -.251* .029
* p < .05 ** p < .01 N = 64

eCareerFit Work Values Technical Manual v3.1 16
©2007 eCareerFit.com All Rights Reserved
Table 12: Correlations with Personal Orientation Inventory (POI) Dimensions (Part 2)
Work Value Self-
Regard Self-
Acceptance
The Nature of
Man Synergy
Acceptance of
Aggression
Capacity for
Intimate Contact
Achievement .307* -.129 .296* .099 .274* .053Autonomy .350** .058 .184 .216 .372** .259*Challenge .213 -.065 .153 -.002 .237 .125Creativity .264* .204 -.055 -.304* .314* .236Ecology .018 -.097 -.360** -.362** .096 -.169Family -.141 .068 .014 -.109 -.101 .014Informality -.144 .411** -.159 -.146 -.216 -.007Income .295* -.168 -.057 -.359** .068 -.184Leadership .365** -.155 .016 -.128 .245 -.063Leisure -.007 .185 .107 .136 .094 .229Geographic Locale -.127 -.025 -.060 -.240 .166 .063Excitement .390** -.124 .023 -.017 .210 -.314*Work Space Esthetics .065 .221 -.325** -.066 -.035 .013Social Responsibility -.278* -.327** -.153 .131 -.376** -.396**Security -.023 -.288* -.091 -.308* -.259* -.470**Expertise .332** -.086 .194 -.046 .229 -.015Integrity -.117 .138 .020 .073 .003 .172Power .497** .086 .107 -.188 .292* .042Teamwork -.044 -.248* .063 -.015 -.064 -.238
* p < .05 ** p < .01 N = 64 Explanation of POI Dimensions: • The Time Competent measure indicates that one tends to live more fully in the present, and that a person is able to link the
past and future to the present in meaningful continuity. Goals and aspirations are tied meaningfully to present working goals. • The Inner Directed scale measures the degree to which a person is guided by internalized piloting (vs. external forces). The
source of inner direction seems to be implanted early in life, and the direction is guided by a small number of principles. • The Self-Actualizing Value was derived from Maslow’s concept of self-actualizing people (i.e., whether an individual holds and
lives by values characterized as self-actualizing). • The Existentiality scale measures one’s flexibility in applying existential values or principles to one’s life. This can range from
flexibility in application of values to a tendency to more rigidly hold certain values. • The Feeling Reactivity dimension measures sensitivity to one’s own needs and feelings. • Spontaneity measures the ability to express feelings in spontaneous action. This may range from free expression to being
fearful of expressing feelings behaviorally. • The Self-Regard measure indicates the ability to like oneself because of one’s strength as a person. • Self-Acceptance measures acceptance of oneself in spite of one’s weaknesses or deficiencies. It is more difficult to achieve
self-acceptance than self-regard; self-actualizing requires both. • The Nature of Man scale measures the extent to which one sees humankind as essentially good. At one end, a person can
resolve the goodness-evil, selfishness-unselfishness and spirituality-sensuality dichotomies in human nature, while at the other end, one sees humankind as essentially evil, bad, and not synergistic.
• Synergy measures the ability to see opposites of life as meaningfully related. When one is synergistic, one sees that work and play are not different, that selfishness and unselfishness and other dichotomies are not really opposites at all.
• The Acceptance of Aggression scale measures the ability to accept anger or aggression within oneself as natural. • Capacity for Intimate Contact measures the person’s ability to develop meaningful relationships with others.

eCareerFit Work Values Technical Manual v3.1 17
©2007 eCareerFit.com All Rights Reserved
With regard to the above two tables, we note here that three of the work value were significantly related at the p < .01 level to the most widely known POI dimension of Self-Actualization—with value for Autonomy being positively related to it and the values for Informality and Teamwork being negatively related to Self-Actualization.
Table 13: Correlations with Strong Interest Inventory Dimensions
Realistic
Investi-gative Artistic Social
Enterpri-sing
Conven-tional
Achievement .028 .241* .040 -.041 .199 .113Autonomy -.101 .209 -.035 -.072 .066 .076Challenge -.129 .227* .188 .029 .156 .154Creativity .229* .116 .443** -.294* .145 -.213Ecology .094 .205 .241* -.087 -.292* -.067Family .166 -.105 .129 .138 -.087 -.171Informality .032 -.308** .208 -.049 .006 -.419**Income -.166 -.203 -.100 -.323** .212 .103Leadership -.056 .113 .156 .036 .232* .067Leisure .099 -.054 .078 -.253* -.186 -.411**Geographic Locale -.321** -.256* -.173 .118 .014 .067Excitement .118 .202 .069 -.083 .236 .086Work Space Esthetics .052 -.363** .098 -.005 .081 -.071Social Responsibility -.134 .044 -.359** .467** -.189 -.058Security .046 -.070 .058 .115 -.036 .030Expertise .134 .163 .075 -.170 .169 .057Integrity -.141 -.052 .295* .117 -.127 .064Power -.042 .112 .032 -.283* .319** -.016Teamwork -.141 -.236 .094 .067 .137 -.194
* p < .05 ** p < .01 N = 80 In the above table, if we look at the larger magnitude correlations (i.e., greater than or less than .40), we see that work value for Creativity is positively related to Artistic vocational interests; Social Responsibility is positively related to Social vocational interests; and both values for Leisure and Informality are negatively related to Conventional vocational interests.

eCareerFit Work Values Technical Manual v3.1 18
©2007 eCareerFit.com All Rights Reserved
Differences between Occupations and Industrial Sectors The eCF®
work values measures can be used on an aggregate basis to compare larger groupings of individuals, such as companies/organizations, work groups, occupational fields, industrial sectors, and even countries. On the pages below we display graphs comparing selected occupations and industrial sectors on various eCF®
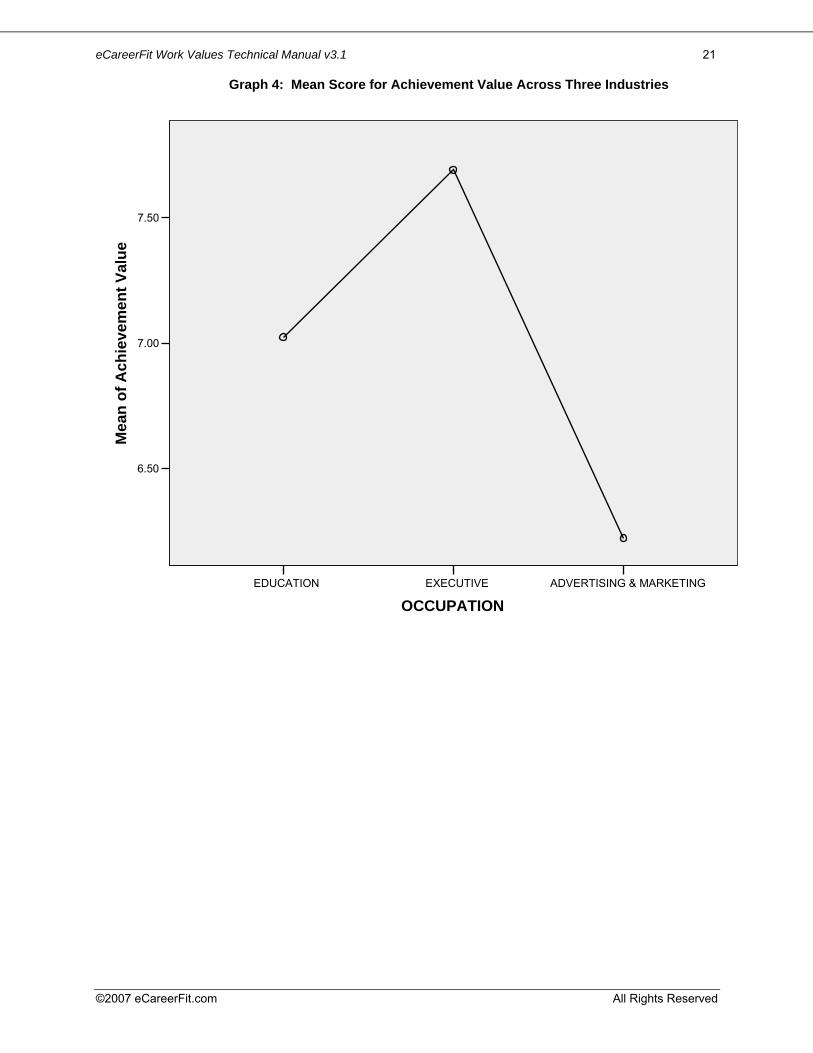
work values. In most cases, the differences are in the logically expected direction based on common sense. For example, with respect to sector, scores on value for Achievement were higher for individuals who reported working in Science than Education, with individuals working in Communications reporting lower Achievement scores than the other two groups. Or, with respect to occupation, executives reported higher values for Leadership than individuals working in health care or customer service occupations.
Graph 1: Mean Score for Income Across Four Industries
TECHNOLOGYSERVICES
SCIENCEPROFESSIONAL &BUSINESS SERVICES
EDUCATIONALSERVICES
INDUSTRY
5.60
5.40
5.20
5.00
4.80
4.60
4.40
4.20
Mea
n of
Inco
me
Valu
e

eCareerFit Work Values Technical Manual v3.1 19
©2007 eCareerFit.com All Rights Reserved
Graph 2: Mean Score for Achievement Value Across Three Industries
SCIENCEEDUCATIONAL SERVICESCOMMUNICATIONS
INDUSTRY
7.40
7.20
7.00
6.80
6.60
Mea
n of
Ach
ieve
men
t Val
ue

eCareerFit Work Values Technical Manual v3.1 20
©2007 eCareerFit.com All Rights Reserved
Graph 3: Mean Score for Social Responsibility Value Across Four Industries
TECHNOLOGYSERVICES
PROFESSIONAL &BUSINESS SERVICES
HEALTHCAREEDUCATIONALSERVICES
INDUSTRY
6.00
5.50
5.00
4.50
4.00
3.50
3.00
Mea
n of
Val
ue fo
r Soc
ial R
espo
nsib
ility
eCareerFit Work Values Technical Manual v3.1 21
©2007 eCareerFit.com All Rights Reserved
Graph 4: Mean Score for Achievement Value Across Three Industries
ADVERTISING & MARKETINGEXECUTIVEEDUCATION
OCCUPATION
7.50
7.00
6.50
Mea
n of
Ach
ieve
men
t Val
ue
eCareerFit Work Values Technical Manual v3.1 22
©2007 eCareerFit.com All Rights Reserved
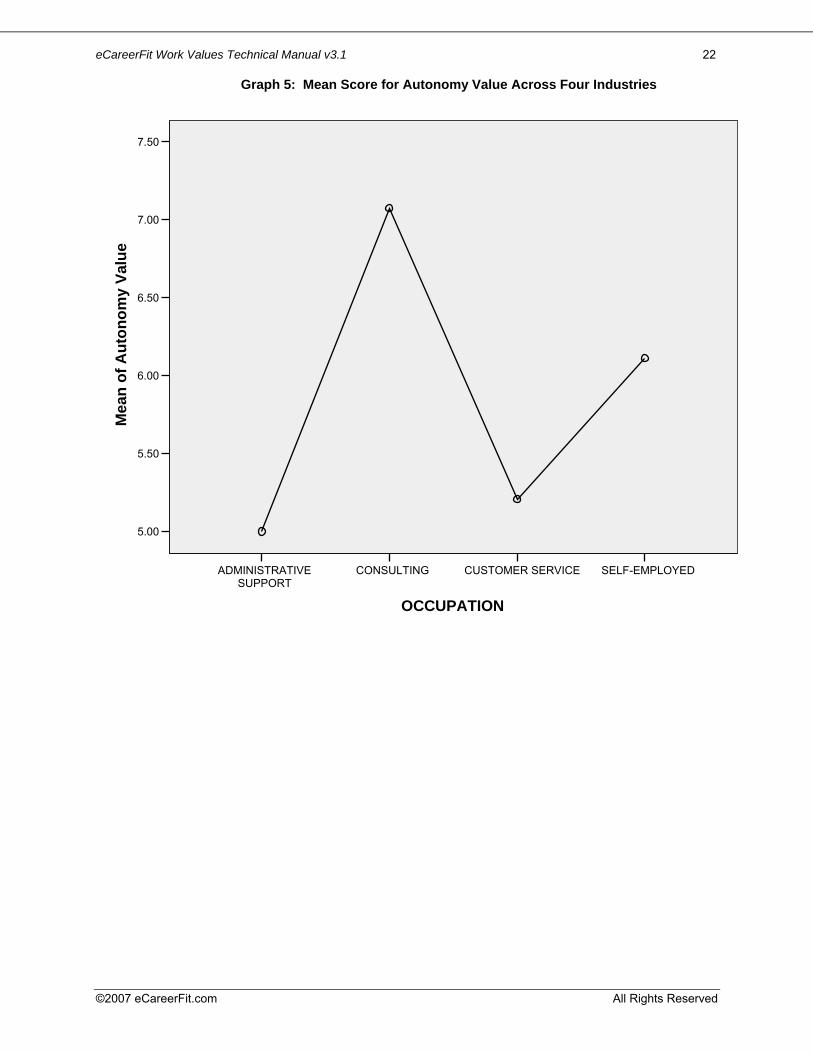
Graph 5: Mean Score for Autonomy Value Across Four Industries
SELF-EMPLOYEDCUSTOMER SERVICECONSULTINGADMINISTRATIVESUPPORT
OCCUPATION
7.50
7.00
6.50
6.00
5.50
5.00
Mea
n of
Aut
onom
y Va
lue

eCareerFit Work Values Technical Manual v3.1 23
©2007 eCareerFit.com All Rights Reserved
Graph 6: Mean Score for Creativity Value Across Four Industries
LAW/ATTORNEYEDUCATIONART/DESIGN
OCCUPATION
7.00
6.50
6.00
5.50
5.00
4.50
4.00
Mea
n of
Cre
ativ
ity V
alue

eCareerFit Work Values Technical Manual v3.1 24
©2007 eCareerFit.com All Rights Reserved
Graph 7: Mean Score for Integrity Value Across Four Industries
LAW/ATTORNEYHEALTH CAREARTSACCOUNTING &FINANCE
OCCUPATION
8.00
7.00
6.00
5.00
Mea
n in
tegr
ity V
alue

eCareerFit Work Values Technical Manual v3.1 25
©2007 eCareerFit.com All Rights Reserved
Graph 8: Mean Score for Leadership Value Across Four Industries
HEALTH CAREEXECUTIVECUSTOMER SERVICE
OCCUPATION
6.50
6.00
5.50
5.00
4.50
4.00
Mea
n of
Lea
ders
hip
Valu
e

eCareerFit Work Values Technical Manual v3.1 26
©2007 eCareerFit.com All Rights Reserved
Graph 9: Mean Score for Power Value Across Three Industries
CLERICALEXECUTIVEEDUCATION
OCCUPATION
6.00
5.50
5.00
4.50
4.00
3.50
Mea
n of
Pow
er V
alue

eCareerFit Work Values Technical Manual v3.1 27
©2007 eCareerFit.com All Rights Reserved
Graph 10: Mean Score for Teamwork Value Across Four Industries
LAW-ATTORNEYHUMAN RESOURCESHEALTH CARECUSTOMER SERVICE
OCCUPATION
7.00
6.00
5.00
4.00
3.00
Mea
n of
Tea
mw
ork
Valu
e
eCareerFit Work Values Technical Manual v3.1 28
©2007 eCareerFit.com All Rights Reserved
References
Lounsbury, J. W., Loveland, J. M., Sundstrom, E., Gibson, L. W., Drost, A. W., & Hamrick, F.
(2003). An investigation of personality traits in relation to career satisfaction.
Journal of Career Assessment, 11(3), 287-307.
Myplan.com (2007). Values assessment. http://www.myplan.com/assess/samples/v2.php
O*NET online (2007). http://online.onetcenter.org/help/links/. Super, D. E. & Sverko, B. (Eds.) (1995). Life roles, values, and careers. San Francisco: Jossey
-Bass. United Kingdom (2007). Directgov.
http://www.mcga.gov.uk/c4mca/mcga-careers_with_the_mca/hr-careers-with-mca/hr-career-
navigation-guide/hr-defining-career-goals/hr-work-values.htm
U. S. Department of Defense. ASVAB. (2007). Learn about yourself.
http://www.asvabprogram.com/index.cfm?fuseaction=learn.workvalues.